Submillimeter Array Observations of the RX J1633.9-2442 Transition Disk: evidence for multiple planets in the making
Abstract
We present continuum high resolution Submillimeter Array (SMA) observations of the transition disk object RX J1633.9-2442, which is located in the Ophiuchus molecular cloud and has recently been identified as a likely site of ongoing giant planet formation. The observations were taken at 340 GHz (880 m) with the SMA in its most extended configuration, resulting in an angular resolution of 0.3′′ (35 AU at the distance of the target). We find that the disk is highly inclined (i 50 deg) and has an inner cavity 25 AU in radius, which is clearly resolved by our observations. We simultaneously model the entire optical to millimeter wavelength spectral energy distribution (SED) and SMA visibilities of RX J1633.9-2442 in order to constrain the structure of its disk. We find that an empty cavity 25 AU in radius is inconsistent with the excess emission observed at 12, 22, and 24 m. Instead, the mid-IR excess can be modeled by either a narrow, optically thick ring at 10 AU or an optically thin region extending from 7 AU to 25 AU. The inner disk (r 5 AU) is mostly depleted of small dust grains as attested by the lack of detectable near-IR excess. We also present deep Keck aperture masking observations in the near-IR, which rule out the presence of a companion up to 500 times fainter than the primary star (in -band) for projected separations in the 5-20 AU range. We argue that the complex structure of the RX J1633.9-2442 disk is best explained by multiple planets embedded within the disk. We also suggest that the properties and incidence of objects such as RX J1633.9-2442, T Cha, and LkCa 15 (and those of the companions recently identified to these two latter objects) are most consistent with the runaway gas accretion phase of the core accretion model, when giant planets gain their envelopes and suddenly become massive enough to open wide gaps in the disk.
Subject headings:
circumstellar matter — protoplanetary disks — submillimeter: planetary systems — stars: individual (RX J1633.9-2442)1. Introduction
Observations of nearby star-forming regions show that the vast majority of pre-main-sequence (PMS) stars are either accreting Classical T Tauri Stars (CTTSs) with optically thick inner disks extending inward to the dust sublimation radius and showing a narrow range of infrared (IR) colors or, more evolved, non-accreting weak-line T Tauri Stars (WTTSs) with bare stellar photospheres. The few “transition objects” that are caught between the typical CTTSs and WTTSs stages present very diverse IR SEDs associated with a wide range of disk structures, but they usually have little or no excess at near-IR wavelength and much larger excesses at longer wavelengths (see Williams & Cieza, 2011 for a recent review). Ever since they were discovered by the Infrared Astronomical Satellite (Strom et al. 1989; Wolk & Walter 1996), the deficit of near-infrared excess in transition disks has been interpreted as a diagnostic of inner disk clearing, possibly connected to planet formation. However, in addition to planet formation, at least three other disk evolution processes can produce the inner opacity holes that are characteristic of transition objects: grain growth, photoevaporation, and dynamical interactions with (sub)stellar companions. The four different mechanisms potentially responsible for the holes in transition disks might become distinguishable when, in addition to SEDs, disk masses, accretion rates and multiplicity information are available (Najita et al. 2007). In our recent multi-wavelength study of Ophiuchus transition disks (Cieza et al. 2010, hereafter Paper I), we have estimated disk masses (from submillimeter photometry), accretion rates (from optical echelle spectroscopy), and multiplicity information (from near-IR Adaptive Optics imaging) of 26 transition objects in order to shed some light on the origin of their inner opacity holes. Of these 26 transition disks, 4 were classified as “planet-forming disks candidates” based on their SED morphologies, multiplicity, accretion rates, and disk mass measurements (objects # 11, 21, 31, and 32 in the study). These 4 objects have SEDs consistent with sharp, dynamically induced inner holes (as opposed to the smooth decrease in opacity expected from grain growth), yet our Adaptive Optics imaging showed that they lack stellar companions beyond 10 AU. Also, their large disks masses and/or high accretion rates disfavor photoevaporation as the disk clearing mechanism. Overall, the properties of these objects are those expected for protoplanetary disks with embedded giant planets. The recent discoveries of what appear to be forming planets embedded within the disks of the transition objects T Cha (Huelamo et al. 2011) and LkCa 15 (Kraus & Ireland, 2012) give credence to this interpretation and encourages detailed studies of similar objects.
While SED modeling can be a powerful tool to estimate the physical properties of circumstellar disks, it has severe limitations. It is a well known problem that different combination of parameters can reproduce the photometry data equally well, even when very well sampled SEDs are available (e.g., see Cieza et al. 2011 for the T Cha case). Fortunately, resolved (sub)millimeter images can break many of the degeneracies between model parameters and help constrain disk properties much better than it is possible with the SED alone (Andrews et al. 2009; Brown et al. 2009; Isella et al. 2010).
RX J1633.9-2442 is the most massive of the 4 “planet forming disk” candidates identified in Paper I. Its SED was recently modeled by Orellana et al. (2012) as a 17 MJUP disk with a 7.9 AU radius cavity. Here we present high resolution (0.3′′ 35 AU) SMA continuum observations at 340 GHz (880 m) of RX J1633.9-2442 and use the MCFOST radiative transfer code (Pinte et al. 2006) to simultaneously model the entire optical to millimeter wavelength SED and SMA visibilities in order to constrain the structure of its disk. In §2, we present our SMA data and the photometry from the literature that we use to construct to the full SED, as well as the Keck aperture masking data we have obtained to search for low-mass companions and the Magellan optical spectroscopy data we use to better measure the spectral type of the central star. Our disk model and the degree to which each of the disk parameters can be constrained are discussed in §3. In §4, we analyze our results in the broader context of disk evolution and planet formation models. A summary of our main conclusions is presented in §5.
2. Observations
2.1. SMA observations and data reduction
Submillimeter interferometric observations of our target were conducted in service mode with the SMA (Ho et al. 2004), on Mauna Kea, Hawaii, on February 9th and February 22nd, 2010. The receivers were tuned to a local oscillator frequency of 340 Ghz (880 m). Both the upper and lower sideband data were used, providing a total bandwidth of 4 GHz. The observations were obtained with seven of the eight 6-meter antennas in the “‘very extended configuration”, resulting on 21 baselines from 120 to 510 meter in length and an elongated synthesized beam, 0.26′′0.31′′ in size (i.e., 31 AU 37 AU). The zenith opacities during both nights were 0.07. For each target, the observations cycled rapidly between the target and two gain calibrators, 1625-254 and 1626-298, located at 2.0 and 5.3 degrees from RX J1633.9-2442, respectively. In order to ensure the appropriate calibration of short-timescale phase variations, we adopted integration times of 5 minutes on target and 3 minutes on each calibrator. In each of the two nights, our target was observed between hour angles of 3.2 and 3.4, amounting to a combined integration time of 7.5 hs.
The raw visibility data were calibrated with the MIR reduction package111available at http://cfa-www.harvard.edu/cqi/mircook.html. The passband was flattened using 60 to 90 min scans of the bright quasar 0854+201 and the solutions for the antenna-based complex gains were obtained using the primary calibrator 1625-254. These gains, applied to our secondary calibrator, 1626-298, served as a consistency check for the solutions. The absolute flux scale was determined through observations of Vesta and is estimated to be accurate to 15.
2.1.1 Image plane
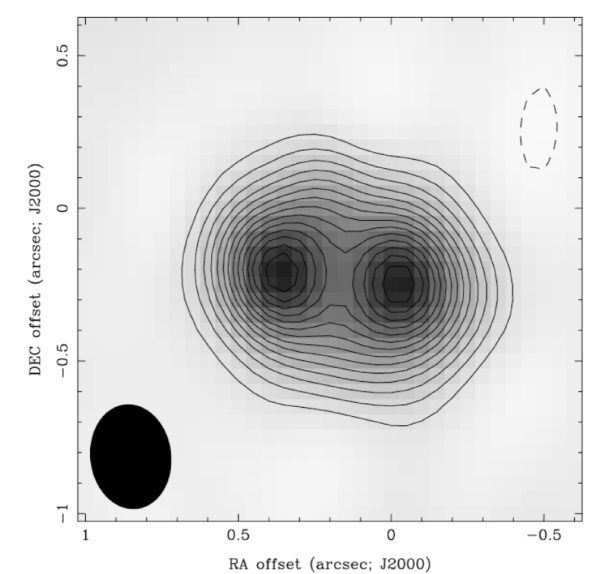
The visibilities were Fourier transformed, deconvolved with the algorithm, and restored with the synthesized beam using the standard software package (Sault et al. 1995). Each track was first processed independently to check for consistency, but both were later combined to increase the signal to noise of the final image. The final image is shown in Figure 1 and has a rms noise of 1.1 mJy/beam. An inspection of the image gives a first-order approximation to some disk properties. First, the image shows two clear peaks, implying that the inner hole has been resolved in one direction (East-West), but not in the other. Also, the aspect ratio of the image suggests the disk is highly inclined (i.e., 45 deg from face-on). Fortunately, the major axes of the disk and the synthesized beam are almost perpendicular to each other, maximizing the spatial resolution along the disk. The disk is 1′′ (120 AU) across, and the diameter of the inner hole seems to be slightly larger than the 0.3′′ (40 AU) beam. The disk diameter should be considered a lower limit as the SMA observations are insensitive to the low optical depths of the outermost parts of the disk (see § 3). Finally, it is clear that the disk is not located at the exact center of the field.
2.1.2 uv-plane
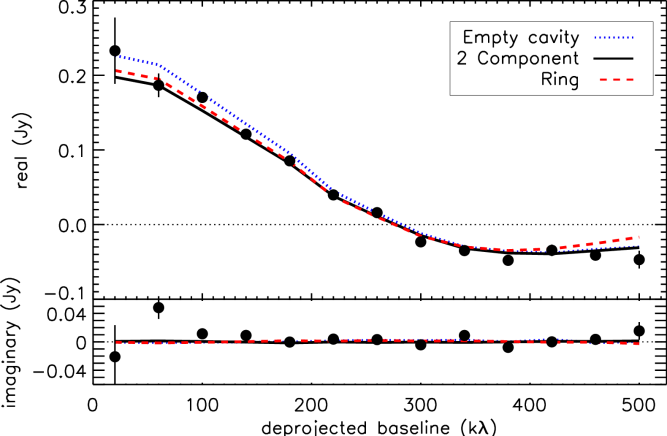
For interferometric observations, the uv-plane provides more direct means than the image plane to derive quantitative constraints on disk parameters. A convenient way to encapsulate the information from all physical scales sampled by the interferometer is to deproject the visibilities to 0.0 deg inclination and 0.0 deg position angle (PA) for the major axis (Andrews et al. 2009; Brown et al. 2009). The deprojected uv-distances are given by , where and , , and is the inclination (Lay et al. 1997). A first approximation to the offsets in and can be obtained by examining the image itself, but more accurate numbers can be calculated by assuming radial symmetry and minimizing the imaginary flux components of the deprojected visibilities (a face-on radially symmetric disk at the center of the field should have zero imaginary flux components at all spatial frequencies). Using this latter approach, we obtained positional offsets of and in and , respectively. We estimate the PA to be 1005 deg West of North from the orientation of the continuum image and the inclination to be 505 deg from the aspect ratio of simulated images (see Section 3.2.1). The deprojected visibility profile, shown in Figure 2, has a null characteristic of disks with sharp inner holes (i.e., a large drop in the surface density over a small radial distance). The location of this null is set by the spatial frequency associated with the inner hole and directly constrains its radius. We binned the data using 40 k bins. This bin size is somewhat arbitrary, but it results in 13 visibility values, a number similar to that of the SED points. We have verified that the shape of the visibility profile and, in particular, the location of the null are robust to the choice of bin size. In § 3, we model the deprojected visibility profile, together with the SED, to place constraints on several disk structure parameters.
2.2. Spectral Energy Distribution
We constructed the optical to millimeter wavelength SED for RX J1633.9-2442 from the following sources. The R-band flux comes from the USNO-B1 catalog222The USNO-B1 catalog reports two R-band values, 14.67 mag and 15.04 mag; we adopt the average. (Monet et al. 2003), and the ground based near-IR fluxes are from the 2MASS survey (Skrutskie et al. 2006). The 12 and 22 m fluxes come from the Wide-field Infrared Survey Explorer (WISE)333available at: http://irsa.ipac.caltech.edu/Missions/wise.html. The Spitzer and 1.3 mm fluxes are from Paper I, while the 850 m flux is from Nutter et al. (2006). Unfortunately, no Spitzer spectrum is available for this source. Our target is embedded in the Ophiuchus molecular cloud, and thus is strongly affected by extinction. Taking advantage of the lack of near-IR excess, we estimate an extinction AV = 5.6 mag from the J-KS color excess, adopting AV = 5.88 ((J-KS)-(J-KS)o), where (J-Ko) is the expected color of a dwarf main sequence star (Kenyon Hartmann, 1995) of the same spectral type as RX J1633.9-2442, a K5 star (see § 2.4). The extinction at other wavelengths were estimated from the extinction relations listed in Cieza et al. (2007). Extinction becomes negligible at 24 m and beyond, so the long wavelength fluxes have not been corrected for it. The photometry data from the literature and the adopted uncertainties, are listed in Table 1.
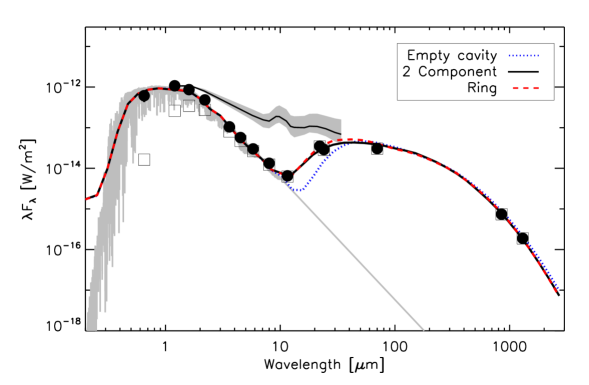
The resulting SED is shown in Figure 3 and is characterized by the complete lack of detectable excess emission at 2MASS (1.2 to 2.2 m) and Spitzer-IRAC (3.6-8.0 m) wavelengths. Since a very small amount of dust ( Mlunar) is needed to produce detectable near-IR excess, the SED alone indicates extreme levels of dust depletion in the inner disk (r 1 AU) of RX J1633.9-2442. The 22/24 m fluxes are somewhat below the lower quartile of the CTTS population (Furlan et al. 2006), but the 70 m and (sub)millimeter fluxes are typical of a massive primordial disk.
2.3. Keck aperture masking observations and data reduction
Non-redundant aperture masking (NRM) has been well-established as a means of achieving the full diffraction limit of a single telescope (Tuthill et al. 2000, 2006; Kraus et al. 2008). NRM uses a pupil-plane mask to block most of the light from a target, resampling the primary mirror into set of smaller subapertures that form a sparse interferometric array. NRM allows for superior calibration of the stellar primary’s point spread function and elimination of speckle noise by the application of interferometric analysis techniques, specifically the measurement of closure phases.
We observed RX J1633.9-2442 on April 22-23, 2011, using the Keck-II 10-m telescope with Laser-Guide Star Adaptive Optics. All observations were conducted with the facility AO imager, NIRC2, which has aperture masks installed in the cold filter wheel near the pupil stop. We used a 9-hole aperture mask, which yields 28 independent baseline triangles about which closure phases are measured. All NRM observations operate in a subarray mode of the narrow camera, which has a pixel scale of 9.963 mas/pix, and we conducted our observations using the broadband filter. Each observing sequence consisted of multiple “visits” of RX J1633.9-2442, alternating with observations of independent calibrator stars. Many of these calibrators were other transitional disk hosts in Ophiuchus listed in Paper I. Each visit consisted of a sequence of 12 exposures that were each 20s, and there were 14 and 17 visits per night.
The data analysis was identical to that used in previous papers (e.g., Ireland et al. 2008; Kraus et al. 2008, 2011), combined with the new calibration technique described in Kraus & Ireland (2012). To briefly summarize, the images were flat-fielded and bad pixels were removed by interpolating between neighboring pixels. The image was then multiplied by a super-Gaussian window function of the form , with the radius in pixels from the center of the interferogram. A two-dimensional Fourier transform was then made of each exposure in a visit, and this Fourier transform was point-sampled at the positions corresponding to the baseline vectors in the aperture mask. For each visit we then computed the vector of mean uncalibrated closure-phases and the standard error of the mean. Finally, we calibrated the closure-phases for each visit using an optimal linear combination of the calibrators observed in the same sequence of visits.
Our analysis found no statistically significant signal in the calibrated closure phases for RX J1633.9-2442, and hence that it is single to within the detection limits of the observations. Using the same procedures as in our previous NRM work mentioned above (i.e., a Monte-Carlo method that simulates random closure phase datasets of a point source with closure-phase errors and covariances that match those of the real data), we found contrast limits () of 5.9 mag at 20-40 mas, 6.9 mag at 40-80 mas, and 6.8 mag at 80 mas. The corresponding mass detection limits, based on the 1 Myr DUSTY models of Chabrier et al. (2000) and the assumed distance of 120 pc, are 6 at 2.4-4.8 AU, and 3.5 at 4.8 AU. If any planetary companions are brightened by significant accretion luminosity, as seems likely (see § 4.4), then the mass detection limits could be even lower.
2.4. Magellan optical spectroscopy observations and data reduction
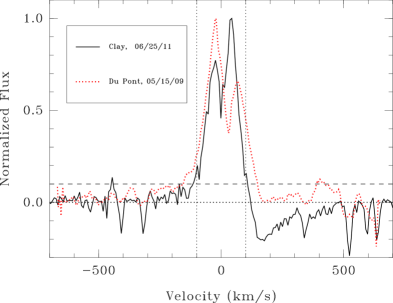
As part of our recent survey of Ophiuchus transition disks (Paper I), we obtained high resolution spectra of RX J1633.9-2442 using the 2.5-m Du Pont telescope in Las Campanas Observatory. From these data, we derived a K7 spectral type and an accretion rate of 10-10(M⊙yr-1). We reobserved RX J1633.9-2442 with the Magellan Inamori Kyocera Echelle (MIKE) spectrograph on the 6.5-m Clay telescope, also at Las Campanas Observatory, on June 25th, 2011 in order to obtain a second-epoch accretion rate.
We used the red arm of the spectrograph and a 1′′ slit to obtain the complete optical spectrum between 4900 and 9500 Å at a resolution of 22,000. This resolution corresponds to 0.3 Å at the location of the H line and to a velocity dispersion of 14 km/s. We obtained a set of 3 spectra, with a exposure time of 3 minutes each. The data were reduced using the standard IRAF packages IMRED:CDDRED and ECHELLE:DOECSLIT.
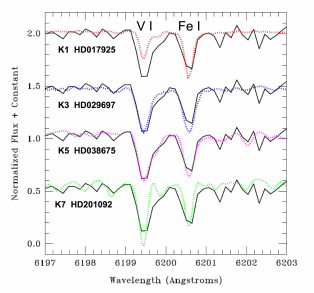
Since the final Clay spectrum has a better signal to noise ratio than our previous Du Pont observations, we have revisited the spectral type classification of RX J1633.9-2442 by comparing the new data against the ELODIE high-resolution spectral library (Prugniel & Soubiran, 2001). Figure 4 (left panel) shows the RX J1633.9-2442 spectra in the narrow 6197 to 6203 Å region, containing V I and Fe I lines, whose shapes, depths, and relative strengths are highly sensitive to effective temperature (Padgett et al. 1996). We find that the K5 template is a much better match to the RX J1633.9-2442 spectrum than the K7 template is and hence adopt this new and slightly revised spectral type for the modeling work.
Figure 4 (right panel) shows the continuum subtracted velocity profile of the H line for our Du Pont and Clay observations. The vertical lines mark a velocity width (, measured at 10 of the peak value) of 200 km/s, the boundary between accreting and non-accreting objects suggested by Jayawardana et al. (2003). The H line is broader than 200 km/s, asymmetric and variable in both shape and intensity as expected from magnetospheric accretion. We find 300 km/s from our Du Pont observations and 230 km/s in our new Clay data. For accreting objects, correlates with accretion rates derived from models of the magnetospheric accretion process. The relation given by Natta et al. (2004), and adopted in Paper I, , translate the values into accretion rates of 10-10 and 10-10.6 M⊙yr-1, for the Du Pont and Clay data, respectively.
3. Disk model
In order to constrain the structure of the RX J1633.9-2442 disk based on the observed SMA visibilities and SED, we use the MCFOST radiative transfer code (Pinte et al. 2006). MCFOST adopts a Monte Carlo approach to follow “photon packets” propagated through the disk (i.e., a parametrized dust density structure). MCFOST outputs synthetic SEDs and monochromatic raytraced images. The raytraced images can be used to simulate synthetic SMA visibilities with the same u-v sampling as the actual observations. The deprojected synthetic visibilities can then be directly compared against the real data, using the same radial binning, as described in the following section.
3.1. Fitting procedure
We follow the model fitting procedure described by Mathews et al. (2012), which uses the Levenberg-Marquardt minimization algorithm to perform an efficient exploration of the parameter space. We start by using MCFOST to create a small grid of models and the corresponding SEDs and 880 m raytraced images. The raytraced images are input to the FT (Fourier Transform) task in the Common Astronomy Software Applications (CASA444available at http://casa.nrao.edu/) package, which outputs visibility data sets with the same u-v sampling as the real SMA observations. Then, for each model, the of the model is calculated as the sum of the of the SED and the of the visibility profile. We use the IDL routine MPFIT (Markwardt, 2009) to implement the Levenberg-Marquardt minimization algorithm to calculate the numerical gradients of the function and determine the next point in the parameter space to be sampled until the algorithm converges to a minimum.
To better sample the parameter space and in order to avoid local minima, we carried out the search algorithm several times using different starting values. Each of the runs provide a set of best-fit parameters. The distribution of the best-fit values for each parameter can be used to calculate the mean and an associated uncertainty (see § 4.2 in Mathews et al. 2012 for a discussion on estimating the uncertainties).
3.2. Disk parameterization
Transition disks are complex systems that have been modeled with a wide range of structures. Some objects such as CoKu Tau/4 and DM Tau have inner holes that seem to be completely depleted of IR emitting grains (D’Alessio et al. 2005; Calvet et al. 2005), while others such as GM Aur have cavities filled with optically thin dust (Calvet et al. 2005). Yet other systems, like T Cha and LkCa 15 are best described as having optically thin gaps separating optically thick inner and outer disk components (Olofsson et al. 2011; Espaillat et al. 2010). In what follows, we explore all 3 possibilities for the structure of the RX J1633.9-2442 disk.
3.2.1 Empty cavity
We begin our modeling by adopting the simplest possible structure for a transition disk: a disk with an empty cavity. Motivated by physical models of viscous accretion disks (e.g., Hartmann et al. 1998, Lynden-Bell & Pringle 1974) and the discrepancy in disk sizes obtained from continuum and CO line images (Hughes et al. 2008; Isella et al. 2007; Píetu, Guilloteau & Dutrey, 2005), we follow Mathews et al. (2012) and adopt the following description for the surface density profile and the size of the disk:
where is the surface density at a characteristic radius, , and is the radial dependence of the disk viscosity, . In this prescription, the surface density is proportional to R-γ in the inner disk, but it quickly becomes dominated by the exponential taper at large radii. = 0 within the cavity of radius . We set the outer radius of the disk, , to 200 AU. However, we note that our model is not very sensitive to the exact value of because the exponential taper of the outer disk implies very low surface densities (below the sensitivity of our SMA observations) for radii . The vertical distribution of the dust is given by a Gaussian with a scale height , where is the scale height at , and is the power law describing the flaring of the disk. The dust content is described by a differential power-law for the grain size distribution (d() d), between 0.005 m and 3900 m.555the maximum grain size is somewhat arbitrary, but corresponds to 3 the size of the longest wavelength in the SED, which approximates the maximum grain sizes the data are sensitive to (Draine 2006). We adopt the porous grains from Mathis Whiffen (1989) for the grain composition. The stellar parameter are those of the best matched photospheric model (Kurucz 1979, 1993) for a K5 star (Teff=4350 K, log g = 4.0) at the relatively well established distance of 120 pc to the Ophiuchus molecular cloud (Loinard et al. 2008). We initially created SEDs and visibility profiles assuming an inclination of 60 deg for the disk, but quickly found that adopting an inclination of 50 deg resulted in synthetic images with aspect ratios that are closer to the observed image and hence use this latter value for all models. Table 2 lists all the parameters that are fixed in our model. The 6 free parameters for the “empty cavity” model are listed in Table 3. Mdisk is not a free parameter. It is obtained by integrating the surface density profile over radius and assuming a gas to dust mass ratio of 100.
For this parameterization, we ran the search algorithm 5 times. The visibility profile and the SED of the overall best-fit model from all 5 runs are indicated in Figures 2 and 3, respectively. The probability weighted means and uncertainties (calculated as in Mathews et al. 2012) for each parameter are listed in Table 3 in the “Empty cavity” column. While the model reproduces the visibility profile very well, the observed 22 and 24 m fluxes are factors of 2-3 (i.e., 10 to 20) higher then predicted by the model. Since the 22 and 24 m measurements are independent (the former is from WISE and the latter is from Spitzer), photometric problems can be ruled out. The “empty cavity” model does not reproduce the significant 12 m excess either. The large discrepancy between the observations and the best-fit model in the mid-IR can be understood considering that the search algorithm was most likely driven by the of the visibility profile, which is very sensitive to the value of Rcav. In other words, the visibility profile very strongly constrains the size of the inner cavity to be 22.71.6 AU, but such a large cavity is incompatible with the observed 12 and 22/24 m excesses. We find that the SED and SMA data can not be reconciled even adopting a hotter K1-type central star (which is clearly ruled out by the optical spectrum, see Figure 4). It is thus unavoidable to conclude that the 23 AU cavity imaged at submillimeter wavelengths is not completely depleted of mid-IR emitting grains.
3.2.2 2-component disk
To try to reproduce the observed mid-IR excesses, we partially fill the cavity by incorporating 2 additional free parameters that result in a 2-component disk: and . Following Andrews et al. (2011a) and Mathews et al. (2012), the surface density profile of the disk is modified such that = , for R . That is, no longer drops to zero at , but is sharply reduced to a lower value between and . This sharp reduction in the surface density profile at is meant to reproduce the inner hole seen at submillimeter wavelengths. remains zero for R Rin.
We ran the search algorithm 5 times for this new parameterization. The visibility profile and the SED of the overall best-fit 2-component model are indicated in Figures 2 and 3, respectively. The weighted means and uncertainties for each parameter are listed in Table 3 in the “2-component disk” column. The inner component of this model is characterized by a surface density reduction of 100 with respect to the outer disk and an inner radius of 7 AU. As shown by Figures 2 and 3, the 2-component parametrization allow us to simultaneously obtain satisfactory fits for both the visibility profile and the SED. However, as the properties of the inner disk component are effectively controlled by only 3 SED points (i.e, the 8.0, 12, and 22/24 m fluxes), the solution is unlikely to be unique. We next explore an alternative geometry for the inner disk, a narrow ring.
3.2.3 Narrow ring within cavity
As an alternative of the 2-component model, we modify the empty cavity model with two additional parameters, and , describing the location and width of a ring within the cavity. The description of the outer disk (i.e., beyond Rcav) remains unchanged. With this parametrization, we also ran the search algorithm 5 times. The results are shown in Figures 2, 3 and listed in Table 3, together with the other 2 earlier parameterizations. We find that a narrow ring at 10 AU fits the visibility profile and the SED almost as well as the 2-component model does (see also of the visibilities and the SED in Table 3). The small width of the ring (2 AU) can be understood from the fact that the ring is optically thick and its mid-IR emission is dominated by the inner rim facing the star.
3.3. Synthesis of Modeling results
Table 3 shows that the outer disk parameters for all three model structures agree remarkably well. All the values are well within 1- or 2-, which give us confidence in both our modeling results and uncertainty estimates. Also, because the SMA data is only sensitive to the properties of the outer disk, the visibility profiles of the three models match the observations comparably well (see Figure 2 and of the visibilities in Table 3). We find that the disk is relatively massive (15 MJUP) and rather flat. The scale height at RC is given by , corresponding to 0.8 AU at a radius of 40 AU for all 3 models. This flat geometry is in agreement with the result by Orellana et al. (2012), who found a scale height of 2 AU at 100 AU for RX J1633.9-2442, and is most likely due to significant grain growth and dust settling. Our models, driven by the (sub)millimeter colors, do favor a grain size distribution extending beyond the millimeter size scale.
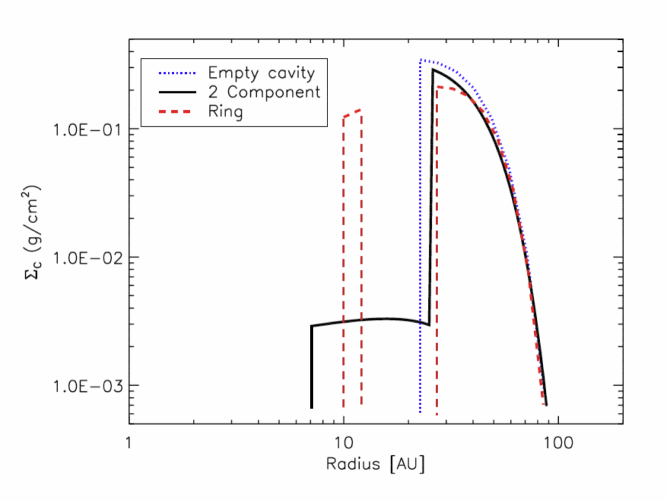
As for the the inner disk, its structure is not well constrained by current data. The narrow optically thick ring and the more extended optically thin region are only a subset of possible solutions, and the radial symmetry assumed is not necessarily correct (see § 4.3). However, we can say that the mid-IR emission originates beyond 5 AU, from a dust component that is distinct from the outer disk imaged at submillimeter wavelengths. Similarly, the extreme depletion of dust grains within a few AU of the star is well established by the lack of detectable excess at IRAC wavelengths (3.6 to 8.0 m). As mentioned in the introduction, Orellana et al. (2012) successfully modeled the SED of RX J1633.9-2442 with a 7.9 AU inner hole, which was virtually empty. In other words, the larger submillimeter cavity imaged by the SMA is not detectable from the SED alone. The surface density profile of the 3 models we considered are shown in Figure 5. By simultaneously modeling the visibility and SED data, we are able to demonstrate that the circumstellar environment of RX J1633.9-2442 presents at least three distinct radial regions. The innermost region (r 5 AU) is depleted of small grains. The middle region contains some mid-IR emitting grains, with an unknown configuration. The outermost region of the disk starts at 25 AU, with a sudden increase in the surface density. This complex structure is certainly intriguing, but is not unique to RX J1633.9-2442. Similar structures have already been proposed to reconcile the submillimeter images and SEDs of several other transition disks, including DM Tau, RX J1615.3-3255 (Andrews et al. 2011a), and RX J1604.3-2130 (Mathews et al. 2012). In the next section, we discuss the physical processes that could potentially explain our modeling results and the overall properties of RX J1633.9-2442. Most of our conclusions are also applicable to the 3 other similar objects listed above.
4. Discussion
As discussed in § 1, multiple mechanisms have been proposed to explain the inner opacity holes of transition disks, including photoevaporation, grain growth, and dynamical clearing. In what follows, we consider how the predictions from models of each process compare to the properties of RX J1633.9-2442. Toward the end of the section, we assess the likelihood of a connection between transition disks and each of the two leading theories of giant planet formation, core accretion and gravitational instability.
4.1. Photoevaporation
Photoevaporation by the central star is currently believed to play an important role on the dissipation of circumstellar disks. Photoevaporation can be driven by energetic photons in the FUV (6 eV 13.6 eV), EUV (13.6 eV 0.1 keV ) and X-ray ( keV) energy range. Photons in each energy domain operate in different ways. EUV photons cannot penetrate far into the disk and drive relatively weak photovaporation winds (10-10 M⊙/yr). Thus, EUV photoevaporation only becomes important once most of the disk mass has been depleted and the accretion rate drops below 10-10 M⊙/yr (Alexander et al. 2006a,2006b), at which point the outer disk is no longer able to resupply the inner disk with material and the inner disk drains on a viscous timescale ( yr). Once the inner disk is drained, a hole is formed, the disk edge is directly exposed to the EUV radiation, and the disk rapidly photoevaporates from the inside out. The very large disk mass of RX J1633.9-2442 and the presence of accretion are inconsistent with EUV-induced photoevaporation being the formation mechanism for its inner hole.
More recent studies have incorporated X-ray (Owen et al. 2011; 2012) and/or FUV irradiation (Gorti, Dullemond & Hollenbach 2009; Gorti & Hollenbach 2009) into photoevaporation models. According to these models, X-ray and FUV photons can penetrate deeper into the disk, and drive much higher photoevaporation rates (10-8 M⊙/yr). As a result, the hole is expected to form earlier in the evolution of the disk, while the disk is still relatively massive. Since the surface density of the inner disk at the time it starts to drain is high, X-ray/FUV photoevaporation models can in principle explain the presence of massive disks with inner holes and moderate accretion (i.e., they would represent the inner disk draining stage). However, these models also predict that accretion onto the star should quickly drop as the size of the inner cavity grows.
In the context of these models, whether the inner hole of a transition disk can potentially be explained by X-ray/FUV photoevaporation depends on the size of the inner hole, the observed accretion rate, the stellar mass, and the X-ray luminosity. In particular, the region in the hole size versus accretion rate plane that is consistent with X-ray/FUV photoevaporation is a very strong function of stellar mass, M⋆, (see Fig. 17 in Owen et al. 2012) because: 1) the location at which the X-ray heated gas becomes unbound and opens a gap in the disk is proportional to M⋆ and 2) the X-ray luminosity is also a strong function of stellar mass (LX-ray M; Preibisch et al. 2005). We thus estimate the stellar mass of RX J1633.9-2442 by comparing its temperature and luminosity to the predictions of theoretical evolutionary tracks. A Teff of 4350 K is directly derived from the K5 spectral type. We estimate a luminosity of 0.70 L⊙ applying a bolometric correction (from Hartigan et al. 1994) to the extinction corrected J-band magnitude and adopting a distance of 120 pc. According to the models by D′Antona Mazzitelli (1998) and Siess et al. (2000) the temperature and luminosity of RX J1633.9-2442 correspond to those of a 2 Myr old 0.7 M⊙ star and a 6 Myr 1.0 M⊙ star, respectively. The large discrepancy in stellar age highlights the uncertainty of these models. However, with that caveat, RX J1633.9-2442 can be considered to be a 1 M⊙ star, for which disk holes larger than 20 AU around accreting objects cannot be explained by photoevaporation.
Also, photoeveporation cannot easily account for the 3-region structure we found in §3. We thus conclude that the inner hole of RX J1633.9-2442 is unlikely to be due to any kind of photoevaporation process.
4.2. Grain growth
Dust opacity, (cm2/g), is a very strong function of particle size. As soon as primordial sub-micron dust grains grow into larger bodies (r ), most of the solid mass never interacts with the radiation, and plunges. Observational support for grain growth in disks is robust and comes from at least two independent lines of evidence: the shapes of the silicate features around 10 and 20 m (Kessler-Silacci; 2006, Olofsson et al. 2010) and the spectral slopes of disks at (sub)millimeter wavelengths (Andrews & Williams, 2005, 2007; Wilner et al. 2005; Ricci et al. 2010). Grain growth has been proposed as one of the possible explanations for the opacity holes of transition disks because it might be a strong function of radius (it is expected to be more efficient in the inner regions where the surface density is higher and the dynamical timescales are shorter).
Idealized dust coagulation models, ignoring fragmentation and radial drift, do in fact predict extremely efficient grain growth in the inner disk and can produce SEDs similar to those of RX J1633.9-2442 (Dullemond & Dominik, 2005). However, dust fragmentation and radial drift result in the efficient replenishment of micron size grains (Brauer, Dullemond & Henning 2008; Birnstiel, Ormel & Dullemond 2011) and a smooth and shallow dependence of on disk radius. In contrast, both the SED and SMA visibilities of RX J1633.9-2442 are consistent with a steep discontinuity in the optical depth (i.e., ) at Rcav and Rin (or Rring,in). Furthermore, if the optical depth discontinuities are mainly due to a reduction in instead of , this would favor the onset of the magneto-rotational instability (Chiang & Murray-Clay, 2007) and would exacerbate accretion. The very low accretion rate of the RX J1633.9-2442 disk ( 10-10 M⊙yr-1; see § 2.4) contradicts this scenario. We thus consider grain growth to be a very unlikely explanation for the inner opacity reductions.
4.3. Dynamical clearing
Unlike grain growth, the dynamical interaction of a (sub)stellar companion embedded within the disk can produce a sharp inner hole (Artymowicz & Lubow (1994). Ireland Kraus (2008) showed that the famous transition disk CoKu Tau 4 is in fact a near-equal mass binary system, which naturally explains the hole that had been inferred from its SED. This immediately raised the question of whether most transition disks were close binaries. However, it is now clear that most sharp holes are not due to binarity. The transition objects DM Tau, GM Aur, LkCa 15, UX Tau, and RY Tau have all been observed with the Keck interferometer (Pott et al. 2010). For these objects, stellar companions with flux ratios 20 can be ruled out down to sub-AU separations.
Our Keck aperture masking observations discussed in § 2.3 rule out the presence of even a brown dwarf companion down to a projected separation of 2.4 AU (corresponding to a maximum physical separation of 3.8 AU). Therefore, a stellar (or brown dwarf) companion cannot explain neither the 25 AU hole seen in our SMA image nor the inner most cavity indicated by the SED. Instead, the 3-region structure of the RX J1633.9-2442 disk discussed in § 3.3 suggests the presence of at least two low-mass objects dynamically sculpting the disk: an object at AU from the star that creates the discontinuity in the surface density seen in the submillimeter image and another object at 7 AU that clears up the inner disk of material. We thus argue that the dynamical interaction of multiple planets embedded within the disk is the most likely explanation for the overall properties of RX J1633.9-2442.
The need for multiple planets to explain the properties of RX J1633.9-2442 is very strongly supported by recent hydrodynamical simulations of giant planets embedded in primordial disks by Dodson-Robinson & Salyk (2011) and Zhu et al. (2011) showing that multiple planets are in fact required to produce inner holes and gaps wide enough to have a noticeable effect in the emerging SED. Both studies find that a single giant planet cannot explain wide optically thin gaps and holes. Multiple forming planets also help explaining the low accretion rates onto the star (for a given disk mass) of many transition objects (Najita et al. 2007; Espaillat et al. 2012) as each planet accretes a significant fraction of the material being transported across the disk.
Kepler observations have demonstrated that systems with multiple planets with small semi-major axes are common (Lissauer et al. 2012). The lack of near-IR excess ( 8.0 m) in the SED of RX J1633.9-2442 combined with variable and detectable levels of accretion (10-10–10-10.5 M⊙yr-1) could be an indication of a densely packed planetary system resulting in multiple optically thick tidal streams that transport a significant amount of material onto the star but cover a small area of the inner disk. We ran some tests and found that axisymmetrically distributed circumstellar material would produce a detectable near-IR excess unless the surface density of the inner disk (r 5 AU) is reduced by a factor of 104 with respect to that of a “typical” CTTS disk. In the absence of planets, the accretion rate onto the star should be proportional to the surface density of the inner disk. Therefore, if the surface density is reduced by a 104 factor from typical levels, one would expect an accretion rate of 10-12–10-12.5 M⊙yr-1 for RX J1633.9-2442. Such low rates are undetectable and 2 orders of magnitude lower than the observed value. Nevertheless, the lack of near-IR excess and the accretion rate could be reconciled if the inner disk contains optically thick tidal streams with a geometric filling factor of a few percent, which is in agreement with the results of hydrodynamic simulations (Dodson-Robinson & Salyk, 2011). Since these hydrodynamic simulations predict very complex disk structures, the “2-component” and “ring within cavity” models presented herein are by necessity a crude oversimplification that reflects the lack of resolved data at the appropriate resolution (i.e., at a few AU scale).
4.4. Implications for planet formation
The notion that the properties of some transition disks are signposts of ongoing planet formation (e.g., Najita et al. 2007; Paper I; Dodson-Robinson & Salyk 2011; Espaillat et al. 2012) has gained credence from the recently identified companions to T Cha and LkCa 15. Using the aperture masking technique on the Very Large Telescope, Huélamo et al. (2011) detected a faint object within the inner cavity of the T Cha disk. The object is located at 62 mas (7 AU) from the primary and has a luminosity ratio of 5.1 mag in the L′-band (3.8 m). Based on the upper limits from similar Ks-band (2.2 m) observations, the authors derived a KS-L′ color 1.25 for the companion, suggesting the object must be surrounded by dust. Also using the aperture masking technique, but in the Keck telescope, Kraus & Ireland (2012), identified a similar object inside the inner hole of LkCa 15. In this case, the companion has been detected in multiple epochs and at multiple wavelengths. The object seems to be a point source at 2.1 m (6.8 mag fainter than the primary), but is extended at 3.7 m. Since the inclination of the LkCa 15 disk is known from resolved submillimeter observations (Andrews et al. 2011b), a deprojected separation of 15 AU from the primary can be derived for the companion, assuming it is coplanar with the disk. Kraus & Ireland interpreted their observations as a young planet surrounded by warm dust.
RX J1633.9-2442 shares an intriguing property with T Cha and LkCa 15: a very low accretion rate for a given disk mass. LkCa 15 has a disk mass of 55 MJUP (Andrews et al. 2011b) and an accretion rate of 10-9 M⊙/yr (Hartmann et al. 1998). Similarly, T Cha has a disk mass of 17 MJUP (Olofsson et al. 2011) and it seems to be accreting only very weakly and sporadically onto the star (Alcala et al. 1993; Schisano et al. 2009). In the absence of a planet, the mass accretion rate onto the star should be roughly proportional to the mass of the disk (Najita et al. 2007); however, a planet massive enough to open a gap in the disk is expected to divert most of the material accreting from the outer disk onto itself. As a result, in the presence of a Jupiter mass planet, the accretion onto the star is reduced by a factor of 10 with respect to the mass transport across the outer disk (Lubow D′Angelo, 2006). In § 3 we derived a disk mass of 15 MJUP for RX J1633.9-2442. Despite this large disk mass, we estimate an accretion rate of 10-10.0 M⊙yr-1 based on the velocity dispersion of its H line (see § 2.4). For comparison, the median disk mass and accretion rate for classical T Tauri stars in Ophiuchus are 5 MJUP (Andrews Williams, 2005) and 10-8.5 M⊙yr-1 (Natta et al. 2006), respectively. As discussed in the previous section, the unusually low accretion rate onto the star for the given disk mass observed in RX J1633.9-2442 is consistent with the presence of actively accreting objects embedded within the disk.
Moderate to low accretion rates seem to be a general feature of transition disks. While the distributions of mass accretion rates of transition and non-transition disks are very wide and clearly overlap, the accretion rates of disks with evidence for holes and gaps tend to be a factor of 5 lower than those of “full” disks” (Espaillat et al. 2012). All things considered, the properties of RX J1633.9-2442, T Cha, and LkCa 15 are best explained by the runaway gas accretion phase in models of giant planet formation through core accretion (Lissauer Stevenson, 2007). According to the core accretion model, gas giant planets form by first accreting a solid core, which later attracts a massive gaseous envelope. Initially the gas accretion rate onto the core is much lower than the accretion rate of solids. As the mass of the core increases, the rate of gas accretion accelerates. Once the mass of gas in the core matches the mass of solids, runaway gas accretion occurs and is sustained for as long as there is material in the gas feeding zone of the planet (i.e., until the forming planet clears a gap in the disk). Due to accretion shock luminosity, the envelope accretion phase corresponds to the highest luminosity state a giant planet will ever have (Marley et al. 2007). This luminosity spike could be in fact what makes the detection of forming planets even possible with current instrumentation. The duration of the runaway gas accretion phase is estimated to be of the order of 105 years for a 1 MJUP planet and somewhat longer for a larger planet (Marley et al. 2007). This timescale is also in agreement with the incidence of transition disks sharing the properties of RX J1633.9-2442 (combining a sharp inner hole, a large disk mass, and a low accretion rate). We note that, while the occurrence rate of objects that can be broadly defined as transition disks is of the order of 20, they are not all consistent with giant planet formation. Accreting objects with steeply rising mid-IR SEDs, such as RX J1633.9-2442, T Cha, and LkCa 15 are an order of magnitude less common (Cieza et al. 2010, 2012; Romero et al. 2012).
If our interpretation is correct, massive accreting transition disks with rising mi-IR SEDs around single stars are by far the best places for direct imaging searches of forming planets since they are not only the sites of ongoing planet formation, but also the places where forming planets should be the brightest! As shown by Huélamo et al. (2011) and Kraus Ireland (2012), non-redundant aperture masking is the most promising technique for such searches as it delivers the highest contrast ratio at the diffraction limit of the telescope.
In addition to core accretion, gravitational instability (GI) has also been proposed as a formation mechanism for giant planets (Boss 1997; Durisen et al. 2007). Nevertheless, GI seems to be less relevant to the transition disks discussed herein for several reasons. First, GI planets are expected to form at evolutionary stages much earlier (age 1 Myr) than those of transition disks, when the disk is still extremely massive (Mdisk/Mstar 0.1) and deeply embedded within an extended envelope, while the age distribution of transition disks likely to harbor forming planets favors a 2-3 Myr formation timescale (Cieza et al. 2012). Second, GI should operate mostly at large radii where the cooling times are shorter than the local orbital periods, a condition needed for fragmentation (Gammie 2001, Rafikov 2007). GI is believed to be much less effective at disk radii 40 AU (Boley Durinsen, 2008) or even 100 AU (Boley 2009), which makes GI less consistent with the inner hole sizes of most transition disks. Finally, since the timescale for the formation of planets through GI is 103 yr, it is statistically unlikely that the formation event itself would be observed in a nearby molecular cloud with an age of few million years and hundreds, not thousands, of young stellar objects. Since GI models do not run long enough to predict the long term evolution of the disk after the formation of the planet, it could be argued that a GI planet could remain embedded in a massive disk for a relative long period of time after it has formed. However, as discussed above, the high disk masses and low accretion rates of RX J1633.9-2442, T Cha and LkCa 15, as well as the properties of the T Cha, and LkCa 15 companions, suggest that the putative planets are accreting most of their mass at the current epoch (i.e., we are watching them form!). Even though some planets might form through GI, the properties and incidence of the transition objects mentioned here are in much better agreement with planet formation through core accretion.
5. Summary and Future directions
We present continuum high resolution SMA observations of the transition disk RX J1633.9-2442 and simultaneously model the entire optical to millimeter wavelength SED and SMA visibilities in order to constrain the structure of its disk. The submillimeter image reveals that the disk is highly inclined (50 deg) and has an inner cavity 25 AU in radius. This cavity is not empty as some warm dust is needed to explain the excess emission observed at 12, 22, and 24 m. The mid-IR excess can be reproduced with either a narrow, optically thick ring at 10 AU or an optically thin region extending from 7 to 25 AU. The lack of near-IR excess emission indicates that the inner disk (r 5 AU) is mostly depleted of IR-emitting grains. Since RX J1633.9-2442 is a single star, the properties of the disk (a complex structure, a relative massive outer disk, and weak accretion) favors dynamical clearing by multiple planets as the hole formation mechanism. This conclusion can be extended to objects with similar properties and disk structures, such as the three transition objects mentioned in Section 3.3: DM Tau, RX J1615.3-3255, and RX J1604.3-2130.
The filamentary structures predicted by hydrodynamical models of multiple planets embedded within a disk can reconcile the accretion rate and SED of RX J1633.9-2442 as they can transport significant amounts of material to the inner disk without overproducing the observed IR excess. The properties and occurrence rate of objects such as RX J1633.9-2442, T Cha, and LkCa 15 (and those of the companions recently identified to these latter objects) are in good agreement with the runaway gas accretion phase of the core accretion model, when giant planets gain their envelopes and suddenly become massive enough to dynamically clear a gap in the disk.
If the inner holes of RX J1633.9-2442, DM Tau, RX J1615.3-3255, RX J1604.3-2130, T Cha, and LkCa 15 are in fact due to ongoing giant planet formation through core accretion, these types of systems would represent ideal laboratories to study this complex process in detail and place much needed observational constraints. For instance, the location of the LkCa 15 companion and the age of the system would already imply that core accretion can actually form giant planets at 15 AU within 3 Myr, which is a difficult challenge for current models (Dodson-Robinson Bodenheimer, 2010). Similarly, the sizes of the inner holes in the disks of RX J1633.9-2442, RX J1615.3-3255, and RX J1604.3-2130 also suggest the presence of young giant planets at 20 AU orbital separations.
In the near future, the unprecedented sensitivity and resolution of the Atacama Large Millimeter/submillimeter Array (ALMA) will revolutionize the fields of disk evolution and planet formation. Most studies of nearby circumstellar disks will soon be based on high resolution images of both thermal emission and molecular gas tracers rather than on SED observations. ALMA will provide new insights on the structure of disks and their dynamics and teach us about turbulence, grain growth and dust settling, and the evolution of the dust to gas mass ratio, the understanding of all of which are key to planet formation theory. Detailed ALMA studies of disks hosting forming planets is the most direct and promising approach to learn about the planet formation process and the conditions in which planets form.
References
- Alexander et al. (2006) Alexander, R. D., Clarke, C. J., & Pringle, J. E. 2006, MNRAS, 369, 216
- Alexander et al. (2006) Alexander, R. D., Clarke, C. J., & Pringle, J. E. 2006, MNRAS, 369, 229
- Alcala et al. (1993) Alcalá, J. M., Covino, E., Franchini, M., Krautter, J., Terranegra, L., & Wichmann, R. 1993, A&A, 272, 225
- Andrews & Williams (2005) Andrews, S. M., & Williams, J. P. 2005, ApJ, 631, 1134
- Andrews & Williams (2007) Andrews, S. M., & Williams, J. P. 2007, ApJ, 671, 1800
- Andrews et al. (2009) Andrews, S. M., Wilner, D. J., Hughes, A. M., Qi, C., & Dullemond, C. P. 2009, ApJ, 700, 1502
- Andrews et al. (2011) Andrews, S. M., Wilner, D. J., Espaillat, C., et al. 2011a, ApJ, 732, 42
- Andrews et al. (2011) Andrews, S. M., Rosenfeld, K. A., Wilner, D. J., & Bremer, M. 2011b, ApJ, 742, L5
- Artymowicz & Lubow (1994) Artymowicz, P., & Lubow, S. H. 1994, ApJ, 421, 651
- Birnstiel et al. (2011) Birnstiel, T., Ormel, C. W., & Dullemond, C. P. 2011, A&A, 525, A11
- Boley & Durisen (2008) Boley, A. C., & Durisen, R. H. 2008, ApJ, 685, 1193
- Boley (2009) Boley, A. C. 2009, ApJ, 695, L53
- Boss (1997) Boss, A. P. 1997, Science, 276, 1836
- Brauer et al. (2008) Brauer, F., Dullemond, C. P., & Henning, T. 2008, A&A, 480, 859
- Brown et al. (2009) Brown, J. M., Blake, G. A., Qi, C., Dullemond, C. P., Wilner, D. J., & Williams, J. P. 2009, ApJ, 704, 496
- Calvet et al. (2005) Calvet, N., D’Alessio, P., Watson, D. M., et al. 2005, ApJ, 630, L185
- Chabrier et al. (2000) Chabrier, G., Baraffe, I., Allard, F., & Hauschildt, P. 2000, ApJ, 542, 464
- Chiang & Murray-Clay (2007) Chiang, E., & Murray-Clay, R. 2007, Nature Physics, 3, 604
- Cieza et al. (2007) Cieza, L. A, et al. 2007, ApJ, 667, 308
- Cieza et al. (2008) Cieza, L. A., Swift, J. J., Mathews, G. S., & Williams, J. P. 2008, ApJ, 686, L115
- Cieza et al. (2010) Cieza, L. A., et al. 2010, ApJ, 712, 925, Paper I.
- Cieza et al. (2011) Cieza, L. A., Olofsson, J., Harvey, P. M., et al. 2011, ApJ, 741, L25
- Cieza et al. (2012) Cieza, L. A., Schreiber, M. R., Romero, G. A., et al. 2012, arXiv:1203.6849
- Cutri et al. (2011) Cutri, R. M., Wright, E. L., Conrow, T., et al. 2011, Explanatory Supplement to the WISE Preliminary Data Release Products, 1
- D’Alessio et al. (2005) D’Alessio, P., Hartmann, L., Calvet, N., et al. 2005, ApJ, 621, 461
- D’Antona & Mazzitelli (1998) D’Antona, F., & Mazzitelli, I. 1998, Brown Dwarfs and Extrasolar Planets, 134, 442
- Dodson-Robinson Bodenheimer (2010) Dodson-Robinson, S. E., Bodenheimer, P. 2010, Icarus , 207, 491
- Dodson-Robinson & Salyk (2011) Dodson-Robinson, S. E., & Salyk, C. 2011, ApJ, 738, 131
- Draine (2006) Draine, B. T. 2006, ApJ, 636, 1114
- Dullemond & Dominik (2005) Dullemond, C. P., & Dominik, C. 2005, A&A, 434, 971
- Durisen et al. (2007) Durisen, R. H., Boss, A. P., Mayer, L., Nelson, A. F., Quinn, T., & Rice, W. K. M. 2007, Protostars and Planets V, 607
- Espaillat et al. (2010) Espaillat, C., D’Alessio, P., Hernández, J., et al. 2010, ApJ, 717, 441
- Espaillat et al. (2012) Espaillat, C., Ingleby, L., Hernández, J., et al. 2012, ApJ, 747, 103
- Furlan et al. (2006) Furlan, E., et al. 2006, ApJS, 165, 568
- Gammie (2001) Gammie, C. F. 2001, ApJ, 553, 174
- Gorti et al. (2009) Gorti, U., Dullemond, C. P., & Hollenbach, D. 2009, ApJ, 705, 1237
- Gorti & Hollenbach (2009) Gorti, U., & Hollenbach, D. 2009, ApJ, 690, 1539
- Hartigan et al. (1994) Hartigan, P., Strom, K. M., & Strom, S. E. 1994, ApJ, 427, 961
- Hartmann et al. (1998) Hartmann, L., Calvet, N., Gullbring, E., & D’Alessio, P. 1998, ApJ, 495, 385
- Ho et al. (2004) Ho, P. T. P., Moran, J. M., & Lo, K. Y. 2004, ApJ, 616, L1
- Huélamo et al. (2011) Huélamo, N., Lacour, S., Tuthill, P., Ireland, M., Kraus, A., & Chauvin, G. 2011, A&A, 528, L7
- Hughes et al. (2008) Hughes, A. M., Wilner, D. J., Qi, C., & Hogerheijde, M. R. 2008, ApJ, 678, 1119
- Isella et al. (2007) Isella, A., Testi, L., Natta, A., Neri, R., Wilner, D., & Qi, C. 2007, A&A, 469, 213
- Isella et al. (2010) Isella, A., Carpenter, J. M., & Sargent, A. I. 2010, ApJ, 714, 1746
- Ireland & Kraus (2008) Ireland, M. J., & Kraus, A. L. 2008, ApJ, 678, L59
- Ireland et al. (2008) Ireland, M. J., Kraus, A., Martinache, F., Lloyd, J. P., & Tuthill, P. G. 2008, ApJ, 678, 463
- Kenyon & Hartmann (1995) Kenyon, S. J., & Hartmann, L. 1995, ApJS, 101, 117
- Kessler-Silacci et al. (2006) Kessler-Silacci, J., et al. 2006, ApJ, 639, 275
- Kraus et al. (2008) Kraus, A. L., Ireland, M. J., Martinache, F., & Lloyd, J. P. 2008, ApJ, 679, 762
- Kraus et al. (2011) Kraus, A. L., Ireland, M. J., Martinache, F., & Hillenbrand, L. A. 2011, ApJ, 731, 8
- Kraus & Ireland (2012) Kraus, A. L., & Ireland, M. J. 2012, ApJ, 745, 5
- Kurucz (1979) Kurucz, R. L. 1979, ApJS, 40, 1
- Kurucz (1993) Kurucz, R. L. 1993, VizieR Online Data Catalog, 6039, 0
- Lay et al. (1997) Lay, O. P., Carlstrom, J. E., & Hills, R. E. 1997, ApJ, 489, 917
- Lissauer & Stevenson (2007) Lissauer, J. J., & Stevenson, D. J. 2007, Protostars and Planets V, 591
- Lissauer et al. (2012) Lissauer, J. J., Marcy, G. W., Rowe, J. F., et al. 2012, arXiv:1201.5424
- Loinard et al. (2008) Loinard, L., Torres, R. M., Mioduszewski, A. J., & Rodríguez, L. F. 2008, ApJ, 675, L29
- Lubow & D’Angelo (2006) Lubow, S. H., & D’Angelo, G. 2006, ApJ, 641, 526
- Lynden-Bell & Pringle (1974) Lynden-Bell, D., & Pringle, J. E. 1974, MNRAS, 168, 603
- Markwardt (2009) Markwardt, C. B. 2009, Astronomical Data Analysis Software and Systems XVIII, 411, 251
- Marley et al. (2007) Marley, M. S., Fortney, J. J., Hubickyj, O., Bodenheimer, P., & Lissauer, J. J. 2007, ApJ, 655, 541
- (62) Mathews et al. 2012, submitted to apJ.
- Mathis & Whiffen (1989) Mathis, J. S., & Whiffen, G. 1989, ApJ, 341, 808
- Monet et al. (2003) Monet, D. G., et al. 2003, AJ, 125, 984
- Najita et al. (2007) Najita, J. R., Strom, S. E., & Muzerolle, J. 2007, MNRAS, 378, 369
- Natta et al. (2006) Natta, A., Testi, L., & Randich, S. 2006, A&A, 452, 245
- Nutter et al. (2006) Nutter, D., Ward-Thompson, D., & André, P. 2006, MNRAS, 368, 1833
- Olofsson et al. (2010) Olofsson, J., Augereau, J.-C., van Dishoeck, E. F., Merín, B., Grosso, N., Ménard, F., Blake, G. A., & Monin, J.-L. 2010, A&A, 520, A39
- Olofsson et al. (2011) Olofsson, J., et al. 2011, A&A, 528, L6
- Owen et al. (2011) Owen, J. E., Ercolano, B., & Clarke, C. J. 2011, MNRAS, 412, 13
- Owen et al. (2012) Owen, J. E., Clarke, C. J., & Ercolano, B. 2012, arXiv:1112.1087
- Orellana et al. (2012) Orellana, M., Cieza, L. A., Schreiber, M. R., et al. 2012, A&A, 539, A41
- Padgett (1996) Padgett, D. L. 1996, ApJ, 471, 847
- Piétu et al. (2005) Piétu, V., Guilloteau, S., & Dutrey, A. 2005, A&A, 443, 945
- Pinte et al. (2006) Pinte, C., Ménard, F., Duchêne, G., & Bastien, P. 2006, A&A, 459, 797
- Pott et al. (2010) Pott, J.-U., Perrin, M. D., Furlan, E., Ghez, A. M., Herbst, T. M., & Metchev, S. 2010, ApJ, 710, 265
- Preibisch et al. (2005) Preibisch, T., Kim, Y.-C., Favata, F., et al. 2005, ApJS, 160, 401
- Prugniel & Soubiran (2001) Prugniel, P., & Soubiran, C. 2001, A&A, 369, 1048
- Rafikov (2007) Rafikov, R. R. 2007, ApJ, 662, 642
- Ricci et al. (2010) Ricci, L., Testi, L., Natta, A., & Brooks, K. J. 2010, A&A, 521, A66
- Romero et al. (2012) Romero, G. A., Schreiber, M. R., Cieza, L. A., et al. 2012, ApJ, 749, 79
- Sault et al. (1995) Sault, R. J., Teuben, P. J., & Wright, M. C. H. 1995, Astronomical Data Analysis Software and Systems IV, 77, 433
- Schisano et al. (2009) Schisano, E., Covino, E., Alcalá, J. M., Esposito, M., Gandolfi, D., & Guenther, E. W. 2009, A&A, 501, 1013
- Siess et al. (2000) Siess, L., Dufour, E., & Forestini, M. 2000, A&A, 358, 593
- Skrutskie et al. (2006) Skrutskie, M. F., et al. 2006, AJ, 131, 1163
- Strom et al. (1989) Strom, K. M., Strom, S. E., Edwards, S., Cabrit, S., & Skrutskie, M. F. 1989, AJ, 97, 1451
- Tuthill et al. (2000) Tuthill, P. G., Monnier, J. D., Danchi, W. C., Wishnow, E. H., & Haniff, C. A. 2000, PASP, 112, 555
- Tuthill et al. (2006) Tuthill, P., Lloyd, J., Ireland, M., et al. 2006, Proc. SPIE, 6272,
- Williams & Cieza (2011) Williams, J. P., & Cieza, L. A. 2011, ARA&A, 49, 67
- Wilner et al. (2005) Wilner, D. J., D’Alessio, P., Calvet, N., Claussen, M. J., & Hartmann, L. 2005, ApJ, 626, L109
- Wolk & Walter (1996) Wolk, S. J., & Walter, F. M. 1996, AJ, 111, 2066
- Zhu et al. (2011) Zhu, Z., Nelson, R. P., Hartmann, L., Espaillat, C., & Calvet, N. 2011, ApJ, 729, 47
| Wavelength | Flux | Flux | Errora | Telescope | Referenceb |
|---|---|---|---|---|---|
| (m) | (mJy) | (mag) | (mJy) | ||
| 0.65 | 3.53e+00 | 14.85 | 30 | USNO-B1 | 1 |
| 1.2 | 1.04e+02 | 10.46 | 15 | 2MASS | 2 |
| 1.6 | 1.85e+02 | 9.36 | 15 | 2MASS | 2 |
| 2.2 | 2.02e+02 | 8.80 | 15 | 2MASS | 2 |
| 3.6 | 9.67e+01 | 8.66 | 10 | Spitzer | 3 |
| 4.5 | 7.10e+01 | 8.51 | 10 | Spitzer | 3 |
| 5.8 | 5.12e+01 | 8.37 | 10 | Spitzer | 3 |
| 8.0 | 3.28e+01 | 8.23 | 10 | Spitzer | 3 |
| 12 | 2.41e+01 | 7.80 | 10 | WISE | 4 |
| 22 | 2.54e+02 | 3.79 | 10 | WISE | 4 |
| 24 | 2.28e+02 | 3.74 | 10 | Spitzer | 3 |
| 70 | 7.13e+02 | 15 | Spitzer | 3 | |
| 850 | 2.10e+02 | 15 | JCMT | 5 | |
| 1300 | 8.18e+01 | 15 | SMA | 3 |
Note. — athe optical and near-IR uncertainties are dominated by the extinction corrections. bReferences: (1) Monet et al. 2003; (2) Skrutskie et al. (2006); (3) Cieza et al. (2010); (4) Cutri et al. 2011; (5) Nutter et al. (2006).
| Parameter | Adopted value |
|---|---|
| Stellar Teff [K] | 4350 |
| log g | 4 |
| Distance [pc] | 120 |
| Inclination [deg] | 50 |
| Grain size distribution slope, p | 3.5 |
| amin [m ] | 0.005 |
| amax [m] | 3900 |
| Parameter | Empty cavity | 2-component disk | Ring within cavity |
|---|---|---|---|
| [AU] | 39.7 5.6 | 38.2 5.3 | 42.7 3.7 |
| 22.7 1.6 | 25.6 1.4 | 27.3 2.1 | |
| log()[g/cm2] | 0.23 | 0.31 0.31 | 0.39 0.24 |
| -0.49 0.24 | 0.30 0.41 | 0.81 0.16 | |
| 0.014 0.003 | 0.018 0.002 | 0.019 0.002 | |
| 0.37 0.04 | 0.30 0.09 | 0.22 0.14 | |
| [AU] | 6.9 1.6 | ||
| log() | 2.0 0.4 | ||
| [AU] | 10.0 2.3 | ||
| [AU] | 2.2 0.15 | ||
| MJUP]a | 19 | 13 | 14 |
| Visibility (range)b | 14–38 | 12–27 | 26–50 |
| SED (range) | 89–109 | 24–33 | 27–33 |
| Visibility (adopted)c | 36 | 21 | 28 |
| SED (adopted) | 103 | 24 | 31 |
| Total (adopted) | 139 | 45 | 59 |
Note. — a is not a free parameter. It is obtained by integrating the surface density profile over radius and assuming a gas to dust mass ratio of 100. bThe range corresponds to the best-fit models of the five runs of the search algorithm for each disk parameterization. c The “adopted” value is that of the model that gives the best global fit to the data (i.e., the minimum value for Total = Visibility + SED).