11email: pgrosbol@eso.org 22institutetext: Instituto de Física, Univ. Federal do Rio Grande do Sul, Av. Bento Gonçalves 9500, 91501-970 Porto Alegre, RS, Brazil
22email: dottori@ufrgs.br
Star formation in grand-design, spiral galaxies††thanks: Based on observations collected at the European Southern Observatory, Chile; program: ESO 82.B-0331
Abstract
Aims. Spiral structure is a prominent feature in many disk galaxies and is often outlined by bright, young objects. We study the distribution of young stellar clusters in grand-design spiral galaxies and thereby determine whether strong spiral perturbations can influence star formation.
Methods. Deep, near-infrared JHK-maps were observed for ten nearby, grand-design, spiral galaxies using HAWK-I at the Very Large Telescope. Complete, magnitude-limited candidate lists of star-forming complexes were obtained by searching within the K-band maps. The properties of the complexes were derived from (H-K)–(J-H) diagrams including the identification of the youngest complexes (i.e. 7 Myr) and the estimation of their extinction.
Results. Young stellar clusters with ages 7 Myr have significant internal extinction in the range of AV=3-7m, while older ones typically have AV 1m. The cluster luminosity function (CLF) is well-fitted by a power law with an exponent of around -2 and displays no evidence of a high luminosity cut-off. The brightest cluster complexes in the disk reach luminosities of MK = -155 or estimated masses of 106M☉. At radii with a strong, two-armed spiral pattern, the star formation rate in the arms is higher by a factor of 2-5 than in the inter-arm regions. The CLF in the arms is also shifted towards brighter MK by at least 04. We also detect clusters with colors compatible with Large Magellanic Cloud intermediate age clusters and Milky Way globular clusters. The (J-K)-MK diagram of several galaxies shows, for the brightest clusters, a clear separation between young clusters that are highly attenuated by dust and older ones with low extinction.
Conclusions. The gap in the (J-K)-MK diagrams implies that there has been a rapid expulsion of dust at an age around 7 Myr, possibly triggered by supernovae. Strong spiral perturbations concentrate the formation of clusters in the arm regions and shifts their CLF towards brighter magnitudes.
Key Words.:
galaxies: spiral – galaxies: structure – galaxies: star clusters: general – galaxies: star formation – infrared: galaxies – techniques: photometry1 Introduction
A large fraction of the star formation in the local universe occurs in gas-rich, disk galaxies as indicated by the Schmidt-Kennicutt law (Schmidt 1959; Kennicutt 1989), which relates the star formation rate (SFR) to the surface/volume density of gas at kpc scales. The influence of spiral structure on the global SFR of galaxies is limited as indicated by the small difference seen between multi-armed and grand-design spirals (Elmegreen & Elmegreen 1986). On smaller scales, the relation is less clear, partly owing to the low spatial resolution of gas maps (Bigiel et al. 2008), and may be influenced by local features such as resonances, shear, and spiral structures. This may indicate that the main effect of spiral structure is to concentrate the SFR into the arms rather than to change the global rate (Kennicutt 1998).
Seigar & James (2002) analyzed the SFR of 20 spiral galaxies, concluding that the SFR is enhanced significantly in the vicinity of their K-band arms and correlates well with the relative strength of shocks in arms. This led them to suggest that density waves trigger star formation in the vicinity of spiral arms.
The star formation in the arm and inter-arm regions of three spirals was studied by Foyle et al. (2010) using data from the ultraviolet to radio. They found that star formation in the inter-arm regions was significant and only marginally enhanced in the arms.
| Galaxy | Type | Bands | fwhm | m-M | D | s | PA | IA | Kl | Hl | Jl | Yl | Ns | |
|---|---|---|---|---|---|---|---|---|---|---|---|---|---|---|
| NGC~157 | Sc(s) I-II | YJHK | 0.37 | 23.9 | 31.28 | 18.0 | 32 | 40a𝑎aa𝑎aZurita et al. (2002) | 45a𝑎aa𝑎aZurita et al. (2002) | 20.19 | 20.71 | 21.27 | 21.75 | 2254 |
| NGC~1232 | Sc(rs) I | YJHK | 0.38 | 24.1 | 31.48 | 19.8 | 36 | 90b𝑏bb𝑏bvan Zee & Bryant (1999) | 30b𝑏bb𝑏bvan Zee & Bryant (1999) | 20.62 | 20.80 | 21.72 | 22.21 | 3177 |
| NGC~1300 | SBb(s) I.2 | YJHK | 0.55 | 24.0 | 31.46 | 19.6 | 52 | 87c𝑐cc𝑐cLindblad et al. (1997) | 35c𝑐cc𝑐cLindblad et al. (1997) | 19.80 | 20.30 | 21.18 | 21.30 | 614 |
| NGC~1365 | SBb(s) I | YJHK | 0.40 | 23.7 | 31.62 | 21.1 | 41 | 40d𝑑dd𝑑dPence et al. (1990) | 40d𝑑dd𝑑dPence et al. (1990) | 20.17 | 20.32 | 21.24 | 21.73 | 2417 |
| NGC~1566 | Sc(s) I | YJHK | 0.44 | 23.1 | 31.55 | 20.5 | 44 | 41e𝑒ee𝑒eHess et al. (2009) | 27e𝑒ee𝑒eHess et al. (2009) | 19.29 | 19.82 | 20.64 | 21.18 | 969 |
| NGC~2997 | Sc(s) I.3 | YJHKBrγ | 0.38 | 23.8 | 31.42 | 19.2 | 35 | 107f𝑓ff𝑓fGanda et al. (2006) | 32f𝑓ff𝑓fGanda et al. (2006) | 20.14 | 20.33 | 21.27 | 21.75 | 5313 |
| NGC~4030 | Sbc(r) I | YJHK | 0.44 | 23.6 | 31.99 | 25.0 | 53 | 27g𝑔gg𝑔gKnapen et al. (1993) | 44g𝑔gg𝑔gKnapen et al. (1993) | 19.70 | 20.19 | 20.76 | 21.26 | 1196 |
| NGC~4321 | Sc(s) I | YJHK | 0.66 | 23.7 | 32.07 | 26.0 | 83 | 153hℎhhℎhKuno et al. (2007) | 27hℎhhℎhKuno et al. (2007) | 19.32 | 19.81 | 20.74 | 21.66 | 1184 |
| NGC~5247 | Sc(s) I-II | YJHK | 0.41 | 23.7 | 31.77 | 22.6 | 45 | 97hℎhhℎhKuno et al. (2007) | 29hℎhhℎhKuno et al. (2007) | 19.79 | 20.65 | 21.26 | 21.75 | 2259 |
| NGC~7424 | Sc(s) II.3 | JHK | 0.41 | 24.3 | 29.88 | 9.5 | 19 | 44i𝑖ii𝑖iBecker et al. (1988) | 27i𝑖ii𝑖iBecker et al. (1988) | 20.80 | 21.23 | 22.21 | - | 6137 |
A study of cluster populations in 21 nearby spiral galaxies led Larsen & Richtler (1999) to conclude that the age distribution of clusters in disk galaxies shows no obvious peak, indicating that massive clusters are formed as part of an ongoing process rather than in bursts. They also concluded that the radial distribution of clusters follows that of the Hα surface brightness. Hubble Space Telescope (HST) high resolution observations (Larsen 2009) suggested that the initial cluster mass function in present-day spiral disks can be modeled as a Schechter function (Schechter 1976) with a cut-off mass MM☉.
There are only a small number of grand-design spirals with prominent arms at a distance where individual clusters can be analyzed. One such galaxy, NGC 5194, was studied by Scheepmaker et al. (2007, 2009). These authors found that the spatial distribution of the star clusters younger than 10 Myr shows the strongest correlation with the spiral arms, Hα, and radio continuum emission, and that this correlation decreases with age.
Most of these studies are based on Hα, UV, and visual broad-band observations, which are significantly biased by extinction. In spiral arms with prominent dust lanes, it is difficult to conduct a complete census of star forming regions and cluster complexes in the visible especially for the youngest ones, which may still be embedded in dust. In these cases, an almost unbiased, magnitude-limited sample can be obtained more readily in the near-infrared (NIR), where the attenuation by dust is much smaller (e.g. AK 0.1 AV).
In general terms, the K-band light from the disks of spiral galaxies is dominated by an old stellar population (Rix & Rieke 1993). Nevertheless, in a study of the NIR K-band images of spiral galaxies Grosbøl & Patsis (1998) noted that several grand-design spirals have bright knots along their arms. The alignment and concentration of these knots in the arms suggested that they were associated with young objects. This was confirmed by the NIR spectra of several knots in NGC 2997 (Grosbøl et al. 2006) displaying strong Brγ emission, which demonstrates that the knots are H II regions deeply enshrouded in dust. Both Brγ emission and NIR colors can be used as age indicators for sources younger than 10 Myr (Leitherer et al. 1999, hereafter SB99) and allow the study of the early phases of star formation, which are often hidden by dust.
A sample of 46 spiral galaxies was studied by Grosbøl & Dottori (2008), who found that around 70% of these grand-design spirals have a significant concentration of bright K-band knots in their arms. The NIR color-color diagrams of four of the galaxies with JHK photometry suggest that a significant fraction of the extended sources are complexes of young stellar clusters with ages 10 Myr that are reddened by several magnitudes of visual extinction. The brightest knots reach MK = -155 corresponding to stellar clusters or complexes with total masses of up to several M☉, accounting for the typical SFR of 1 M☉ yr-1 measured for the brightest grand-design spiral galaxies.
The main emphasis of our paper is to characterize the general distribution of clusters in grand-design spiral galaxies. Relying on NIR photometry, this study intends to provide a more complete sampling than in visual bands including highly reddened, young clusters in the arm regions. Our access to younger, partly embedded clusters allows us to estimate of extinction at early phases of star formation and thereby establish a clearer definition of the CLF. It is still unclear whether spiral structure can influence star formation on small scales (see e.g. Bigiel et al. 2008; Seigar & James 2002). The combination of NIR colors and spatial information offers a detailed view of the distribution of clusters as a function of their location relative to spiral arms. This is used to test whether strong spiral perturbations can affect local star formation.
A long-term objective, to be pursued in a forthcoming paper, is the study of the possible implications of the spatial distribution of newly formed clusters on the nature of spiral arms. The ability to estimate the individual ages of the youngest clusters (Grosbøl & Dottori 2009) could reveal spatial age gradients that can be compared with predictions for different spiral arms scenarios. It should be possible to distinguish between density wave (Lin & Shu 1964; Bertin et al. 1989; Roberts 1969; Gittins & Clarke 2004) and material arms (Wada et al. 2011) owing to their different relative angular velocities. In addition, the contrast between star formation in arm and inter-arm regions (Seigar & James 1998, 2002) could be used as an indicator of the ongoing mechanism. However, owing to the intrinsic velocity dispersion of clusters and the limited age resolution, the current data cannot be used to estimate the longevity of spirals, that is whether they are long-lived quasi-stationary spiral structures resulting from density waves (Fujii et al. 2011) or transient spiral patterns that occur because of recurrent gravitational instabilities (Foyle et al. 2011; Sellwood 2010, 2011).
In the current paper, we first present the NIR data and describe the identification of the stellar cluster complexes and extraction of their properties. Color-color and color-magnitude diagrams of the cluster complexes are presented in Sect. 4 with a discussion of the implications for their physical properties. Star formation rates and CLFs are derived in Sects. 5 and 6. The general distribution of cluster complexes in the arm and inter-arm regions is given in Sect. 7. The appendices includes descriptions, maps, and diagrams for the individual galaxies.
2 Data and reduction
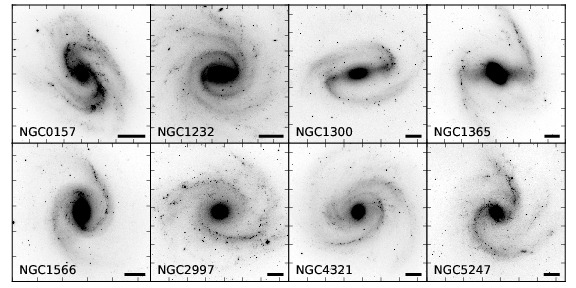
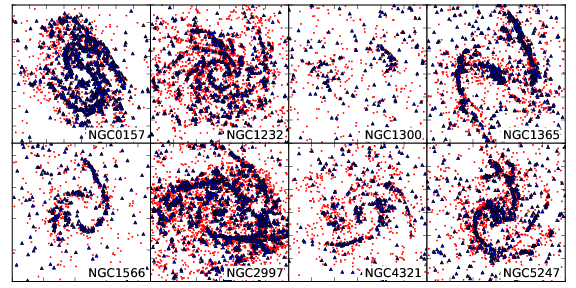
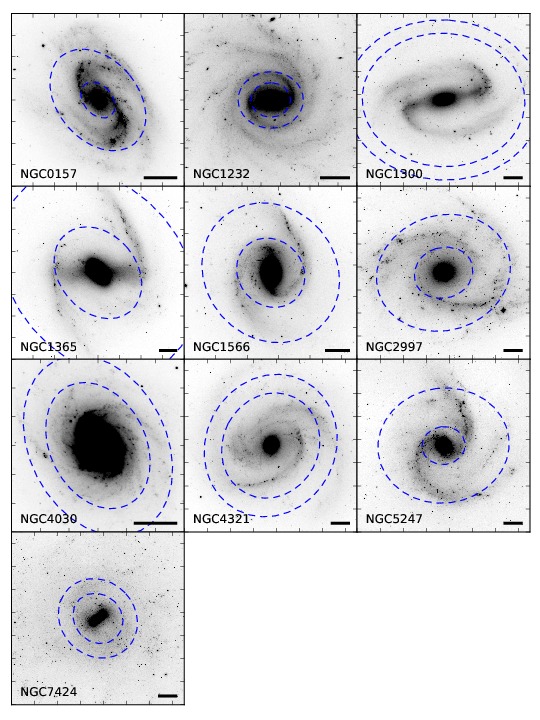
Eight grand-design galaxies with relatively high SFRs and concentrations of stellar clusters in their arms were selected from the list of Grosbøl & Dottori (2008). The candidates were selected to have inclination angles IA 45° and a geometry that made it possible to map their spiral structure unambiguously. To get a reasonable range of morphological types with strong spiral perturbations, including bars, it was necessary to include galaxies with distances up to around 25 Mpc. Two grand-design spirals with weak spiral arms (i.e. NGC 1232 and NGC 7424) were added to allow a comparison of properties as a function of perturbation strength. The galaxy NGC 7424 has an estimated distance of 10 Mpc, which permits a study of its faint clusters and therefore a more reliable estimate of the shape of the cluster distribution at low masses. The galaxies are listed in Table 1 where their morphological types according to Sandage & Tammann (1981, hereafter RSA) are also given. Although only two galaxies are classified as strongly barred, all the other galaxies display weak bars or oval distortions in their central regions on their K-band maps. The eight main grand-design galaxies in the sample are shown in Fig. 1. All the galaxies are displayed in Appendix A, where a short description of their morphology is also given.
The galaxies were observed with the HAWK-I/VLT instrument, which employs a mosaic of 4 Hawaii 2RG 20482048 chips with a total field of 7′ and a pixel size of 0.106″. All observations were performed in service mode except for NGC 7424, which was acquired during the HAWK-I commissioning. We designed a single observing block for each galaxy, including the 4 broad-band filters, in service mode to ensure that the observing conditions were as similar as possible. Target and sky exposures were interleaved with a maximum duration of 3m between empty field exposures to allow accurate sky subtraction. Typical total exposure times on source were for Ks in the range 9-12m, while they were 7m, 4m, and 4m for the filters H, J, and Y, respectively. In addition, a Brγ-frame with a total exposure of 24m on source was secured for NGC 2997. The individual frames were offset to ensure that all parts of the galaxies were exposed including the 15″ gaps between the chips. A minimum of four frames were taken for the J- and Y-bands which required shorter exposure times. In these cases, parts of the field were covered by only one or two exposures, reducing the ability to reject bad pixels and cosmic ray events there.
A dedicated, ESO-MIDAS based pipeline was used for the data reduction because a generic template, which is not supported by the standard ESO pipeline, was used for the observation. The observatory-provided dark and flat-field frames were used. Since the flats were taken during the morning and evening, they may contain small gradients. A low-order, polynomial correction was applied to the observatory flats estimated from stacked sky exposures obtained during the nights. The sky frames were inspected visually and rejected if odd features were seen. Furthermore, all discrete sources detected on them were removed. The average of adjacent sky exposures was then subtracted from the target frames. The resulting frames had to be re-sampled before stacking because the different detector chips were not perfectly aligned. A nearest pixel algorithm was applied since the pixel size was significantly smaller than the average seeing of the frames and an interpolation would smear out bad pixels. The transformation constants including gains for the individual chips were taken from the instrument manual and applied.
The galaxy frames were aligned to within one pixel using stars in the field and centered on the K-band intensity peak of their bulges. The quality of the individual frames was checked by comparing the magnitude and seeing of a bright field star, which in a few cases led to the rejection of frames. Bad pixels and outliers could be identified when at least three frames were available. These pixels were omitted when their inclusion would have significantly increased the variance around the mean (Grosbøl et al. 2004). Only for NGC 1566, observed in rather variable conditions, was it necessary to remove a frame from the J and Y stacks. This left an unexposed square of 1515″ close to the center of NGC 1566 in the J- and Y-maps.
The HAWK-I field size allowed the use of foreground stars from 2MASS (Skrutskie et al. 2006, hereafter 2MASS) for the photometric calibration. The uncertainty in the photometric zero points was smaller than 008 for all maps based on 7-60 2MASS stars depending on Galactic latitude of the fields. For the Y-band, 2MASS magnitudes were estimated from the transformation by Hodgkin et al. (2009) for the WFCAM instrument with similar filters. Using these 2MASS stars, astrometric transformations were also derived with typical errors of 0.2″. The full-width at half-maximum (fwhm) of stellar images on the final, stacked Ks-maps is listed in Table 1 where the surface brightness for a signal-to-noise ratio of five per pixel is also given. The other bands had similar seeing and surface brightness limits. All non-stellar sources were corrected for foreground absorption due to our Galaxy using the maps of Schlegel et al. (1998) provided by the NASA/IPAC Extragalactic Database (NED).
The distance moduli for the galaxies were derived from their systemic velocities relative to the 3K CMB using a Hubble constant of 73 km s-1 Mpc-1 as given by NED. They differ significantly in several cases from those obtained using the Galactic standard-of-rest (de Vaucouleurs et al. 1991, hereafter RC3), such as for NGC 2997 for which the distance adopted places the galaxy almost 60% further away. The 3K CMB corrections were preferred since they gave more consistent magnitudes for the brightest sources in the galaxies. The distances adopted are listed in Table 1 together with the linear resolution corresponding to the fwhm. For most of the galaxies, sources with a size of 50 pc could be resolved. This does not allow us to identify individual stellar clusters but rather complexes of clusters and star forming regions. The scale is compatible with that of typical giant molecular cloud (GMC) sizes suggesting that the sources detected are associated with individual GMCs.
3 Detection of sources
We performed our search for sources with SExtractor v.2.8.6 (Bertin & Arnouts 1996) on the K-band frames since they are less affected by dust extinction and are therefore expected to yield a less biased list of candidates. The steep flux gradients in the central parts of the galaxies significantly limited the detection of faint sources in these regions. To remove these gradients, a smoothed version of the K images was subtracted before applying the search. The smoothed image can be generated by using either a parametric model fitted to the surface brightness distribution of the galaxy or digital filtering. The latter option was preferred to avoid any bias being caused by the model adopted. The filter consisted first of a median filter with a kernel of 5″ squared followed by a Gaussian smoothing to reduce the noise level. This retained all sources with significant gradients on scales smaller than the filter size, while removing the smooth variation due to the spiral arms, exponential disk, and bulge, except in the central 5-10″ of the galaxies. It allowed the use of a large background mesh for SExtractor. The search was performed with a convolution mask of a fwhm of two pixels corresponding to half of the typical seeing. A detection threshold of 2.5 times the background noise was used and only sources with at least four pixels were accepted.
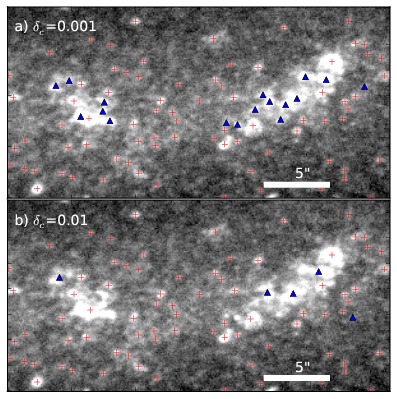
Several large and complex sources exist along the spiral arms. They were occasionally separated into individual objects depending on the SExtractor de-blending contrast threshold parameter . A typical complex region in the southern arm of NGC 2997 is displayed in Fig. 2, where sources detected with two different values of are shown. Without the resolution to resolve individual stellar clusters, the choice of the ’best’ value for is subjective. Comparing several different complex regions, was found to yield a reasonable separation and was used for the final search.
The class_star estimator, , provided by SExtractor was used to indicate the shape of sources where corresponds to star-like images and to diffuse ones. Sources with were assumed to be foreground stars. The distributions of non-stellar sources in the eight main targets are shown in Fig 4. It is clear that the diffuse sources () outline the spiral structure more clearly than the compact ones, which are more randomly distributed within the galaxies. Only for two of the galaxies is this not the case, namely for NGC 1300 where the main star formation occurs at the end of its bar, and for NGC 7424, which has a weak spiral perturbation. All the galaxies are displayed in Fig. 15.
The centroids of the candidates found by this procedure were then used to calculate the magnitudes in each available band. Both aperture and isophotal magnitudes were estimated since they have somewhat different properties and do not assume a specific shape of the source. The former was based on an aperture with a diameter of 1″ and a background area consisting of a 2″ ring with a radius of 4″, to which a -clipping filter was applied. Isophotal magnitudes were computed by mapping the Ks-band pixels across a region of 4″ around the centroid into either ‘source’ or ‘background’ pixels. This was done by moving out from the local maximum near the centroid in a spiral pattern, while monitoring the pixel values. The background level was estimated as the minimum value within the region for which no significant gradient could be determined. Using this level and the associated standard deviation, the pixels were classified as ‘source’ if they were within the fwhm of or above the background, while all pixels consistent with the level were flagged as ’background’. The isophotal magnitude of a source was computed using this map for all the bands, which ensured that the same set of pixels was used to calculate color indices. We insisted that a source had more ‘background’ than ’source’ pixels.
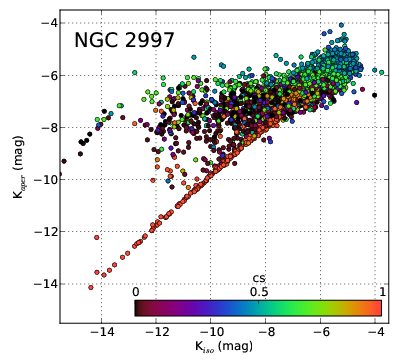
The two types of magnitudes are compared in Fig. 3, where they are shown for objects detected in NGC 2997. Bright, stellar-like sources show a good correlation with a slope of unity. By definition, isophotal magnitudes do not record the same fraction of flux at all magnitude levels. This effect may approach 05 for the faintest magnitude used in this sample. Aperture magnitudes may also be brighter when other sources, in crowded fields, are included in the aperture. The opposite trend is seen for brighter sources, where many non-stellar objects are more luminous according to their isophotal magnitude than that computed for a fixed aperture. The effect appears for instrumental magnitudes -8m for which typical non-stellar objects have more ’source’ pixels than the aperture used (i.e. approx. 280 pixels). This suggests that the aperture estimate misses flux associated with the source because of its fixed size. In general, aperture magnitudes give a more reliable and consistent measure of the fluxes associated with the individual sources and were used in the current study. The photometric data for the sources detected in the galaxies are available in digital form from CDS222Centre de Données astronomiques de Strasbourg: http://cds.u-strasbg.fr. These tables contain the aperture photometry for each filter with associated estimates of the error and background. In addition, we provide the coordinates and index. The estimation of the total flux for the largest, most complex sources can be obtained more accurately from isophotal magnitudes but remains uncertain owing to the arbitrary division into substructures (i.e. choice of de-blending threshold ).
For a typical galaxy in the sample with a disk of 10 arcmin2, the contribution of background galaxies is 9712 sources with K20m or 448 with K19m using the estimates derived by the GalaxyCount program (Ellis & Bland-Hawthorn 2006). To limit the number of these galaxies in the sample, only sources within the galactic disks were assumed to be defined when their Ks-band background surface brightness was 3 above sky.
The limiting magnitudes were estimated from the histogram of apparent magnitudes as the number weighted average of the highest bin and its two neighbors. Comparing with simulated fields of sources with a power-law luminosity function, the estimate corresponds to roughly 90% completeness. The total number of non-stellar sources for which aperture photometry could be estimated is given in Table 1, where limiting magnitudes for all filters are also listed.
4 Distribution of magnitudes and colors
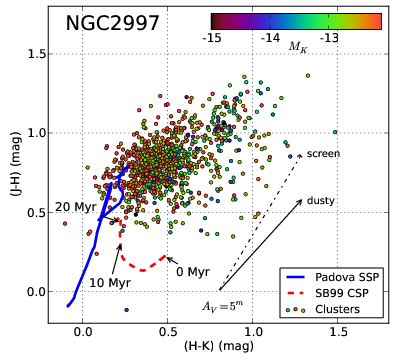
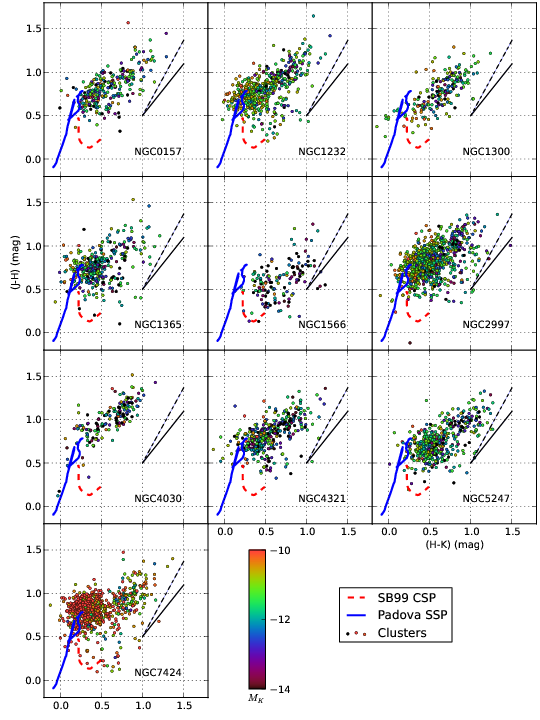
A main tool for the study of the physical properties of the unresolved cluster complexes is their integrated colors and magnitudes. A typical (H-K)–(J-H) color-color diagram (CCD) is shown in Fig. 5 for non-stellar sources in NGC 2997 with photometric errors 005. For reference, two evolutionary tracks are shown for a stellar population with metallicity Z=0.02, a Salpeter initial mass function (IMF) (Salpeter 1955), and an upper mass limit Mu = 100 M☉. The full drawn curve is a single-burst stellar population (SSP) based on the Padova isochrones (Marigo et al. 2008) including the post thermal-pulse asymptotic-giant-branch (TP-AGB) phase. The other track represents a continuous star formation population (CSP) from SB99 indicated by a dashed line. The shift between the two tracks is mainly due to the dust and nebular emission that is included in the SB99 models. Even though NIR extinction is much smaller than in the visual bands, it is still significant. As a first order compensation for attenuation by dust, one can construct a reddening ‘corrected’ color index Q assuming a linear correction term. We consider two extreme cases: a screen model of the dust, which would yield Qs = (H-K) - 0.563(J-H) (Indebetouw et al. 2005), and a mix of stars and dust giving Qd = (H-K) - 0.844(J-H) (Witt et al. 1992; Israel et al. 1998). Both reddening vectors are indicated in Fig. 5 for a visual absorption AV = 5m.
Two main concentrations of sources can be identified in the CCD, namely a) one of the complexes around ((H-K),(J-H)) = (04, 08), which corresponds to a stellar population older than 20 Myr and relatively low extinction, and b) a weaker one close to (08, 11), which is compatible with younger and more obscured complexes. The remaining clusters are more homogeneously scattered to higher (H-K). Their colors can be mainly modeled by SB99 adding specific amounts of extinction and they are likely younger than 7 Myr. However, to model those clusters with the reddest (H-K), one would need to add a significant amount of emission from hot dust. We note that none of these young complexes has a visual extinction of less than 2m. Somewhat depending on the reddening assumed, there is a tendency for younger sources to have a higher extinction.
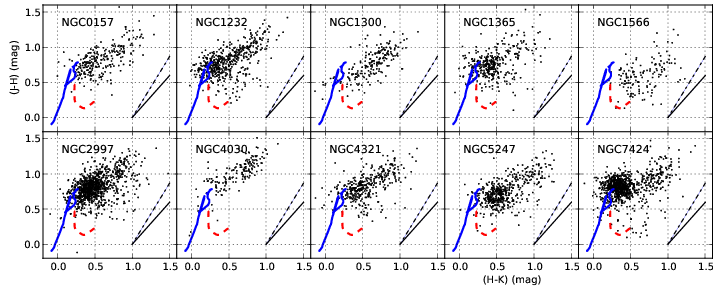
The color-color diagrams for all the galaxies are given in Fig. 6 for comparison. Taking NGC 2997 as a reference, all the CCDs share the same basic features, although with different emphasis. The position of the clump at the older end of the cluster tracks varies only slightly among the galaxies with the exception of NGC 1566. In this galaxy, we recognize the same morphology in the color-color diagram, but all complexes are shifted almost 03 towards higher Q values. This may partly result from the variable weather conditions under which it was observed as mentioned in Sect. 2. The clump of older complexes contains a larger fraction of faint sources, which makes its population size sensitive to the limiting magnitude. This effect can be observed by comparing the CCDs of NGC 2997 and NGC 4321, where the former has a 15 deeper limiting magnitude in MK. There are also intrinsic differences between the galaxies that can be seen for galaxies with similar limiting absolute magnitudes, e.g. NGC 2997 has more old complexes than NGC 1232, and NGC 4321 has more than NGC 4030.
The concentration of objects with higher (J-K) values, near (08, 12), is present for all galaxies, although the gap to the older clump is most clearly seen in NGC 2997, NGC 5247, and NGC 7424. Comparing the relative position of the two concentrations with the reddening vectors, it is evident that the objects with higher (H-K) cannot be explained by older sources being attenuated by dust since they would get higher (J-H) values than observed. This shift can best be explained by the sources being younger in addition to having high extinction. The young, dusty objects in NGC 7424 are shifted even more strongly to higher (H-K) values. This could, in part, be due to the higher linear resolution, which reduces the probability of several clusters being included in one target aperture. Without spectroscopic data, it is impossible to accurately estimate the physical properties of the complexes. Variations in nebular emission and cluster IMF can shift the location of sources in the CCD by at least 01. Systematic differences in the amount of bright, red, post TP-AGB stars (i.e. 2m (J-K)) between the clusters could also play a role. Full-scale CCDs for the galaxies are also shown in Fig. 16.
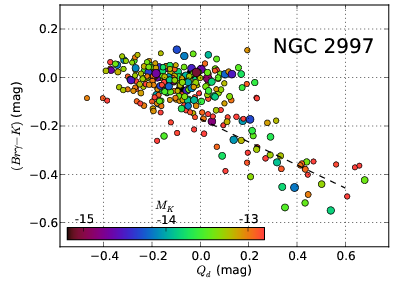
The evolutionary tracks from SB99 indicate that the youngest clusters display strong Brγ and nebular emission. The emission decreases with time and vanishes around 7 Myr in a way that depends slightly on the model parameters. This suggests that the Q index, due to the emission in the Ks-band, can be used as an age indicator for clusters younger than 7 Myr. This was tested using Brγ exposures of NGC 2997, which has a systemic velocity that permits the HAWK-I Brγ-filter to be used. The index (Brγ-K), with a zero point defined by the foreground stars, is shown in Fig. 7 as a function of the Qd index. The relation (Brγ-K) = -0.48 Qd - 017 is determined, with a scatter of 008 for the 55 clusters with significant Brγ-emission (i.e. (Brγ-K) -01) and errors in Brγ003. This confirms that Qd can be used to estimate the Brγ-emission and the age of clusters with 01 Qd for which the contamination of older clusters is small. For Qd01, the index shows little variation and cannot be used as an age indicator. The equivalent width of Brγ in emission was previously calibrated as an age indicator using SB99 models and K-band spectra (Grosbøl et al. 2006).
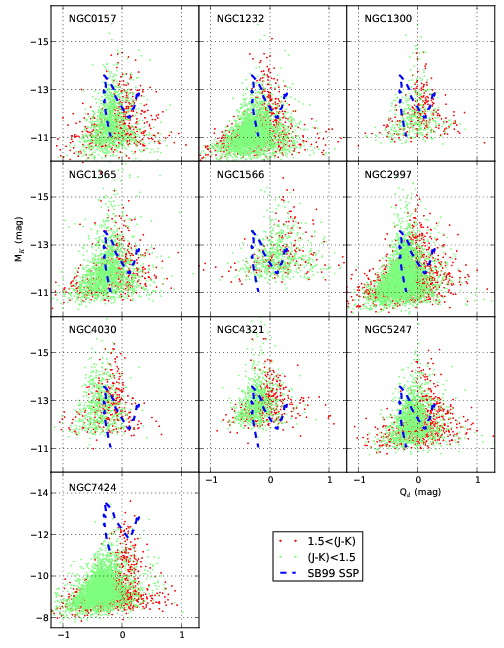
Color-magnitude diagrams (CMD) for NGC 2997 are given in Fig. 8 using the Qd and (J-K) color indices, which are roughly orthogonal. For clusters with Qd01, Qd indicates age, whereas (J-K) relates to extinction. An evolutionary track for Padova and SB99 SSP models with 105 M☉ mass is shown for reference. The exact location of the track depends on both the upper mass limit Mu and the upper slope of the IMF, while changes in the metallicity around the solar value are of little importance. The upper limit to Qd is closer to 05, which corresponds well to the SB99 models with M 60 M☉. The relatively few complexes with higher Qd values are likely affected by emission from hot dust. There is a tail of faint sources reaching negative values of Qd around -05. Many of these are probably globular clusters that are similar to Galactic ones, which have an average Qd = -04. The Qd distribution is narrower for brighter complexes partly due to their higher average extinction implied by the CCD. The brightest complexes have MK reaching around -155, which corresponds to masses close to 106 M☉ assuming a standard SB99 SSP model.
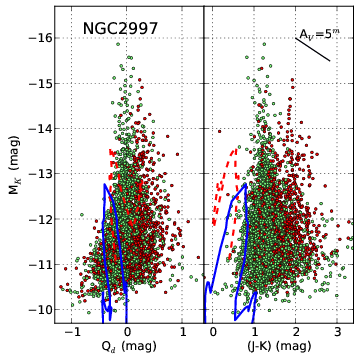
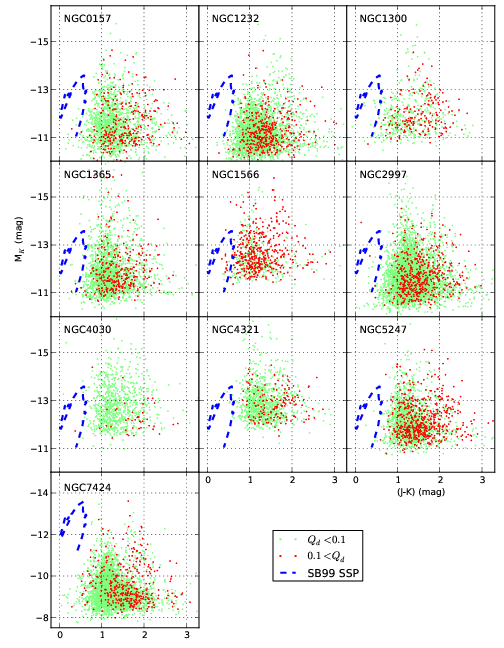
The right panel of Fig. 8 displays the (J-K) index, which shows more clearly than (H-K) the effects of extinction. For faint sources, the lower boundary of (J-K) is sharp, in good agreement with the tracks for old clusters with AV1m. The youngest sources dominate the high (J-K) values and display a significant scatter due to variable extinction. They form a well-defined branch with (J-K) 18 that is clearly separated from the bright, older sources with (J-K) around 12. The model tracks predict that youngest clusters should have (J-K) close to 00 and then approach values in the range of 0.5-1m when massive blue stars evolve to red super-giants. If the extinction varied only slowly with age, one would not expect there to be a separation between the young and old complexes in two branches. Thus, the gap suggests that there has been a rapid reduction of extinction, which could happen when the first supernovae explode and dust is expelled from the cluster environment (Lada & Lada 2003; Bastian & Goodwin 2006; Goodwin & Bastian 2006).
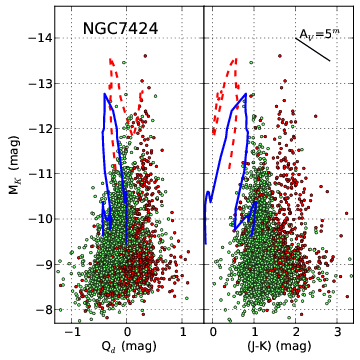
The CMDs for NGC 7424 are presented in Fig. 9 and are similar to those of NGC 2997, except that its cluster population is almost 3m fainter. It also has a group of bright, young clusters around (J-K) = 18 that is separate from the older ones close to 12. The populations of the two branches as a function of MK are more similar than in the case of NGC 2997. For the faintest magnitudes below -9m, one starts to see old objects with (J-K)2m, which may be individual post TP-AGB stars. The CMDs for all galaxies are available in Figs. 17 and 18.
| Galaxy | MKi | MKa | N12 | Ny | No | ||
|---|---|---|---|---|---|---|---|
| NGC 157 | -17.8 | -14.6 | 453 | 1.62 | 107 | 2.38 | 369 |
| NGC 1232 | -16.5 | -14.6 | 354 | 2.37 | 142 | 2.54 | 768 |
| NGC 1300 | -15.9 | -14.8 | 214 | 1.57 | 97 | 2.00 | 193 |
| NGC 1365 | -18.7 | -15.1 | 705 | 1.97 | 215 | 2.15 | 942 |
| NGC 1566 | -17.8 | -15.3 | 702 | 1.75 | 339 | 2.62 | 169 |
| NGC 2997 | -17.6 | -15.2 | 1216 | 2.29 | 189 | 2.49 | 1396 |
| NGC 4030 | -19.0 | -15.4 | 791 | 2.25 | 45 | 2.31 | 268 |
| NGC 4321 | -17.4 | -15.6 | 1066 | 1.71 | 120 | 2.44 | 463 |
| NGC 5247 | -17.6 | -15.1 | 974 | 2.19 | 279 | 2.72 | 599 |
| NGC 7424 | -14.1 | -12.6 | 40 | 1.76 | 512 | 2.38 | 520 |
5 Luminosity function of clusters
Two basic, non-parametric estimates of the luminosity function for the population of cluster complexes in the galaxies are the brightest complex and the numbers of sources above a given magnitude limit. The fifth brightest non-stellar source was used as an estimator to reduce the influence of background galaxies since fewer than five of these galaxies are expected for Ks165 according to GalaxyCount. Many of the brightest sources have sizes exceeding the 1″ aperture used for the standard photometry. Although aperture magnitudes still are the more robust indicator of the luminosity of compact sources, isophotal magnitudes may give a more realistic estimate of the total flux coming from the largest star-forming complexes. The fifth brightest complex for each galaxy is listed in Table 2 as MKi and MKa for the isophotal and aperture magnitudes, respectively. Nuclear complexes (i.e. ″) were excluded as they are often significantly brighter than those in the disk. In NGC 1365 and NGC 4321 in particular, many complexes in the central region were identified with aperture magnitudes reaching -155. Owing to the inclusion of flux from a larger area, MKi is 2-3m brighter than MKa depending on the morphology of the individual regions. As an estimate of the flux originating from a cluster complex of a single GMC, the aperture magnitude is accurate because of the close match between the aperture used and the typical, linear sizes of GMCs.
The size of the cluster population is estimated from the number of non-stellar sources brighter than a given magnitude. A limit of MK=-12m was used as a compromise between including some clusters in NGC 7424 and being brighter than the limiting magnitude for most of the galaxies. Only three galaxies (i.e. NGC 1566, NGC 4030, and NGC 4321) did not fully reach -12m at a 90% completeness level (see Table 1). The number of these complexes is given as N12 in Table 2.
The analytical form of the cluster luminosity function is normally approximated by either a power law or a Schechter function, which adds an exponential cut-off at high luminosities. It is important to avoid bins affected by incompleteness at the faint end of the distribution as well as high luminosity outliers (e.g. background galaxies). The fixed aperture used for the photometry can lead to underestimates of the brightest luminosities estimated for large complexes (see Fig. 3), which can be shifted, for sources with a surface area exceeding the aperture, to fainter values that depend on their surface brightness. This uncertainty in determining magnitudes for the brightest sources made it inappropriate to use a Schechter function to fit the luminosity function.
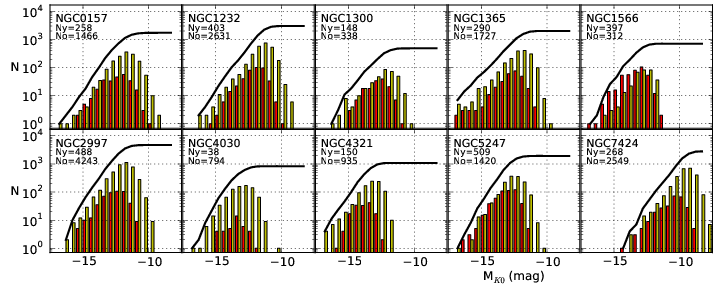
Even though the K-band is less affected by extinction than visual bands, it is still important to correct for dust attenuation especially for the younger complexes, which may have AK reaching almost 1m. The distributions of extinction-corrected absolute magnitudes M are shown in Fig. 10, where the cumulative cluster luminosity functions are indicated by full drawn lines. The distributions of the young objects have flatter peaks that are shifted to brighter magnitudes than those of the old ones: This is mainly due to the higher extinction corrections applied to the younger population of complexes. The equal size of the two populations for the brightest bins is consistent with the mass-independent disruption of clusters found by Chandar et al. (2010a) for the Large Magellanic Cloud (LMC).
The histograms provide evidence of neither a significant high luminosity cut-off nor a steepening of CLF slopes for bright clusters, except possibly for young complexes in NGC 4030 and NGC 4321. In the magnitude range where both young and older cluster populations are complete, they have comparable sizes with two exceptions, namely NGC 1566 with an excess of young clusters and NGC 4030, which has a deficiency. Power laws were fitted to the young and old populations separately with a luminosity range estimated visually from the M distributions. The exponents and number of sources used are given in Table 2 and show values of in the range of 1.6-2.4 for the younger population while the older ones are slightly steeper. It is unclear whether this trend is significant because of the corrections for extinction, which for the young complexes can reach 1m in the K-band.
6 Star formation rate
An estimate of the SFR can be derived from the population of young clusters assuming that they follow a given evolutionary track. Using a SB99 SSP model with M M☉, a Salpeter IMF, and metallicity Z=0.02, a cluster with a mass of 106M☉ has an absolute magnitude MK -156 during first few Myr. Clusters become fainter by almost a magnitude when their massive stars start evolving to the AGB after which they brighten again, as seen on the evolutionary tracks in Fig. 8 and Fig. 9. A CSP model has a smoother variation in color indices and an increasing luminosity with time depending on its SFR. The SFR of the galaxies, associated with complexes observed above the limiting magnitude, was calculated by summing up all sources with 01Qd assuming that they are younger than 7 Myr (as given by the CSP model) and their masses are proportional to their luminosity with 106M☉ corresponding to M=-155. This value gives a good estimate of the current SFR (i.e. within the last 7 Myr) since it is little affected by extinction, in contrast to estimates relying on UV or Hα fluxes which may be absorbed in dust lanes. The contribution of clusters below the limiting magnitude can be estimated by integrating the CLF power-law fit to the young population of complexes down to a given limit. Using the exponents listed in Table 2 and a lower cluster mass of 100 M☉, the total SFRt was computed. These estimates suffer the uncertainty given by the power-law extrapolation over several orders of magnitude. In contrast, they are independent of the different limiting magnitudes and indicate more clearly the relative star-formation activity in the galaxies. Both current observed SFR and extrapolated total SFRt for the galaxies are listed in Table 3, where we also quote SFR estimates for eight galaxies from the literature. Our values are two-to-three times higher for six of the galaxies, possibly owing to the lower extinction in NIR. A large amount of star formation in the central parts of NGC 1566 and NGC 4030 may be the reason for our lower SFR estimates for these galaxies since crowding and steep gradients could reduce the completeness of our sample. The two galaxies also exhibit the largest differences between bright complexes as measured by isophotal and aperture magnitudes (see Table 2).
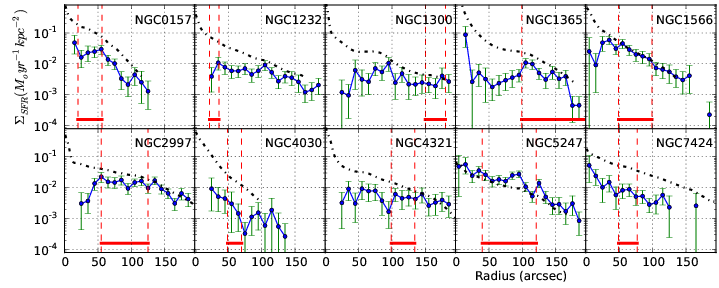
The variation in the SFR per unit area, , as a function of Galactocentric distance is shown in Fig. 11 using the projection parameters listed in Table 1. The errors are dominated by statistical variations caused by the relatively small number of clusters in each bin. The mean, radial Ks surface brightness of the disk is indicated using a zero point of 667 Jy (Cohen et al. 2003). We note that follows the Ks surface brightness of the disk in most cases with the exception of the bar regions (see e.g. NGC 1300, NGC 1365, NGC 1566, NGC 2997, and NGC 4321). The relatively lower in the bar regions may be caused by either the radial redistribution of material (e.g. gas) or a lower star formation efficiency. Comparing the radial range of the strong, two-armed spiral patterns in the galaxies with the radial variation in , one does not see any significant change. This agrees with the results obtained by Elmegreen & Elmegreen (1986) and Kennicutt (1998) in the sense that a strong spiral perturbation does not significantly affect the total .
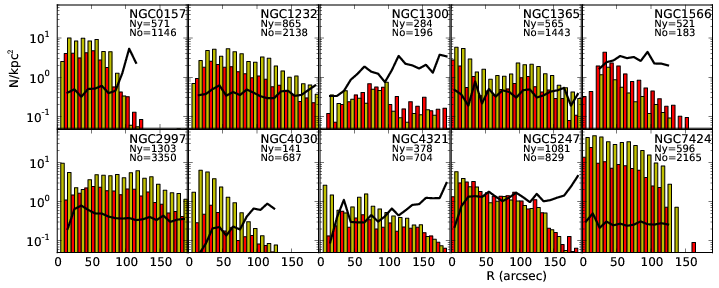
The surface density of young and older non-stellar sources in 10″ annular bins is shown in the on-line material Fig. 19. The radial variations in the two populations follow each other fairly well in the logarithmic plot indicating that their ratio is approximately constant. Only NGC 1566 has a significant excess of young sources, which is mainly due to its relatively bright limiting magnitudes restricting the number of older complexes found.
| Galaxy | SFR | log(SFRt) | ri | ro | PQ | PM | M | M | N | N | Ra:i | SFRlit |
|---|---|---|---|---|---|---|---|---|---|---|---|---|
| NGC 157 | 3.8 | 2.16 | 20 | 56 | 0.32 | 0.00 | -12.9 | -12.4 | 43 | 22 | 3.5 | 0.64a𝑎aa𝑎aSempere & Rozas (1997), 0.73b𝑏bb𝑏bMoustakas & Kennicutt (2006) |
| NGC 1232 | 4.2 | 3.61 | 22 | 36 | 0.32 | 0.00 | -11.9 | -11.7 | 13 | 4 | 4.5 | 2.1c𝑐cc𝑐cOmar & Dwarakanath (2005) |
| NGC 1300 | 3.6 | 1.57 | 150 | 180 | 0.20 | 0.93 | -12.8 | -13.0 | 16 | 10 | 1.1 | 1.4c𝑐cc𝑐cOmar & Dwarakanath (2005), 1.7d𝑑dd𝑑dSchulman et al. (1997) |
| NGC 1365 | 5.5 | 2.75 | 99 | 220 | 0.00 | 0.00 | -12.8 | -12.7 | 129 | 37 | 2.2 | 11.3e𝑒ee𝑒eElmegreen et al. (2009) |
| NGC 1566 | 10.9 | 2.86 | 49 | 99 | 0.08 | 0.01 | -13.8 | -13.5 | 114 | 36 | 5.6 | 9.6f𝑓ff𝑓fThilker et al. (2007) |
| NGC 2997 | 10.0 | 4.08 | 55 | 125 | 0.37 | 0.00 | -12.9 | -12.4 | 142 | 63 | 3.1 | 3.7g𝑔gg𝑔gKodilkar et al. (2011) |
| NGC 4030 | 1.4 | 3.42 | 49 | 70 | 0.45 | 0.00 | -13.9 | -13.1 | 2 | 3 | – | 11.3f𝑓ff𝑓fThilker et al. (2007) |
| NGC 4321 | 8.1 | 2.62 | 99 | 134 | 0.97 | 0.24 | -13.8 | -13.5 | 22 | 22 | 1.2 | 5.2b𝑏bb𝑏bMoustakas & Kennicutt (2006), 18.5f𝑓ff𝑓fThilker et al. (2007) |
| NGC 5247 | 13.7 | 4.23 | 40 | 121 | 0.16 | 0.00 | -13.1 | -12.8 | 180 | 82 | 1.9 | – |
| NGC 7424 | 0.7 | 0.71 | 49 | 77 | 0.70 | 0.20 | -10.2 | -10.1 | 37 | 33 | 1.7 | – |
7 Spatial distribution
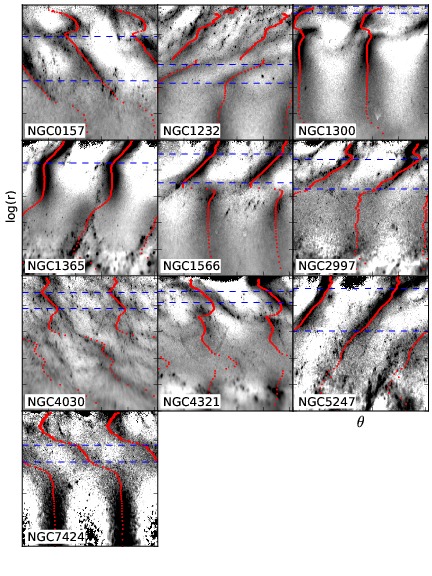
The positions of sources within the galaxies were computed from the projection angles given in Table 1 assuming that they were located in the plane of the disk. The shape of the spiral pattern was derived from 1D fast Fourier transforms (FFT) of the azimuthal, K-band intensity variation in 1″ radial bins. The radial range of the main, two-armed spiral pattern was estimated by comparing amplitude and phase of the m=2 component, which is shown in - diagrams in Fig. 14. The regions occupied by a symmetric, logarithmic spiral arms are listed in Table 3.
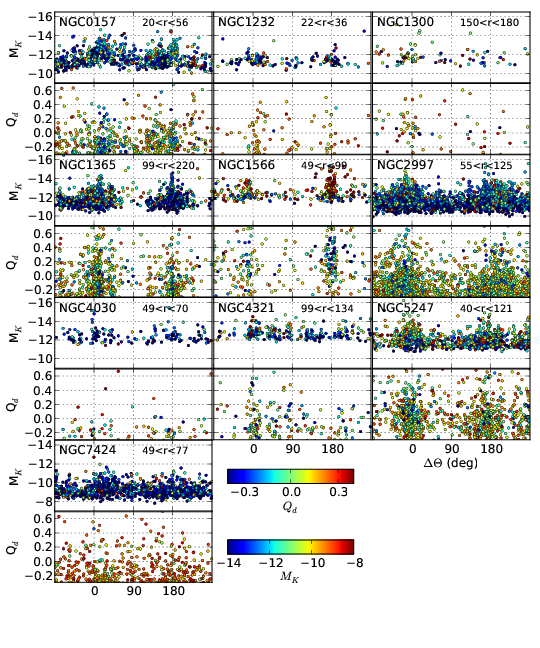
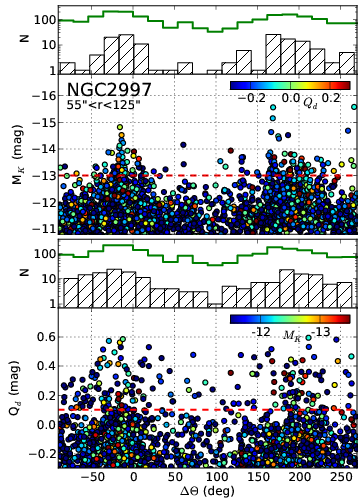
The azimuthal distribution of complexes relative to the two-armed spiral is shown in Fig.12 for NGC 2997, considering only the radial range with a strong, symmetric pattern. The upper panel displays the absolute magnitude MK, which for sources brighter than -13m shows a strong concentration in the arm regions. Fainter clusters have a smoother distribution as a function of azimuth that also varies in phase with the arms. A similar behavior can be seen in the lower panel, which shows the Qd index. Young complexes with 01Qd are mainly located in the arms, while the older population has a smaller azimuthal variation. The concentration in the arms is stronger for the younger and brighter complexes. This general trend is confirmed for all the galaxies (see Fig. 20) but is more clearly seen when the spiral perturbation is strong, as in NGC 1365, NGC 1566, NGC 2997, and NGC 5247.
To investigate general differences in the cluster distributions relative to the spiral pattern, arm regions were defined as a 90° azimuthal interval centered on the phase of the m=2 FFT component, yielding equal areas of arm and inter-arm regions. This definition allows us to estimate a phase difference among the individual clusters relative to the spiral pattern. This is impossible when using the relative azimuthal intensity variation to distinguish between arm and inter-arm regions. The contrast between arm and inter-arm regions varies significantly, where NGC 2997 has a larger amount of inter-arm complexes than NGC 1365. The arm and inter-arm populations were compared to verify whether the two samples could be assumed to be drawn from the same distribution function but merely be of different sizes, using the Kolmogorov-Smirnov test and the U-test of Wilcoxon, Man and Witney. The distribution function of Qd likely does not to change significantly from the arm to the inter-arm regions, although the total number of sources varies in phase with the spiral perturbation. On the other hand, the distributions of MK are different in arm and inter-arm regions at a 99% level of confidence. The three exceptions (i.e. NGC 1300, NGC 4321, and NGC 7424) all lack signs of strong, coherent star formation in the radial regions considered. The Kolmogorov-Smirnov statistics are listed in Table 3 with the U-tests yielding similar results. These assumption-free tests are sensitive to all kinds of differences in the distributions, such as changes in either the shape or mean. Comparing the MK-histograms, the distributions in the arms for the galaxies with strong spiral perturbations show a shift towards brighter magnitudes, which is on average 04 using the ten percentile point of the distributions as an indicator (see Table 3).
We also calculated the SFR in arms relative to inter-arm regions. The ratios Ra:i are listed in Table 3, together with the number of young clusters used to calculate this ratio. For the galaxies with strong spirals, the SFR in arms is two-to-five times higher than in the inter-arm regions, which still have some star-formation activity.
The usage of the m=2 FFT component as a phase reference for the spiral is acceptable when considering the general arm/inter-arm properties of the cluster distributions. The actual arms are imperfectly symmetric and may have azimuthal shifts of several tens of degrees relative to their average phase. Different models of star formation in the spiral arms (Kim & Ostriker 2002, 2006; Dobbs et al. 2010; Gittins & Clarke 2004) have distinct predictions regarding the phase distribution of young clusters relative to the potential minimum of the arms. To test these predictions, we need to take into account the phase shifts of the individual arms, any asymmetries in the arm profiles, and color gradients caused by age and dust variations. This discussion will be postponed to a forthcoming paper dealing with the detailed shape of the spiral arms in the galaxies.
8 Discussion
The current K-band data are 2-3m deeper than those presented by Grosbøl & Dottori (2008) and have significantly higher resolution, which provide a much fainter detection limit for cluster complexes. Only 4 of the 46 galaxies discussed in the 2008 paper had full JHK photometry. Although the current data are of significantly higher quality, it is still of interest to compare them with the previous results. The fifth brightest MK aperture magnitudes agree well, with a spread of 014, and no significant offset after being corrected for the different distance scale used. The largest difference of 03 was seen for NGC 1566. Some of the galaxies (e.g. NGC 1365 and NGC 4321) have bright nuclear clusters that are 1-2mmore luminous than the ones in the disk. The number of non-stellar objects N13 brighter than MK-13m was also computed, and corrected for the distance scale. In most cases, they were compatible to within 20%, except for NGC 157, NGC 1566, and NGC 4030, which all have large, compact star-forming regions. The higher resolution of the current data allows us to distinguish smaller complexes and thereby increase the number of detected sources significantly. The SFR estimated by Grosbøl & Dottori (2008) was based only on the morphology of the sources, owing to the lack of color information. In addition, the number of sources detected was around four times smaller, which explains why the estimates of the SFR are between two and four times lower than the current ones.
The distribution of objects in color-color and color-magnitude diagrams is the primary means of understanding the physical properties of the cluster complexes. The (H-K)–(J-H) diagram allows us to distinguish three populations of sources, namely: a) one with colors around (04, 08) compatible with an old stellar population (i.e. 50 Myr) at low extinction, b) another with higher (J-K) close to (08, 11) indicative of a younger population with higher extinction, and c) finally objects scattered to higher (H-K) values, the largest part of which can be interpreted in terms of SB99 models plus extinction from dust. To reproduce the colors of the objects with the highest (H-K) in this group, we would need to add a substantial amount of emission from hot dust (see e.g. Witt et al. 1992). The relative importance of these three groups varies significantly from galaxy to galaxy. The total number of objects in the groups with older sources is sensitive to the limiting magnitude because clusters get fainter with time. Variations in the current SFR away from the average will also influence the relative importance of the old and young groups.
The detailed interpretation of these distributions depends on assumptions such as the stellar evolutionary models adopted, nebular emission, attenuation by dust, and the shape of the cluster IMF including its upper mass limit and slope. The lack of accurate spectral information for the clusters makes it impossible to determine the parameters for the IMF in an independent way. We adopted the Padova isochrones (Marigo et al. 2008) as they include the late evolutionary phases (e.g. post TP-AGB), which are important for the NIR colors. A main difference between the two sets of cluster tracks shown in Fig. 5 is either the inclusion or exclusion of nebular emission when estimating the NIR colors for SB99 or Padova tracks, respectively. The inclusion makes (H-K) significantly redder in the early phases when hot stars are present. The mode of star formation also affects the integrated colors, where a continuous formation in the clusters prolongs the time-span during which nebular and Brγ emission are significant. Without a good estimate of the intrinsic colors of the complexes, the appropriate reddening law can only be selected based on general considerations. It is reasonable to assume that the attenuation by dust of the integrated light is described by a law somewhere between a ‘screen’ and ‘dusty’ model (Witt et al. 1992) since nearby star forming regions contain significant amounts of dust. The reddening vector could even be time dependent if supernovae are able to remove a major fraction of the dust from the inner regions of the clusters. This scenario suggests that the ’dusty’ model should be applied to the youngest complexes, while the older ones may be described by a ‘screen’ model.
The correlation between Brγ-emission and the reddening-corrected Q index for NGC 2997 (see Fig. 7) clearly indicates that Q can be used to separate very young complexes (i.e. 7 Myr) from older ones. The detailed relation between Q and cluster age depends on both the model tracks and reddening vector assumed.
The (J-K)–MK diagrams show a double-branch structure (most clearly separated for NGC 1566, NGC 2997, and NGC 7424) for bright complexes with (J-K) 12 and 18, respectively. The main branch around (J-K) = 12 corresponds well to the location predicted for old clusters with relatively low extinction. The model tracks suggest that young clusters have lower (J-K) values reaching almost 00 for ages younger than one Myr. This region is virtually empty, while the majority of the young complexes with 01Qd are grouped near (J-K) = 18 suggesting almost 10m of visual extinction. Since young complexes must migrate to the branch around 12, the gap between the two suggests that a rapid reduction in the extinction (i.e. 10 Myr) occurs just after Brγ-emission from the complexes ceases. The reddening-corrected Q index shows a more continuous distribution, supporting the suggestion that the separation of the two branched in (J-K) is due to an expulsion of dust rather than a sudden change in the SFR.
Information on the early phase of the complexes can be obtained by comparing the location of the young sources with high extinction in the CCD, to the model tracks. The shape of this group is mainly elongated along the direction of the reddening vector. This is inconsistent with a SB99 SSP model and a smooth SFR in time, which would yield a much broader distribution perpendicular to the reddening vector than observed. Most CSP models would be feasible because it would take a considerable time, several Myr, before the clusters would accumulate enough mass to be brighter than the detection limit. During the earliest cluster-evolutionary-phase the main sequence lifetime of the more massive ionizing stars is clearly comparable to their contraction time, which would mimic a continuous star formation. Later on, when those stars evolved, Padova SSP models represent well the CCDs. Also models with low nebular emission would be acceptable in which case the estimated visual extinctions could reach AV = 12m. It is not possible to distinguish between these scenarios based on broad band photometry only.
For comparison, we used the Pessev et al. (2006) sample of Small Magellanic Cloud (SMC) and LMC clusters with integrated colors obtained from 2MASS. Those clusters also show a distribution similar to those in our sample of galaxies, indicating that our sample also includes intermediate and old globular-like objects. Even the peculiar colors, such as those observed in several clusters in the galaxies NGC 7424 and NGC 1365 with (J-K)01 and (H-K)05 (lower right part of CCD), can also be found in the SMC-LMC clusters, such as NGC 458 (200 Myr), NGC 2153 (1.3 Gyr), and NGC 2172 (40 Myr).
The CLFs can be compared to those derived by Larsen (2002) from HST UBV photometry. Their mean exponent for the power-law function is , while our mean exponents for old and young clusters are and , respectively. As can be seen, the mean exponent derived from the HST observations is more similar to that for our old cluster mean exponent. This result is consistent with the younger objects having higher extinctions, which would probably hide many of them in UV and optical bands analyzed by Larsen (2002). We do not find any evidence of the high luminosity cut-off reported by Gieles et al. (2006). Again here, the usage of NIR photometry allows us to obtain a more complete census of the youngest and brightest clusters which may be obscured by dust lanes at shorter wavelengths. Our results are consistent with Chandar et al. (2010b, a) who estimated an exponent of 1.80 for the Magellanic Clouds and found no evidence of a high-luminosity cut-off. Since NIR colors provide rather limited amount of age information for older sources, we were unable to determine whether the properties of the CLF depend on the cluster age.
The distributions of the MK and Qd of sources as a function of the azimuthal phase relative to the spiral arms show a characteristic variation in the regions of strong, symmetric perturbations. The total number density of complexes oscillates in phase with the K-band surface brightness variations. There is no statistical evidence for a change in the Qd distribution function from the arm to the inter-arm regions. There is clear evidence that the MK distribution in the arms differs from that in-between. The brightest complexes are preferentially found in arms. The existence of non-linear compressions or shocks in the gas could alter the mass spectrum and allow more massive clusters to be formed in the arm regions.
9 Conclusion
Our analysis of NIR photometry and location of cluster complexes relative to major arms in 10 nearby, grand-design, spiral galaxies had led to the following conclusions:
-
•
All complexes younger than 7 Myr have significant extinction in the range AV=3-7m, while older ones typically have AV1m.
-
•
The (J-K)–MK diagrams show two well-separated branches, which are indicative of a rapid expulsion of dust around an age of 7 Myr.
-
•
The CLFs are well-fitted by power laws with an exponent for clusters younger than 7 Myr and for older clusters. The distributions do not show evidence of a cut-off at their high luminosity end.
-
•
Cluster complexes formed in strong spiral arms have a CLF that is systematically brighter in MK by at least 04 than those in the inter-arm regions.
-
•
The azimuthal average of is insignificantly affected by strong spiral perturbations, which help to concentrate star formation in the arm regions. Outside the grand-design spiral pattern, star formation is more uniformly distributed in azimuth.
-
•
The SFR in the arm regions of galaxies with strong spiral perturbations is 2-5 times higher than in the inter-arm regions.
The NIR observations of cluster complexes in grand-design galaxies clearly reveal a population of very young clusters highly attenuated by dust. These clusters are difficult to access in visual bands but are essential for understanding the early evolution of clusters. The indication of a shift in their CLF, towards brighter clusters, in the arms points to a change in the physical conditions. This suggests a scenario where star formation is enhanced by spiral perturbations (e.g. by increased shear or gas densities, or shocks) but in inter-arm regions is due to stochastic processes. A full analysis of the formation of clusters in the arms of grand-design spirals should include dynamical models for the flow of material.
Acknowledgements.
The ESO-MIDAS system and SExtreator were used during the reduction and analysis of the data. We would also like to thank the anonymous referee for comments that helped us to improve the presentation. This research has made use of the NASA/IPAC Extragalactic Database (NED), which is operated by the Jet Propulsion Laboratory, California Institute of Technology, under contract with the National Aeronautics and Space Administration.References
- Bastian & Goodwin (2006) Bastian, N. & Goodwin, S. P. 2006, MNRAS, 369, L9
- Becker et al. (1988) Becker, R., Mebold, U., Reif, K., & van Woerden, H. 1988, A&A, 203, 21
- Becker & Fenkart (1970) Becker, W. & Fenkart, R. 1970, in IAU Symp., Vol. 38, The Spiral Structure of our Galaxy, ed. W. Becker & G. Contopoulos, 205
- Bertin & Arnouts (1996) Bertin, E. & Arnouts, S. 1996, A&AS, 117, 393
- Bertin et al. (1989) Bertin, G., Lin, C. C., Lowe, S. A., & Thurstans, R. P. 1989, ApJ, 338, 78
- Bigiel et al. (2008) Bigiel, F., Leroy, A., Walter, F., et al. 2008, AJ, 136, 2846
- Chandar et al. (2010a) Chandar, R., Fall, S. M., & Whitmore, B. C. 2010a, ApJ, 711, 1263
- Chandar et al. (2010b) Chandar, R., Whitmore, B. C., & Fall, S. M. 2010b, ApJ, 713, 1343
- Cohen et al. (2003) Cohen, M., Wheaton, W. A., & Megeath, S. T. 2003, AJ, 126, 1090
- de Vaucouleurs et al. (1991) de Vaucouleurs, G., de Vaucouleurs, A., Cowien, H., et al. 1991, Third reference catalogue of bright galaxies (New York: Springer)
- Dobbs et al. (2010) Dobbs, C. L., Theis, C., Pringle, J. E., & Bate, M. R. 2010, MNRAS, 403, 625
- Ellis & Bland-Hawthorn (2006) Ellis, S. C. & Bland-Hawthorn, J. 2006, AAO Newsletter, 110, 16
- Elmegreen & Elmegreen (1986) Elmegreen, B. G. & Elmegreen, D. M. 1986, ApJ, 311, 554
- Elmegreen et al. (2009) Elmegreen, B. G., Galliano, E., & Alloin, D. 2009, ApJ, 703, 1297
- Foyle et al. (2011) Foyle, K., Rix, H.-W., Dobbs, C. L., Leroy, A. K., & Walter, F. 2011, ApJ, 735, 101
- Foyle et al. (2010) Foyle, K., Rix, H.-W., & Zibetti, S. 2010, MNRAS, 407, 163
- Fujii et al. (2011) Fujii, M. S., Baba, J., Saitoh, T. R., et al. 2011, ApJ, 730, 109
- Ganda et al. (2006) Ganda, K., Falcón-Barroso, J., Peletier, R. F., et al. 2006, MNRAS, 367, 46
- Gieles et al. (2006) Gieles, M., Larsen, S. S., Bastian, N., & Stein, I. T. 2006, A&A, 450, 129
- Gittins & Clarke (2004) Gittins, D. M. & Clarke, C. J. 2004, MNRAS, 349, 909
- Goodwin & Bastian (2006) Goodwin, S. P. & Bastian, N. 2006, MNRAS, 373, 752
- Grosbøl & Dottori (2008) Grosbøl, P. & Dottori, H. 2008, A&A, 490, 87
- Grosbøl & Dottori (2009) —. 2009, A&A, 499, L21
- Grosbøl et al. (2006) Grosbøl, P., Dottori, H., & Gredel, R. 2006, A&A, 453, L25
- Grosbøl & Patsis (1998) Grosbøl, P. & Patsis, P. A. 1998, A&A, 336, 840
- Grosbøl et al. (2004) Grosbøl, P., Patsis, P. A., & Pompei, E. 2004, A&A, 423, 849
- Hess et al. (2009) Hess, K. M., Pisano, D. J., Wilcots, E. M., & Chengalur, J. N. 2009, ApJ, 699, 76
- Hodgkin et al. (2009) Hodgkin, S. T., Irwin, M. J., Hewett, P. C., & Warren, S. J. 2009, MNRAS, 394, 675
- Indebetouw et al. (2005) Indebetouw, R., Mathis, J. S., Babler, B. L., et al. 2005, ApJ, 619, 931
- Israel et al. (1998) Israel, F. P., van der Werf, P. P., Hawarden, T. G., & Aspin, C. 1998, A&A, 336, 433
- Kennicutt (1989) Kennicutt, R. C. 1989, ApJ, 344, 685
- Kennicutt (1998) —. 1998, ARA&A, 36, 189
- Kim & Ostriker (2002) Kim, W.-T. & Ostriker, E. C. 2002, ApJ, 570, 132
- Kim & Ostriker (2006) —. 2006, ApJ, 646, 213
- Knapen et al. (1993) Knapen, J. H., Cepa, J., Beckman, J. E., Soledad del Rio, M., & Pedlar, A. 1993, ApJ, 416, 563
- Kodilkar et al. (2011) Kodilkar, J., Kantharia, N. G., & Ananthakrishnan, S. 2011, MNRAS, 416, 522
- Kuno et al. (2007) Kuno, N., Sato, N., Nakanishi, H., et al. 2007, PASJ, 59, 117
- Lada & Lada (2003) Lada, C. J. & Lada, E. A. 2003, ARA&A, 41, 57
- Larsen (2002) Larsen, S. S. 2002, AJ, 124, 1393
- Larsen (2009) —. 2009, A&A, 494, 539
- Larsen & Richtler (1999) Larsen, S. S. & Richtler, T. 1999, A&A, 345, 59
- Leitherer et al. (1999) Leitherer, C., Schaerer, D., Goldader, J. D., et al. 1999, ApJS, 123, 3
- Lin & Shu (1964) Lin, C. C. & Shu, F. H. 1964, ApJ, 140, 646
- Lindblad et al. (1997) Lindblad, P. A. B., Kristen, H., Jörsäter, S., & Högbom, J. 1997, A&A, 317, 36
- Marigo et al. (2008) Marigo, P., Girardi, L., Bressan, A., et al. 2008, A&A, 482, 883
- Moustakas & Kennicutt (2006) Moustakas, J. & Kennicutt, R. C. 2006, ApJ, 651, 155
- Omar & Dwarakanath (2005) Omar, A. & Dwarakanath, K. S. 2005, JApA, 26, 89
- Patsis et al. (2010) Patsis, P. A., Kalapotharakos, C., & Grosbøl, P. 2010, MNRAS, 408, 22
- Pence et al. (1990) Pence, W. D., Taylor, K., & Atherton, P. 1990, ApJ, 357, 415
- Pessev et al. (2006) Pessev, P. M., Goudprooij, P., Puzia, T. H., & Chandar, R. 2006, AJ, 132, 781
- Rix & Rieke (1993) Rix, H.-W. & Rieke, M. J. 1993, ApJ, 418, 123
- Roberts (1969) Roberts, W. W. 1969, ApJ, 158, 123
- Salpeter (1955) Salpeter, E. E. 1955, ApJ, 121, 161
- Sandage & Tammann (1981) Sandage, A. & Tammann, G. A. 1981, A Revised Shapley-Ames Catalog of Bright Galaxies, Carnegie Inst. of Wash. Publ. No. 635 (Washington: Carnegie Inst.)
- Schechter (1976) Schechter, P. 1976, ApJ, 203, 297
- Scheepmaker et al. (2007) Scheepmaker, R. A., Haas, M. R., Gieles, M., et al. 2007, A&A, 469, 925
- Scheepmaker et al. (2009) Scheepmaker, R. A., Lamers, H. J. G. L. M., Anders, P., & Larsen, S. S. 2009, A&A, 494, 81
- Schlegel et al. (1998) Schlegel, D. J., Finbeiner, D. P., & Davis, A. 1998, ApJ, 500, 525
- Schmidt (1959) Schmidt, M. 1959, ApJ, 129, 243
- Schulman et al. (1997) Schulman, E., Ockels, F., & Knezek, P. M. 1997, BAAS, 29, 1332
- Seigar & James (1998) Seigar, M. S. & James, P. A. 1998, MNRAS, 299, 672
- Seigar & James (2002) —. 2002, MNRAS, 337, 1113
- Sellwood (2010) Sellwood, J. A. 2010, MNRAS, 409, 145
- Sellwood (2011) —. 2011, MNRAS, 410, 1637
- Sempere & Rozas (1997) Sempere, M. J. & Rozas, M. 1997, A&A, 317, 405
- Skrutskie et al. (2006) Skrutskie, M. F., Cutri, R. M., Stiening, R., et al. 2006, AJ, 131, 1163
- Thilker et al. (2007) Thilker, D. A., Bianchi, L., Meurer, G., et al. 2007, ApJS, 173, 538
- van Zee & Bryant (1999) van Zee, L. & Bryant, J. 1999, AJ, 118, 2172
- Wada et al. (2011) Wada, K., Baba, J., & Saitoh, T. R. 2011, ApJ, 735, 1
- Witt et al. (1992) Witt, A. N., Thronson, H. A., & Capuano, Jr., J. M. 1992, ApJ, 393, 611
- Zurita et al. (2002) Zurita, A., Beckman, J. E., Rozas, M., & Ryder, S. 2002, A&A, 386, 801
Appendix A Morphology of galaxies and distribution of cluster complexes
The K-band images of the ten grand-design, spiral galaxies in the sample are shown in Fig 13 as direct images, while - representations are given in Fig 14. A short description of their spiral structure is given below based on the Fourier analysis of the azimuthal intensity variation in their de-projected disks.
- NGC 157:
-
The galaxy has a weak oval distortion at its center, which reaches to a radius of around 10″ and has a relative amplitude of 2%. There is a transition zone to 20″, where a two-armed, logarithmic spiral with a pitch angle of 33.4° starts. Its relative amplitude peaks around 40% in the range 30″50″. The main m=2 pattern terminates close to 60″, outside which a weaker, tighter pattern exists.
- NGC 1232:
-
It has been argued that this galaxy has a morphology similar to that of our Milky Way (Becker & Fenkart 1970). It has a bar out to a radius of 16″ with = 20%. A tight, symmetric, two-armed spiral with (, ) = (0.2, 14.7°) emerges from the end of the bar. Its symmetric part terminates at , after which the northern arm splits as the southern arm continues. A more open pattern can be traced to 120″.
- NGC 1300:
-
There are indications of a weak central bar with = 10% within 8″. The main bar reaches an amplitude = 55% around 64″, where it widens into ansae. A tightly wound set of arms emerges from the end of the bar close to 95″, while a faint spiral pattern can be traced outside 150″with (, ) = (0.2, 13.7°). A dynamical study by Patsis et al. (2010) suggests that the inner arms are supported by stars on chaotic orbits that escape through the Lagrangian points at the end of the bar.
- NGC 1365:
-
A spiral structure occupies the central parts, while the bar is seen in the range 40-92″ with an amplitude up to 73%. The main spiral starts at the ends of the bar and follows a logarithmic spiral with = 33.1° from 99″ to the edge of the frame around 220″. The amplitude of its m=2 component exceeds unity in the outer parts owing to its strongly peaked, azimuthal shape.
- NGC 1566:
-
The central part hosts a weak oval distortion with a position angle of 3̃0°. Two symmetric regions in the radial range of 15-35″ and N-S direction show strong star formation activity. The arms connect to these regions but the logarithmic spiral first starts at = 49″ with (, ) = (0.7, 27.1°). Outside 99″, the spiral pattern changes shape.
- NGC 2997:
-
Besides a ring of star forming regions at the center, a bar with = 10% ends around 45″, where the main spiral emerges with (, ) = (0.4, 21.2°). The regular logarithmic spiral pattern terminates close to 125″, where the southern arm has an abrupt turn.
- NGC 4030:
-
The inner part has a complex structure with multiple spiral arms. The main symmetric, two-armed spiral pattern is located in the region 49-70″ with (, ) = (0.3, 26.5°).
- NGC 4321:
-
The inner part of NGC 4321 is occupied by a central bar inside 13″, a main bar to around 67″and several ring/spiral structures. A set of prominent spiral arms starts at the end of the bar but these are asymmetric (with a much stronger southern arm) and tightly wound, in a similar way to those of NGC 1300. Close to 99″, a logarithmic spiral can be traced to 134″ with the parameters (, ) = (0.5, 29.1°).
- NGC 5247:
-
The spiral pattern of this galaxy, as for that of NGC 1566, is a prototype clean, open m=2 logarithmic spiral. There is evidence of both a central bar within 5″ and a weak spiral pattern reaching 8″ that has the opposite winding of the main spiral. After a transition zone, the main spiral pattern follows a logarithmic spiral with (, ) = (0.6, 34.4°) in the range 40″ to 121″. There is a small phase shift around 100″. The azimuthal profile is peaked with significant amplitudes of higher-order even harmonics.
- NGC 7424:
-
This galaxy is the closest in the sample with a distance of 9.5 Mpc. With a linear resolution of 20 pc, most sources are likely to be associated with individual clusters. There are no traces of either significant dust lanes or large star-forming regions. Its bar extends to 38″, where a tight spiral emerges at an angle of almost 90°. The main set of symmetric arms starts around 49″ with (, ) = (0.3, 12.3°) and terminates at 77″. Another tight spiral can be traced out to 90″ with (, ) = (0.1, 9.0°). The spirals have a smooth, azimuthal shape with little power at higher frequencies than m=2.
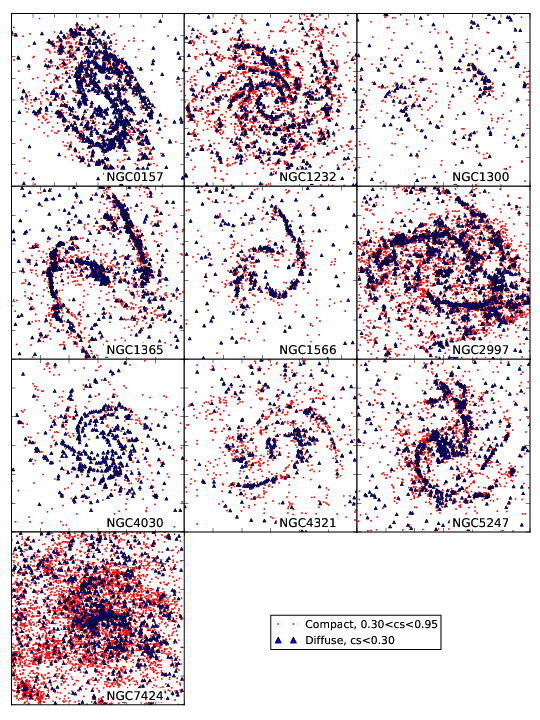
The positions of all non-stellar sources with photometric errors 03 are shown in Fig. 15, where compact complexes () are plotted as red points and diffuse ones () as blue triangles. The diffuse objects outline the main spiral structure more clearly than the compact ones which are more uniformly distributed. This is mainly due to a larger fraction of compact sources having Qd01 and therefore being older on average than the diffuse sources.
Appendix B Color and magnitude diagrams
The (H-K)–(J-H) diagrams of non-stellar sources in the galaxies are given in Fig. 16, where colors represent their MK. For reference, the ‘screen’ and ‘dusty’ reddening vectors and cluster evolutionary tracks are indicated in Fig. 5. They have the same general features as those described in Sect. 4 but there is a significant variation in their relative importance. To a large extent, this is due to differences in the limiting magnitude since the ‘older’ clump is dominated by faint sources. The average location of the high extinction clump varies mainly in (J-H), which may be explained by slight changes in the effective extinction law applicable to the complexes.
The Qd-MK diagrams are presented in Fig.17 with the standard SB99 SSP model for a cluster of M☉. All the galaxies except for NGC 7424 have complexes reaching absolute magnitudes MK close to -15m. NGC 1365 and NGC 4321 have several brighter sources, which all are located in their central regions. The brightest complexes are found near Qd=00 but would be shifted to slightly higher luminosities if extinction corrections were applied. The decreasing number of sources moving from Qd=00 to higher values is caused by the youngest objects, with higher Qd, still forming stars and increasing their luminosity. Nebular emission also yields higher Qd measures. Although the standard cluster tracks only reach Qd=-03, clusters with values up to -07 are observed in the LMC-SMC (Pessev et al. 2006), which can explain the negative tail of Qd.
Color-magnitude diagrams for (J-K)–MK are provided in Fig. 18 with the standard SB99 SSP model as reference. The younger population (red/dark) is more prominent for high (J-K) values which are indicative of higher extinctions. As discussed in the main section, young clusters should have lower intrinsic (J-K) values than older ones. That they actually have higher values suggests that they are highly obscured. Double peaks are clearly seen for NGC 157, NGC 1566, NGC 2997, and NGC 7424, while only marginal ones are visible for NGC 1232 and NGC 5247. A clear gap indicates a rapid expulsion of dust from young clusters, while the lack of one could be caused by both a slower expulsions and a wider spread in attenuation by dust. The left edge of the distribution is fairly sharp and corresponds well to the cluster track. This indicates that many older clusters have low internal extinction.
Appendix C Spatial distribution of complexes
The radial surface density of non-stellar sources is displayed in Fig.19, where red (dark) indicates younger and yellow (light) older ones. All galaxies show a steep decline in their outer parts, while some (e.g. NGC 157, NGC 1365, NGC 2997, NGC 4321, NGC 5247, and NGC 7424) have a relative flat part in their disks. The distributions of younger and older complexes follow each other well indicating that current and past SFRs display little radial change.
The locations of complexes relative to the spiral arms are given in Fig. 20, which plots MK and Qd against the azimuthal distance from the phase of the m=2 FFT component. Only sources in the radial range of the strong, grand-design spiral pattern (listed in the upper right corner) and photometric errors 03 are shown. The modulation of the source density with azimuthal angle from the spiral arms is stronger for the galaxies with strong, grand-design patterns such as NGC 157, NGC 1365, NGC 1566, NGC 2997, and NGC 5247. Both NGC 1232 and NGC 7424 have relatively weak spiral perturbations, whereas the radial regions for NGC 4030 and NGC 4321 are located in their outer parts, which have less star-formation activity. As the Kolmogorov-Smirnov tests show, the shape of the distribution of Qd (i.e. age) does not change significantly from arm to inter-arm regions. On the other hand, the excess of bright sources in the arms seems real.
