Kinematic Signatures of Bulges Correlate with Bulge Morphologies
and
Sérsic Index∗
Abstract
We use the Marcario Low Resolution Spectrograph (LRS) at the
Hobby-Eberly-Telescope (HET) to study the kinematics of pseudobulges
and classical bulges in the nearby universe. We present major-axis rotational
velocities, velocity dispersions, and and moments derived from
high-resolution ( kms-1) spectra for
45 S0 to Sc galaxies; for 27 of the galaxies we also present
minor axis data. We combine our kinematics with bulge-to-disk decompositions.
We demonstrate for the first time that purely kinematic diagnostics of the
bulge dichotomy agree systematically with those based on Sérsic index. Low
Sérsic index bulges have both increased rotational support (higher
values) and on average lower central velocity dispersions. Furthermore, we
confirm that the same correlation also holds when visual morphologies are used
to diagnose bulge type.
The previously noted trend of photometrically flattened bulges to have shallower velocity
dispersion profiles turns to be significant and systematic if the Sérsic
index is used to distinguish between pseudobulges and classical bulges.
The correlation between and observed in elliptical
galaxies is also observed in intermediate type galaxies, irrespective
of bulge type. Finally, we present evidence for formerly undetected
counter rotation in the two systems NGC 3945 and NGC 4736.
∗Based on observations obtained with the Hobby-Eberly
Telescope, which is a joint project of the University of Texas at Austin, the
Pennsylvania State University, Stanford University,
Ludwig-Maximilians-Universität München, and Georg-August-Universitöt
Göttingen.
Subject headings:
galaxies: bulges — galaxies: evolution — galaxies: formation — galaxies: structure — galaxies: dynamics1. Introduction
There is ample observational evidence that bulges in early type spiral galaxies come in different varieties. They are not all just like small elliptical galaxies which happen to live in the centre of a spiral disk (Kormendy 1993; Kormendy & Kennicutt 2004).
While classical bulges seem to lie on photometric projections of the the fundamental plane of elliptical galaxies (Fisher & Drory 2010) pseudobulges resemble disks more than little ellipticals. They are still photometrically distinct from the outer disk as they appear as a central brightening above the inwards extrapolation of the outer exponential disk profile. However, as opposed to classical bulges, their Sérsic indices fall close-to or below two (Fisher & Drory 2008). Other groups have shown that a large fraction of galaxies with boxy or peanut shaped bulges do show signs of inner disks (Bureau & Freeman 1999; Chung & Bureau 2004; Kormendy & Barentine 2010). The phenomenon of inner disks is however not limited to bulges that morphologically resemble disks as a whole (Scorza & Bender 1995; Emsellem et al. 2004; Falcón-Barroso et al. 2003, 2004; Sarzi et al. 2006; Falcón-Barroso et al. 2006; Comerón et al. 2010), although it seems ubiquitous in this class of objects.
Internal secular evolution is commonly seen as an important channel for the formation of central disk-like structures (Kormendy & Kennicutt 2004; Athanassoula 2005). In this picture, asymmetries such as spiral structure and bars support the angular momentum transfer of disk material and thereby the transport of gas into the inner bulge regions. In their recent study of bulges within the local 11 Mpc volume Fisher & Drory (2011) show that a majority of bulges in the local universe are pseudobulges. Their existence in large quantities in our local (low density) environment may seem to pose a problem for the understanding of the baryonic physics of galaxy formation (Kormendy et al. 2010) as, at first sight, it is not clear how central disks would survive the large quantity of low redshift ( 1) mergers (Stewart et al. 2008) typical of CDM simulations (White & Rees 1978; White & Frenk 1991). But disk structures do not have to be destroyed in all mergers. Hopkins et al. (2008) show that the heating of the disks in a minor merging event is a non-linear function of progenitor mass ratio once the satellite rigidity and the orbits are modelled properly. In addition to the impact parameters and the mass fraction, the baryonic gas content within the progenitors is an important parameter to the final result of a merging process (Hopkins et al. 2009; Stewart et al. 2009; Governato et al. 2009) — wet mergers are more likely to produce disks. Minor mergers may also create inner disk structures (Eliche-Moral et al. 2011) while increasing the Sérsic index only moderately (Eliche-Moral et al. 2006). Based on semi-analytical models for hierarchical growth which include prescriptions for the survival of disks, Fontanot et al. (2011) show that the existence of the majority of the galaxies with no significant bulge component in the local volume can be understood in the context of CDM.
Kormendy & Kennicutt (2004) identify a number of criteria to differentiate between classical and pseudobulges such as the bulge vs. the disk ellipticity, their location in the diagram and the bulge morphology. Fisher & Drory (2008, 2010) show that the bulge Sérsic Index is successful in differentiating bulge types — pseudobulges have Sérsic indices that fall near or below , unlike classical bulges and elliptical galaxies which have higher Sérsic indices.
The identification of the bulge morphology as well as the accurate derivation of photometric structural parameters heavily relies on high spatial resolution imaging. Recently, such data has become available for a large number of bulges. Adding sufficiently high-resolution spectroscopic data allows us to ask the question whether all morphologically disk-like bulges also show kinematic disk-like behaviour, such as high values and/or flattening or drops in the profile? Also, whether differences seen in structural parameters such as Sérsic index are reflected in the kinematic structure as well?
In §2 we describe the sample selection and characteristics, in §3 we describe the long-slit observations, in §4 we give account on the derivation of -band surface brightness profiles and their decomposition, as well as the details of the data reduction, especially the removal of emission features, and finally the kinematic extraction. Our results are presented in §5, in §6 we discuss correlations between kinematic parameters and morphological parameters and indications for an increased rotational support of pseudobulges. We finally discuss and summarize our findings in §7.
2. Sample
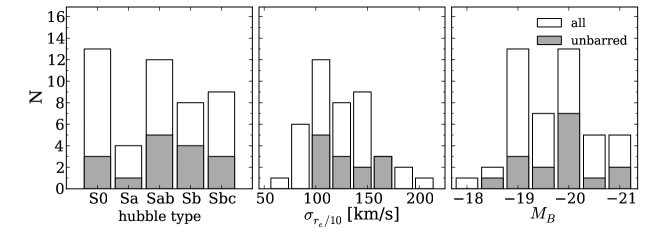
As we aim to study the kinematics of bulges, our sample consists of 45 galaxies spanning the full range of Hubble types that do contain bulges: S0 to Sbc. Further, roughly two-thirds of our galaxies are barred, a similar fraction to the total fraction of bars observed in the local universe (see Fig. 1). Table 1 lists the objects in our sample. For signal-to-noise () reasons we are biased towards high-luminosity objects. Absolute B-Band magnitudes span the range from to . Central velocity dispersions lie between 60 kms-1 and 220 kms-1. We select our targets to be located close enough in distance to properly resolve the bulge regions in typical seeing conditions. With the exception of NGC 2964 and NGC 4030, all galaxies have bulge radii larger than 5 arcseconds and are typically located at distances closer than 25 Mpc. Only NGC 4030, NGC 4260, and NGC 4772 are located at significantly larger distances of 29.3 Mpc, 48.4 Mpc and 40.9 Mpc, respectively. The bulge radii of 7.3 arcseconds and 23.5 arcseconds of the latter two leave us confident that we are able to nevertheless sufficiently resolve their bulges. NGC 2964 and NGC 4030 have bulge radii of 3.1 arcseconds and 3.0 arcseconds, and are excluded from all structural analysis concerning the bulges, we restrict ourselves to presenting their kinematic data.
In order to break the known degeneracy between the bulge effective radius and Sérsic index in 1D surface brightness decompositions (Graham & Colless 1997) we require all our targets to have HST imaging in F160W, I, or R band. Most of the objects are found in Fisher & Drory (2008) and/or Fisher & Drory (2010) and have extensive HST and ground-based multi-wavelength coverage. To allow for a visual inspection and morphological classification of the bulge region we select objects which have close-to -band HST images of their bulge region (see §4.3) available from the archive and we do not observe edge-on or close-to edge-on objects (). Four objects in our sample do have a larger inclination. NGC 1023 and NGC 4371 are S0-types and contain very little dust and allow an undisturbed view into the bulge region. The situation is different for NGC 3593 and NGC 7331, where the inclination and — in the case of NGC 3593 — the absence of an optical HST image inhibits a morphological classification. We present the kinematic data for those objects refrain from classifying them as classical or pseudobulges.
| Galaxy | D | i | |||
|---|---|---|---|---|---|
| [Mpc] | mag | [∘] | |||
| (1) | (2) | (3) | (4) | (5) | (6) |
| NGC 1023 | .LBT-.. | 11.5 | 2 | -20.0 | 77 |
| NGC 2460 | .SAS1.. | 23.6 | 1 | -19.1 | 44 |
| NGC 2681 | PSXT0.. | 17.2 | 2 | -20.1 | 0 |
| NGC 2775 | .SAR2.. | 14.4 | 1 | -19.8 | 41 |
| NGC 2841 | .SAR3*. | 9.0 | 1 | -19.7 | 68 |
| NGC 2859 | RLBR+.. | 25.4 | 1 | -20.2 | 33 |
| NGC 2880 | .LB.-.. | 21.9 | 2 | -19.2 | 68 |
| NGC 2964 | .SXR4*. | 19.9 | 1 | -19.1 | 58 |
| NGC 3031 | .SAS2.. | 3.9 | 2 | -20.1 | 59 |
| NGC 3166 | .SXT0.. | 22.0 | 1 | -20.4 | 56 |
| NGC 3245 | .LAR0*. | 20.9 | 2 | -19.9 | 67 |
| NGC 3351 | .SBR3.. | 8.6 | 1 | -19.1 | 42 |
| NGC 3368 | .SXT2.. | 8.6 | 1 | -19.6 | 55 |
| NGC 3384 | .LBS-*. | 8.6 | 1 | -18.8 | 62a |
| NGC 3521 | .SXT4.. | 8.1 | 1 | -19.7 | 42 |
| NGC 3593 | .SAS0*. | 8.8 | 1 | -17.9 | 75 |
| NGC 3627 | .SXS3.. | 12.6 | 4 | -20.9 | 57 |
| NGC 3675 | .SAS3.. | 10.7 | 1 | -19.1 | 60 |
| NGC 3898 | .SAS2.. | 21.9 | 1 | -20.1 | 57 |
| NGC 3945 | RLBT+.. | 19.0 | 1 | -19.6 | 63 |
| NGC 3953 | .SBR4.. | 13.2 | 1 | -19.8 | 62 |
| NGC 3992 | .SBT4.. | 22.9 | 5 | -21.2 | 47 |
| NGC 4030 | .SAS4.. | 29.3 | 6 | -21.1 | 40 |
| NGC 4203 | .LX.-*. | 15.1 | 2 | -19.1 | 27 |
| NGC 4260 | .SBS1.. | 48.4 | 7 | -20.7 | 70 |
| NGC 4274 | RSBR2.. | 12.5 | 1 | -19.1 | 66 |
| NGC 4314 | .SBT1.. | 12.5 | 1 | -19.1 | 16 |
| NGC 4371 | .LBR+.. | 14.3 | 1 | -19.0 | 79 |
| NGC 4379 | .L..-P* | 15.9 | 8 | -18.4 | 42 |
| NGC 4394 | RSBR3.. | 14.3 | 1 | -19.0 | 20 |
| NGC 4448 | .SBR2.. | 12.5 | 1 | -18.5 | 52 |
| NGC 4501 | .SAT3.. | 14.3 | 1 | -20.4 | 61 |
| NGC 4536 | .SXT4.. | 12.2 | 9 | -19.3 | 59 |
| NGC 4569 | .SXT2.. | 14.3 | 1 | -20.5 | 66 |
| NGC 4698 | .SAS2.. | 14.3 | 1 | -19.3 | 51 |
| NGC 4736 | RSAR2.. | 4.2 | 1 | -19.1 | 35 |
| NGC 4772 | .SAS1.. | 40.9 | 5 | -21.1 | 68 |
| NGC 4826 | RSAT2.. | 7.5 | 2 | -20.0 | 60 |
| NGC 5055 | .SAT4.. | 7.8 | 1 | -20.2 | 56 |
| NGC 5248 | .SXT4.. | 14.8 | 1 | -19.9 | 56 |
| NGC 5566 | .SBR2.. | 20.1 | 5 | -20.1 | 61 |
| NGC 7177 | .SXR3.. | 19.8 | 1 | -19.5 | 42 |
| NGC 7217 | RSAR2.. | 16.6 | 1 | -19.8 | 36 |
| NGC 7331 | .SAS3.. | 15.5 | 1 | -20.8 | 75 |
| NGC 7743 | RLBS+.. | 19.2 | 10 | -19.0 | 40 |
3. Observations
We obtain major axis spectra for all and minor axis spectra for about half of the galaxies in our sample. In some cases the observed position angle is not identical to the one published in Hyperleda***http://leda.univ-lyon1.fr (Paturel et al. 2003). Also, in a few cases the minor axis position angle is not orthogonal to the major axis position angle. We label observations accordingly in Tab. 2.
Observations were carried out in service mode during the period from April 2005 to April 2010 (see Tab. 2) at the Hobby-Eberly Telescope (HET; Ramsey et al. 1998) at McDonald Observatory. We use the Marcario Low Resolution Spectrograph (LRS; Hill et al. 1998) with a one arcsecond wide and 3.5 arcminute long-slit, the E2 phase volume holographic GRISM, and a Ford Aerospace 30721024 15 pixel (usable range 2750900 pixel) CCD detector yielding a spatial scale of 0.235 arcseconds per pixel. The spectra cover the wavelength range from 4790 Å to 5850 Å with 0.38 Å per pixel and a median instrumental resolution of = 39.3 kms-1 (as measured on the 5577 Å night-sky line). The seeing varies from 1.2 to 4 arcseconds with a median value of 2.2 arcseconds. Integration times vary from 1.800 s to 3.800 s and on-object exposures are typically split into two for cosmic rejection. For large galaxies where the DSS image of the galaxy exceeds the slit length, we obtain separate exposures of empty sky with an exposure time of 420 s at the end of the science observation. In order to avoid an azimuth move of the telescope, the sky exposures are typically obtained one hour in RA after the object but at similar DEC.
| Galaxy | axis | date | seeing | exp.-time | angle | sky |
|---|---|---|---|---|---|---|
| [”] | [s] | [∘] | ||||
| (1) | (2) | (3) | (4) | (5) | (6) | (7) |
| NGC 1023 | MJ | 2009-10-24 | 1.9 | 2,400 | 87 | yes |
| NGC 1023 | MN | 2009-10-23 | 2.2 | 2,400 | 177 | yes |
| NGC 2460 | MJ | 2005-11-08 | 2.0 | 1,800 | 30 | no |
| NGC 2460 | MN | 2005-11-08 | 2.0 | 1,800 | 120 | no |
| NGC 2681 | MJ | 2007-10-21 | 2.0 | 2,700 | 114 | yes |
| NGC 2775 | MJ | 2008-03-05 | 2.6 | 2,700 | 156 | no |
| NGC 2775 | MN | 2008-12-24 | 3.4 | 2,400 | 66 | no |
| NGC 2841 | MJ | 2007-11-08 | 1.6 | 1,800 | 152 | no |
| NGC 2841 | MNc | 2008-12-23 | 3.2 | 2,280 | 58 | no |
| NGC 2859 | MJ | 2005-11-09 | 1.6 | 3,000 | 80 | no |
| NGC 2859 | MN | 2006-05-25 | 2.5 | 1,800 | 170 | no |
| NGC 2880 | MJ | 2009-11-16 | 3.4 | 2,200 | 142 | no |
| NGC 2880 | MN | 2009-12-18 | 2.2 | 2,400 | 52 | no |
| NGC 2964 | MJ | 2010-02-18 | 1.9 | 2,400 | 96 | yes |
| NGC 2964 | MN | 2010-03-21 | 2.2 | 2,400 | 7 | yes |
| NGC 3031 | MJb | 2007-02-22 | 2.2 | 2,700 | 137 | yes |
| NGC 3031 | MNc | 2005-12-28 | 3.1 | 1,800 | 67 | no |
| NGC 3166 | MJ | 2008-02-06 | 2.0 | 2,454 | 85 | yes |
| NGC 3166 | MN | 2008-12-25 | 2.4 | 2,400 | 175 | no |
| NGC 3245 | MJ | 2008-02-06 | 1.7 | 2,700 | 174 | yes |
| NGC 3245 | MN | 2008-12-25 | 2.5 | 2,400 | 84 | no |
| NGC 3351 | MJb | 2008-02-09 | 1.5 | 2,550 | 165 | yes |
| NGC 3351 | MN | 2008-12-27 | 5.0 | 2,400 | 75 | yes |
| NGC 3368 | MJb | 2007-02-26 | 3.1 | 2,420 | 153 | yes |
| NGC 3368 | MNc | 2008-12-09 | 2.6 | 2,400 | 87 | yes |
| NGC 3384 | MJ | 2009-12-13 | 1.7 | 2,400 | 53 | yes |
| NGC 3384 | MN | 2010-02-19 | 1.8 | 2,400 | 143 | yes |
| NGC 3521 | MJ | 2007-04-18 | 1.6 | 2,700 | 161 | yes |
| NGC 3521 | MN | 2009-01-03 | 2.3 | 2,528 | 74 | yes |
| NGC 3593 | MJ | 2010-02-17 | 1.2 | 2,400 | 84 | yes |
| NGC 3627 | MJb | 2006-12-27 | 2.3 | 1,800 | 10 | no |
| NGC 3627 | MN | 2007-02-23 | 2.2 | 1,800 | 100 | no |
| NGC 3675 | MJ | 2008-03-05 | 2.6 | 2,700 | 178 | yes |
| NGC 3898 | MJ | 2007-04-19 | 1.6 | 2,700 | 108 | no |
| NGC 3945 | MJb | 2009-12-17 | 2.1 | 2,400 | 154 | yes |
| NGC 3945 | MN | 2010-04-12 | 1.6 | 4,200 | 64 | yes |
| NGC 3953 | MJb | 2008-02-06 | 2.0 | 2,700 | 32 | yes |
| NGC 3992 | MJb | 2008-12-28 | 2.7 | 2,700 | 66 | yes |
| NGC 4030 | MJ | 2005-04-05 | 2.3 | 1,800 | 27 | no |
| NGC 4203 | MJ | 2007-04-12 | 1.3 | 2,520 | 7 | yes |
| NGC 4260 | MJ | 2008-12-29 | 2.7 | 2,700 | 62 | no |
| NGC 4274 | MJ | 2007-04-19 | 1.7 | 2,623 | 99 | yes |
| NGC 4314 | MJ | 2007-02-20 | 2.3 | 2,700 | 127 | no |
| NGC 4371 | MJb | 2006-12-27 | 2.4 | 1,800 | 85 | no |
| NGC 4371 | MN | 2006-06-19 | 1.8 | 1,800 | 175 | no |
| NGC 4379 | MJ | 2007-02-21 | 2.7 | 1,800 | 97 | yes |
| NGC 4394 | MJ | 2007-05-11 | 1.5 | 2,556 | 123 | yes |
| NGC 4448 | MJb | 2007-04-16 | 2.3 | 2,700 | 85 | yes |
| Galaxy | axis | date | seeing | exp.-time | angle | sky |
|---|---|---|---|---|---|---|
| [”] | [s] | [∘] | ||||
| (1) | (2) | (3) | (4) | (5) | (6) | (7) |
| NGC 4501 | MJ | 2010-04-06 | 2.0 | 3,340 | 140 | yes |
| NGC 4501 | MN | 2010-04-08 | 2.1 | 2,505 | 50 | yes |
| NGC 4536 | MJ | 2010-04-08 | 3.6 | 2,385 | 120 | yes |
| NGC 4536 | MN | 2010-04-10 | 2.1 | 2,500 | 30 | yes |
| NGC 4569 | MJ | 2007-06-15 | 2.1 | 2,700 | 14 | yes |
| NGC 4569 | MN | 2010-04-12 | -a | 2,880 | 115 | yes |
| NGC 4698 | MJ | 2008-12-28 | 2.4 | 2,700 | 166 | no |
| NGC 4736 | MJ | 2009-12-12 | 1.9 | 2,400 | 105 | yes |
| NGC 4736 | MNc | 2008-04-01 | 2.2 | 2,700 | 30 | yes |
| NGC 4772 | MJb | 2008-12-29 | 2.5 | 2,700 | 145 | no |
| NGC 4826 | MJb | 2008-01-09 | 2.0 | 2,187 | 96 | yes |
| NGC 4826 | MNc | 2009-06-25 | 1.5 | 2,122 | 25 | yes |
| NGC 5055 | MJ | 2008-03-05 | 4.0 | 2,700 | 103 | yes |
| NGC 5055 | MN | 2009-06-26 | 2.2 | 2,400 | 13 | yes |
| NGC 5248 | MJb | 2007-04-18 | 1.6 | 2,700 | 109 | yes |
| NGC 5566 | MJ | 2005-07-07 | 2.5 | 1,800 | 30 | no |
| NGC 5566 | MN | 2006-05-24 | 2.0 | 1,750 | 120 | no |
| NGC 7177 | MJb | 2007-08-11 | 2.3 | 2,700 | 60 | yes |
| NGC 7177 | MNc | 2009-11-12 | 1.9 | 2,600 | 173 | yes |
| NGC 7217 | MJ | 2007-08-12 | 1.7 | 2,700 | 81 | yes |
| NGC 7217 | MNc | 2008-12-29 | 1.4 | 2,400 | 178 | no |
| NGC 7331 | MJ | 2007-08-11 | 1.7 | 2,700 | 171 | yes |
| NGC 7743 | MJb | 2008-12-28 | 2.3 | 2,400 | 100 | no |
| NGC 7743 | MNc | 2009-10-17 | 2.3 | 2,400 | 167 | no |
Comments: a) No seeing information available. b) The position angle differs by more than 10∘ from the Hyperleda published value. c) MN axis PA not orthogonal to MJ axis PA.
Furthermore we observe a collection of kinematic template stars (G and K giants, see Tab. 3, metallicity: [Fe/H] = -0.35 – 0.46) at the beginning and spectroscopic standards throughout the duration of this campaign. The stars are wiggled and trailed along the slit such that a spectrum is recorded at each position where the star crosses the slit. This is used to map out the anamorphic distortion of the spectrograph.
| Identifier | type | [Fe/H] | date of obs. |
|---|---|---|---|
| (1) | (2) | (3) | (4) |
| HR 2600 | K2III | -0.35 | 04/03/2005 |
| HR 3369 | G9III | 0.17 | 04/02/2005 |
| HR 3418 | K2III | 0.09 | 04/03/2005 |
| HR 3427 | K0III | 0.16 | 04/03/2005 |
| HR 3428 | K0III | 0.24 | 04/03/2005 |
| HR 3905 | K2IIIb | 0.46 | 04/02/2005 |
| HR 6018 | K0III-IV | 0.01 | 04/02/2005 |
| HR 6159 | K7III | -0.13 | 04/02/2005 |
| HR 6770 | G8III | -0.05 | 04/03/2005 |
| HR 6817 | K1III | -0.06 | 04/02/2005 |
| HR 7576 | K3III | 0.42 | 04/03/2005 |
Comments: a) From Worthey et al. (1994).
4. Data Reduction
We reduce the long-slit spectra following standard procedures of bias subtraction, cosmic ray rejection and flat fielding under MIDAS described in Mehlert et al. (2000) with additional steps needed to correct for spectral alignment and anamorphism. We correct a two degree tilt between the spectra and the CCD rows by appropriate sub-pixel shifting of the CCD columns. Two bad columns at positions corresponding to = 4850 Å are corrected through interpolation. We perform the wavelength calibration on neon and cadmium arc frames with typically ten lines. Where the line signal is low we bin over a few rows along the spatial direction but never over more than five pixels corresponding to 1.2 arcseconds. After the original line identification we first fit a 4th-order polynomial to the line positions along the spatial direction in order to remove noise-induced row to row jitter, and then fit a 3rd-order polynomial along the spectral direction. The remaining RMS scatter in line position is below one pixel. We then rebin the spectra in log-wavelength and correct for anamorphic distortion. The distortion of LRS is measured using stars which are trailed along the slit in order to generate several spectra or traces along the whole length of the slit. We centroid the traces by calculating the first moment of the photon count in a 10 pixel wide window around the trace. We then first fit a 3rd-order polynomial to describe the trace position as function of wavelength and then a firther 3rd-order polynomial to the trace positions in each column to model the distortion. We find a distortion of up to ten pixel in the corners of the CCD with respect to the centre of the detector (see also Fig 2. in Saglia et al. 2010). We correct for the distortion by means of sub-pixel shifting. Counts of individual pixel are distributed into pixel of the target frame according the their overlapping surface area. We measure the distortion on several stellar spectra taken in similar manner at different nights. We find that the residual distortion at the edges of the chip — after correcting one stellar spectra with the distortion information of a different night — is never larger than 1.5 arcseconds. This is below the typical FWHM of the PSF of our observations and, more importantly, well below the typical spatial bin sizes that we use at the ends of the slit. To correct for flexure of the instrument during the night we measure the wavelength position of the 5577 Å skyline at the slit ends and correct the wavelength calibration to zeroth order by adding a constant offset. The median absolute offset of all observations is 17 kms-1. Where dedicated sky spectra are available, we collapse them along the spatial direction in order to obtain a single maximum signal-to-noise sky spectrum. This spectrum is then scaled according to the exposure time of the object and subtracted from the full frame. In cases where no sky frame is available, the sky signal is determined from the slit ends. One advantage of long-slit spectroscopy is that often the slit ends do contain sufficient non-object contaminated sky. However, the differential slit illumination is subject to change with time because the HET prime focus assembly moves across the telescope pupil during the duration of an observation. We test the effect of this differential illumination on 44 blank sky spectra obtained over the course of this survey. We use the slit ends to determine the sky signal in the same way as we do for the galaxy spectra. We then determine the differences between those and the sky signal that we measure from the slit centre. We find that the residuals amount to no more than 5% of the sky signal in all cases. We then derive kinematics using 5% higher and 5% lower sky values. The resulting errors are significantly smaller than the reported error bars in all cases. In the case of the major axis observation of NGC 3368, NGC 4569, and the minor axis observation of NGC 4569, the use of the dedicated sky frame results in an over-subtraction of the sky (i.e. clearly negative residuals) possibly because of stray light or an increased level of sky background at the time the sky frame was taken. In these cases we use the sky from the slit ends instead. In the cases of large galaxies such as NGC 3031, we test for object contamination by using different window sizes at the slit ends for the sky extraction. We find the effect of object contamination to be negligible in all cases. Finally, all frames go through an extensive visual inspection. Artifacts like residuals of comic ray removal are corrected though interpolation of the neighbouring pixel.
4.1. Derivation of the Kinematics and Template Library
We derive stellar kinematics using the Fourier Correlation Quotient (FCQ) method of Bender (1990); Bender et al. (1994). The log-wavelength calibrated and sky-subtracted spectra are spatially binned to reach -values of at least 30 per pixel. An 8th-order polynomial is then fitted to the continuum and the first and last three channels in Fourier space are filtered out to remove low and high frequency variations in the continuum level.
FCQ measures the full line of sight velocity distribution (LOSVD). By means of deconvolving the autocorrelation function, the FCQ method is more robust against template mismatches than other Fourier or pixel-space based methods. Nevertheless, nebular emission lines can significantly affect the derived higher moments of the LOSVDs and therefore need to be taken into account for the derivation of the kinematics. This introduces the necessity of a very accurate model spectrum because otherwise residual mismatches between the observed galaxy spectrum and the broadened model spectrum will mimic emission signatures which are then incorrectly removed. We therefore form a pool of template spectra by combining actual observed stellar spectra (see Tab. 3) with synthetic simple stellar population templates (SSP) from Vazdekis (1999). Those include varying metallicities and ages. We use a sub-sample of the published spectra with Salpeter IMF (Salpeter 1955), and all combinations of ages of 1, 2, 5, 10, and 17.78 Gyr and metallicities of [Fe/H] = -1.68, -1.28, -0.68, -0.38, +0.00, +0.20. The published SEDs have a nominal resolution of 1.8 Å (FWHM) which corresponds to = 45 kms-1 and therefore slightly lower than the spectral resolution of = 39.3 kms-1.
 |
We run FCQ with the collection of all velocity templates. Then we choose the single best-fitting template based on the minimum RMS between the broadened template and the galaxy spectrum
| (1) |
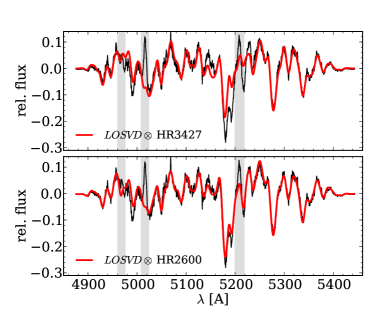
where 4817 Å to 5443 Å is the fitted wavelength range, is the galaxy spectrum, is the -th template spectrum, and is the broadening function derived from FCQ. Note that this is different from other algorithms such as the Maximum Penalized Likelihood (MPL) technique of Gebhardt et al. (2000) or the Penalized Pixel-Fitting method (pPXF) of Cappellari & Emsellem (2004)) which fit a linear combination of their templates. FCQ subsequently fits Gaussians with Hermite expansions ( and moments; Gerhard 1993; van der Marel & Franx 1993) to the derived LOSVDs. In Fig. 2 we show examples of fits with two different broadened templates. While FCQ indeed finds very similar values for the moments of the LOSVD, the quality of the template match differs significantly in the two cases.
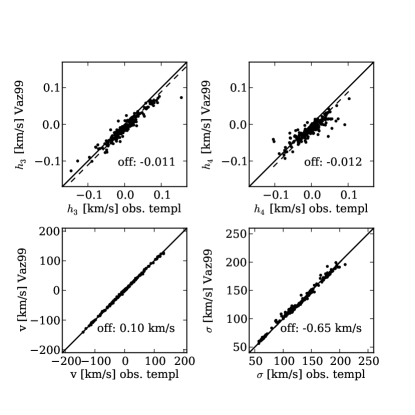
In Fig. 3, we compare the impact of the usage of either just our observed templates or just the SSP library. We compare only a subset of galaxies (NGC 2775, NGC 2880, NGC 3675, NGC 4030, NGC 4371 NGC 4379, and NGC 7457) for which we detect no significant emission in order to assure that the derived moments are not affected by emission. The biases that we introduce by adding the SSP templates to our library are generally small ( kms-1, , and much smaller than our median errors on the respective moments.
As our spectra often reach into the disk regions we deal with relatively low velocity dispersions. In a few cases the derived dispersions are of the order of the instrumental resolution. The matter gets complicated by the fact that the disk regions are also the regions of lowest surface brightness and therefore the regions with poorest . It is important to understand how reliable the derived moments are under these circumstances.
A caveat of the deconvolution in Fourier space is the amplification of high frequency noise. Fourier-based algorithms therefore filter the signal before the actual deconvolution step. FCQ uses the optimal Wiener filter (Brault & White 1971; Simkin 1974). The basic idea is to decompose the Fourier transform of the input data into a Gaussian contribution — the data part – and an exponential function — the noise part. The optimal Wiener filter then weighs the various signal channels according to their relative contribution to the data part of the input signal (for details see Bender 1990). While a purely Gaussian LOSVDs ought to be well modelled by a Gaussian in Fourier space, the Gauss-Hermite moments cause higher frequency shoulders, that are easily swallowed by the noise. Adjusting the filter width may recover characteristics of the LOSVD (Bender et al. 1994) at the cost of increased statistical uncertainty.
Here we choose not to broaden the Wiener Filter as this yields better stability against statistical deviations. But this causes biases especially at low velocity dispersions. To correct for these biases we carry out extensive Monte Carlo simulations on a regular parameter grid of velocity dispersion, , , and template. We generate artificially broadened spectra at each grid point with 30 different noise realisations according to the input signal to noise. We find that the necessary corrections to , and are well behaved and linear functions between input and retrieved values and independent of input template if the velocity dispersion is larger than 75 kms-1, the signal to noise is larger than 30 per pixel and a stellar template is used. The SSP templates cause non-linear behaviour at small velocity dispersions. While we still use the SSP templates to generate broadened model spectra during the emission line fitting, the reported kinematic values are exclusively based on stellar templates, and corrected for biases using
Tab. 4 and 5 list the corresponding parameters that we obtain from the simulations. For velocity dispersions below 75 kms-1 and per pixel, we do not report values for and . Further we report values of and only for .
We estimate statistical errors in the derived moments through Monte Carlo simulations as described in Mehlert et al. (2000). Once the optimum LOSVD is derived by FCQ we generate the synthetic spectra using the fitted , , and -parameters and the best fitting stellar template. In a similar manner as for the bias correction, 100 different realisations of artificial noise are then added to the spectra to reach the same signal to noise values as in the original spectra. We then use FCQ again to derive the kinematics on those spectra. The reported errors correspond to the statistical one-sigma deviations from the mean.
| per pixel | ||||
|---|---|---|---|---|
| 22.5 | 40.0 | 37.5 | 75.0 | |
| 1.06 | 1.06 | 1.06 | 1.07 | |
| -11.04 | -10.89 | -10.80 | -10.70 | |
| per pixel | ||||
|---|---|---|---|---|
| [kms-1] | 30.3 | 37.5 | 75.0 | |
| 75.0 | 1.3084 | 1.2947 | 1.2734 | |
| 100.0 | 1.1281 | 1.1142 | 1.0874 | |
| 150.0 | 1.0182 | 1.0104 | 1.0000 | |
| 200.0 | 1.0103 | 1.0059 | 0.9988 | |
| 250.0 | 1.0037 | 1.0008 | 0.9945 | |
| 75.0 | 0.0002 | 0.0001 | 0.0001 | |
| 100.0 | 0.0003 | 0.0003 | 0.0002 | |
| 150.0 | 0.0003 | 0.0003 | 0.0003 | |
| 200.0 | 0.0009 | 0.0008 | 0.0006 | |
| 250.0 | 0.0010 | 0.0010 | 0.0009 | |
| 75.0 | 1.8521 | 1.8088 | 1.7277 | |
| 100.0 | 1.4994 | 1.4500 | 1.3555 | |
| 150.0 | 1.0857 | 1.0655 | 1.0307 | |
| 200.0 | 1.0407 | 1.0275 | 1.0045 | |
| 250.0 | 1.1503 | 1.1371 | 1.1089 | |
| 75.0 | 0.0864 | 0.0814 | 0.0738 | |
| 100.0 | 0.0280 | 0.0240 | 0.0160 | |
| 150.0 | 0.0165 | 0.0148 | 0.0127 | |
| 200.0 | 0.0105 | 0.0104 | 0.0104 | |
| 250.0 | -0.0027 | -0.0015 | 0.0006 | |
4.2. Emission line subtraction and gas kinematics
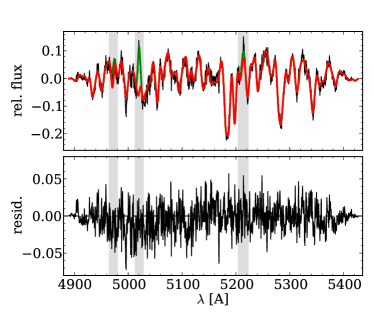
A significant fraction of the objects in our sample show emission in (4861.32 Å), [O iii] (4958.83 Å & 5006.77 Å) and [N i] (5197.90 Å & 5200.39 Å). The nitrogen emission line lies on the red flank of the Mg triplet feature – the most important kinematic feature in our spectral range. While typically weak, the nitrogen emission often significantly affects the derivation of -moments. -moments measure the asymmetric deviation from a Gaussian and are expected to behave antisymmetrically with respect to the galaxy centre in the case of axisymmetric systems. Deviations from this antisymmetry may hint at contamination by nitrogen emission lines. We therefore decided to remove nebular emission following a similar procedure as the GANDALF routine (Sarzi et al. 2006): We perform a first fit to the galaxy spectrum over a larger spectral range reaching from 4820 Å to 5440 Å using the FCQ algorithm. We then subtract the best fitting broadened stellar spectrum from the galaxy spectrum and fit Gaussian functions — using a standard least squares algorithm — to the residual emission. The algorithm first searches for emission in a 500 kms-1 window around the brighter oxygen line at 5007 Å (the oxygen doublet is well resolved at our instrumental resolution) red-shifted to the systemic velocity. It fits for the three parameters of amplitude, central velocity, and the velocity dispersion. It then goes on to the other and generally weaker emission lines and performs a fit to their amplitude while assuming the same central velocity and velocity dispersion as the oxygen line. In principle the ratio of the two oxygen emission lines is given by atomic physics and is a constant of value 0.33. Rather than fixing these values during the fit we also fitted the lower amplitude line as this provided another handle on the reliability of our method. We then subtract the best fitting emission lines from the original galaxy spectrum and repeat the FCQ multiple-template fit. The best fitting broadened template is again subtracted from the input spectrum and the gas emission fit is repeated on the improved difference spectrum. An example for a spectrum that shows signs of nebular emission is shown in the upper panel of Fig. 4. We plot the residuals between the recorded spectrum and the broadened model spectrum after the removal of the emission in the lower panel. This iterative approach was found to converge very quickly. A fourth FCQ fit typically yields no significant change in the derived kinematics any more. Our reported stellar kinematics went through three subsequent iterations of template fitting with two interleaved gas emission removal steps.
 |
The gas removal routine gives access to the study of line ratios (Sarzi et al. 2006) and is also a necessary step before the calculation of absorption line indices and subsequent stellar population analysis. Both of which will be subject to a forthcoming publication.
4.3. Identification of pseudobulges
If no classification is available already from Fisher & Drory (2008) or Fisher & Drory (2010), we follow the same procedure for the identification of pseudobulges. We define a bulge photometrically as the excess light over the inwards extrapolation of the outer disk exponential luminosity profile. The bulge-to-disk decompositions that we adopt in §4.4 allow us to determine the bulge region of an object. Here, we classify bulges using close-to -band HST images (, & ). While these bands are subject to dust obscuration they are also sensitive to an enhancement in star formation rate, a feature commonly observed in pseudobulges (Fisher 2006). We visually inspected the HST images to see whether the bulge regions contain disk-like structures such a nuclear spirals, nuclear bars and/or nuclear rings. If such structure is present we call the photometric bulge a pseudo-bulge. If there is no structure (the bulge resembles an elliptical galaxy with a smooth light distribution), we call this bulge a classical bulge.
Weak central dust spirals that also occur frequently in elliptical galaxies (e.g. Storchi-Bergmann et al. 2007) — often distinguishable from the outer disk because they are inclined differently — are no reason for us to call a bulge a pseudobulge. NGC 2841 poses an example for this situation. A dust spiral can easily be identified in HST F438W, but it is misaligned with the outer disk also seen only in vicinity of the nucleus.
Yet, a few objects remain for which we do not feel confident to assign a classification based on their HST morphology: NGC 2460, NGC 3953, NGC 4826 and NGC 7217. We treat them as unclassified throughout this work. As mentioned in §2, we also do not classify the bulges of the galaxies NGC 3593 and NGC 7331 due to their high inclination. In Appendix B we give a detailed explanation for the bulge classification for each individual object.
4.4. Photometry
We use the results from decompositions of surface brightness profiles to investigate possible correlations between photometric parameters and kinematic structure. Also the bulge-disk decompositions serve to identify the actual bulge region of a particular galaxy.
| No. | Instrument | Filter | Scale | Field Of View | Reference |
|---|---|---|---|---|---|
| (arcsec/pixel) | (arcsec) | ||||
| 1 | HST Nicmos 1 | F160W | 0.043 | 11 11 | MAST archive1 |
| 2 | HST Nicmos 2 | F160W | 0.075 | 19.2 19.2 | MAST archive1 |
| 3 | HST Nicmos 3 | F160W | 0.20 | 51.2 51.2 | MAST archive1 |
| 4 | 2MASS | H | 1.0 | 512 1024 | IPAC archive |
| 5 | 2MASS | H | 1.0 | variable size, mosaic | Jarrett et al. (2003) |
| 6 | Spitzer IRAC | 3.6 m | 0.60 | variable size, scan | IPAC archive2 |
| 7 | Spitzer IRAC (SINGS) | 3.6 m | 0.75 | variable size, scan | SINGS3 |
| 8 | HST ACS/WFC | F814W | 0.049 | 202 202 | MAST archive1 |
| 9 | HST WFPC2 | F547M | 0.10 | 80 80 | MAST archive1 |
| 10 | HST WFPC2 | F814W | 0.10 | 80 80 | MAST archive1 |
| 11 | Perkins 1.8 m OSIRIS | H | 1.5 | 412 412 | Eskridge et al. (2002) |
| 12 | Lick 3 m pNIC | K | 0.24 | 15.4 15.4 | Rauscher (1995) |
| 13 | CTIO 1.5 m OSIRIS | H | 1.1 | 312 312 | Eskridge et al. (2002) |
| 14 | William Herschel Telescope INGRID | K | 0.24 | 252 252 | Knapen et al. (2003) |
| 15 | Calar Alto Observatory 2.2 m MAGIC Nicmos 3 | K | 0.66 | 172 172 | Möllenhoff & Heidt (2001) |
| 16 | Mauna Kea 0.61 m Nicmos256 | K | 2.1 | 644 568 | Tully et al. (1996) |
| 17 | UKIRT 3.8 m IRCAM II | H | 1.7 | 198 72 | de Jong & van der Kruit (1994) |
We derive surface photometry following the prescriptions in Fisher & Drory (2008) and Fisher & Drory (2010). For each galaxy, we combine multiple data sources mostly in the infrared (but sometimes in optical bands) to obtain a final 1D composite surface brightness profile. The different data have been calibrated against the H-band using 2MASS magnitudes. High-resolution HST imaging is used in the galaxy center, while wide-field images sample the outer disk. The resulting composite profile of each galaxy is used to derive the bulge-to-disk photometric decomposition. Our method is well tested and has been used in several publications (Fisher & Drory 2008, 2010; Kormendy et al. 2009). Our principal source of data is 2MASS -band maps (Skrutskie et al. 2006). When available we use data from 2MASS Large Galaxy Atlas (Jarrett et al. 2003). We prefer -band over because the 2MASS -band data is more sensitive than the 2MASS data. For all galaxies we use the NASA/IPAC Extragalactic Database to search for ancillary ground based -band data. We also include Spitzer 3.6 data. Finally, when available we also include high resolution images from HST/NICMOS. In a few cases, where galaxies were lacking archival NICMOS data, we use or band data instead. The high resolution data can be crucial to accurately constraining the bulge-disk decomposition. Fisher & Drory (2010) investigates the uncertainty introduced from mixing filters in this way, it is typically smaller than 0.1 mags, and therefore small compared to the uncertainty in the fit. Also, Fisher & Drory (2008) derives very similar Sérsic indices with -band data as with -band profiles.
We fit ellipses to all images. Isophotal fitting is carried out using the code of Bender & Moellenhoff (1987). See Fisher & Drory (2008) for a brief summary of the procedure. The code returns a 2-D surface brightness profile (including for each ellipse center, major & minor axis size, position angle, and mean surface brightness). We then combine all profiles into a composite surface brightness profile. The power of this method is two-fold. First, combination of surface brightness profiles allows us to robustly identify systematic errors from point-spread-functions and sky subtraction. Secondly the resulting composite profile has an extremely high dynamic range in radius, which is necessary to accurately constrain the bulge-disk decomposition (see discussion in the Appendix of Fisher & Drory 2008 and also Kormendy et al. 2009). The zero points of our profiles are matched against the 2MASS data.
We determine bulge and disk parameters by fitting each surface brightness profile with a one-dimensional Sérsic function plus an exponential outer disk,
| (2) |
where represents the distance along the major axis, and are the central surface brightness and scale length of the bulge, and represent the central surface brightness and scale length of the outer disk, and represents the bulge Sérsic index (Sersic 1968). The half-light radius, , of the bulge is obtained by converting ,
| (3) |
where the value of is a proportionality constant defined such that (Ciotti 1991). and are the complete and incomplete gamma functions, respectively. We use the approximation (Caon et al. 1993). We restrict our range in possible Sérsic indices to to ensure that the approximation is accurate. Bulge and disk magnitudes are adjusted to account for the shape of the bulge using the ellipticity profile from the isophote fitting.
Intermediate type galaxies are known to contain many components that are not well described by the decomposition into a Sérsic bulge and exponential disk (e.g. bars, rings, nuclear star clusters). Similar to the outer disk, in the bulge we exclude significant non-Sérsic components such as nuclear bars and nuclear rings. The inclusion of these features can have unpredictable effects on the Sérsic index, depending on the relative size of the feature, and what type it is. The appendix of Fisher & Drory (2008) discusses how masking data in the bulge will affect the decomposition. Essentially, this has the effect of decreasing the robustness of the fit, which will be reflected in the error bars. The parameters from the decompositions are presented in Tab. 7 , the image data sources are described in Tab. 6.
The surface brightness profile of NGC 5566 does not follow a typical bulge/disk profile. We publish the obtained kinematics here but exclude this object from all further analysis.
| Galaxy | Bulge | Data sources | |||||||
|---|---|---|---|---|---|---|---|---|---|
| morph. | mag arcsec-2 | arcsec | mag | mag arcsec-2 | arcsec | mag | |||
| (1) | (2) | (3) | (4) | (5) | (6) | (7) | (8) | (9) | (10) |
| NGC 1023 | c | 2.52 0.81 | 15.76 1.11 | 12.35 4.39 | 7.15 1.11 | 16.62 0.32 | 62.20 6.56 | 5.66 0.35 | 5,10,15 |
| NGC 2460 | p | 3.49 0.32 | 18.02 0.46 | 12.69 4.40 | 9.19 0.46 | 16.40 0.28 | 11.42 0.98 | 9.11 0.31 | 2,4 |
| NGC 2681 | p | 3.82 0.31 | 14.58 0.63 | 3.74 3.00 | 8.35 0.63 | 17.32 0.33 | 23.78 2.76 | 8.44 0.37 | 3,4,6 |
| NGC 2775 | c | 3.23 0.93 | 17.28 1.02 | 15.86 5.50 | 8.00 1.02 | 17.20 0.61 | 41.28 7.91 | 7.12 0.67 | 4,6,10,11,14,15 |
| NGC 2841 | c | 3.22 0.58 | 16.55 0.68 | 15.46 8.98 | 7.33 0.68 | 16.49 0.17 | 60.51 2.82 | 5.58 0.18 | 2,5,7 |
| NGC 2859 | c | 2.34 0.65 | 16.23 1.08 | 8.52 1.08 | 19.11 0.47 | 55.17 8.93 | 8.41 0.52 | 5,6,8 | |
| NGC 2880 | c | 3.41 0.48 | 17.49 0.59 | 8.85 0.59 | 18.29 0.40 | 25.47 1.88 | 9.26 0.41 | 4,10 | |
| NGC 2964 | p | 1.01 0.34 | 15.43 0.51 | 2.04 0.50 | 11.18 0.51 | 16.40 0.18 | 16.07 0.65 | 8.37 0.19 | 2,4,6 |
| NGC 3031 | c | 4.09 0.48 | 17.14 0.62 | 70.70 54.91 | 4.49 0.62 | 16.59 0.25 | 132.80 8.05 | 3.98 0.26 | 2,5,7 |
| NGC 3166 | p | 1.24 0.30 | 14.37 0.39 | 4.36 1.12 | 8.37 0.39 | 15.86 0.44 | 15.47 2.66 | 7.92 0.50 | 5,6,9,11 |
| NGC 3245 | c | 2.75 0.56 | 15.16 0.80 | 4.51 1.70 | 8.69 0.80 | 16.44 0.28 | 21.60 1.49 | 7.77 0.30 | 2,4,6 |
| NGC 3351 | p | 1.38 0.74 | 15.99 0.60 | 8.08 3.10 | 8.59 0.60 | 17.01 0.44 | 49.48 5.13 | 6.54 0.47 | 2,5,7 |
| NGC 3368 | p | 2.46 0.77 | 15.97 0.75 | 13.08 7.29 | 7.25 0.75 | 16.57 1.95 | 35.26 29.61 | 6.84 2.31 | 2,4,7 |
| NGC 3384 | p | 1.58 0.22 | 14.39 0.40 | 5.35 1.16 | 7.83 0.40 | 16.96 0.15 | 44.42 3.13 | 6.73 0.18 | 2,5,6 |
| NGC 3521 | c | 3.66 0.77 | 15.48 1.50 | 8.55 6.36 | 7.48 1.50 | 15.99 0.31 | 49.53 3.87 | 5.52 0.33 | 2,5,7 |
| NGC 3593 | ? | 1.22 0.21 | 16.18 0.27 | 14.55 2.16 | 7.57 0.27 | 17.61 0.30 | 52.52 4.99 | 7.02 0.33 | 3,5,6,11 |
| NGC 3627 | p | 1.50 0.58 | 14.53 0.59 | 4.77 1.52 | 8.24 0.59 | 16.72 0.15 | 65.99 0.15 | 5.63 0.16 | 3,5,7 |
| NGC 3675 | p | 1.57 1.12 | 16.35 1.93 | 8.66 1.93 | 16.22 0.31 | 36.85 3.42 | 6.40 0.34 | 2,5,6,11 | |
| NGC 3898 | c | 3.22 0.86 | 15.93 1.27 | 7.63 2.88 | 8.24 1.27 | 17.25 0.64 | 29.00 4.56 | 7.94 0.68 | 2,5,6 |
| NGC 3945 | p | 1.79 0.48 | 16.00 0.76 | 9.82 3.50 | 8.05 0.76 | 19.02 0.44 | 83.17 26.76 | 7.43 0.64 | 5,6,10 |
| NGC 3953 | ? | 2.43 0.68 | 17.15 0.96 | 12.74 8.03 | 8.49 0.96 | 17.44 0.15 | 66.14 4.73 | 6.34 0.19 | 2,3,5,7 |
| NGC 3992 | c | 3.18 1.18 | 17.44 1.44 | 12.23 3.74 | 8.73 1.44 | 17.65 0.50 | 77.54 19.36 | 6.20 0.62 | 5,9,16 |
| NGC 4030 | p | 1.98 1.30 | 16.50 1.52 | 5.18 2.14 | 9.89 1.52 | 15.60 0.36 | 15.82 1.95 | 7.61 0.41 | 2,4,6,13 |
| NGC 4203 | c | 2.45 0.83 | 15.72 1.51 | 8.43 1.51 | 17.28 0.37 | 30.31 3.53 | 7.88 0.41 | 4,6,10 | |
| NGC 4260 | c | 3.68 0.42 | 19.08 0.48 | 21.49 11.93 | 9.08 0.48 | 17.02 0.19 | 21.69 1.59 | 8.34 0.22 | 2,4,6 |
| NGC 4274 | p | 1.52 0.24 | 15.49 0.28 | 5.92 1.10 | 8.73 0.28 | 17.03 0.16 | 46.53 2.92 | 6.70 0.19 | 5,6,8 |
| NGC 4314 | p | 2.72 0.96 | 17.12 1.09 | 10.53 6.96 | 8.82 1.09 | 16.70 0.36 | 35.08 2.65 | 6.98 0.38 | 2,4,6,14 |
| NGC 4371 | p | 2.21 1.00 | 16.66 1.35 | 10.97 6.00 | 8.37 1.35 | 18.10 0.98 | 44.59 13.45 | 7.86 1.07 | 1,4,6 |
| NGC 4379 | c | 2.39 0.55 | 16.72 0.69 | 6.40 1.97 | 9.56 0.69 | 16.91 0.37 | 13.52 1.48 | 9.26 0.40 | 1,4,8 |
| NGC 4394 | p | 1.58 0.67 | 16.28 0.87 | 6.10 1.81 | 9.43 0.87 | 18.40 0.25 | 57.75 6.38 | 7.60 0.30 | 4,6,11,12 |
| NGC 4448 | p | 1.19 0.25 | 16.43 0.31 | 6.70 1.01 | 9.52 0.31 | 16.85 0.17 | 28.42 0.97 | 7.59 0.18 | 5,6,10,11 |
| NGC 4501 | p | 1.25 1.06 | 15.43 1.34 | 5.31 1.53 | 8.99 1.34 | 15.81 0.46 | 39.26 3.89 | 5.85 0.49 | 5,6,12 |
| NGC 4536 | p | 1.47 0.35 | 14.77 0.62 | 3.98 1.18 | 8.88 0.62 | 17.18 0.15 | 32.32 1.82 | 7.64 0.17 | 2,5 |
| NGC 4569 | p | 2.34 0.97 | 15.13 1.59 | 4.80 2.33 | 8.60 1.59 | 16.84 0.32 | 61.32 6.42 | 5.91 0.36 | 2,3,5,7 |
| NGC 4698 | c | 2.51 0.53 | 15.66 0.66 | 5.11 1.41 | 8.97 0.66 | 17.32 0.34 | 34.93 2.76 | 7.61 0.36 | 2,4,6,11 |
| NGC 4736 | p | 1.23 0.30 | 13.80 0.41 | 7.76 1.65 | 6.56 0.41 | 14.93 0.35 | 26.82 3.85 | 5.80 0.41 | 3,5,7 |
| NGC 4772 | c | 3.03 0.88 | 17.73 1.20 | 13.49 8.24 | 8.84 1.20 | 18.87 0.55 | 71.96 16.04 | 7.59 0.64 | 4,11 |
| NGC 4826 | ? | 3.93 0.88 | 16.93 1.06 | 28.93 10.26 | 6.25 1.06 | 16.50 0.27 | 67.95 6.86 | 5.34 0.31 | 2,5,7 |
| NGC 5055 | p | 1.71 1.03 | 17.35 1.36 | 27.88 16.08 | 7.16 1.36 | 16.57 0.38 | 68.70 5.53 | 5.40 0.40 | 3,5,7 |
| NGC 5248 | p | 1.29 0.45 | 16.47 0.67 | 8.74 0.67 | 17.43 0.28 | 43.99 3.72 | 7.21 0.30 | 2,5,6 | |
| NGC 7177 | p | 2.03 0.52 | 16.35 0.59 | 7.02 3.17 | 9.08 0.59 | 16.42 0.31 | 15.45 0.73 | 8.49 0.32 | 2,4,6,17 |
| NGC 7217 | ? | 3.20 1.03 | 17.04 1.21 | 13.41 9.35 | 8.13 1.21 | 16.50 0.64 | 28.54 6.60 | 7.23 0.72 | 2,4,6,11 |
| NGC 7331 | ? | 2.85 1.02 | 16.20 1.30 | 16.63 9.90 | 6.88 1.30 | 16.97 0.47 | 61.61 9.04 | 6.03 0.52 | 3,5,7 |
| NGC 7743 | p | 3.66 0.52 | 15.15 0.89 | 2.37 1.04 | 9.94 0.89 | 17.14 0.22 | 22.27 1.96 | 8.41 0.25 | 2,4,6 |
Comments: a) These photometric decompositions are based on infrared and optical data, but calibrated against the H-band. b) The error on the effective radius is comparable to or larger than the value itself. We list the value that is preferred by the fit and the upper limit.
4.5. Bulge Radius
Here we are particularly interested in the kinematic properties of the bulge regions of our observed galaxies. Of course the derived LOSVDs will always be the light weighted average of all components (bulge, disk, bar) along a particular line of sight through the galaxy. But the photometric bulge to disk decompositions allow us to determine within which radius the bulge should dominate. We define the bulge radius along the major axis as the radius where the light contribution of the photometric bulge component exceeds the light contribution of the disk component by 25%:
| (4) |
where is the central surface brightness of the bulge component, is the central surface brightness of the disk component, and are the scale lengths of the bulge and disk components and is the Sérsic index (see previous Section for the relation between and ). One might argue that the bulge effective radius is a more natural choice as of course is dependent on the disk parameters. But we find that in a number of galaxies actually lies in a region that is dominated by disk light. The choice of 25% is a compromise between the desire to be reasonably dominated by the bulge component on the one hand and still wanting to maintain a sufficient number of resolution elements within the bulge radius on the other. The values for the bulge radius are listed in Tab. 9. In Fig. 16 we indicate the location of the bulge radius though a dashed vertical line.
5. Results
5.1. Kinematic profiles and comparison with literature
Tab. 8 gives an example of the format of the measured stellar kinematic moments as function of the distance from the center of the galaxy. The full listing is available electronically†††http://cds.u-strasbg.fr/. In the Appendix A we plot the kinematic profiles. When available, we also plot data from the literature for comparison. Integral Field Spectroscopic data from SAURON is available for some of the galaxies in our sample. In those cases we create pseudo long-slit data through interpolation of the SAURON , , , and maps along a slit aperture with a position angle corresponding to our observation. In general the agreement of our data with the published values is acceptable.
In a few cases such as NGC 4203 a difference between the previously published data and ours are explained by the difference in the observed position angle.
Bertola et al. (1995) find somewhat larger velocity dispersions for NGC 4379 than we do. Formally their instrumental dispersion should allow to resolve the 80 kms-1 — 118 kms-1 that we find for the dispersion in the bulge.
Dumas et al. (2007) finds larger velocity dispersions in the cases of NGC 3351 and NGC 5248 than we do. The dispersion of those objects is probably too low to be resolved by their instrumental dispersion of 110. kms-1.
Vega Beltrán et al. (2001) find systematically lower velocity dispersions for NGC 2841 than we do. However, we also plot data from Héraudeau & Simien (1998) which are in excellent agreement with ours.
The SAURON data for NGC 4698 (Falcón-Barroso et al. 2006) suggest a somewhat larger velocity dispersion over our whole observed range than we find. They also find negative moments on the east side. The dispersion of this galaxy ( 140 kms-1) should be well resolved by SAURON and such the difference remains somewhat mysterious but small.
| Galaxy | PA | r | v | |||
|---|---|---|---|---|---|---|
| [deg] | [”] | [kms-1] | [kms-1] | |||
| (1) | (2) | (3) | (4) | (5) | (6) | (7) |
| NGC 1023 | 87 | 51.46 | 186.55 2.71 | 92.16 2.55 | -0.067 0.017 | -0.037 0.015 |
The full listing is available electronicallyhttp://cds.u-strasbg.fr/.
5.2. Signatures of bars in velocity profiles
In our sample, 29 out of 45 of the galaxies are classified as barred or as hosting an oval. Bars and ovals will affect the observed kinematics and their presence should be reflected in the moments of the observed LOSVD. Bureau & Athanassoula (2005) use -body simulations to derive diagnostics for the presence of bars in edge-on disks. They find that double-hump rotation curves, plateaus and shoulders in velocity dispersion, and correlation of moments with velocity in contrast to the usually-seen anti-correlation are indicators for the presence of a bar. The double-hump describes a rotation curve that first rises quickly with radius, reaches a local maximum then drops slightly and starts rising again towards larger radii. We do see similar features in a number of our galaxies even though they are not observed edge-on (e.g. see the rotation curves for NGC 2841, NGC 3351, and NGC 3384 in Fig. 16). The signature is not always strong enough to form an actual local minimum after the fast inner rise. Instead, in some cases we observe shelves: the rise in velocity stagnates for a certain radial range but becomes larger again before finally flattening out (e.g. NGC 1023 and NGC 3627 in Fig. 16).
Out of 29 barred galaxies (including 6 ovals), 20 do show such features. However our data do not extend very far into the disk region in many of the objects in our sample; also visibility may be inhibited by the coarse spatial binning of some of our spectra. Further, this diagnostic tool was developed for edge-on systems, so it is likely that we miss bar signatures in the velocity profiles. However, 9 of the 16 non-barred galaxies show either shelves or double humps which may be an indication that those systems actually do host a bar that is not readily seen photometrically.
5.3. Central velocity dispersions
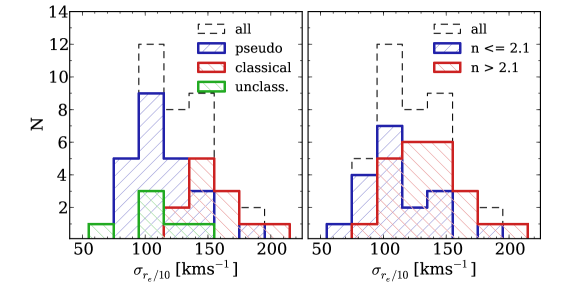
We calculate the central velocity dispersion of the galaxies in our sample by averaging the major axis dispersion within a tenth of the effective bulge radius that we obtain from the photometric decomposition. The values for the central dispersions are given in Tab. 9. The quoted errors correspond to the formal errors of the derived mean within .
In Fig. 5 we show corresponding histograms of the central dispersions. In the left panel we discriminate bulge types based on their morphology, in the right panel we discriminate by Sérsic index. There is significant overlap between the distributions of velocity dispersions for the classical and pseudobulges. Nonetheless, it is clear that, in our sample, pseudobulges have on average lower velocity dispersions. We find in our sample that classical bulges become exceedingly rare below central velocity dispersions of 100 kms-1. However, we caution that our sample is not volume limited.
 |
5.4. Velocity dispersion gradients
Inspection of the individual rotation curves reveals a wide variety of structures; however, in particular the shape of the velocity dispersion profile seems to fall into two rough classes.
|
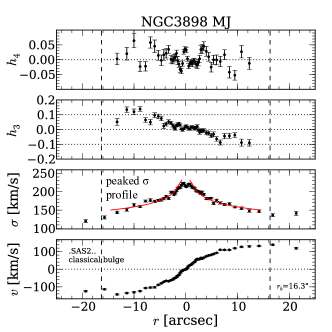
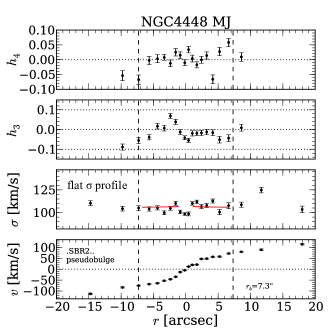
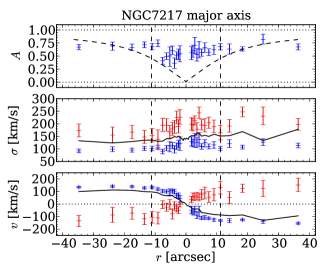
In Fig. 6 we show the kinematic profiles for the two galaxies NGC 3898 and NGC 4448 from our sample. Depicted are the velocity, the velocity dispersion, as well as the and moments of the Gauss-Hermite expansion of the LOSVDs. Dashed lines indicate the bulge radius from the photometric decomposition. While in the case of NGC 3898 the velocity dispersion rises all the way to the centre, NGC 4448 has a relatively flat dispersion profile within the bulge radius.
Similarly to Fisher (1997) we examine, the logarithmic slope of the velocity dispersion within the bulge radius and call it . We derive the slope point-wise and then take the average, i.e.
| (5) |
where always excludes the inner FWHM of the seeing of the particular observation and in some cases is chosen larger to exclude central features like nuclear regions of enhanced star formation (see Appendix B). In Fig. 6 we also overplot lines which correspond to the derived values. Further, in order to avoid a dependence of the slope on the particular binning scheme of each kinematic dataset, we use a different binning for the purpose of determining : we bin radially in 5 equally-sized bins in . In cases where the resulting bins do not all at least contain one data point, we use our previous bins.
An alternative to the presented method is using the ratio of the averaged velocity dispersions within two annuli within the bulge radius
| (6) |
as proxy for the slope. The choice of as cut radius for the two different annuli is somewhat arbitrary, but we do not find a strong dependence of our results on the specific radius chosen. Both values for the slope, and , are reported in Tab. 9.
We find that all bulges which are classified as pseudobulges indeed show flattened velocity dispersion profiles or even sigma drops (e.g. NGC 3351, NGC 3368, and NGC 3627 in Fig. 16). The dispersion profiles of many pseudobulges are sometimes slightly asymmetric. On the other, hand a majority of the classical bulges show centrally peaked velocity dispersion profiles (e.g. NGC 1023, NGC 2841, NGC 2880, and NGC 3245 in Fig. 16).
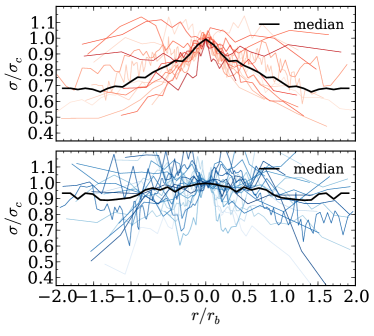
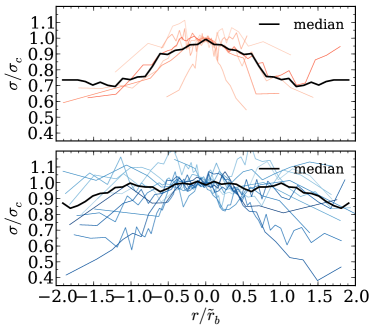
Fig. 7 summarizes this finding qualitatively, where we plot the velocity dispersion profiles along the major and minor axes for all our bulges separated by bulge type, normalized by central dispersion and bulge radius. We do not plot bulges that were left unclassified. For this plot we adjust the bulge radius that was obtained from a major axis profile by the mean ellipticity in the bulge region. Whilst not as clear, partly due to the lower number of profiles, but partly probably also due to the subtleties of choosing a correct radius for the normalisation, we again find that classical bulges tend to show centrally rising velocity dispersions.
 |
 |
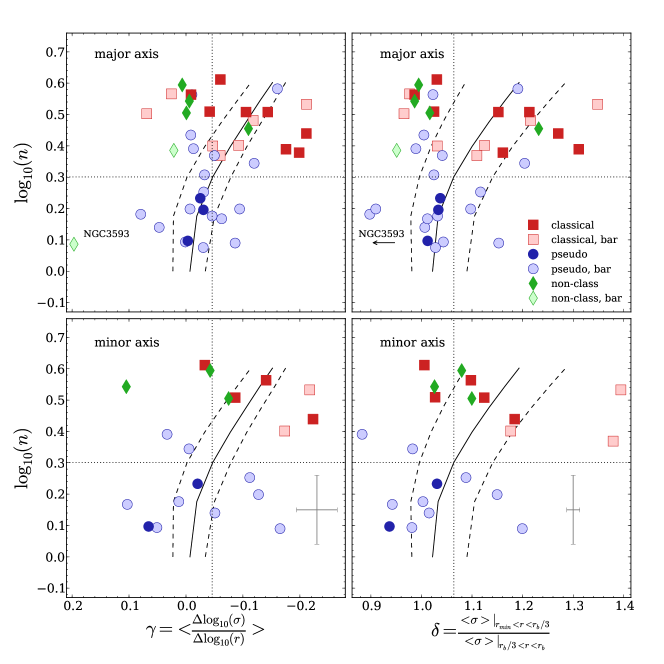
In Fig. 8 we now plot the Sérsic index from the photometric decomposition as a function of both metrics for the slope of the velocity dispersion. Similar to the distributions of central velocity dispersion, there is significant overlap in profile slope. Nonetheless, the bulges with large values of Sérsic index tend to have steeply decaying dispersions profiles. Similarly the bulges with low Sérsic indices more commonly have flat dispersion profiles. This result is true for both the logarithmic slope of dispersion, and the dispersion ratio.
The increasing slope of velocity dispersion with Sérsic index is not fully unexpected. For instance, Ciotti (1991) describes a series of models for isotropic and spherical galaxies which have a surface brightness profiles that follow a Sérsic law. He gives projected velocity dispersion profiles for his models and outside of the very central regions (), and for Sérsic indices larger than one, the slope is a monotonically increasing function of . We calculate slopes and ratios for these profiles in a similar manner as we did for our data. One caveat of this exercise is that our definition of a bulge radius is not applicable in the case of the one-component models. Also, we have to chose an inner cut radius for the fit as the models feature central sigma drops in the case of small . Sigma drops are an observed phenomenon (e.g. Falcón-Barroso et al. 2006), but our spatial resolution is typically not fine enough to resolve these. We somewhat arbitrarily fit for in the radial range of and calculate ratios for and . Note that our effective bulge radii are on average 15% smaller than the definition of the bulge radius that we use throughout the work. In Fig. 8 we overplot the obtained values as a black line. The dashed lines show the range of values one would obtain by choosing 50% larger or smaller outer cut radii for the integration. While the spherical and isotropic galaxies are a very simplistic model for the variety of bulges in our sample, one can see that the general trends are reproduced, however a more detailed dynamical modelling is needed to confirm this result.
In the major axis plots all unbarred pseudobulges fall below or very close to and (the corresponding values of the isotropic models for ) and only one unbarred classical bulge falls below . However 3 out of 8 unbarred classical bulges do fall significantly below suggesting that is more successful in discriminating bulge types. Again this picture is complicated further once barred galaxies are taken into account. The additional component of a bar seems to lead towards flatter dispersion profiles.
 |
5.5. Influence of seeing on velocity dispersion
The seeing disk and the width of the slit will smear the observed velocities and can create increases in the observed line of sight velocity dispersion. This effect is commonly known as slit smearing. All data presented here were observed with a slit width of 1 arcsecond. The effect of slit smearing on the velocity dispersion is therefore expected to be negligible compared to the effect caused by the seeing ( arcseconds in all cases). At least two galaxies NGC 3384 and NGC 3521 do show peaks in velocity dispersion in the central arcseconds (see Fig. 16) . In both galaxies the velocity profile also rises rapidly in the centre. We test whether this rapid rise in combination with the seeing may be responsible for the observed dispersion peak. We model the point spread function (PSF) with a Gaussian of the same FWHM. We then calculate the standard deviation of the velocity which is weighted by the PSF amplitude at all radii and subtracted the result from the observed velocity dispersion. In this simple one-dimensional model the PSF smearing does generate a central peak which is of similar size and amplitude as the observed one. We cannot rule out the possibility that the central peaks of NGC 3384 and NGC 3521 can be explained through PSF-smearing alone. We however refrain from correcting the presented velocity dispersions as an accurate correction has to include the knowledge of a high resolution luminosity profile and a more rigorous, 2-dimensional modelling of the PSF. We rather exclude the central peaks from the further analysis.
5.6. Distribution of and moments
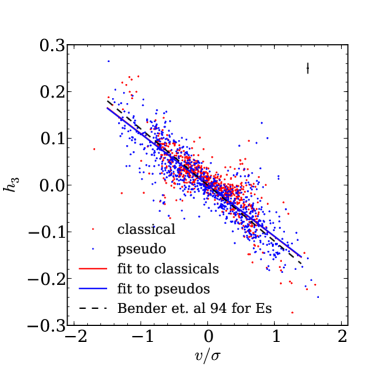 |
As measures the asymmetric deviation from a purely Gaussian distribution it detects lower velocity tails of the velocity distribution along the line of sight. Such tails arise naturally in disks (Binney & Tremaine 1987). Bender et al. (1994) found that local and local are strongly anti-correlated with a slope of in their sample of elliptical galaxies. Fisher (1997) finds a similar anti-correlation in the inner regions of his lenticular galaxies but also sees that, for a number of his objects, at values of the anti-correlation turns, at least briefly but abruptly, into a correlation.
We reproduce the plot for the local correlation of and from Bender et al. (1994) for our sample in Fig. 9 and color-code pseudobulges in blue and classical bulges in red. We find that the same correlation is reproduced in our intermediate type galaxies. The moments are generally anti-correlated with out to , irrespective of bulge type. A linear fit to the complete set of data points gives a slope of (. Separate fits to the subsample of classical bulges and pseudobulges give values that are indistinguishable within the errors. A Kolmogorov-Smirnov test (Smirnov 1939; Press 2002) for the median values of within individual galaxies yields a probability of 76% for the hypothesis that the classical and the pseudobulges stem from the same distribution. This local correlation is reproduced in the mean values for the bulge region (Fig. 10).
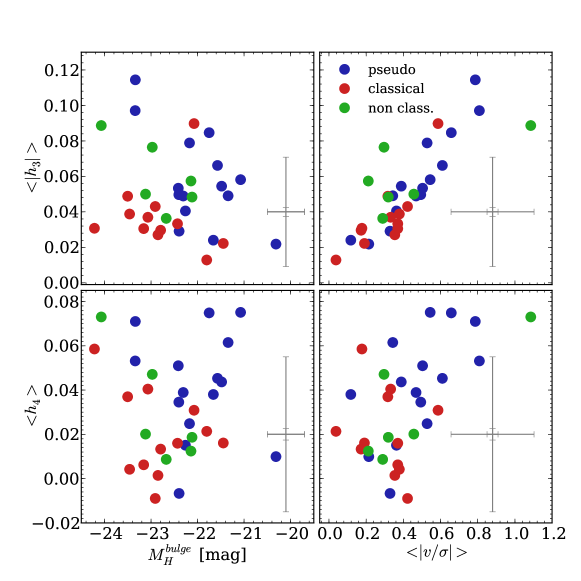
We further test for a possible correlation with -band bulge magnitude (see Fig. 10) and the bulge averaged value . We do not see any correlation between bulge luminosity and .
 |
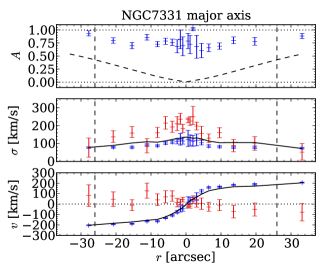
The moment of the Gauss-Hermite expansion measures the symmetric deviation from a Gaussian distribution. Negative describe a more boxy, centrally flattened distribution, more positive values describe centrally peaked distributions with extended wings. The averaged moments in the bulges are generally close to zero, the median for the complete sample of major axis spectra is 0.03 with a standard deviation of 0.046. None of our bulges show obvious dips in the profile as the ones described by Debattista et al. (2005); Méndez-Abreu et al. (2008). But this diagnostic for boxy-peanut shape bulges only applies to low inclinations (), given that the inclinations of most of our galaxies is larger than (41 out of 45) this is not further surprising. However, fourteen galaxies show a double peak in the profile within the bulge region (e.g. NGC 1023, NGC 3031, NGC 3945, and NGC 7331 in Fig. 16) . This is typically seen in combination with a rapid increase of the rotational velocity and relatively strong moments. From our Monte Carlo simulations described in §4.1 we can rule out that the observed peaks are a result of a degeneracy between and moments in the fit.
We find no correlation between the averaged moments and the bulge luminosities. However, while the error bars are large, larger moments seem to be found in bulges with larger averaged (Fig. 10). Bender et al. (1994) also discuss the possibility of a similar trend in their subsample of rotationally flattened galaxies.
There is a mild indication that pseudobulges and classical bulges show different distributions in the average and moments. For pseudobulges we find an average value for of 0.06 with an RMS scatter of 0.03 while for classical bulges the mean value of is 0.04 with a scatter or 0.03. A KS test and a Student’s two-tailed t-test for two independent samples yield a probability of 0.3% and 3%, respectively, for the two subsamples to stem from the same distribution. For we find and average of 0.04 with a scatter of 0.02 in the pseudobulges, and 0.02 with a scatter of 0.02 in the classical bulges. Here the KS test finds a 5% probability for the null hypothesis while the t-test yields a 1.5% probability. As both the and the moment are affected by the inclination and the scatter is large, this trend has to be taken with caution. A larger sample and kinematic modelling will be needed to confirm if this is a signature of systematic different anisotropies in the two classes of bulges.
| Galaxy | ||||||||||
|---|---|---|---|---|---|---|---|---|---|---|
| arcsec | arcsec | kms-1 | ||||||||
| (1) | (2) | (3) | (4) | (5) | (6) | (7) | (8) | (9) | (10) | (11) |
| NGC 1023 | 21.3 | 19.0 | 0.22 | 0.55 | 212.9 5.2 | -0.09 | 1.12 | -0.17 | 1.176 | 0.165 |
| NGC 2460 | 8.3 | 6.6 | 0.19 | 0.25 | 111.4 3.5 | -0.01 | 0.99 | 0.10 | 1.026 | 0.358 |
| NGC 2681 | 14.6 | 13.2 | 0.11 | 0.20 | 112.5 1.3 | -0.16 | 1.19 | a | ||
| NGC 2775 | 19.4 | 16.8 | 0.10 | 0.16 | 173.9 13.7 | -0.04 | 1.02 | 1.03 | 1.027 | 0.133 |
| NGC 2841 | 17.4 | 15.2 | 0.22 | 0.49 | 222.2 19.3 | -0.11 | 1.15 | -0.09 | 1.124 | 0.207 |
| NGC 2859 | 30.0 | 27.6 | 0.16 | 0.22 | 176.8 5.4 | -0.06 | 1.11 | -2.04 | 1.379 | 0.678 |
| NGC 2880 | 26.7 | 22.7 | 0.20 | 0.35 | 142.2 5.3 | -0.21 | 1.35 | -0.22 | 1.394 | 0.496 |
| NGC 2964b | 3.4 | 3.1 | 0.15 | 0.28 | 88.4 1.3 | 0.117 | ||||
| NGC 3031 | 72.0 | 61.3 | 0.24 | 0.43 | 157.5 13.6 | -0.06 | 1.03 | -0.03 | 1.006 | 0.400 |
| NGC 3166 | 9.9 | 9.1 | 0.39 | 0.25 | 151.4 6.1 | 0.00 | 1.04 | 0.05 | 0.981 | 1.365 |
| NGC 3245 | 9.5 | 8.5 | 0.20 | 0.44 | 225.2 8.3 | -0.21 | 1.27 | -0.22 | 1.184 | 0.300 |
| NGC 3351 | 14.2 | 12.9 | 0.16 | 0.24 | 90.0 4.2 | 0.05 | 1.01 | -0.05 | 1.015 | 0.778 |
| NGC 3368 | 23.3 | 20.4 | 0.17 | 0.34 | 122.5 6.6 | -0.01 | 0.99 | 0.03 | 0.883 | 0.574 |
| NGC 3384 | 15.5 | 14.4 | 0.20 | 0.34 | 150.3 2.4 | -0.09 | 1.10 | -0.13 | 1.150 | 0.521 |
| NGC 3521 | 12.2 | 10.8 | 0.35 | 0.45 | 129.5 2.9 | -0.01 | 0.99 | -0.14 | 1.098 | 0.905 |
| NGC 3593 | 32.1 | 29.5 | 0.49 | 0.62 | 62.3 3.1 | 0.20 | 0.70 | 0.065 | ||
| NGC 3627 | 11.7 | 10.9 | 0.27 | 0.51 | 116.1 3.9 | -0.05 | 1.03 | 0.01 | 1.003 | 0.267 |
| NGC 3675 | 9.8 | 8.5 | 0.29 | 0.49 | 114.7 5.3 | -0.03 | 1.03 | 0.363 | ||
| NGC 3898 | 17.7 | 15.7 | 0.25 | 0.41 | 219.0 8.3 | -0.14 | 1.21 | 0.295 | ||
| NGC 3945 | 33.3 | 31.0 | 0.19 | 0.17 | 183.1 5.4 | -0.03 | 1.12 | -0.11 | 1.088 | 1.062 |
| NGC 3953 | 16.6 | 14.6 | 0.26 | 0.48 | 110.6 3.1 | 0.02 | 0.95 | 0.178 | ||
| NGC 3992 | 14.9 | 13.2 | 0.22 | 0.49 | 144.2 9.5 | 0.07 | 0.97 | 0.406 | ||
| NGC 4030b | 3.6 | 3.0 | 0.11 | 0.19 | 102.9 4.5 | 0.213 | ||||
| NGC 4203 | 16.4 | 14.7 | 0.11 | 0.11 | 170.1 3.6 | -0.18 | 1.31 | 0.249 | ||
| NGC 4260 | 9.0 | 7.3 | 0.21 | 0.53 | 143.8 14.3 | 0.03 | 0.98 | 0.131 | ||
| NGC 4274 | 12.3 | 11.3 | 0.40 | 0.34 | 106.9 5.3 | 0.08 | 0.90 | 0.842 | ||
| NGC 4314 | 10.0 | 8.6 | 0.12 | 0.45 | 123.3 5.1 | -0.01 | 1.00 | 0.825 | ||
| NGC 4371 | 25.5 | 22.9 | 0.29 | 0.33 | 125.8 5.0 | -0.12 | 1.20 | 0.00 | 0.983 | 0.426 |
| NGC 4379 | 10.0 | 8.6 | 0.11 | 0.20 | 121.0 4.6 | -0.20 | 1.16 | 0.183 | ||
| NGC 4394 | 15.2 | 14.1 | 0.12 | 0.37 | 80.0 3.1 | -0.01 | 0.91 | 1.451 | ||
| NGC 4448 | 9.6 | 8.5 | 0.26 | 0.43 | 98.5 3.7 | -0.03 | 1.03 | 0.446 | ||
| NGC 4501 | 7.0 | 6.2 | 0.19 | 0.45 | 144.2 4.9 | 0.00 | 1.01 | 0.07 | 0.937 | 0.390 |
| NGC 4536 | 10.9 | 10.1 | 0.39 | 0.47 | 98.1 3.3 | -0.06 | 1.01 | 0.10 | 0.942 | 0.724 |
| NGC 4569 | 10.6 | 9.6 | 0.32 | 0.57 | 114.4 0.9 | -0.05 | 1.04 | 0.525 | ||
| NGC 4698 | 11.9 | 10.7 | 0.20 | 0.27 | 139.3 10.4 | -0.05 | 1.03 | 0.008 | ||
| NGC 4736 | 15.6 | 14.2 | 0.11 | 0.17 | 107.0 2.3 | -0.09 | 1.15 | -0.17 | 1.199 | 1.330 |
| NGC 4772 | 26.3 | 23.5 | 0.06 | 0.42 | 144.5 8.1 | -0.12 | 1.22 | 0.060 | ||
| NGC 4826 | 29.5 | 25.4 | 0.23 | 0.42 | 95.7 6.4 | 0.01 | 1.00 | -0.04 | 1.080 | 0.375 |
| NGC 5055 | 22.0 | 18.3 | 0.26 | 0.39 | 106.1 8.6 | -0.03 | 1.04 | -0.02 | 1.031 | 0.471 |
| NGC 5248 | 17.0 | 15.4 | 0.23 | 0.37 | 78.4 2.5 | 0.620 | ||||
| NGC 5566c | 148.9 2.2d | |||||||||
| NGC 7177 | 10.0 | 8.6 | 0.17 | 0.32 | 115.3 4.8 | -0.03 | 1.02 | 0.508 | ||
| NGC 7217 | 13.2 | 11.2 | 0.05 | 0.10 | 141.1 12.7 | 0.00 | 1.02 | -0.08 | 1.100 | 0.168 |
| NGC 7331 | 29.4 | 26.0 | 0.39 | 0.59 | 123.6 13.0 | -0.11 | 1.23 | 1.520 | ||
| NGC 7743 | 6.2 | 5.6 | 0.11 | 0.31 | 84.6 2.4 | -0.01 | 1.02 | 0.069 |
Comments: a) The low inclination of this galaxy prevents us from deriving an inclination corrected velocity and hence . b) The bulge is not sufficiently resolved to calculate the slopes of the velocity dispersion. c) Surface brightness does follow a typical bulge/disk profile. We do not decompose the profile and only present the kinematics data here. d) No decomposition, this is the innermost value.
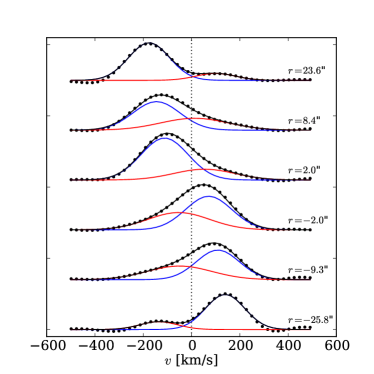
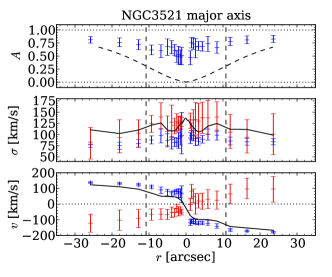
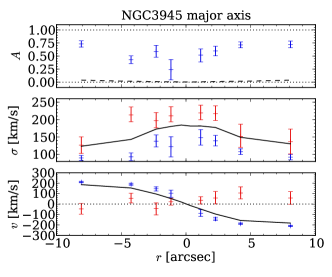
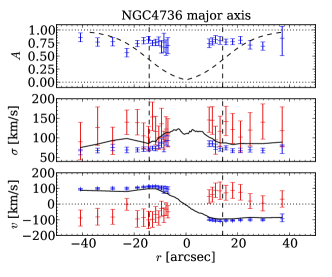
5.7. Extreme moments and multiple kinematic components
Five galaxies show extreme and moments. The most extreme case, NGC 3521, (a classical bulge) exhibits values of and as large as 0.24 and 0.35, respectively (see Fig. 16). NGC 3945, NGC 4736, NGC 7217 (all pseudobulges), and NGC 7331 (unclassified ) show values of and of up to 0.2. The LOSVD is poorly reproduced by a Gauss-Hermite expansion at the radii of such extreme higher moment values (see Fig. 11). The reason lies in the existence of a secondary kinematic component in all those cases. For NGC 3521 this has been reported by Zeilinger et al. (2001) who attributed the counter-rotating stellar component to the presence of a bar. The two-component nature of NGC 7217 was discovered before by Merrifield & Kuijken (1994). They suggest that the second component is the result of an extended period of accretion with intermittent change of angular momentum of the infalling material. Prada et al. (1996) reported a counter-rotating bulge in NGC 7331.
Two more systems in our sample, NGC 2841 (Bertola & Corsini 1999) and NGC 3593 (Bertola et al. 1996), were reported to host counter-rotating components, and a kinematically decoupled component was found in NGC 4698 (Corsini et al. 1999; Bertola et al. 1999; Falcón-Barroso et al. 2006) see Pizzella et al. (2004) for a review. NGC 3593 is the only galaxy in our sample for which the rotation curve itself already reveals counter rotation through a twist — the rotation changes sign with respect to the systemic velocity at a radius of about 20 arcseconds (see Fig. 16 and Appendix B). The case is similar whilst not as pronounced for NGC 4698 where the rotation curve becomes very flat towards the center (see Fig. 16). However, in these cases the secondary component does not result in unusually strong and moments in our data.
In an attempt of a fairer treatment of their complexity we decomposed the FCQ-derived LOSVDs into two separate Gaussian components in a similar manner to Scorza & Bender (1995); Zeilinger et al. (2001). We the Metropolis-Hastings algorithm (Hastings 1970; Press et al. 2007) to infer the parameters and error bars. Before the fit, the spectra are binned to a minimum of 75 per pixel. We run four simultaneous chains for each radial bin. The step width is tuned to achieve a 25% acceptance ratio and after convergence the first half of the chain is discarded (clipped). The run is aborted if the chains do not converge after 100.000 steps.
Fig. 12 shows the result of this decomposition. The plotted values are the maximum-likelihood values, and the end of the error bars mark the 20% and 80% quantiles in all four chains after clipping. Central values with strong degeneracies between the parameter sets are omitted. In all five galaxies we do find significant second components under the assumption that individual components are purely Gaussian. In Tab. 10 we list the integrated fractions of light in the two different kinematic components and compare those to the values that one would expect from the photometric decomposition.
 |
 |
 |
 |
 |
 |
| galaxy | morph. | disk light | light in fast component |
|---|---|---|---|
| [%] | [%] | ||
| (1) | (2) | (3) | (4) |
| NGC 3521 | SAB(rs)bc | 34 | 44 |
| NGC 3945 | (R)SB+(rs) | 2 | 34 |
| NGC 4736 | (R)SA(r)ab | 55 | 50 |
| NGC 7217 | (R)SA(r)ab | 55 | 38 |
| NGC 7331 | SA(s)b | 26 | 47 |
6. Discussion
6.1. Dichotomous dispersion profiles of classical and pseudobulges
It is commonly assumed that the bulge light — typically determined from a bulge-disk decomposition — represents a dynamically hot component. Yet, it has been known for a long time that rotation-supported bulges exist (Kormendy 1982). Also, many bulges have lower central velocity dispersions than expected from the Faber & Jackson (1976) relation (Kormendy & Kennicutt 2004). Falcón-Barroso et al. (2006); Ganda et al. (2006) find that several galaxies in the SAURON survey have centers that are dynamically colder than the surrounding disks. Thus, it is now clear that not all galaxies fit the picture that a bulge is a dynamically hot component.
There is an observed dichotomy in bulge properties including Sérsic index, bulge morphology, star formation & ISM properties, and optical color (Carollo et al. 1997; Gadotti & dos Anjos 2001; Kormendy & Kennicutt 2004; Fisher 2006; Fisher & Drory 2008, 2010). Recently, Fisher & Drory (2010) showed that the dichotomous properties in Sérsic index, morphology, and ISM properties are consistent. Furthermore they show that bulges of different type occupy different regions in the projection of fundamental plane properties, thus indicating that there are very likely two physically distinct classes of bulges. Are dynamics part of this dichotomy?
The high spectral resolution of 39 kms-1 of our data, enables us to recover dispersions out into the disk regions in many of our targets — a feature uncommon to many similar surveys. We extract LOSVDs using the FCQ algorithm with additional procedures to account for nebular emission and template mismatch. We recover , , , and moments of a Gauss-Hermite model of the LOSVDs as function of radius.
We observe a great variety of shapes of kinematic profiles (see Fig. 16 and their detailed description in Appendix B). Similarly to Falcón-Barroso et al. (2006) and Ganda et al. (2006), we find that it is not necessarily true that the center of a bulge has the highest observed velocity dispersion (e.g. NGC 3593). In our sample only 1/3 of the galaxies have centrally peaked velocity dispersion profiles (like NGC 3898). Many galaxies have roughly flat velocity dispersion profiles. In these galaxies there is no apparent transition in velocity dispersion from the bulge to the disk region unlike in the stellar surface brightness profile (e.g. NGC 4448 and NGC 5055).
It is interesting to note that to the radial extent of our data, in many of these cases the disk velocity dispersion is as high as the central velocity dispersion of the galaxy. For example in NGC 4448 the disk velocity dispersion remains above 100 kms-1. Therefore some disks of spiral galaxies are not necessarily cold stellar systems over the radii that we cover in this study.
From minor axis data of 19 S0 to Sbc bulges (Falcón-Barroso et al. 2003) showed that higher ellipticity bulges have shallower velocity dispersion profiles profiles. If pseudobulges appear photometrically flattened then one might expect that the steepness of the dispersion profile should correlate with bulge type. We show in Fig. 7 that the shape of the velocity dispersion profile correlates very well with bulge type. Galaxies with classical bulges have centrally peaked profiles. Galaxies with pseudobulges have, on average, flat dispersion profiles. We have attempted to quantify this using the logarithmic derivative of the velocity dispersion as function of radius (Eq. 5) and also the ratio of dispersions at different radii (Eq. 6). We find that pseudobulges and classical bulges occupy different regions in the parameter space of logarithmic derivative of velocity dispersion and Sérsic index (see Fig. 8) in a way that is not inconsistent with models of dynamically isotropic systems (Ciotti 1991).
It is important to note that the dynamics of a few galaxies are not well described by a simple monotonic trend of velocity dispersion with radius; we stress that for the purpose of this paper we are interested in the bulk properties of the distribution of stellar dynamics. The great variety of shapes in dispersion profiles that we observe (for a detailed description see Appendix B) is likely to be a consequence of the fact that there are multiple ways to heat galactic disks, for example through mergers (van Albada 1982; Quinn et al. 1993; Eliche-Moral et al. 2006; Hopkins et al. 2008), bars (Saha et al. 2010), and other disk instabilities (Sellwood & Wilkinson 1993; Combes et al. 1990). Even under the strong assumption that classical and pseudobulges are dynamically distinct, it does not seem plausible that any simple description of the kinematic profile cleanly separates classical from pseudobulges.
A few classical bulges in barred galaxies such as NGC 3992 do not seem to fit this general picture. However, all those galaxies are barred and it is conceivable that bars may distort the kinematic profile of a classical bulge as they vertically heat the disk they reside in (Gadotti & de Souza 2005; Saha et al. 2010). Central velocity dispersions lie higher by a factor of two than at the bulge radius in the most extreme cases in our sample, e.g., in NGC 1023, NGC 3898, and NGC 4203. If bars raise velocity dispersions by a factor of up to four as suggested by Saha et al. (2010), the signature of a central dispersion peak can of course be easily washed out.
NGC 4826 has extreme amounts of dust in its central region — hence also its name black eye or evil eye galaxy. The bulge was consequently classified as pseudobulge by Fisher & Drory (2008). It stands out however, as it has a relatively high Sérsic index of for a pseudobulge. The V-band value of (Fisher & Drory 2008) agrees well. The bulge radius of 25.4 arcseconds seems small once the kinematic data are taken into account. The velocity dispersion starts rising at about 50 arcseconds already, which corresponds to the radius of the final flattening of the rotation curve. It is conceivable that the large amount of dust in its center, which is easily also visible in the infrared, may affect the decomposition. If one was to take the value of 50 arcseconds as the bulge radius then the value would become -0.33 (0.01 before) and the sigma ratio would take a value of 1.29 (1.08 before). This would move NGC 4826 significantly further to the right in both plots into the region occupied by classical bulges, in much better agreement with the Sérsic index. Further the disk of NGC 4826 is relatively free of dust and actually resembles an S0. We hypothesize that the unusual morphology is a result of a recent merging event. A satellite may have fallen into an S0-like disk and brought in dust and triggered star formation. This hypothesis is supported by the existence of two counter rotating gaseous disks observed by Braun et al. (1992, 1994). We labelled NGC 4826 as non-classified throughout this work. NGC 3593 has a very large value of and a very small sigma ratio, i.e. it falls far to the left in both diagrams. This is a result of the strong depression in velocity dispersion in the bulge region. NGC 3593 is the only galaxy in the sample where we observe actual counter rotation in the sense of a change of sign of the mean rotational velocity in the bulge region. The small Sérsic index of 0.81 supports the picture that the bulge region is dominated by a kinematically cold and distinct but luminous disk (Bertola et al. 1996). NGC 2681 is classified as a pseudobulge by morphology and yet has a relatively large Sérsic index of . Further, it has a centrally peaked dispersion profile with and . This agreement of photometric structure and dispersion slope prompts us to reassess the morphological classification. While the disk shows relatively little amounts of dust, a high contrast dust spiral within in the bulge easily seen in HST F555W, offers a clear sense of rotation. Also the spiral is not obviously misaligned with the outer disk. This galaxy may represent a prototypical case for the breakdown of the morphological classification scheme. However, it shows multiple bars — possibly three (Erwin & Sparke 1999) — and hence the central heating may also be a consequence of its complicated dynamical structure. NGC 3521 has a seemingly a relatively flat dispersion slope with values of and . We discuss this object at the end of the next Section.
6.2. Rotational support
In order to study the level of rotational support of a stellar system, it has become common practice to study its location in the vs. diagram (Illingworth 1977; Binney & Tremaine 1987; Kormendy 1993) — where measures the maximum rotational velocity and the averaged velocity dispersion within a certain radius, and the system’s ellipticity. One can also directly compare to the expected values of an oblate-spheroidal system with isotropic velocity dispersion. For instance, Kormendy & Illingworth (1982) define the anisotropy parameter as a measure for the rotational support of a stellar system. Values of point towards a support by rotation whereas values indicate support by anisotropy. Those measures involve the ellipticity of the system which is typically subject to relatively large uncertainties, especially when measured for galaxies which are dominated by large quantities of dust. Here, we decide to rather examine the local , i.e. as a function of radius, and the averaged values of (Binney 2005) across the bulge region, is the inclination corrected velocity at a given radius. We use inclinations from Hyperleda (see Tab. 1). We apply no further correction to the velocity dispersion.
In Fig. 13 we plot separately for classical and pseudobulges. We further plot histograms of the bulge-averaged quantities in Fig. 14. Again we normalize the radii by the bulge radius and exclude the central seeing FWHM from the analysis. While there is significant overlap between the two sub samples, pseudobulges are biased towards larger . This is especially seen in the histograms for the averaged values.
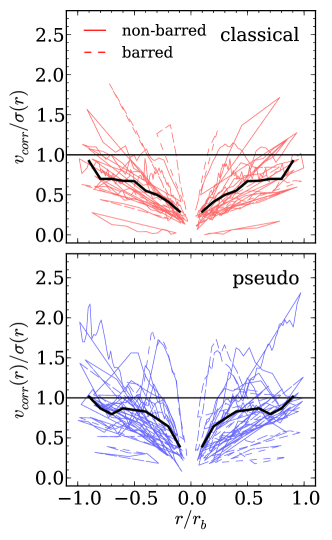 |
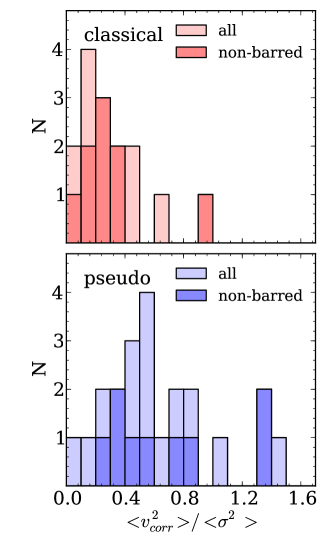 |
A Kolmogorov-Smirnov test (Smirnov 1939; Press 2002) yields a probability of 0.8% (1.9%) for the classical and the pseudobulges in the full (non-barred) sample to stem from the same distribution. A Student’s two-tailed t-test for two independent samples yields a probability of 0.7% (2.5%) for the classical and the pseudobulges in the full (non-barred) sample. This result supports a picture of increased rotational support of pseudobulges that was originally described by Kormendy (1993) and discussed in detail in Kormendy & Kennicutt (2004), see also Kormendy & Fisher (2008).
While the average values of and are different for classical and pseudobulges, neither of the two quantities separates the bulge types. In Fig. 15 we combine both and plot against the logarithmic slope of the velocity dispersion, , for the bulges in our sample. In the left panel we discriminate bulges morphologically and in the right based on the bulge Sérsic index. The dashed line is drawn to contain all the pseudobulges. Classical bulges both tend to have low and steeper negative slopes than pseudobulges.
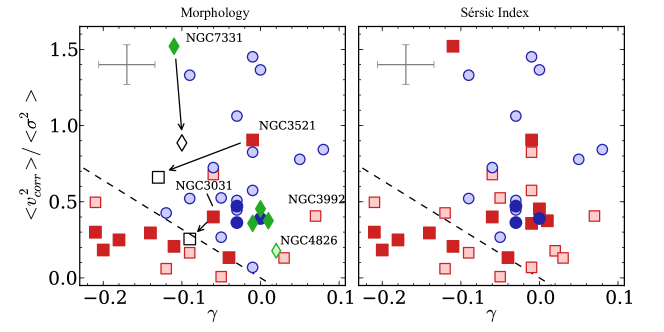 |
There are several galaxies with large Sérsic index that fall dynamically into the region of pseudobulges. We have discussed the possibility that bars mask or destroy the kinematic signature of a classical bulge. However two non-barred high-Sérsic index galaxies remain (NGC 3521 and NGC 7331; NGC 3521 also has classical bulge morphology). Both galaxies, have centrally peaking velocity dispersion profiles but they also show a rise in velocity dispersion at larger radius (see Appendix A), yet still within the radius of the bulge. This is also a feature that is prominently seen in the dispersion profile of NGC 3031, but in this case the effect on the position in the vs. plane is not as dramatic. This behaviour is not what we observe in pseudobulges, which have flat dispersion profiles. None of these three galaxies violate the general dichotomy observed in Fig. 7. Therefore it is likely that their outlier location is due to a failure in the machinery of measuring dynamical quantities. NGC 7331 and NGC 3521 both show signs of counter rotating components and NGC 3031 is well known to be interacting. It is possible in each of these galaxies that an outside mechanism is superimposing extra kinematic structure that is visible as an outside rise in the velocity dispersion profile of the bulge. We remeasure changing the outer radius cut isolating only the central dispersion peak. In the case of NGC 3031 this moves the measured dynamical quantities into the region of parameter space that is only occupied by classical bulges; NGC 3521 and NGC 7331 both move significantly closer.
Fig. 15 illustrates agreement between kinematic diagnostics of the bulge dichotomy with structural and morphological indicators of bulge types.
6.3. Multiple kinematic components
We observe counter rotation seen as secondary components in the full shape of the LOSVD in five systems (NGC 3521, NGC 3945, NGC 4736, NGC 7217, and NGC 7331; see §5.7). It is striking how clearly the LOSVDs can be decomposed into a low-dispersion and a high-dispersion component in all these cases. It is tempting to interpret the latter as the bulge and the former as the disk. However, if we plot the local disk-to-total ratios as obtained from the photometric decomposition over the values obtained from the kinematic decomposition (upper panels of Fig. 12), then we see that the disk contribution from the photometry falls short in all cases. Therefore, the observed low-dispersion component within the bulge region is not simply the extension of the outer disk as more light contributes to this component as one would expect from the extrapolation of the outer disk exponential profile alone. It is important to point out that a Gauss-Hermite distribution with moderate moments can be modelled rather well by two individual Gaussians. moments, though, occur naturally in disks (Binney & Tremaine 1987) and are not a signature of an actual second component. Only in cases where the second component is clearly seen as a second peak in the LOSVD it is safe to assume that actually two distinct components contribute.
The observation of a counter rotating component is very interesting in the light of the findings of Eliche-Moral et al. (2011). They use collisionless -body simulations to study the characteristics of inner components such as inner disks and inner rings that were formed though a minor merger. For this, they simulate a number of mergers with different mass ratios and orbits. In general, while all their mergers formed an inner component supported by rotation, none of their mergers produced a significant bar. In their simulations all mergers with satellites on retrograde orbits do form a counter rotating component while none of them leads to actual counter rotation in the sense of a change of sign of the mean rotational velocity. A central increase of velocity dispersion and strong and moments are observed in a majority of their models. They further find, however, that and are generally anti-correlated within the inner components throughout all of their simulations. We see all these features reflected in the aforementioned galaxies. Of particular interest to us is the double peak in that their model M6P1Rb produced. Such double peaks are very pronounced in NGC 3945 and NGC 4736, but are also visible in the case of NGC 3521 and NGC 7331. In our small sample 3 out of the 5 systems for which counter rotation is observed are not barred, we think that a merging event is a likely formation scenario.
7. Summary
In this paper we present kinematic profiles for the major axis of 45 intermediate type (S0-Scd) galaxies. Our survey differs from other similar surveys in that we are able to resolve lower velocity dispersions which allows us to study kinematic features in cold systems like disks and pseudobulges. We combine these data with bulge-to-disk decompositions of the stellar light.
We find that bulges that have increased rotational support, as measured by larger values of , are likely to have lower Sérsic indices and show disk-like morphology.
Classical bulges on average tend to have higher central velocity dispersions than pseudobulges. In our sample the lowest central velocity dispersion in a galaxy with evidence for a classical bulge through a Sérsic index of 3.7 is kms-1 (NGC 7743).
We observe — for the first time — a systematic agreement between the shape of the velocity dispersion profile and the bulge type as indicated by the Sérsic index. Classical bulges have centrally peaked velocity dispersion profiles while pseudobulges in general have flat dispersion profiles and even at times show drops in the central velocity dispersion. We confirm that this correlation holds true if visual morphology is used for the bulge classification instead of the Sérsic index, as it is expected from the good correlation between bulge morphology and Sérsic index (Fisher & Drory 2010).
We observe that the disk regions of some of our galaxies have not always a low velocity dispersion. In some galaxies the velocity dispersion remains above kms-1 well into the region where the disk dominates the light.
We confirm the previously described multicomponent nature of the full LOSVD in NGC 3521 (Zeilinger et al. 2001), NGC 7217 (Merrifield & Kuijken 1994) and NGC 7331 (Prada et al. 1996) and find two additional systems — namely NGC 3945 and NGC 4736 – with signatures of multiple kinematic components. They become apparent through a secondary peak or pronounced shoulder in the full line of sight velocity distributions (LOSVD). We present double-Gaussian decompositions which show the presence of a counter rotating stellar component in all these systems.
As in elliptical galaxies (Bender et al. 1994), we find a correlation of and , both locally as well as in the bulge-averaged quantities. We observe no correlation of the higher moments with bulge luminosity, however we find a weak correlation between the average values of and .
Through examination of the figures in Appendix A it is clear that the kinematic profiles of bulge-disk galaxies commonly contain substructure. Furthermore non-axisymmetric features in the stellar structure such a bars make understanding the kinematics of these galaxies more difficult. Future progress will require 2D-methods capable of resolving low velocity dispersions commonly found in pseudobulges. We are currently executing such a survey using the VIRUS-W spectrograph (Fabricius et al. 2008).
References
- Athanassoula (2005) Athanassoula, E. 2005, MNRAS, 358, 1477
- Bender (1990) Bender, R. 1990, A&A, 229, 441
- Bender & Moellenhoff (1987) Bender, R. & Moellenhoff, C. 1987, A&A, 177, 71
- Bender et al. (1994) Bender, R., Saglia, R. P., & Gerhard, O. E. 1994, MNRAS, 269, 785
- Bertola et al. (1996) Bertola, F., Cinzano, P., Corsini, E. M., Pizzella, A., Persic, M., & Salucci, P. 1996, ApJ, 458, L67+
- Bertola et al. (1995) Bertola, F., Cinzano, P., Corsini, E. M., Rix, H.-W., & Zeilinger, W. W. 1995, ApJ, 448, L13+
- Bertola & Corsini (1999) Bertola, F. & Corsini, E. M. 1999, in IAU Symposium, Vol. 186, Galaxy Interactions at Low and High Redshift, ed. J. E. Barnes & D. B. Sanders, 149–+
- Bertola et al. (1999) Bertola, F., Corsini, E. M., Vega Beltrán, J. C., Pizzella, A., Sarzi, M., Cappellari, M., & Funes, J. G. 1999, ApJ, 519, L127
- Bettoni & Galletta (1997) Bettoni, D. & Galletta, G. 1997, A&AS, 124, 61
- Binney (2005) Binney, J. 2005, MNRAS, 363, 937
- Binney & Tremaine (1987) Binney, J. & Tremaine, S. 1987, Galactic dynamics (Princeton Series in Astrophysics)
- Blakeslee et al. (2009) Blakeslee, J. P., Jordán, A., Mei, S., Côté, P., Ferrarese, L., Infante, L., Peng, E. W., Tonry, J. L., & West, M. J. 2009, ApJ, 694, 556
- Brault & White (1971) Brault, J. W. & White, O. R. 1971, A&A, 13, 169
- Braun et al. (1992) Braun, R., Walterbos, R. A. M., & Kennicutt, Jr., R. C. 1992, Nature, 360, 442
- Braun et al. (1994) Braun, R., Walterbos, R. A. M., Kennicutt, Jr., R. C., & Tacconi, L. J. 1994, ApJ, 420, 558
- Bureau & Athanassoula (2005) Bureau, M. & Athanassoula, E. 2005, ApJ, 626, 159
- Bureau & Freeman (1999) Bureau, M. & Freeman, K. C. 1999, AJ, 118, 126
- Busarello et al. (1996) Busarello, G., Capaccioli, M., D’Onofrio, M., Longo, G., Richter, G., & Zaggia, S. 1996, A&A, 314, 32
- Caon et al. (1993) Caon, N., Capaccioli, M., & D’Onofrio, M. 1993, MNRAS, 265, 1013
- Cappellari & Emsellem (2004) Cappellari, M. & Emsellem, E. 2004, PASP, 116, 138
- Carollo et al. (1997) Carollo, C. M., Stiavelli, M., de Zeeuw, P. T., & Mack, J. 1997, AJ, 114, 2366
- Chung & Bureau (2004) Chung, A. & Bureau, M. 2004, AJ, 127, 3192
- Ciotti (1991) Ciotti, L. 1991, A&A, 249, 99
- Combes et al. (1990) Combes, F., Debbasch, F., Friedli, D., & Pfenniger, D. 1990, A&A, 233, 82
- Comerón et al. (2010) Comerón, S., Knapen, J. H., Beckman, J. E., Laurikainen, E., Salo, H., Martínez-Valpuesta, I., & Buta, R. J. 2010, MNRAS, 402, 2462
- Corsini et al. (1999) Corsini, E. M., Pizzella, A., Sarzi, M., Cinzano, P., Vega Beltrán, J. C., Funes, J. G., Bertola, F., Persic, M., & Salucci, P. 1999, A&A, 342, 671
- de Jong & van der Kruit (1994) de Jong, R. S. & van der Kruit, P. C. 1994, A&AS, 106, 451
- de Lorenzo-Cáceres et al. (2008) de Lorenzo-Cáceres, A., Falcón-Barroso, J., Vazdekis, A., & Martínez-Valpuesta, I. 2008, ApJ, 684, L83
- de Vaucouleurs & de Vaucouleurs (1964) de Vaucouleurs, G. & de Vaucouleurs, A. 1964, Reference catalogue of bright galaxies (University of Texas Press)
- de Vaucouleurs et al. (1991) de Vaucouleurs, G., de Vaucouleurs, A., Corwin, Jr., H. G., Buta, R. J., Paturel, G., & Fouque, P. 1991, Third Reference Catalogue of Bright Galaxies (Springer-Verlag Berlin Heidelberg New York)
- Debattista et al. (2005) Debattista, V. P., Carollo, C. M., Mayer, L., & Moore, B. 2005, ApJ, 628, 678
- Dumas et al. (2007) Dumas, G., Mundell, C. G., Emsellem, E., & Nagar, N. M. 2007, MNRAS, 379, 1249
- Ekholm et al. (2000) Ekholm, T., Lanoix, P., Teerikorpi, P., Fouqué, P., & Paturel, G. 2000, A&A, 355, 835
- Eliche-Moral et al. (2006) Eliche-Moral, M. C., Balcells, M., Aguerri, J. A. L., & González-García, A. C. 2006, A&A, 457, 91
- Eliche-Moral et al. (2011) Eliche-Moral, M. C., González-García, A. C., Balcells, M., Aguerri, J. A. L., Gallego, J., Zamorano, J., & Prieto, M. 2011, A&A, 533, A104
- Emsellem et al. (2004) Emsellem, E., Cappellari, M., Peletier, R. F., McDermid, R. M., Bacon, R., Bureau, M., Copin, Y., Davies, R. L., Krajnović, D., Kuntschner, H., Miller, B. W., & de Zeeuw, P. T. 2004, MNRAS, 352, 721
- Erwin (2004) Erwin, P. 2004, A&A, 415, 941
- Erwin & Sparke (1999) Erwin, P. & Sparke, L. S. 1999, ApJ, 521, L37
- Erwin & Sparke (2003) —. 2003, ApJS, 146, 299
- Eskridge et al. (2002) Eskridge, P. B., Frogel, J. A., Pogge, R. W., Quillen, A. C., Berlind, A. A., Davies, R. L., DePoy, D. L., Gilbert, K. M., Houdashelt, M. L., Kuchinski, L. E., Ramírez, S. V., Sellgren, K., Stutz, A., Terndrup, D. M., & Tiede, G. P. 2002, ApJS, 143, 73
- Faber & Jackson (1976) Faber, S. M. & Jackson, R. E. 1976, ApJ, 204, 668
- Fabricius et al. (2008) Fabricius, M. H., Barnes, S., Bender, R., Drory, N., Grupp, F., Hill, G. J., Hopp, U., & MacQueen, P. J. 2008, in Society of Photo-Optical Instrumentation Engineers (SPIE) Conference Series, Vol. 7014
- Falcón-Barroso et al. (2006) Falcón-Barroso, J., Bacon, R., Bureau, M., Cappellari, M., Davies, R. L., de Zeeuw, P. T., Emsellem, E., Fathi, K., Krajnović, D., Kuntschner, H., McDermid, R. M., Peletier, R. F., & Sarzi, M. 2006, MNRAS, 369, 529
- Falcón-Barroso et al. (2003) Falcón-Barroso, J., Balcells, M., Peletier, R. F., & Vazdekis, A. 2003, A&A, 405, 455
- Falcón-Barroso et al. (2004) Falcón-Barroso, J., Peletier, R. F., Emsellem, E., Kuntschner, H., Fathi, K., Bureau, M., Bacon, R., Cappellari, M., Copin, Y., Davies, R. L., & de Zeeuw, T. 2004, MNRAS, 350, 35
- Fisher (1997) Fisher, D. 1997, AJ, 113, 950
- Fisher (2006) Fisher, D. B. 2006, ApJ, 642, L17
- Fisher & Drory (2008) Fisher, D. B. & Drory, N. 2008, AJ, 136, 773
- Fisher & Drory (2010) —. 2010, ApJ, 716, 942
- Fisher & Drory (2011) —. 2011, ApJ, 733, L47+
- Fontanot et al. (2011) Fontanot, F., De Lucia, G., Wilman, D., & Monaco, P. 2011, MNRAS, 416, 409
- Gadotti & de Souza (2005) Gadotti, D. A. & de Souza, R. E. 2005, ApJ, 629, 797
- Gadotti & dos Anjos (2001) Gadotti, D. A. & dos Anjos, S. 2001, AJ, 122, 1298
- Ganda et al. (2006) Ganda, K., Falcón-Barroso, J., Peletier, R. F., Cappellari, M., Emsellem, E., McDermid, R. M., de Zeeuw, P. T., & Carollo, C. M. 2006, MNRAS, 367, 46
- Gebhardt et al. (2000) Gebhardt, K., Richstone, D., Kormendy, J., Lauer, T. R., Ajhar, E. A., Bender, R., Dressler, A., Faber, S. M., Grillmair, C., Magorrian, J., & Tremaine, S. 2000, AJ, 119, 1157
- Gerhard (1993) Gerhard, O. E. 1993, MNRAS, 265, 213
- Governato et al. (2009) Governato, F., Brook, C. B., Brooks, A. M., Mayer, L., Willman, B., Jonsson, P., Stilp, A. M., Pope, L., Christensen, C., Wadsley, J., & Quinn, T. 2009, MNRAS, 398, 312
- Graham & Colless (1997) Graham, A. & Colless, M. 1997, MNRAS, 287, 221
- Hastings (1970) Hastings, W. K. 1970, Biometrika, 57, 97
- Haynes et al. (2000) Haynes, M. P., Jore, K. P., Barrett, E. A., Broeils, A. H., & Murray, B. M. 2000, AJ, 120, 703
- Héraudeau & Simien (1998) Héraudeau, P. & Simien, F. 1998, A&AS, 133, 317
- Héraudeau et al. (1999) Héraudeau, P., Simien, F., Maubon, G., & Prugniel, P. 1999, A&AS, 136, 509
- Hill et al. (1998) Hill, G. J., Nicklas, H. E., MacQueen, P. J., Mitsch, W., Wellem, W., Altmann, W., Wesley, G. L., & Ray, F. B. 1998, in Society of Photo-Optical Instrumentation Engineers (SPIE) Conference Series, ed. S. D’Odorico, Vol. 3355, 433–443
- Hopkins et al. (2009) Hopkins, P. F., Cox, T. J., Younger, J. D., & Hernquist, L. 2009, ApJ, 691, 1168
- Hopkins et al. (2008) Hopkins, P. F., Hernquist, L., Cox, T. J., Younger, J. D., & Besla, G. 2008, ApJ, 688, 757
- Illingworth (1977) Illingworth, G. 1977, ApJ, 218, L43
- Jarrett et al. (2003) Jarrett, T. H., Chester, T., Cutri, R., Schneider, S. E., & Huchra, J. P. 2003, AJ, 125, 525
- Jensen et al. (2003) Jensen, J. B., Tonry, J. L., Barris, B. J., Thompson, R. I., Liu, M. C., Rieke, M. J., Ajhar, E. A., & Blakeslee, J. P. 2003, ApJ, 583, 712
- Jungwiert et al. (1997) Jungwiert, B., Combes, F., & Axon, D. J. 1997, A&AS, 125, 479
- Knapen et al. (2003) Knapen, J. H., de Jong, R. S., Stedman, S., & Bramich, D. M. 2003, MNRAS, 344, 527
- Kormendy (1979) Kormendy, J. 1979, ApJ, 227, 714
- Kormendy (1982) —. 1982, ApJ, 257, 75
- Kormendy (1993) Kormendy, J. 1993, in IAU Symposium, Vol. 153, Galactic Bulges, ed. H. Dejonghe & H. J. Habing, 209–+
- Kormendy & Barentine (2010) Kormendy, J. & Barentine, J. C. 2010, ApJ, 715, L176
- Kormendy et al. (2010) Kormendy, J., Drory, N., Bender, R., & Cornell, M. E. 2010, ApJ, 723, 54
- Kormendy & Fisher (2008) Kormendy, J. & Fisher, D. B. 2008, in Astronomical Society of the Pacific Conference Series, Vol. 396, Astronomical Society of the Pacific Conference Series, ed. J. G. Funes & E. M. Corsini, 297–+
- Kormendy et al. (2009) Kormendy, J., Fisher, D. B., Cornell, M. E., & Bender, R. 2009, ApJS, 182, 216
- Kormendy & Illingworth (1982) Kormendy, J. & Illingworth, G. 1982, ApJ, 256, 460
- Kormendy & Kennicutt (2004) Kormendy, J. & Kennicutt, Jr., R. C. 2004, ARA&A, 42, 603
- Laurikainen et al. (2004) Laurikainen, E., Salo, H., Buta, R., & Vasylyev, S. 2004, MNRAS, 355, 1251
- Martini et al. (2003) Martini, P., Regan, M. W., Mulchaey, J. S., & Pogge, R. W. 2003, ApJS, 146, 353
- Mehlert et al. (2000) Mehlert, D., Saglia, R. P., Bender, R., & Wegner, G. 2000, A&AS, 141, 449
- Méndez-Abreu et al. (2008) Méndez-Abreu, J., Corsini, E. M., Debattista, V. P., De Rijcke, S., Aguerri, J. A. L., & Pizzella, A. 2008, ApJ, 679, L73
- Merrifield & Kuijken (1994) Merrifield, M. R. & Kuijken, K. 1994, ApJ, 432, 575
- Möllenhoff & Heidt (2001) Möllenhoff, C. & Heidt, J. 2001, A&A, 368, 16
- Nowak et al. (2010) Nowak, N., Thomas, J., Erwin, P., Saglia, R. P., Bender, R., & Davies, R. I. 2010, MNRAS, 403, 646
- Paturel et al. (2003) Paturel, G., Petit, C., Prugniel, P., Theureau, G., Rousseau, J., Brouty, M., Dubois, P., & Cambrésy, L. 2003, A&A, 412, 45
- Pignatelli et al. (2001) Pignatelli, E., Corsini, E. M., Vega Beltrán, J. C., Scarlata, C., Pizzella, A., Funes, J. G., Zeilinger, W. W., Beckman, J. E., & Bertola, F. 2001, MNRAS, 323, 188
- Pizzella et al. (2004) Pizzella, A., Corsini, E. M., Vega Beltrán, J. C., & Bertola, F. 2004, A&A, 424, 447
- Prada et al. (1996) Prada, F., Gutierrez, C. M., Peletier, R. F., & McKeith, C. D. 1996, ApJ, 463, L9+
- Press (2002) Press, W. H. 2002, Numerical recipes in C++ : the art of scientific computing (Cambridge University Press)
- Press et al. (2007) Press, W. H., Teukolsky, S. A., Vetterling, W. T., & Flannery, B. P. 2007, Numerical Recipes 3rd Edition: The Art of Scientific Computing, 3rd edn. (Cambridge University Press)
- Quinn et al. (1993) Quinn, P. J., Hernquist, L., & Fullagar, D. P. 1993, ApJ, 403, 74
- Ramsey et al. (1998) Ramsey, L. W., Adams, M. T., Barnes, T. G., Booth, J. A., Cornell, M. E., Fowler, J. R., Gaffney, N. I., Glaspey, J. W., Good, J. M., Hill, G. J., Kelton, P. W., Krabbendam, V. L., Long, L., MacQueen, P. J., Ray, F. B., Ricklefs, R. L., Sage, J., Sebring, T. A., Spiesman, W. J., & Steiner, M. 1998, in Society of Photo-Optical Instrumentation Engineers (SPIE) Conference Series, ed. L. M. Stepp, Vol. 3352, 34–42
- Rauscher (1995) Rauscher, B. J. 1995, AJ, 109, 1608
- Riess et al. (2009) Riess, A. G., Macri, L., Casertano, S., Sosey, M., Lampeitl, H., Ferguson, H. C., Filippenko, A. V., Jha, S. W., Li, W., Chornock, R., & Sarkar, D. 2009, ApJ, 699, 539
- Saglia et al. (2010) Saglia, R. P., Fabricius, M., Bender, R., Montalto, M., Lee, C.-H., Riffeser, A., Seitz, S., Morganti, L., Gerhard, O., & Hopp, U. 2010, A&A, 509, A61+
- Saha et al. (2006) Saha, A., Thim, F., Tammann, G. A., Reindl, B., & Sandage, A. 2006, ApJS, 165, 108
- Saha et al. (2010) Saha, K., Tseng, Y., & Taam, R. E. 2010, ApJ, 721, 1878
- Sakamoto et al. (1999) Sakamoto, K., Okumura, S. K., Ishizuki, S., & Scoville, N. Z. 1999, ApJS, 124, 403
- Salpeter (1955) Salpeter, E. E. 1955, ApJ, 121, 161
- Sarzi et al. (2006) Sarzi, M., Falcón-Barroso, J., Davies, R. L., Bacon, R., Bureau, M., Cappellari, M., de Zeeuw, P. T., Emsellem, E., Fathi, K., Krajnović, D., Kuntschner, H., McDermid, R. M., & Peletier, R. F. 2006, MNRAS, 366, 1151
- Scorza & Bender (1995) Scorza, C. & Bender, R. 1995, A&A, 293, 20
- Sellwood & Wilkinson (1993) Sellwood, J. A. & Wilkinson, A. 1993, Reports on Progress in Physics, 56, 173
- Sersic (1968) Sersic, J. L. 1968, Atlas de galaxias australes (Cordoba, Argentina: Observatorio Astronomico, 1968)
- Shaw et al. (1995) Shaw, M., Axon, D., Probst, R., & Gatley, I. 1995, MNRAS, 274, 369
- Simien & Prugniel (1998) Simien, F. & Prugniel, P. 1998, A&AS, 131, 287
- Simien & Prugniel (2002) —. 2002, A&A, 384, 371
- Simkin (1974) Simkin, S. M. 1974, A&A, 31, 129
- Skrutskie et al. (2006) Skrutskie, M. F., Cutri, R. M., Stiening, R., Weinberg, M. D., Schneider, S., Carpenter, J. M., Beichman, C., Capps, R., Chester, T., Elias, J., Huchra, J., Liebert, J., Lonsdale, C., Monet, D. G., Price, S., Seitzer, P., Jarrett, T., Kirkpatrick, J. D., Gizis, J. E., Howard, E., Evans, T., Fowler, J., Fullmer, L., Hurt, R., Light, R., Kopan, E. L., Marsh, K. A., McCallon, H. L., Tam, R., Van Dyk, S., & Wheelock, S. 2006, AJ, 131, 1163
- Smirnov (1939) Smirnov, N. V. 1939, Bulletin Moscow University, 2, 3
- Springob et al. (2009) Springob, C. M., Masters, K. L., Haynes, M. P., Giovanelli, R., & Marinoni, C. 2009, ApJS, 182, 474
- Stewart et al. (2009) Stewart, K. R., Bullock, J. S., Wechsler, R. H., & Maller, A. H. 2009, ApJ, 702, 307
- Stewart et al. (2008) Stewart, K. R., Bullock, J. S., Wechsler, R. H., Maller, A. H., & Zentner, A. R. 2008, ApJ, 683, 597
- Storchi-Bergmann et al. (2007) Storchi-Bergmann, T., Dors, Jr., O. L., Riffel, R. A., Fathi, K., Axon, D. J., Robinson, A., Marconi, A., & Östlin, G. 2007, ApJ, 670, 959
- Tonry et al. (2001) Tonry, J. L., Dressler, A., Blakeslee, J. P., Ajhar, E. A., Fletcher, A. B., Luppino, G. A., Metzger, M. R., & Moore, C. B. 2001, ApJ, 546, 681
- Tully (1994) Tully, R. B. 1994, VizieR Online Data Catalog, 7145, 0
- Tully et al. (2009) Tully, R. B., Rizzi, L., Shaya, E. J., Courtois, H. M., Makarov, D. I., & Jacobs, B. A. 2009, AJ, 138, 323
- Tully et al. (1996) Tully, R. B., Verheijen, M. A. W., Pierce, M. J., Huang, J.-S., & Wainscoat, R. J. 1996, AJ, 112, 2471
- van Albada (1982) van Albada, T. S. 1982, MNRAS, 201, 939
- van der Marel & Franx (1993) van der Marel, R. P. & Franx, M. 1993, ApJ, 407, 525
- Vazdekis (1999) Vazdekis, A. 1999, ApJ, 513, 224
- Vega Beltrán et al. (2001) Vega Beltrán, J. C., Pizzella, A., Corsini, E. M., Funes, J. G., Zeilinger, W. W., Beckman, J. E., & Bertola, F. 2001, A&A, 374, 394
- White & Frenk (1991) White, S. D. M. & Frenk, C. S. 1991, ApJ, 379, 52
- White & Rees (1978) White, S. D. M. & Rees, M. J. 1978, MNRAS, 183, 341
- Worthey et al. (1994) Worthey, G., Faber, S. M., Gonzalez, J. J., & Burstein, D. 1994, ApJS, 94, 687
- Wozniak et al. (1995) Wozniak, H., Friedli, D., Martinet, L., Martin, P., & Bratschi, P. 1995, A&AS, 111, 115
- Zeilinger et al. (2001) Zeilinger, W. W., Vega Beltrán, J. C., Rozas, M., Beckman, J. E., Pizzella, A., Corsini, E. M., & Bertola, F. 2001, Ap&SS, 276, 643
Appendix A Kinematic profiles
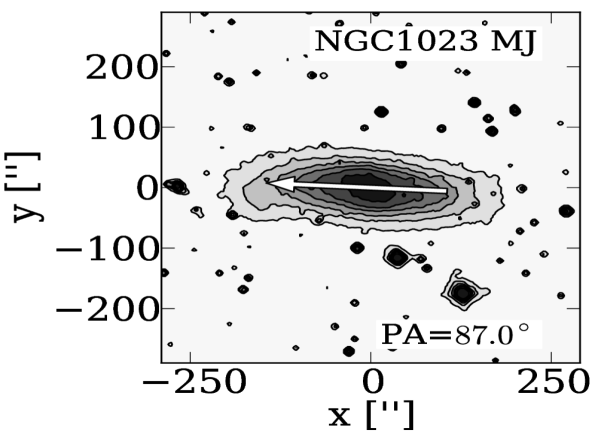 
|
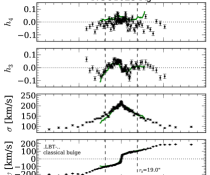 |
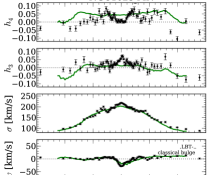 |
|---|
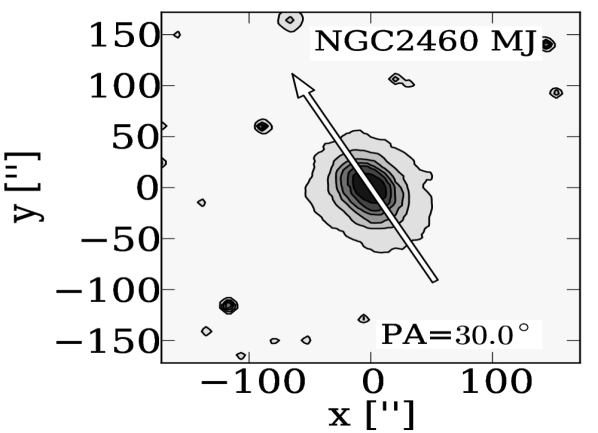 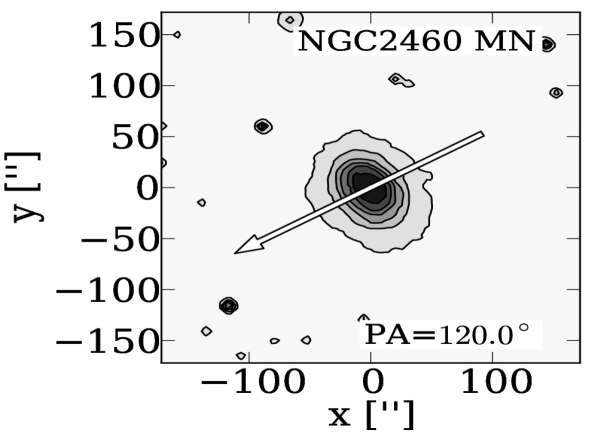
|
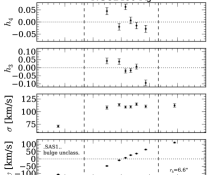 |
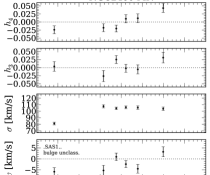 |
|---|
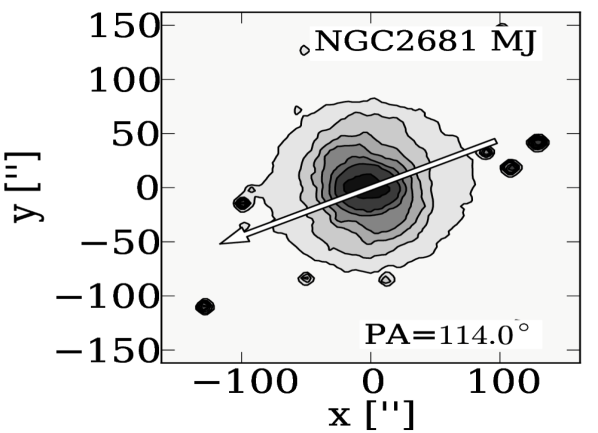 
|
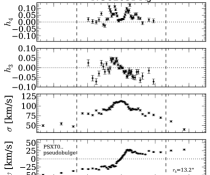 |
 |
|---|
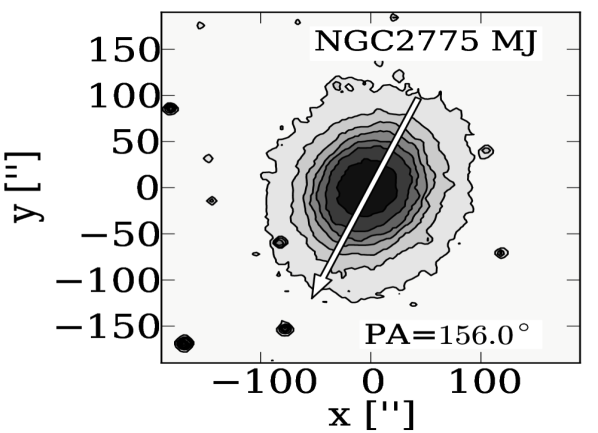 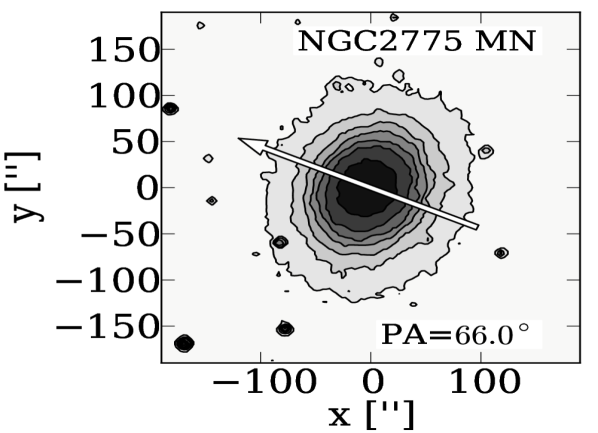
|
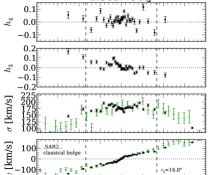 |
|---|
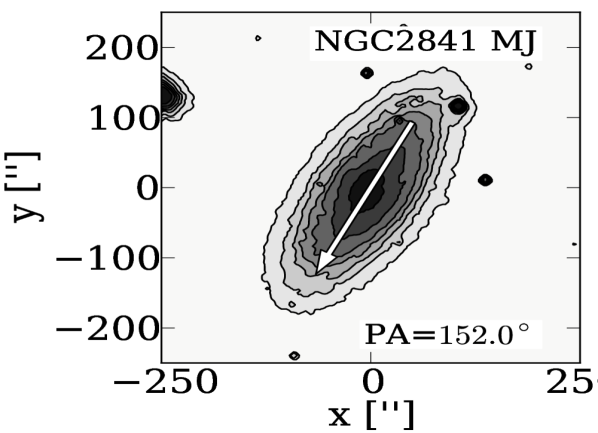 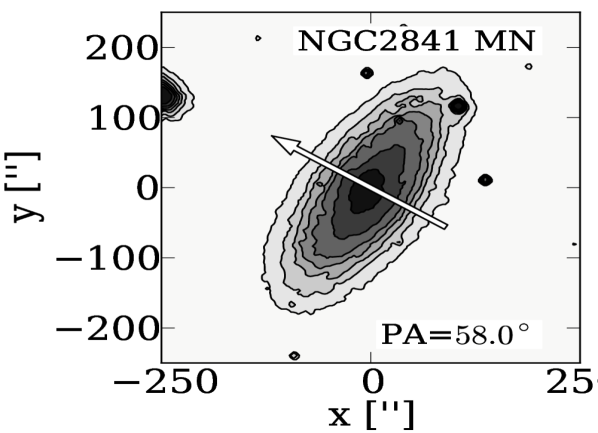
|
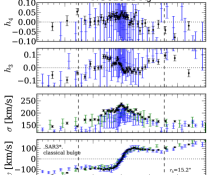 |
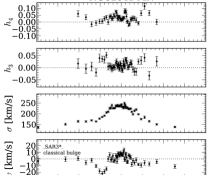 |
|---|
 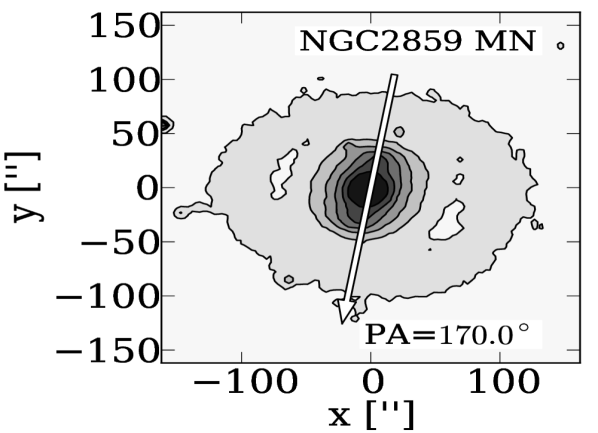
|
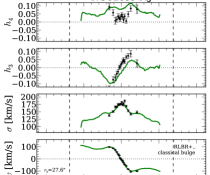 |
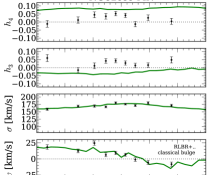 |
|---|
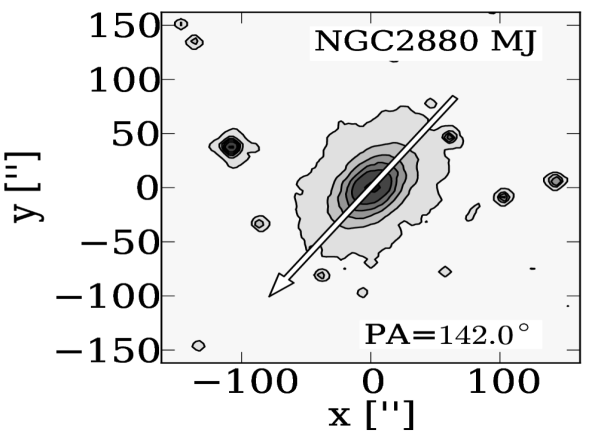 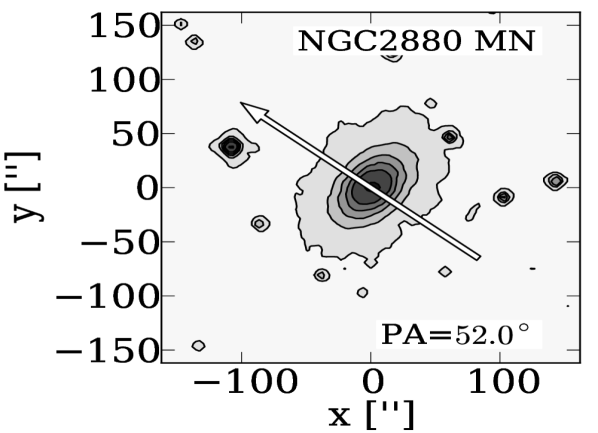
|
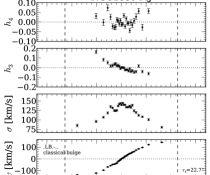 |
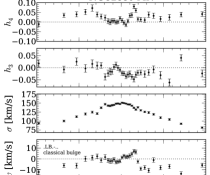 |
|---|
 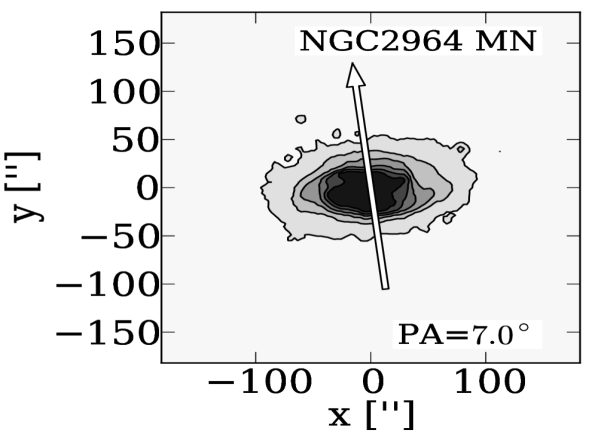
|
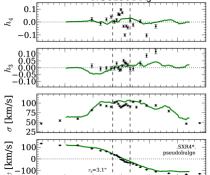 |
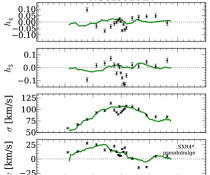 |
|---|
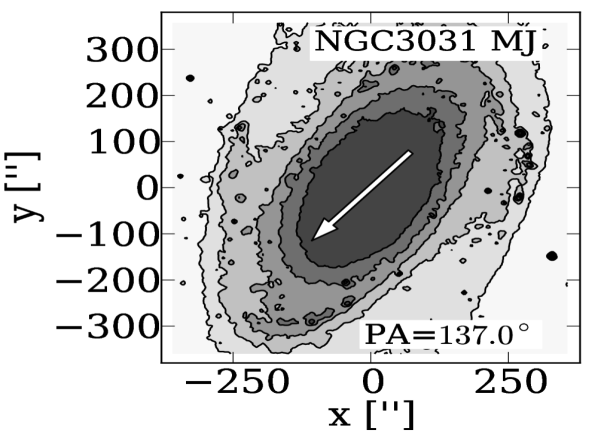 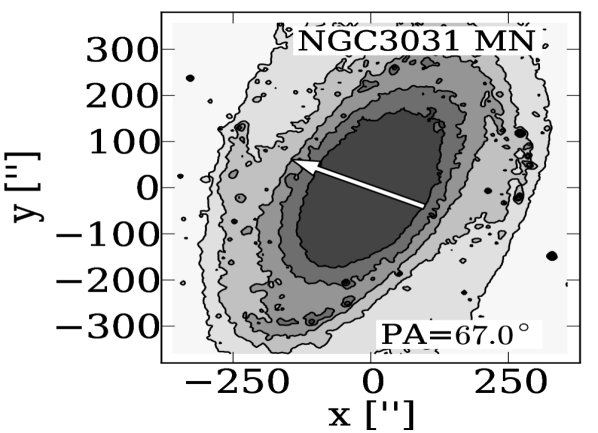
|
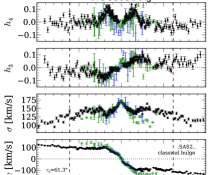 |
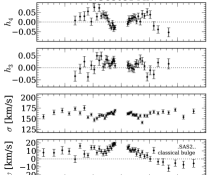 |
|---|
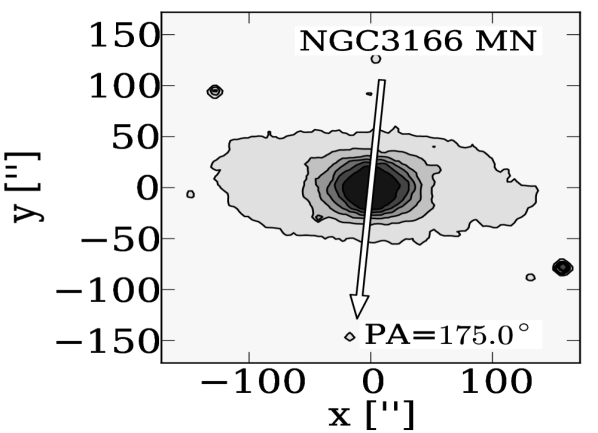
|
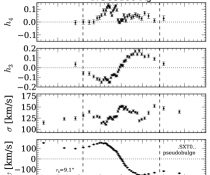 |
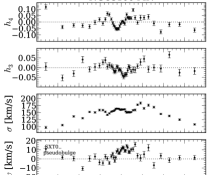 |
|---|
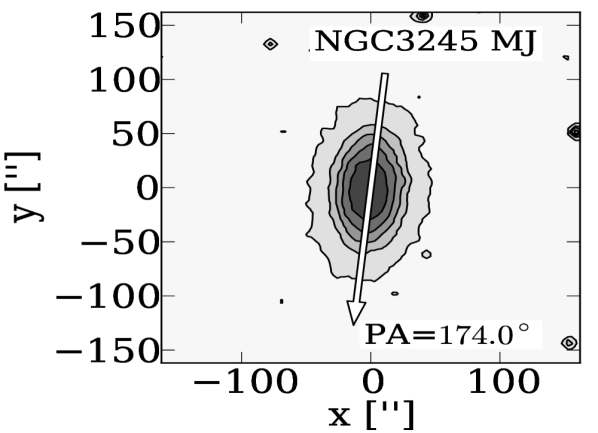 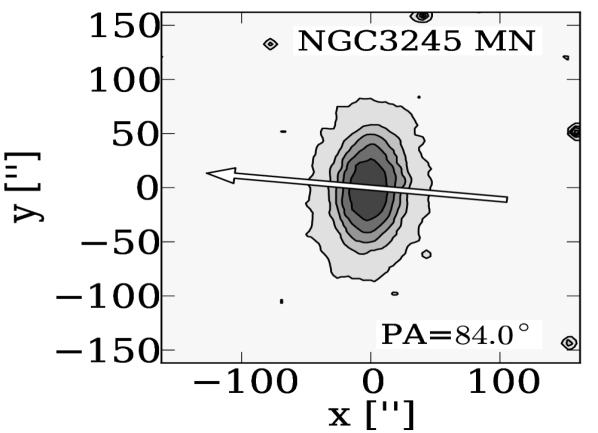
|
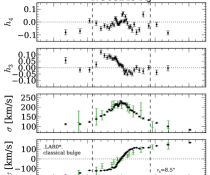 |
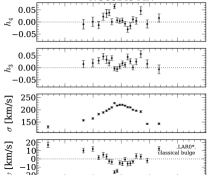 |
|---|
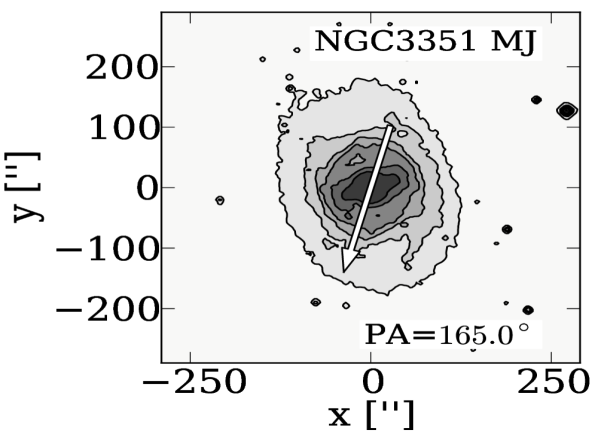 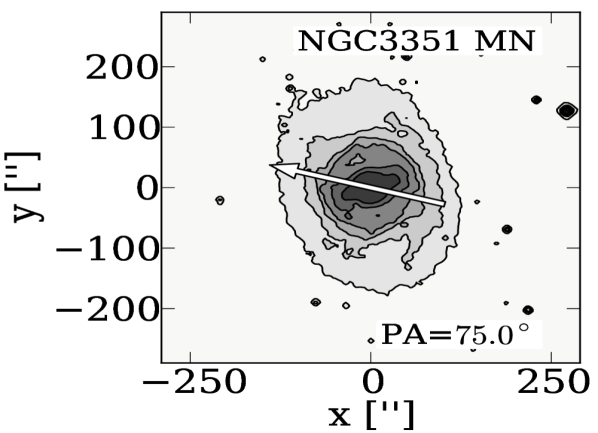
|
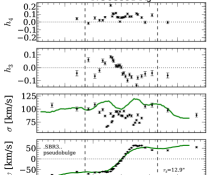 |
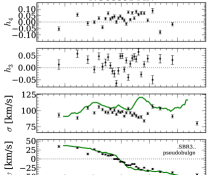 |
|---|
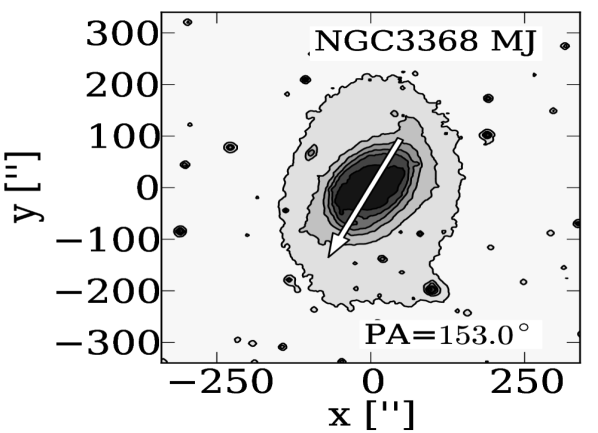 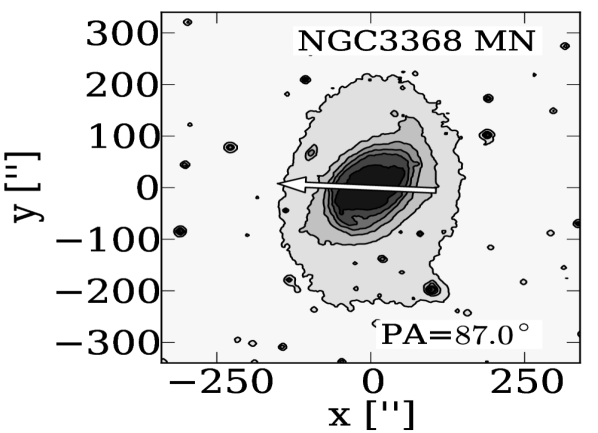
|
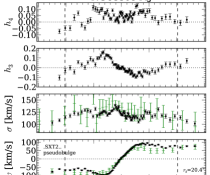 |
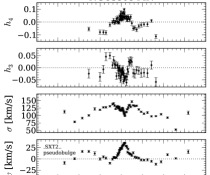 |
|---|
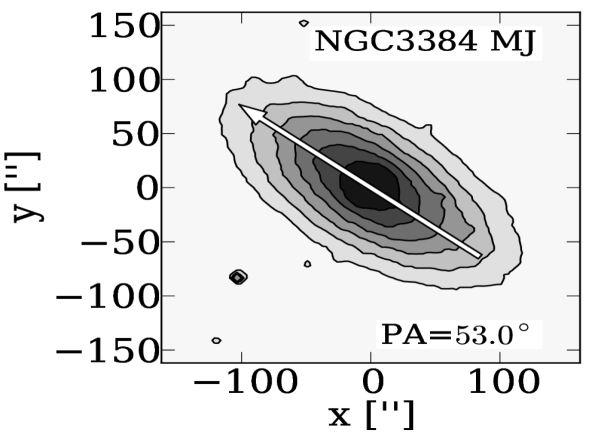 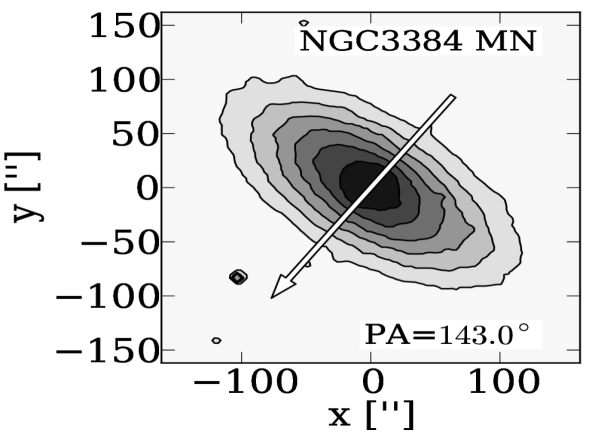
|
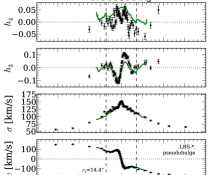 |
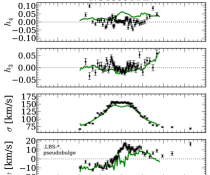 |
|---|
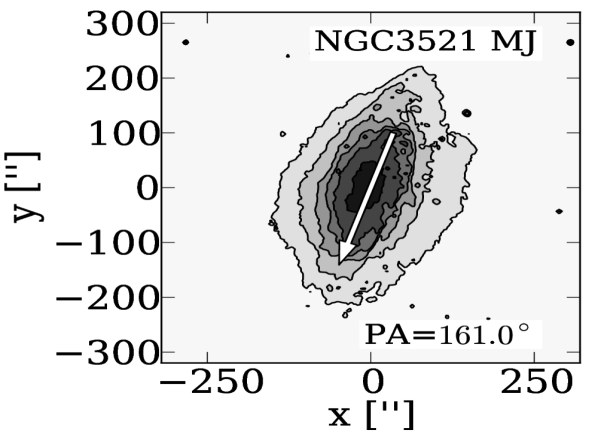 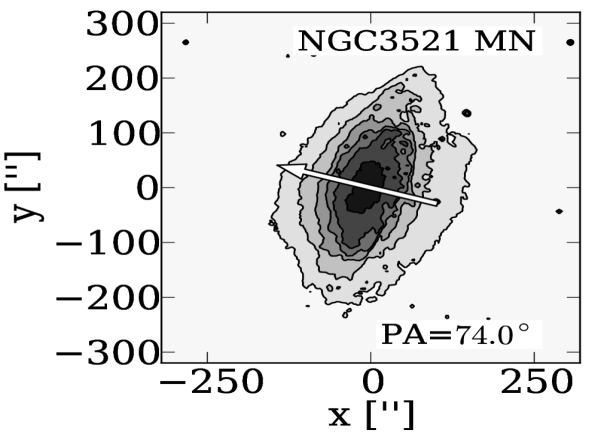
|
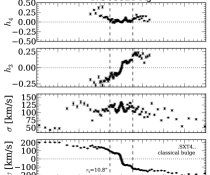 |
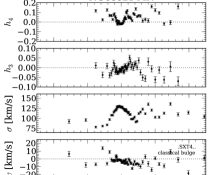 |
|---|
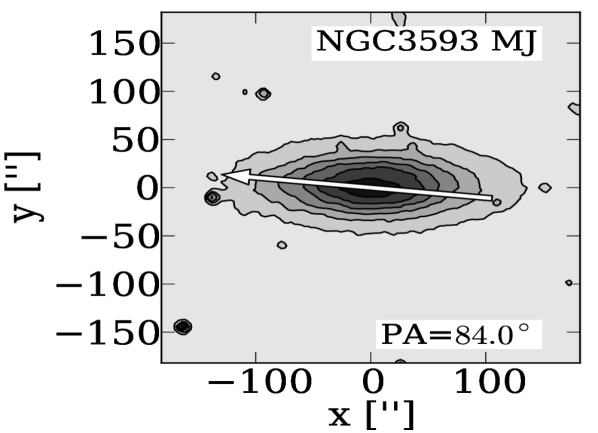 
|
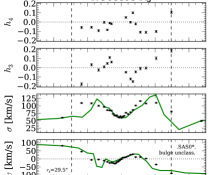 |
 |
|---|
 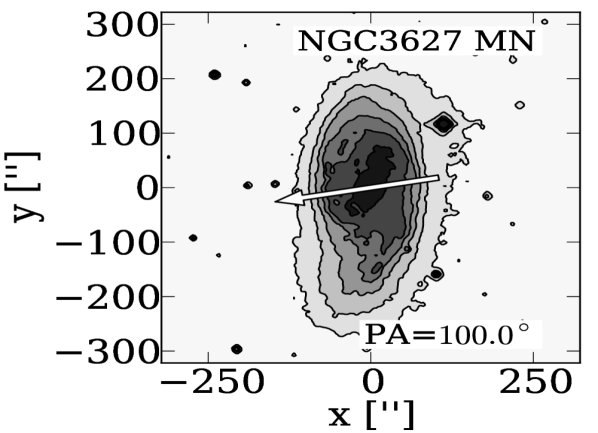
|
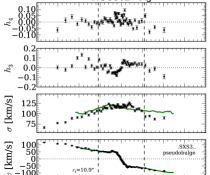 |
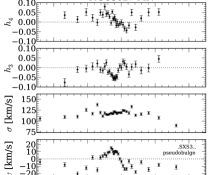 |
|---|
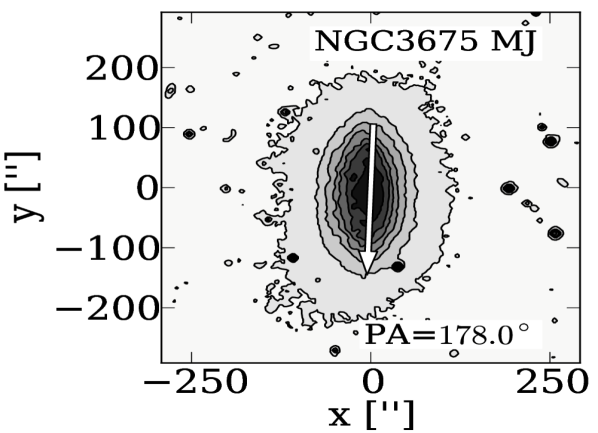 
|
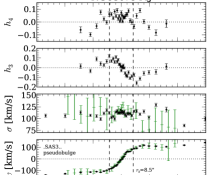 |
 |
|---|
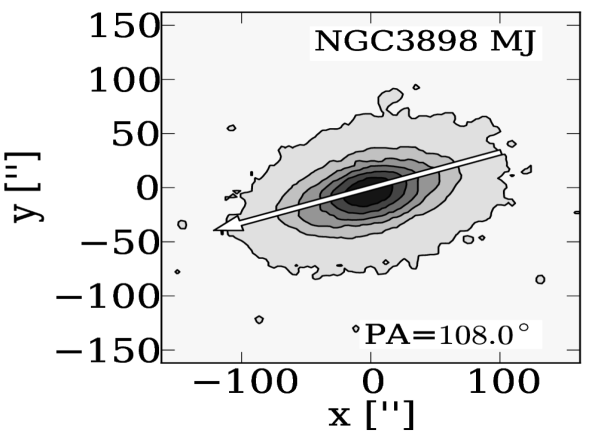 
|
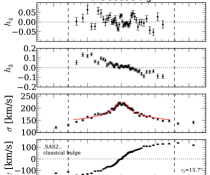 |
 |
|---|
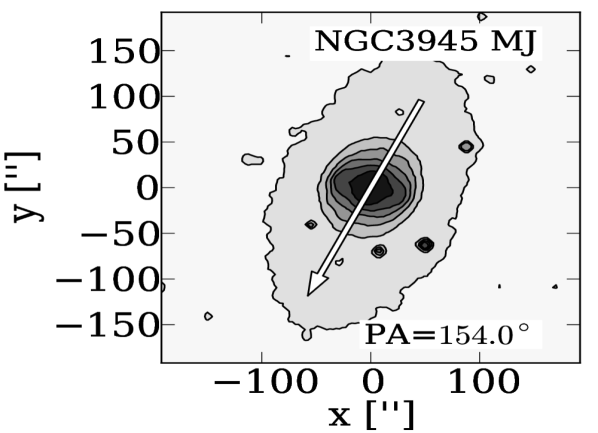 
|
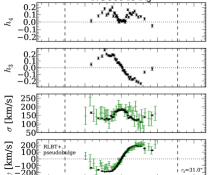 |
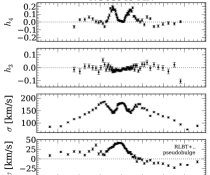 |
|---|
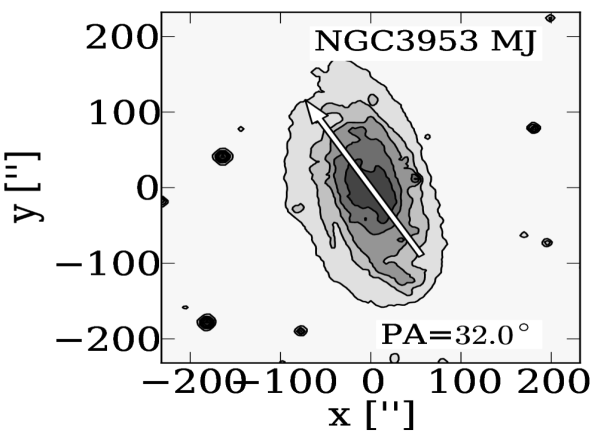 
|
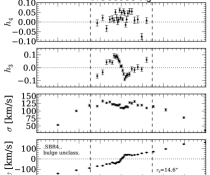 |
 |
|---|
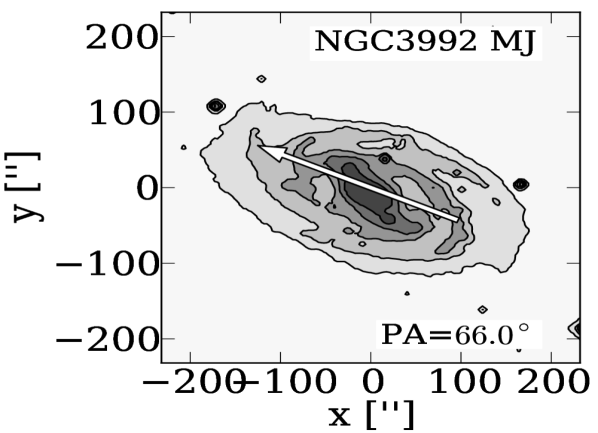 
|
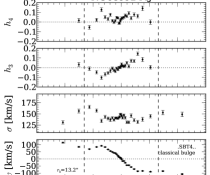 |
|---|
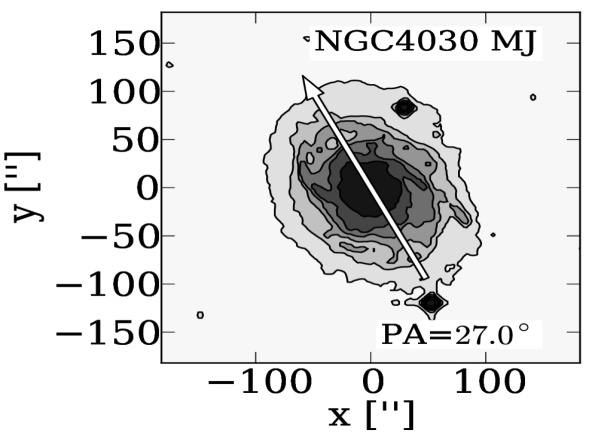 
|
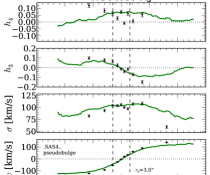 |
 |
|---|
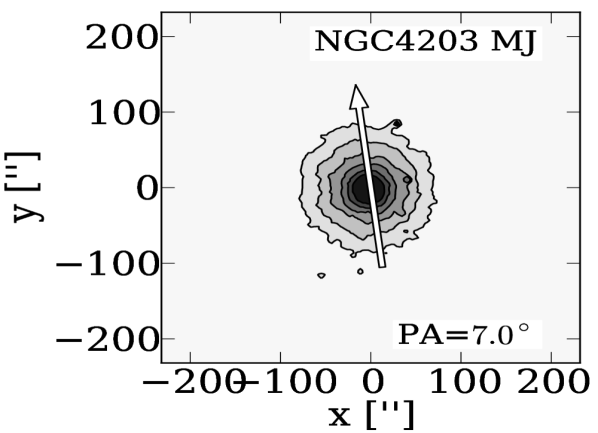 
|
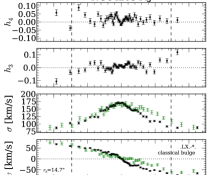 |
 |
|---|
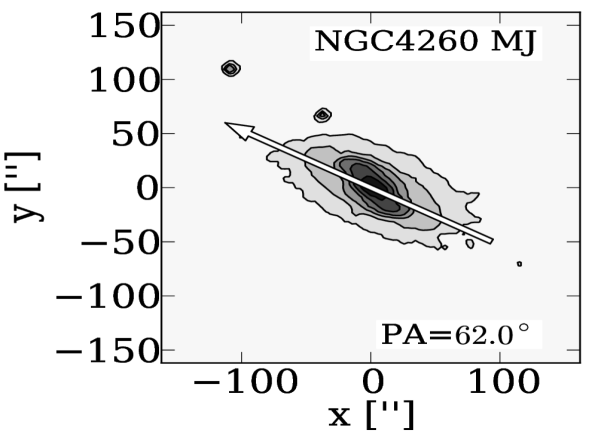 
|
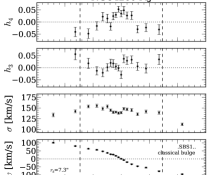 |
|---|
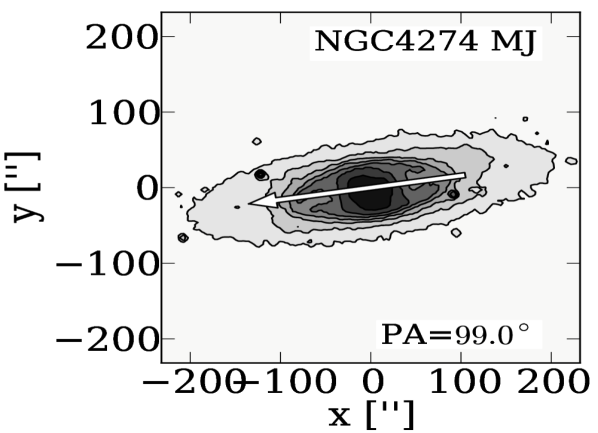 
|
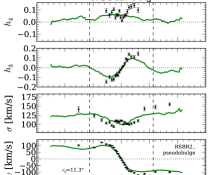 |
 |
|---|
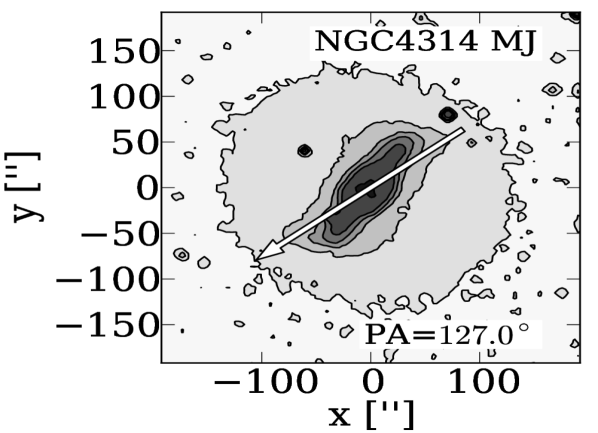 
|
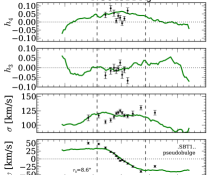 |
 |
|---|
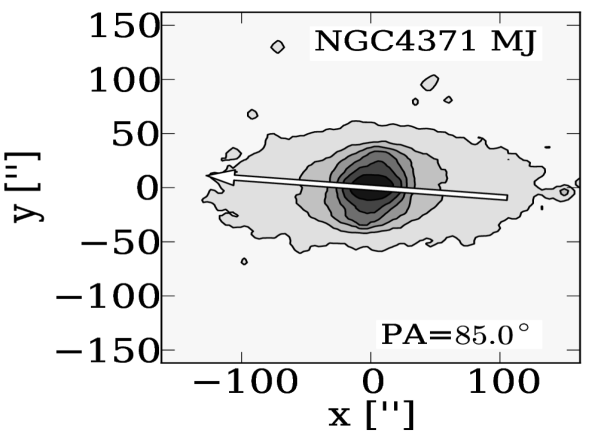 
|
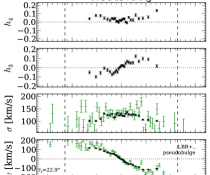 |
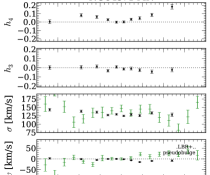 |
|---|
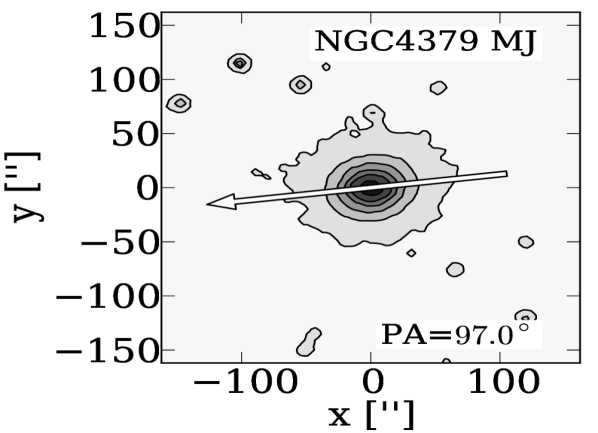 
|
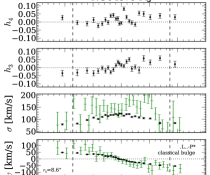 |
 |
|---|
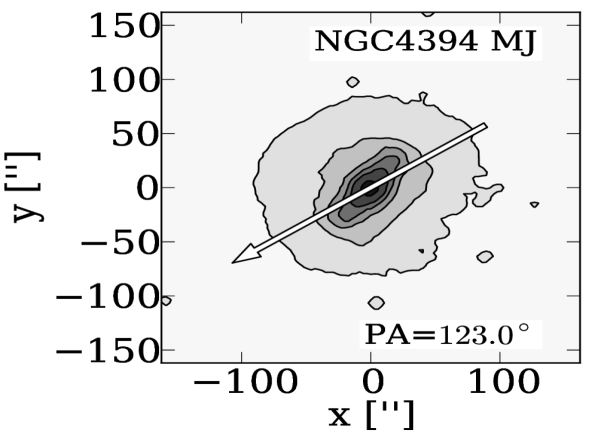 
|
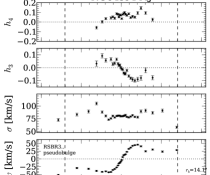 |
 |
|---|
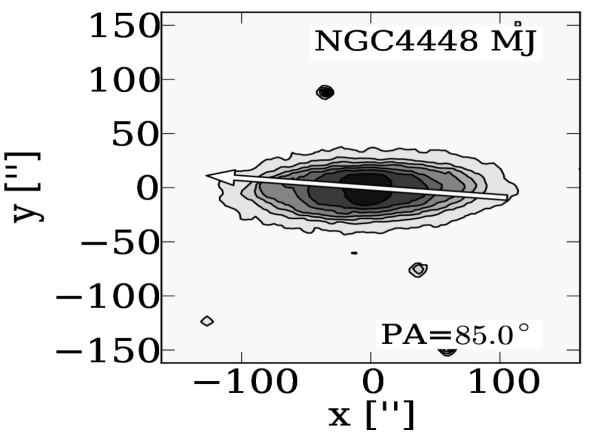 
|
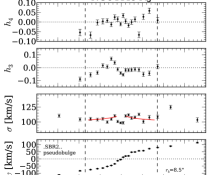 |
 |
|---|
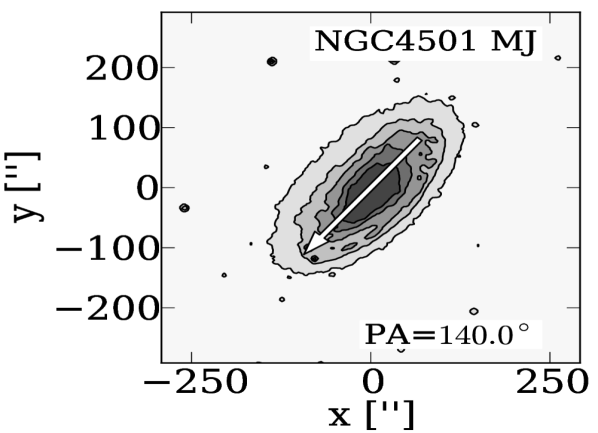 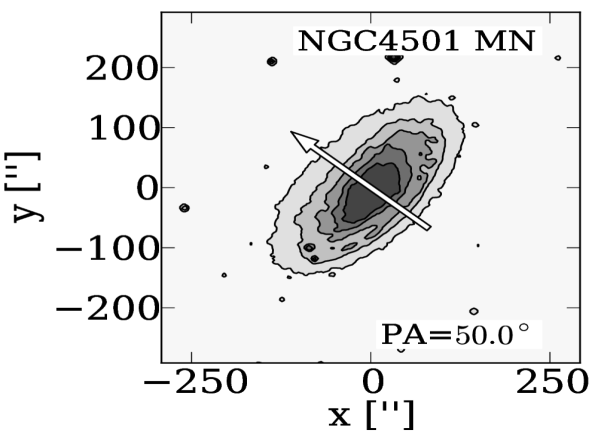
|
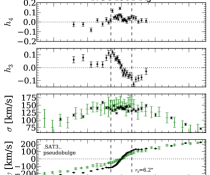 |
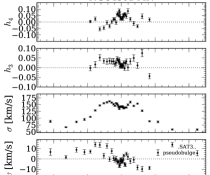 |
|---|
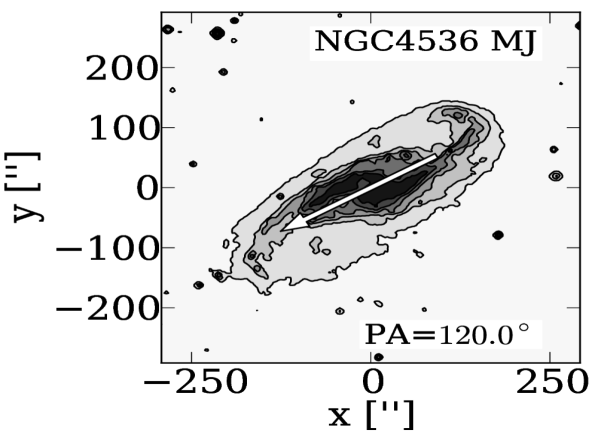 
|
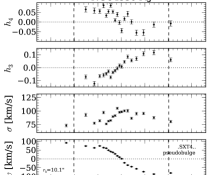 |
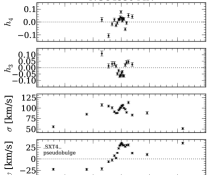 |
|---|
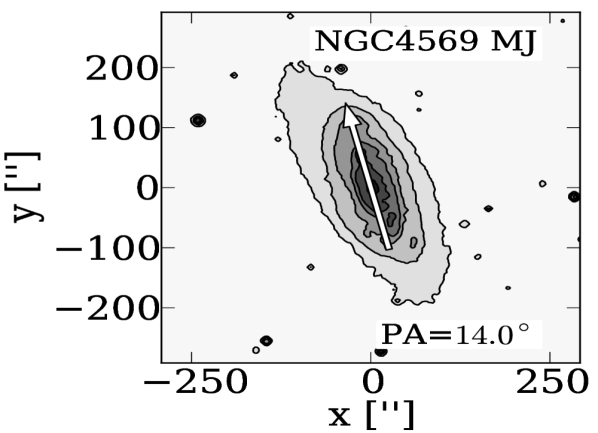 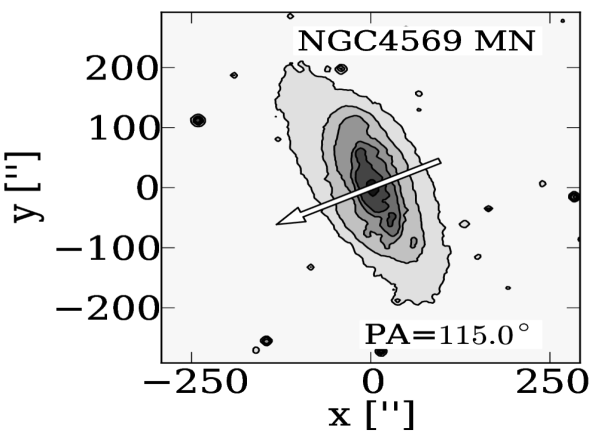
|
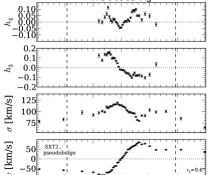 |
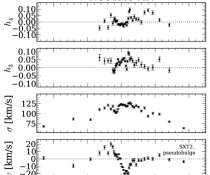 |
|---|
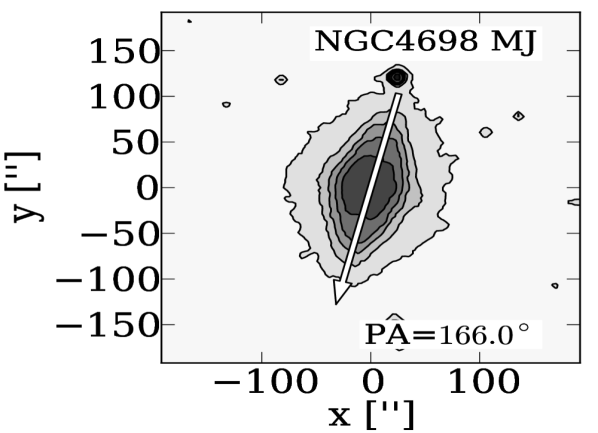 
|
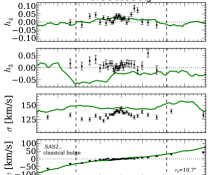 |
 |
|---|
 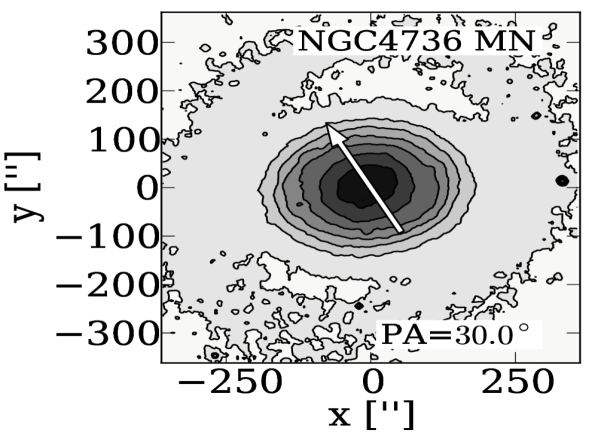
|
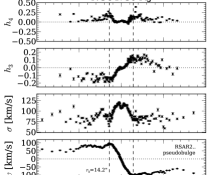 |
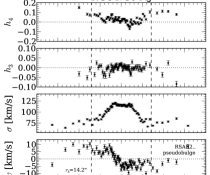 |
|---|
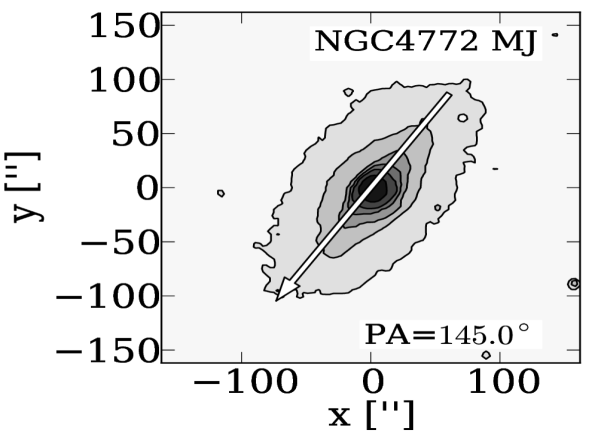 
|
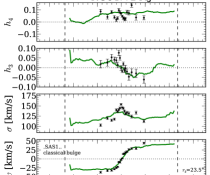 |
 |
|---|
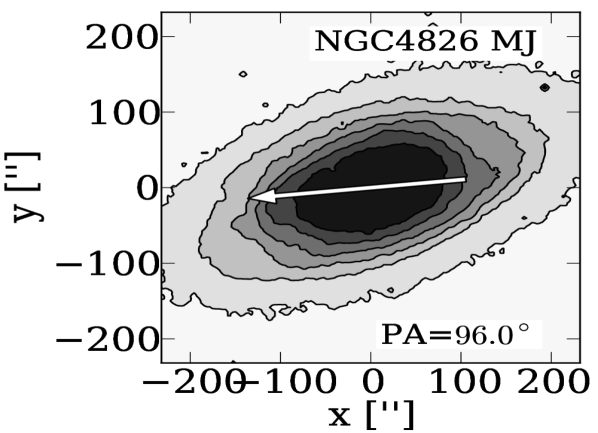 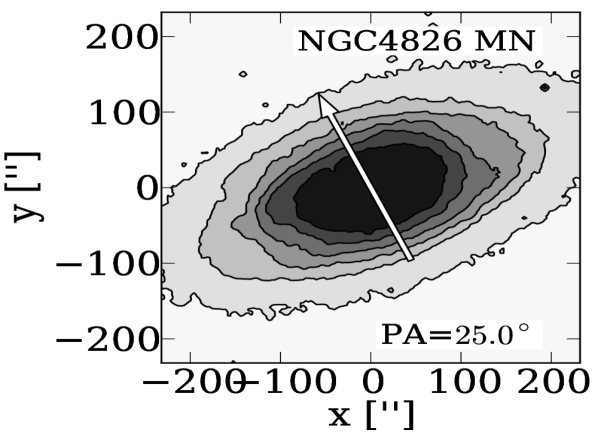
|
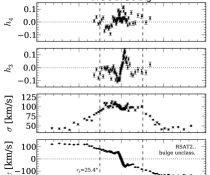 |
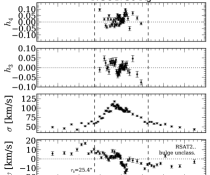 |
|---|
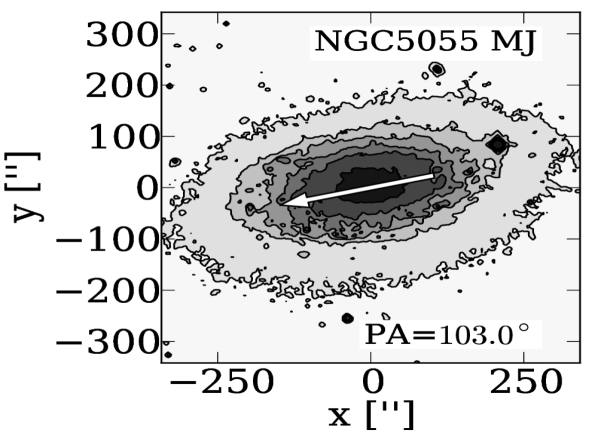 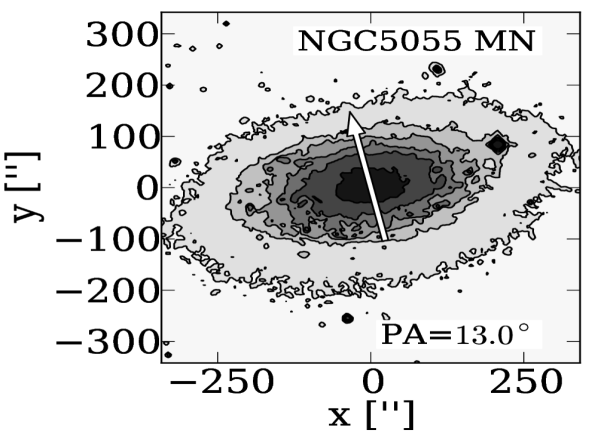
|
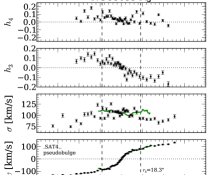 |
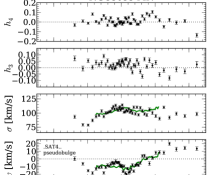 |
|---|
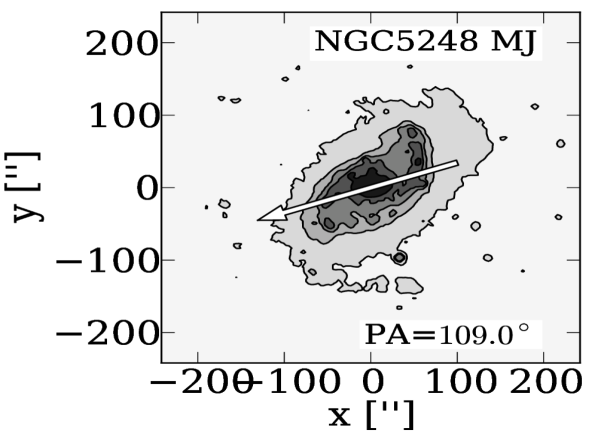 
|
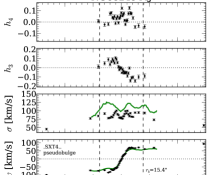

|
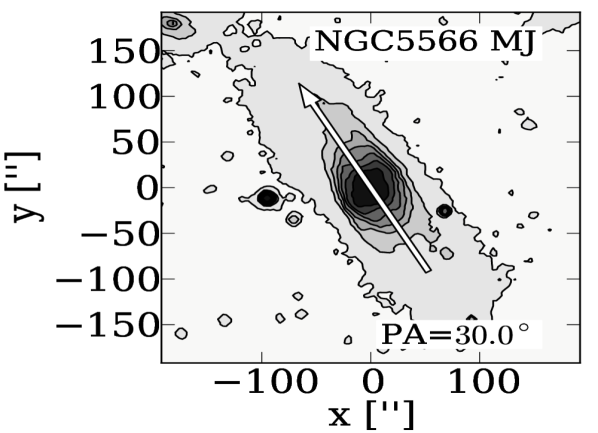 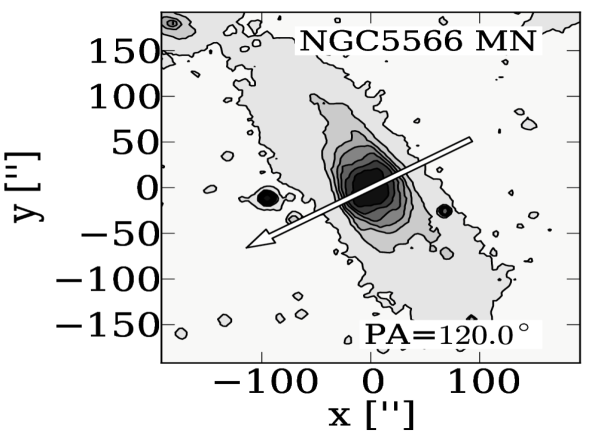
|
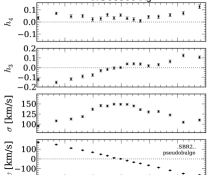 |
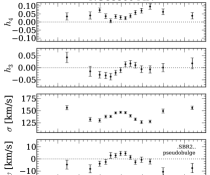 |
|---|
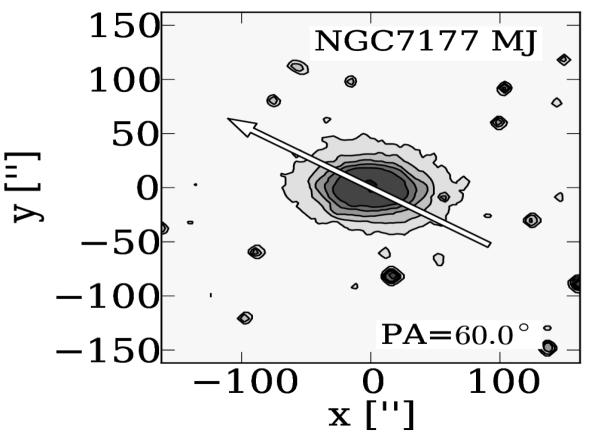 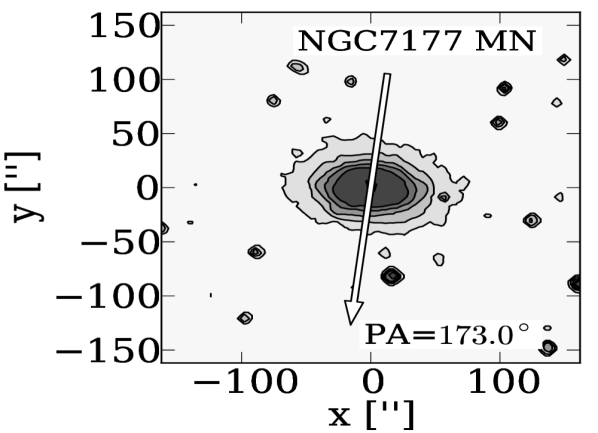
|
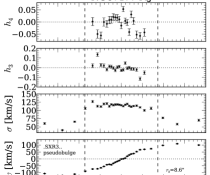 |
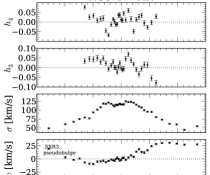 |
|---|
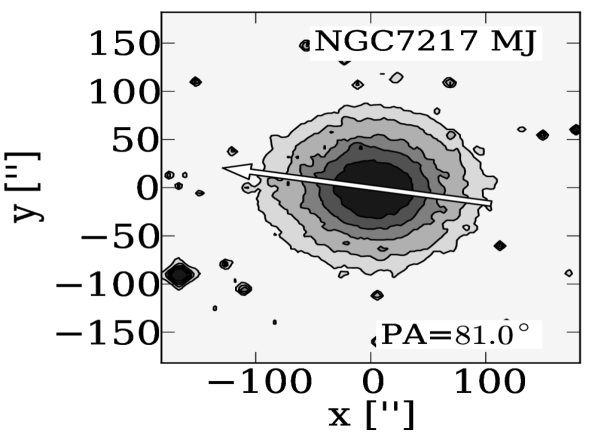 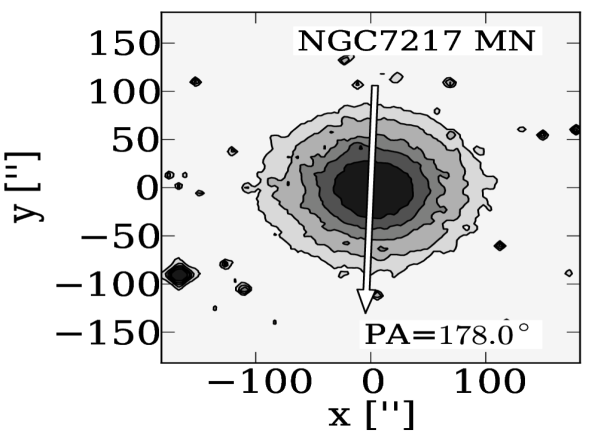
|
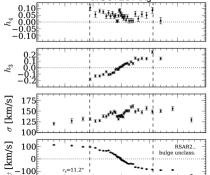 |
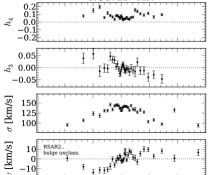 |
|---|
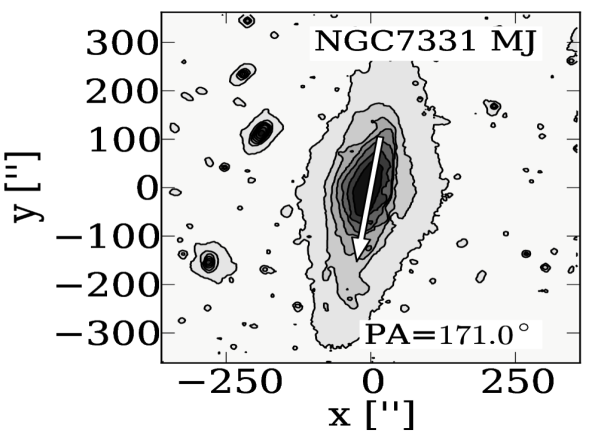 
|
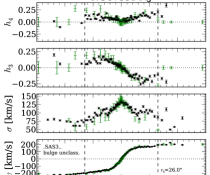 |
 |
|---|
 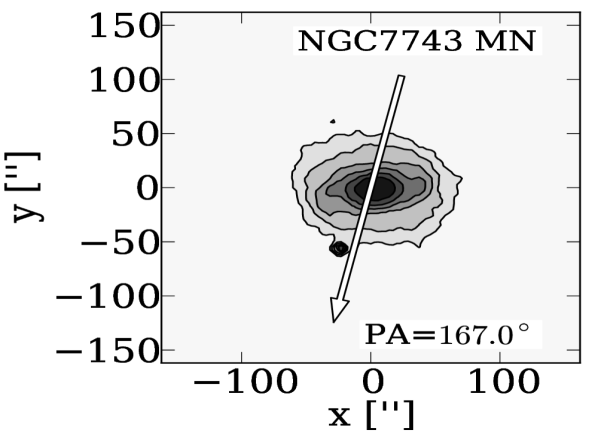
|
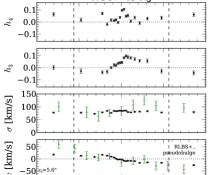 |
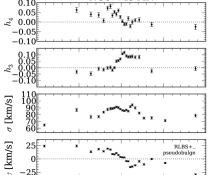 |
|---|
Appendix B Notes on individual galaxies
B.1. Classical bulges
NGC 1023
.LBT-.. — Clean classical morphology in HST F555W. The rotation curve steps rapidly from +60 kms-1 to -60 kms-1 in the central two arcseconds and rises then gradually to a value of 200 kms-1 at 50 arcseconds. The profile shows an equally fast change within the inner arcseconds from -0.03 to 0.03 with opposite sign. Like Emsellem et al. (2004) we see that the / anti-correlation turns into a correlation outwards of 10 arcseconds. The velocity dispersion profile rises all the way to the centre. Outside of 50 arcseconds the velocity dispersion profile flattens out at about 100 kms-1 which coincides with a flattening in the rotation curve. This is significantly beyond the bulge radius of 19 arcseconds. The minor axis rotation is mostly close to zero at larger radii but becomes negative inwards of 4 arcseconds ( -25 kms-1 at the centre). The acquisition image does not show an obvious offset of the minor axis slit but we note that due to the rapid rise of major axis rotation in the central arcseconds already a small offset of ( 0.5 arcsecond) to the west suffices to explain the observed behaviour. The moments become positive in the same radial range, which is expected if the velocity offset is due to actual rotation. The minor axis moments show a double peak at arcseconds with maximum values of . The continuously centrally rising velocity dispersion of the major axis is reproduced on the minor axis.
NGC 2775
.SAR2.. — The HST F606W image shows a very clear classical morphology, the F450W image shows very little amounts of dust in the central region. We see a depression in the velocity dispersion profile inwards of 5 arcseconds in the major axis profile as well as in the minor axis profile which coincides with a steeper part in the rotation curve. Eskridge et al. (2002) describe a large, slightly elliptical bulge which contains a bright nuclear point source. The Spitzer MIPS 24 image shows a resolved nuclear source of emission which clearly stands out from a region of low emission which again in size roughly corresponds to the bulge radius. This may hint at a cold nuclear component with active star formation which dominates the kinematics. We exclude the data inwards of 5 arcseconds from our analysis but note that this choice does significantly affect the position of NGC 2775 in the plane of Sérsic index versus velocity dispersion slope.
NGC 2841
.SAR3*. — The HST F438 image shows a weak nuclear dust spiral that is misaligned with the outer disc. The larger scale bulge morphology is smooth and shows little sign of dust and no spiral pattern. The profile is anti-correlated with the rotation curve inwards of 4 arcseconds but then changes sign and becomes correlated with the velocity until about 20 arcseconds. The velocity dispersion profile is centrally rising and may show a little shelf inwards of 5 arcseconds. The minor axis rotation curve shows an offset within the bulge radius.
NGC 2859
RLBR+.. — Prominent outer ring galaxy. This galaxy has no close-to -band HST image available. The bulge morphology in HST F814W and in the acquisition images is generally smooth and classical with few weak dust lanes. Our HET long slit data do not cover the full bulge region ( arcsec). Still the rotation curve starts to flatten out at our outermost data point at arcseconds. Within this region the velocity dispersion profile rises centrally from about 125 kms-1 at arcseconds to 175 kms-1 in the centre. The moments are clearly anti-correlated with velocity. The moments show indication of the double peak signature at arcseconds. The minor axis kinematic data only reach out to 6 arcseconds with little rotation along the minor axis (less than 25 kms-1). The coverage of the dispersion profile in insufficient to judge whether the central rise seen along the major axis is reproduced. The minor axis and moments are somewhat noisy but do not exceed values of 0.05 and show no significant trends.
NGC 2880
.LB.-.. — The bulge morphology is classical in HST F555W. Erwin (2004) finds indication of a weak inner disk but acknowledges that this is the weakest case in his sample. The velocity dispersion profile rises centrally with a weak non-symmetric shelf-like structure inwards of 4 arcseconds. The moments are anti-correlated with velocity within the bulge.
NGC 3031
.SAS2.. — M81, interacting with the M81 group. Prominent central emission features connected to a liner type activity prevent us from deriving the central kinematics ( arcseconds) reliably. This galaxy exhibits an interesting shape of its velocity dispersion profile. The profile first rises gradually until 150 kms-1 at radius of about 25 arcseconds. It then drops quickly to a minimum of about 130 kms-1 at 18 arcseconds and rises then again to 160 kms-1 at the centre. The drop around 18 arcseconds is accompanied by a rapid change of slope of the rotational velocity which stays relatively flat outwards of this radius and a strengthening of the moments. Also the otherwise vanishing moments rise to positive values ( 0.1) at 15 arcseconds where they form the most prominent double peak feature of our sample. The minor axis profile shows similar local minima in the dispersion profile that are accompanied by local maxima in the moments at radii of about 9 arcseconds. Given the inclination of this points to a flattened structure within the bulge.
NGC 3245
.LAR0*. — The HST F547M image reveals a nuclear dust disk while the larger scale bulge morphology is classical. This galaxy potentially hosts a lens (de Vaucouleurs & de Vaucouleurs 1964). The rotational velocity exhibits a shelf reaching from about 3 arcseconds out to the bulge radius at 15 arcseconds. The velocity dispersion profile rises steadily towards the centre. The moments are anti-correlated with velocity inwards of 5 arcseconds. At 5 arcseconds they reach a maximum and then drop to zero towards the bulge radius. The are compatible with zero at the bulge radius ( arcseconds) but with decreasing radius briefly drop to about -.05 at arcseconds. Finally inside of 2. arcseconds they become compatible with zero.
NGC 3521
.SXT4.. — The latest Hubble type with classical bulge in our sample. In HST F606W the classical bulge morphology stands in strong contrast to the strong outer disk spiral structure with a sudden transition of those two morphologies at r 10 arcseconds. The rotation curve forms a shelf at about 3 arcseconds but rises again slightly towards larger radii and starts to flatten out at 16 arcseconds. The velocity dispersion reaches a local maximum of 115 kms-1 at the bulge radius ( arcseconds) but then strongly drops with decreasing radius and reaches a local minimum of 100 kms-1 at 4 arcseconds. Further inwards the dispersion is centrally peaked. Outside the bulge region the dispersion shows another local maximum around 40 arcseconds which also corresponds to a slight secondary shelf on the rotational velocity. The moments are anti-correlated with velocity and form a shelf at about the same radii where the inner shelf in rotational velocity is seen. Outside the bulge becomes rather strong (up to 0.22) which is accompanied by strong, positive moments of up to 0.15. These large moments are a consequence of the double-peak structure of the LOSVDs which has been previously reported by Zeilinger et al. (2001) caused by a secondary kinematic component (see § 5.7). The minor axis velocity dispersion profile does not show the strong local minima that the major axis profile shows but is similarly disturbed outside the bulge.
NGC 3898
.SAS2.. — Outer disk dust spiral transitions into weak dust lanes over a smooth and classical bulge morphology in HST F606W. The rotation curve rises slowly out to r 10 arcseconds and flattens at about the bulge radius of 15.7 arcseconds. The velocity dispersion profile is strongly centrally peaked and rises smoothly from 140 kms-1 to 220 kms-1 in the centre. The moments are anti-correlated with velocity and reach local maximum at r 10 arcseconds, the same radius where the flattening of the rotation curve sets in.
NGC 3992
.SBT4.. — This galaxy is prominently barred. While the bulge morphology generally appears classical it exhibits a few randomly distributed dust lanes in the only available optical HST image in F547M. With increasing radius the velocity profile reaches a first plateau at r 7 arcseconds but outside the bulge radius of arcseconds it starts rising again slowly. The velocity dispersion profile is significantly depressed within the bulge region. The moments are strongly anti-correlated with velocity inwards of 7 arcseconds but become weaker further out. The moments show double peak feature around 8 arcseconds.
NGC 4203
.LX.-*. — This galaxy represents a borderline case in the morphological bulge classification. The bulge has a few dust lanes in HST F555W superimposed on a generally smooth morphology. Fisher & Drory (2008) classify the bulge as classical. The major axis velocity profile flattens out at about the bulge radius of 14.7 arcseconds. The velocity dispersion profile shows a prominent rise from about 105 kms-1 at the bulge radius to 175 kms-1 in the centre. The moments are mostly compatible with zero in the bulge region. The moments are noisy and show no significant trend within the covered region.
NGC 4260
.SBS1.. — Strongly barred. The bulge morphology is generally smooth. Martini et al. (2003) acknowledge the presence of dust structures in the central region but claim that they do not imply a sense of rotation. The bulge is classified as a classical bulge by Fisher & Drory (2008). The velocity dispersion profile is somewhat irregular and S-shaped within the bulge region. The moments are small and mostly compatible with zero, The moments show a gradual drop from a central value of zero to about at about 10 arcseconds.
NGC 4379
.L..-P* — Exhibits a very smooth and featureless, classical central morphology in HST F555W. The bulge radius is 8.6 arcseconds. The inset of the flattening of the rotational velocity occurs already at 8-10 arcseconds. The velocity dispersion profile is centrally peaked, rising from 90 kms-1 at 10 arcseconds to 120 kms-1 in the centre. The moments are generally small (within the errors mostly compatible with zero) but an overall trend points to anti-correlation with velocity. The values are are noisy but mostly compatible with zero.
NGC 4698
.SAS2.. — HST F606W shows some weak dust lanes in the central region which however do not imply any sense of rotation. It is classified as classical bulge by Fisher & Drory (2010). Falcón-Barroso et al. (2006) find that the stellar velocity field displays rotation perpendicular to the major axis within the central arcseconds. The major axis rotational velocity is very slowly rising indicative of counter rotation. The velocity dispersion profile is mostly flat within the bulge region ( arcseconds) with a weak central peak. In the small radial range that our data cover the and moments are mostly compatible with zero.
NGC 4772
.SAS1.. — The bulge morphology is smooth and featureless in HST F606W, the bulge is consequently classified as classical by Fisher & Drory (2008). The [O iii] map of Falcón-Barroso et al. (2006) shows almost counter rotation with respect to the stars in the central arcseconds (see also Haynes et al. 2000). Our data virtually only cover the bulge region. The velocity dispersion profile is generally noisy with values between 100 kms-1 and 150 kms-1 but features a clear central peak. The moments are anti-correlated with velocity and reach values of up to about . moments scatter around values of 0.05 at all radii.
B.2. Pseudobulges
NGC 2681
PSXT0.. — Possibly a triple barred system (Erwin & Sparke 1999). In HST F555W a dust spiral is seen, which extends all the way into the centre. The rotational velocity curve shows a shelf between 2 and 12 arcseconds. The outer radius of the shelf region coincides with the bulge radius ( 13.2 arcseconds). Inwards of 2 arcseconds the rotation curve drops quickly to zero. With decreasing radius, the velocity dispersion rises from about 50 kms-1 to a values of 75 kms-1 at the bulge radius. Towards smaller radii it first stays relatively constant but then shows a step at about 5 arcseconds and rises again inwards of 2 arcseconds. The moments are anti-correlated with velocity in the region of the fast velocity rise but become correlated in the velocity shelf region. The moments show a double peak feature in the radial range of 2-4 arcseconds.
NGC 2964
.SXR4*. — High contrast dust spiral in HST F606W. The bulge is small ( arcseconds) and we do not sufficiently resolve it to include this galaxy in any of our structural plots. Here we publish the kinematic profiles. The velocity dispersion rises from values of about 40 kms-1 in the disk to 106 kms-1 at the bulge radius and exhibits a depression within the bulge. and moments scatter strongly within values of which is possibly a consequence of the dust.
NGC 3166
.SXT0.. — The HST F547M image shows strong dust features and a dust spiral which extends all the way into the centre. Laurikainen et al. (2004) describe this galaxy as strongly barred. The velocity dispersion profile shows a strong depression at 4.5 arcseconds which is accompanied by relatively strong moments of and positive moments and a local maximum in the rotation curve. The minor axis shows small but significant rotation within the bulge region ( 10 kms-1) while the moments are largely compatible with zero. The depression of the velocity dispersion is also seen on the minor axis whilst not as strong.
NGC 3351
.SBR3.. — The bulge hosts a clear spiral structure and a nuclear ring (Fisher & Drory 2010) and shows signs of active star formation. SAURON data (Dumas et al. 2007) show a drop in the gas velocity dispersion derived from H and lowered [O iii]/H ratios in the ring indicative of star formation. The velocity dispersion profile shows a depression within the bulge region — most strongly at r 5 arcseconds down to a value of 70 kms-1 — and rises again centrally to 90 kms-1 which is still below the values of about 100 kms-1 seen just inside of the bulge radius ( arcseconds). The moments are clearly anti-correlated with velocity. The minor axis profile shows significant rotation (50 kms-1) indicative of a slit misalignment, in fact there is a 25∘difference between our major axis slit position of 165∘and the Hyperleda published value of 9.9∘.
NGC 3368
.SXT2.. — Complex morphology with a number of stellar components (Erwin 2004; Nowak et al. 2010). This galaxy is possibly double-barred (Jungwiert et al. 1997). The bulge hosts a strong nuclear spiral and an inner disk (Erwin 2004) and is classified as pseudobulge by Fisher & Drory (2010). The bulge radius is 20.4 arcseconds. The complex morphology is reflected in the kinematic structure. The rotational velocity reaches a local maximum at about 7 arcseconds. This is accompanied by local minimum in the velocity dispersion profile that has been rising inwards until 13 arcseconds. Inwards of 7 arcseconds the dispersion rises again, but asymmetrically about the centre, see also Nowak et al. (2010). The local maximum in velocity and local minimum in dispersion coincide with strengthened moments. is anti-correlated with velocity inwards of 15 arcseconds but correlated outside. The moments are close to zero at 13 arcseconds but become positive and reach a local maximum at about the same radii where the local maxima in velocity are observed and the drops in velocity dispersion and strengthening of moments occur. The minor axis profile shows similar depressions in velocity dispersion. The minor axis velocity profile shows a central peak of about 30 kms-1. Visual inspection of the HET pre-acquisition images reveals that a minor offset of the slit position ( arcsec) to the west is responsible for the peak.
NGC 3384
.LBS-*. — Contains a nuclear bar (Fisher & Drory 2010) and a rapidly rotation disk described by Busarello et al. (1996); Fisher (1997) and Emsellem et al. (2004) already find strong moments in anti-correlation with velocity. The velocity dispersion profile changes slope at 10 arcseconds and becomes more shallow towards smaller radii, but then exhibits a pronounced peak inwards of 3 arcseconds that is accompanied by a dip (as seen by Fisher (1997); Emsellem et al. (2004) as well) in the moments that become positive just outside of this region.
NGC 3627
.SXS3.. — Prominently barred galaxy with wide, open arms, interacting with the Leo group. High contrast dust lanes that extend to the very centre are seen in HST F606W and let Fisher & Drory (2008) classify this as a pseudobulge. After a fast rise the rotational velocity forms a shelf between 3 arcseconds and the bulge radius of about 11 arcseconds. Towards larger radii the velocity rises again. The velocity dispersion rises inwards, starting already far outside the bulge radius. At 4 arcseconds it flattens out and stays essentially constant. The moments are anti-correlated with velocity inside of 9 arcseconds but change sign at larger radii and become correlated with velocity. While the minor axis rotation is compatible with zero at larger radii it exhibits significant rotation inwards of about 7 arcseconds that is also seen in anti-correlated moments.
NGC 3675
.SAS3.. — The HST F606W image clearly shows a high contrast flocculent spiral that extends all the way into the centre. The velocity dispersion reaches a maximum of about 110 kms-1 at 40 arcseconds and stays rather constant inside of this radius. The moments are anti-correlated with velocity within the bulge and reach maximum values of about 0.1 at the bulge radius of 8.5 arcseconds.
NGC 3945
RLBT+.. — Double barred (Kormendy 1979, 1982; Wozniak et al. 1995; Erwin & Sparke 1999, 2003; Erwin 2004) galaxy with prominent outer ring. Exhibits complicated kinematic structure. The rotational velocity has local minima around 18 arcseconds, rises then towards smaller radii and reaches a local maximum around 8 arcseconds before it falls off to the centre. The dispersion profile has very strong local minima — drops from 150 kms-1 to 110 kms-1 — at r 8 arcseconds but then rises again towards the centre. This galaxy shows exceptionally strong moments of up to 0.25 which are anti-correlated with velocity in the inner region but become positively correlated at about 20 arcseconds. The moments are similarly strong (up to 0.2) with significant central depression. The LOSVDs do show significant low velocity shoulders at radii between which is indicative of a kinematic distinct component (see Sec. 5.7). The minor axis profile also shows a local depression in velocity dispersion but at r 3.5 arcseconds, the central dip in is seen as well. We measure slight rotation ( 25 kms-1) along the observed position angle of and a significant central offset of the velocity ( 40 kms-1). The major axis velocity profile shows that a slit position offset of one arcsecond is sufficient to explain the central velocity peak. A visual inspection of the pre-acquisition image confirmed that such an offset was indeed present (about 0.6 arcseconds).
NGC 4030
.SAS4.. — The flocculent spiral structure — easily seen in HST F606W — extends all the way to the centre with star-forming knots in the inner disk (Eskridge et al. 2002). Fisher & Drory (2008) classify it as pseudobulge. The major axis rotational velocity reaches 100 kms-1 at about arcseconds. The velocity dispersion stays moderately flat within the bulge region and drops off outside , this was also observed by (Ganda et al. 2006) . The moments are clearly anti-correlated with velocity and reach a values of up to 0.1 at a radius of about 7 arcseconds. moments are compatible with zero at all radii that are covered by our data. The bulge is small ( arcseconds) and we do not sufficiently resolve it to include this galaxy in any of our structural plots.
NGC 4274
RSBR2.. — Double barred galaxy (Shaw et al. 1995; Erwin 2004). It is classified as pseudobulge with a Sérsic index of by (Fisher & Drory 2010). The bulge hosts a prominent nuclear spiral including strong dust lanes and a nuclear ring. The ring is seen as a fast-rotating, low-dispersion component in SAURON velocity and dispersion maps (Falcón-Barroso et al. 2006). It also appears in their ionized gas maps through increased H emission and lowered [O iii]/H ratios which indicates star-formation. The major axis rotational velocity rises quickly with increasing radius and starts flattening out at about 4 arcseconds, well within the bulge radius of 11.3 arcseconds. The velocity dispersion profile shows a strong depression inside the bulge with values of about 100 kms-1. Outside the bulge the dispersion rises to values exceeding 130 kms-1. The moments are well anti-correlated with velocity in the radial range that is covered by our data. They reach values of up to at about the same radius where the rotational velocity starts to flatten out. This is accompanied by peaks in the moments with values of up to 0.14.
NGC 4314
.SBT1.. — Strongly barred galaxy with prominent nuclear ring. The ring appears in SAURON ionized gas maps (Falcón-Barroso et al. 2006) through lowered velocity dispersions, increased H and lowered [O iii]/H which indicates star-formation. The bulge is consequently classified as pseudobulge by Fisher & Drory (2008). The rotational velocity starts to flatten at the bulge radius of 8.6 arcseconds. The velocity dispersion profile is asymmetric but relatively flat, it varies between values of 105 kms-1 and 130 kms-1. The only allows us to derive and moments inside a radius of 6 arcseconds. The moments are mostly compatible with zero, the moments rise from zero in the centre to values around 0.05 at 4 arcseconds.
NGC 4371
.LBR+.. — Strongly barred galaxy. Erwin & Sparke (1999) find a bright stellar ring that is notable by adjusting the contrast of the e.g. the HST F606W image carefully or through unsharp masking. While free of obvious dust or spiral structures the ring with a radius of about 5 arcseconds falls within the bulge radius which lets Fisher & Drory (2010) classify this as a pseudobulge. The major axis rotational velocity starts to flatten out at a radius of 8 arcseconds — well inside the bulge radius or 22.9 arcseconds — with a weak shelf around 3-8 arcseconds. The velocity dispersion rises from about 105 kms-1 at the bulge radius to about 130 kms-1 at 7 arcseconds. Inside of 7 arcseconds the velocity dispersion stays relatively constant. The moments are somewhat asymmetric but generally anti-correlated with velocity within the bulge. The moments are compatible with zero in the centre but rise gradually to values of about 0.05 at 10 arcseconds. The minor axis velocity dispersion stays mostly constant within the covered radial range. The minor axis moments remain compatible with zero while the moments rise from zero at the centre to values of about 0.05 at arcseconds.
NGC 4394
RSBR3.. — Strongly barred galaxy with a face-on spiral in the central r arcseconds. Fisher & Drory (2008) classify it as a pseudobulge. The major axis velocity profile rises quickly to about 50 kms-1 at 3 arcseconds. The velocity dispersion exhibits two prominent maxima around arcseconds. The maxima reach values of about 105 kms-1 but drop quickly to about 80 kms-1 at 4 arcseconds and stay relatively constant towards smaller radii from there on. The moments are anti-correlated with velocity inside the bulge. The values are asymmetric and somewhat large within the bulge with values of up to 0.07 but we note that with dispersion values around 80 kms-1 we reach the limit of our ability to resolve those values properly.
NGC 4448
.SBR2.. — Fisher & Drory (2010) note a mild spiral structure that extends into the centre and classify it as a pseudobulge. The major axis rotational velocity starts to flatten out at about 5 arcseconds — just inside of the bulge radius of 8.5 arcseconds. Outside of 5 arcseconds the velocity profile exhibits a weak shelf. The velocity dispersion is mostly constant at a value of 115 kms-1 at all radii covered by our data. The moments are somewhat asymmetric, close to zero at positive radii but vary strongly at negative radii. The moments scatter about zero in the bulge region with a few outliers at -0.05.
NGC 4501
.SAT3.. — A nuclear spiral extends all the way to the centre in HST F606W. Fisher & Drory (2010) classify the bulge as pseudobulge. The major axis velocity profile rises quickly from the centre to the bulge radius of 6.2 arcseconds but then flattens out at the bulge radius and forms a shelf out to about 20 arcseconds. The velocity dispersion rises from 75 kms-1 in the disk to about 150 kms-1 at 15 arcseconds. The moments are strongly anti-correlated with velocity inside the bulge and reach values of 0.1 at the bulge radius. moments are mostly compatible with zero at all radii. The minor axis velocity dispersion profile starts rising with decreasing radius inwards of 30 arcseconds and reaches a maximum of 155 kms-1 at arcseconds. The minor axis velocity dispersion exhibits a central depression of about 15 kms-1. The minor axis velocity, and moments are mostly compatible with zero.
NGC 4536
.SXT4.. — A strong dust spiral extends into the very centre. Fisher & Drory (2008) classify the bulge as pseudobulge. The bulge radius is 10.1 arcseconds. The major axis rotational velocity flattens well inside bulge radius at around 2 arcseconds. The velocity dispersion profile is slightly asymmetric but mostly constant within the bulge region. The moments are anti-correlated with velocity inside the bulge region and reach values of about 0.1. The profile is asymmetric. The minor axis velocities show slight asymmetric rotation ( 25 kms-1). The velocity dispersion profile rises centrally but stays relatively flat within 10 arcseconds. The minor axis moments are somewhat noisy but seem to show a central depression.
NGC 4569
.SXT2.. — A nuclear spiral extends all the way to the centre. The bulge is classified as pseudobulge by Fisher & Drory (2010). The major axis rotational velocity rises with increasing radius to a local maximum of about 80 kms-1 at 3 arcseconds. The bulge radius is arcseconds. The velocity then drops to about 50 kms-1 at the maximum radius covered by our data. The velocity dispersion rises with decreasing radius to about 100 kms-1 at a radius of 6 arcseconds and then drops and reaches a local minimum at around 3 arcseconds, roughly coinciding with the locations of the local maxima in the velocity profile. The moments are anti-correlated with velocity inside the bulge. Their absolute values reach up to 0.15. The moments show a strong double peak feature at about 3 arcseconds and fall off to zero at the bulge radius. The minor axis profile shows rotation in the bulge region. While somewhat asymmetric, the minor axis dispersion profile does not show the same complicated structure of the major axis profile. The moments on the minor axis are mostly compatible with zero. The moments on the minor axis are mostly slightly positive with a mean value of 0.03. The moments are generally noisy but the double peak feature of the major axis is reproduced.
NGC 4736
RSAR2.. — Hosts a nuclear bar (Sakamoto et al. 1999) and prominent nuclear spiral which extends all the way into the centre in HST F555W. The bulge is classified as pseudobulge by Fisher & Drory (2010). The obtained kinematic data extend well into the disk. The rotational velocity flattens out abruptly at about the bulge radius of 14.2 arcseconds and shows a shallow negative gradient out to about 70 arcseconds where our data points start to become sparse. The velocity dispersion rises abruptly from about 75 kms-1 to 115 kms-1 at about the bulge radius. Well within the disk at radii larger than 50 arcseconds we see again a gradual increase of velocity dispersion. Inside of 2.5 arcseconds the velocity dispersion exhibits a central drop. The moments are anti-correlated with velocity but show s-shape around the centre. They reach exceptionally large values of at the bulge radius. The moments are compatible with zero in the inner bulge but reach pronounced local maxima of values as large as 0.25 at about the bulge radius. They fall off to zero at arcseconds. These strong higher moments are a consequence of the multi-component structure of the LOSVDs at the respective radii (see Sec. 5.7). The minor axis profile reflects the rich structure seen in the major axis profile. The velocity dispersion rises significantly inwards of 10 arcseconds. The moments are mostly compatible with zero at all radii, moments are zero inside of 10 arcseconds but rise to about 0.1 at 20 arcseconds.
NGC 5055
.SAT4.. — The HST F606W image shows that the outer disk flocculent spiral extends into the very centre. Consequently this galaxy is classified as pseudobulge by Fisher & Drory (2010). The velocity dispersion profile remains flat inside the bulge radius of 18.3 arcseconds. The moments are anti-correlated with velocity inside the bulge and reach absolute values of up to 0.1 at the bulge radius. The moments are compatible with zero inwards of 10 arcseconds, they become noisy further out but show a weak tendency towards more positive values towards the bulge radius. The minor axis velocities appear somewhat irregular but small ( kms-1). The minor axis moments are noisy but mostly scatter close to zero. Again the moments are mostly compatible with zero inwards 10 arcseconds. but show a weak increase further out but only on the east side.
NGC 5248
.SXT4.. — Has a prominent nuclear spiral clearly visible in HST F814W. SAURON maps show the presence of a nuclear ring in H and [O iii] emission. A lowered [O iii]/H shows that the ring is star-forming. The bulge was classified as pseudobulge by Fisher & Drory (2010). The rotational velocity starts to flatten at about 6 arcseconds — well inside the bulge radius of 15.4 arcseconds. The velocity profile shows a shelf between 10 arcseconds and 40 arcseconds. The velocity dispersion profile is mostly flat at about 80 kms-1 with two small peaks at arcseconds. The moments are anti-correlated with velocity and reach values of up to . The moments scatter around values of 0.05.
NGC 5566
.SBR2.. — Shows a nuclear spiral in HST F606W. The surface brightness profile does not resemble a traditional bulge plus disk structure. We do not include this galaxy in any of the structural plots and publish only the kinematic profile here. The rotational velocity starts to flatten at 6 arcseconds. The velocity dispersion profile rises towards the centre and peaks at a value of about 150 kms-1. The moments are anti-correlated with velocity and reach values of up to 0.15. The moments are small in the central arcseconds but rise to values of about 0.1 at arcseconds.
NGC 7177
.SXR3.. — A nuclear bar extends out to about arcseconds. The bulge is classified as pseudobulge by Fisher & Drory (2010). The flattening of the major axis rotational velocity coincides with bulge radius of arcseconds. The velocity dispersion rises from about 50 kms-1 in the disk to values of 115 kms-1 inside the bulge but remains relatively flat inside the bulge radius. The moments are weakly anti-correlated with velocity but remain small. The moments drop to values of -0.05 at arcseconds. The minor axis shows an asymmetric velocity profile with values of up to kms-1. The minor axis velocity dispersion again rises from about 50 kms-1 in the disk to values of about 115 kms-1 at 2.5 arcseconds and remains flat inside. The moments are anti-correlated with velocity. The moments are noisy and scatter around zero.
NGC 7743
RLBS+.. — The central region exhibits some weak dust lanes overlaid on a generally (Martini et al. 2003) smooth light distribution. The bulge is classified as classical bulge by Fisher & Drory (2008). The amplitude of the rotation is small at about kms-1 due to the low inclination. We find rotation of similar value along the minor axis slit due to a misplacement of the slit ( rather than ). The velocity dispersion is flat for both position angles and takes values of about 80 kms-1. Both, major axis and minor axis moments are anti-correlated with velocity and become compatible with zero at the bulge radius ( arcseconds). The moments are very noisy, probably due to the low velocity dispersion of this object.
B.3. Bulges without classification
NGC 2460
.SAS1.. — Mixed type morphology in HST F606W with a weak asymmetric dust structure in the bulge region that is overlaid on an otherwise smooth light distribution. We label this bulge as unclassified. The decomposition gave a value of for the Sérsic index and 6.6 arcseconds for the bulge radius. Within this region the velocity dispersion profile is flat and and moments scatter around zero.
NGC 3593
.SAS0*. — Peculiar bulge structure with prominent spiral visible even in NIC F160W. The bulge is classified a pseudobulge by Fisher & Drory (2010). We label it as non-classified because its high inclination inhibits an unperturbed view into the bulge region. This is the only example in our sample where counter rotation is seen in the velocity profile as an actual change of the sign of the velocity with respect to the systemic velocity (this was found also by Bertola et al. 1996). The counter rotation within the bulge radius is reflected in the anti-correlated moments. The velocity dispersion drops dramatically from 115 kms-1 at the bulge radius to 60 kms-1 in the centre.
NGC 3953
.SBR4.. — Fisher & Drory (2010) classify this bulge as pseudobulge but acknowledge that there is no optical HST image available. Here we label it as non-classified. The rotational velocity profile first reaches a weak local maximum at r 2.5 arcseconds before it starts rising again outside of 8 arcseconds. The disk velocity dispersion rises centrally from values of kms-1 at 30 arcseconds to kms-1 at arcseconds. Inside of a radius of 6 arcseconds it then falls toward a central value of kms-1. The fast central increase of velocity is accompanied by strong anti-correlated moments with values of up to 0.1 at arcseconds, they become correlated with velocity outside of 8 arcseconds. The moments are generally noisy in the bulge region and scatter between zero and 0.05.
NGC 4826
RSAT2.. — Also named the black eye galaxy. An extreme dust spiral in the central 50 arcseconds stands in strong contrast to a virtually dust free outer disk. The central dust content leads to a classification as pseudobulge in Fisher & Drory (2008). The major axis kinematic profile is rich in structure. The rotational velocity rises quickly from the centre to a value of kms-1 at arcseconds. It then forms a shallow trough around arcseconds and then rises again — more slowly — out to 50 arcseconds where it finally flattens out. The velocity dispersion in the disk is 45 kms-1, it shows a distinct central increase inwards of 50 arcseconds. The dispersion reaches values of up to 110 kms-1 inside of the bulge radius ( arcseconds). From there on it stays relatively constant with decreasing radius except for a mild depression down to 90 kms-1 in the central few arcseconds. The moments are strongly anti-correlated with velocity for arcseconds and reach absolute values of up to 0.15. The moments show two peaks at about arcseconds. We find weak rotation along the minor axis ( kms-1). The central increase in velocity dispersion is also seen along the minor axis, the increase sets in at a radius of about 25 arcseconds. This is much closer to the centre than in the case of the major axis and points to a flattened structure. For the photometry we obtain a mean bulge ellipticity of 0.23. The radial difference of the dispersion increase along the major and the minor axis would point to an ellipticity of about 0.45. The centre of the velocity dispersion profile is asymmetric which may be a consequence of the strong dust. The minor axis and moments are compatible with zero. The fact that the final flattening of the rotational velocity and the inset of the dispersion increase at 50 arcseconds falls together with the sudden appearance of the strong dust structure is intriguing and lets one suspect that the actual bulge radius fall closer to 50 arcseconds. The much smaller bulge radius from the decomposition may be a consequence of the strong dust content in the central regions (see also discussion in § 5.4).
NGC 7217
RSAR2.. — Fisher & Drory (2010) point out a sudden break in morphology at a radius of about 8 arcseconds where the outer spiral transitions onto a relatively smooth morphology with little dust. They consequently label this bulge as classical. However we determine a bulge radius of 11.2 arcseconds where there is already a pronounced spiral pattern visible. We label this galaxy as non-classified. The rotational velocity profile starts to flatten out at about the bulge radius of. The major axis dispersion profile is asymmetric with higher values on the east side of the centre. Within the central 2 arcseconds the velocity dispersion shows a mild depression of about 20 kms-1. The moments are well anti-correlated with velocity. The moments scatter around values of 0.05. We observe mild rotation on the minor axis (of the order of kms-1) indicative of a slight slit misalignment. The minor axis velocity dispersion is symmetric and rises towards the centre from values of about 100 kms-1 at radii of 20 arcseconds to 145 kms-1 at 2 arcseconds. Within the central arcseconds the mild depression which is seen on the major axis is reproduced on the minor axis. The minor axis moments mostly scatter around zero while moments fall closer to 0.05 with a few relatively large outliers at radii around 6-10 arcseconds. Merrifield & Kuijken (1994) found the 20%-30% of the light is captured in a counterrotating component. We confirm this and present a kinematic decomposition in §5.7.
NGC 7331
.SAS3.. — The HST F555W image shows several dust lanes in the bulge region. However these do not imply any sense of rotation and seem to be overlaid on a generally smooth light distribution. Fisher & Drory (2008) admit that the high inclination leaves the classification as classical bulge questionable. Here we label it as non-classified. The rotational velocity profile is already flattened at the bulge radius of arcseconds. The velocity dispersion rises from about 75 kms-1 in the disk to 125 kms-1 in the centre. The dispersion profile has two steps or shoulders at arcseconds. The moments are generally anti-correlated with velocity and reach a local maximum of about at arcseconds. Also the moments reach local maxima with values of up to 0.15 in the same radial range.These large moments are a consequence of the double-peak structure of the LOSVDs caused by a counterrotating kinematic component discovered by Prada et al. (1996) (see § 5.7).