The Void Galaxy Survey: Optical Properties and H I Morphology and Kinematics
Abstract
We have carefully selected a sample of 60 galaxies that reside in the deepest underdensities of geometrically identified voids within the SDSS. H i imaging of 55 galaxies with the WSRT reveals morphological and kinematic signatures of ongoing interactions and gas accretion. We probe a total volume of 485 Mpc3 within the voids, with an angular resolution of 8 kpc at an average distance of 85 Mpc. We reach column density sensitivities of cm-2, corresponding to an H i mass limit of M☉. We detect H i in 41 galaxies, with total masses ranging from to M☉. The upper limits on the 14 non-detections are not inconsistent with their luminosities, given their expected H i mass to light ratios. We find that the void galaxies are generally gas rich, low luminosity, blue disk galaxies, with optical and H i properties that are not unusual for their luminosity and morphology. The sample spans a range of absolute magnitudes (-16.1 Mr -20.4) and colors (0.06 0.87), and includes disk and irregular galaxies. We also identify three as early type galaxies, all of which are not detected in H i. All galaxies have stellar masses less than M☉, and many have kinematic and morphological signs of ongoing gas accretion, suggesting that the void galaxy population is still in the process of assembling. The small scale clustering in the void, within 600 kpc and 200 km s-1, is similar to that in higher density regions, and we identify 18 H i rich neighboring galaxies in the voids. Most are within 100 kpc and 100 km s-1 of the targeted galaxy, and we find no significant population of H i rich low luminosity galaxies filling the voids, contrary to what is predicted by simulations.
Subject headings:
galaxies: evolution — galaxies: formation — galaxies: kinematics and dynamics — galaxies: structure — large-scale structure of universe — radio lines: galaxies1. Introduction
Voids represent a unique environment for the study of galaxy evolution (van de Weygaert & Platen, 2009). The lower density environment, equivalent to a lower universe (Goldberg & Vogeley, 2004), should result in shorter merger histories and slower evolution of galaxies. As different mechanisms of gas accretion are believed to dominate in low mass halos, voids present a unique environment in which to search for signs of ongoing cold mode accretion (Kereš et al., 2005). The nature of these void galaxies also provides a test of cold dark matter (CDM) cosmology theory, which predicts that these underdense regions should be filled with low mass dark matter halos that are not observed as low luminosity galaxies (Peebles, 2001). This may have implications for galaxy formation through the suppression of star formation in the lowest mass halos (Hoeft et al., 2006), and may provide general insights into how galaxies populate dark matter halos (Tinker & Conroy, 2009)
Observations of void galaxies selected by different methods consistently show that they are typically low luminosity and late type disk galaxies (Grogin & Geller, 1999; Rojas et al., 2004). They are blue with elevated specific star formation rates (Grogin & Geller, 2000; Rojas et al., 2005), though it is not clear if these characteristics are different from low luminosity disk galaxies in average density environments (Patiri et al., 2006; Park et al., 2007). As the observed shift in the luminosity function results naturally from CDM cosmology (Hoyle et al., 2005; Aragón-Calvo, 2007; Kreckel et al., 2011a), it is possible that the large scale underdensity surrounding void galaxies has little effect on the evolution of these systems.
We are undertaking a multi-wavelength study of 60 void galaxies as part of a new Void Galaxy Survey (VGS, see Kreckel et al. 2011c). A variety of different techniques have been developed to identify voids and void galaxies within galaxy redshift surveys. Colberg et al. (2008) provides an interesting comparison of the results of different void-finding algorithms applied to a single set of simulation data. These techniques generally agree in locating large scale underdensities, however the extent and shape of the identified voids differ dramatically. We employ a powerful geometric method that makes no assumption about the size or shape of the voids within a galaxy distribution. This unique approach allows us to robustly identify a void galaxy population suitable for systematic study.
The earliest void galaxy surveys were severely biased by the selection methods, targeting only emission-line (Kirshner et al., 1981; Lee et al., 2000) or IRAS bright (Szomoru et al., 1996) galaxies. Subsequent void galaxy studies based on more uniformly selected redshift surveys with denser coverage were also biased by the shallow depth available and select only the more luminous void galaxies (Grogin & Geller, 1999), which do not represent the bulk of the low luminosity void galaxy population. We use the Sloan Digital Sky Survey (SDSS) Data Release 7 (DR7), which contains uniform photometry and spectroscopic distances to all galaxies over a quarter of the sky that are brighter than 17.77 -band magnitudes, and focus on relatively nearby galaxies (D 100 Mpc) allowing us to probe void galaxies to Mr = -17. In this paper we discuss the SDSS optical properties of 60 void galaxies, carefully selected by their geometry to be centrally located within the deepest underdensities, and we discuss the neutral gas content in 55 of these systems observed with the Westerbork Synthesis Radio Telescope (WSRT).
The WSRT employs a new backend that enables us to simultaneously image a wide velocity range encompassing the full radial extent of the void with high sensitivity, and good velocity and spatial resolution to trace gas morphology and kinematics of both the target and any neighboring galaxies within the void. Systematic H i imaging of void galaxies has been undertaken by Szomoru et al. (1996), who identified 24 IRAS selected galaxies within the Boötes void. Their targets were generally gas rich and late type, with H i morphologies consistent with similar galaxies in the field, though their sample suffers from contamination by galaxies in higher density substructures within the void (Kreckel et al., 2011c). Single dish observations of dwarf galaxies identify targets in the void as having slightly higher H i mass to light ratio (Huchtmeier et al., 1997; Pustilnik et al., 2002), though the sample size is small. H i blind observations of voids have not revealed a large number of uncataloged detections (Weinberg et al. 1991, Saintonge et al. 2008).
In Section 2 we describe our methods for identifying voids and void galaxies. Section 3 outlines the H i observations undertaken at the WSRT, and Section 4 details our results. We discuss the significance and implications of this work in Section 5, and include a full catalog of the H i and SDSS optical data for the sample in Appendix A. We assume H km s-1 Mpc-1.
2. Sample selection
A complete description of our void finding method and void galaxy selection criteria are presented in the pilot study for this project (Kreckel et al., 2011c). We summarize here the main points of our technique and refer the reader to the more detailed description previously published and references therein.
We apply the Delaunay Tessellation Field Estimator (DTFE111Public software available at http://www.astro.rug.nl/voronoi/DTFE/dtfe.html (Cautun & van de Weygaert, 2011); Schaap & van de Weygaert 2000; Schaap 2007; van de Weygaert & Schaap 2009) to the SDSS redshift survey. We use these galaxies, independent of their luminosity, as tracers to recover the underlying galaxy density field within the local universe. Using redshift as a proxy for distance, we construct the Delaunay tessellation of the three-dimensional galaxy distribution and estimate the local density at each galaxy location on the basis of the inverse of the corresponding contiguous Voronoi cell. The density field throughout the sample volume consists of the linear piecewise interpolation of the density values over the corresponding dual Delaunay tessellation. After weighing the resulting density field for the radial selection function of the SDSS survey, i.e. the decrease in luminosity sensitivity as a function of redshift, we apply a Mpc Gaussian smoothing filter to obtained galaxy density field.
The void identification proceeds by treating the reconstructed density field as a landscape of hills and valleys that is slowly flooded. As neighboring valleys fill and intervening hills are submerged we identify void substructure and boundaries at these higher density regions. In this way we outline the void shapes, without imposing requirements of spherical voids or selection of a local minimum, and are able to unambiguously identify galaxies that reside within the voids. This watershed transform results in basins that are identified as voids by the Watershed Voidfinder algorithm (Platen et al., 2007), and the corresponding boundaries are subsequently identified as walls and filaments using the Cosmic Spine formalism (Aragón-Calvo et al., 2010).
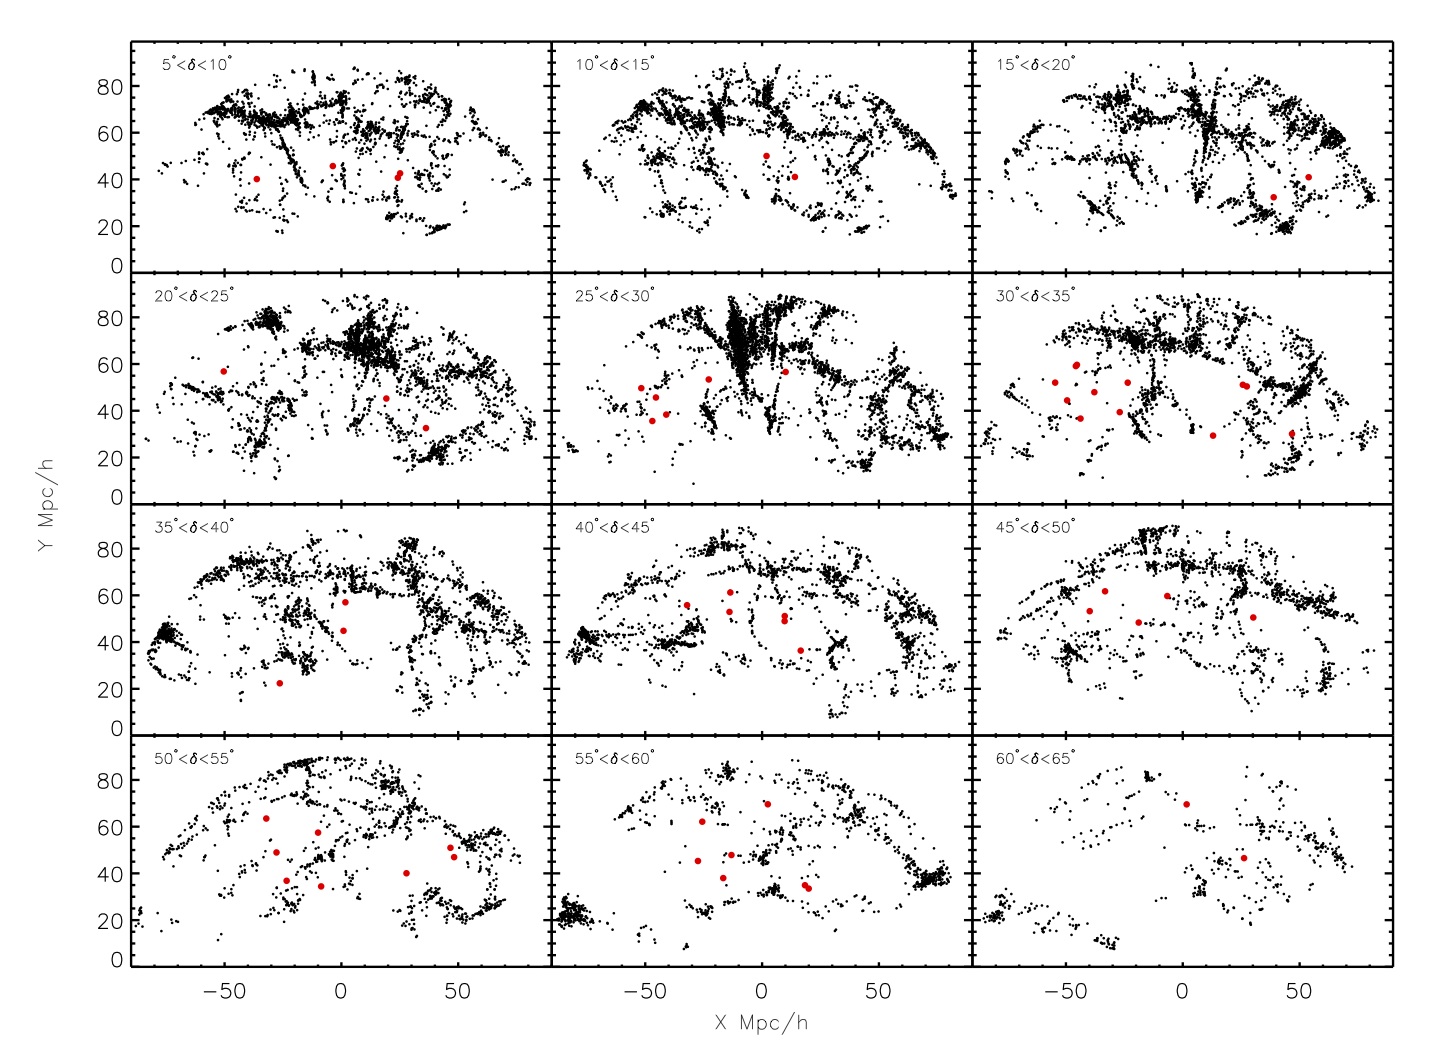
We have selected a sample of 60 galaxies located in the local universe using voids identified within the SDSS DR7. A redshift limit of is imposed to maximize the H i sensitivity and spatial resolution considering the resolution of the WSRT. We also exclude any galaxies within 750 km s-1 of the line of sight of a cluster to avoid contamination by redshift distortions, such as the finger of god effect. An initial sample of galaxies is selected to have a density contrast, , of less than -0.5, where is the mean density estimated for the SDSS. We then choose only those galaxies most centrally located within their void and away from the SDSS boundaries so the surrounding void is well contained within the redshift survey. All galaxies were selected purely on the grounds of their location within the geometrically determined outline of the voids in the SDSS galaxy distribution, with no bias for morphology, luminosity or color outside of the inherent SDSS redshift survey limitations. This is clear when observing the range of galaxy type in the SDSS color images as scaled to the same physical size (see Figure 20). The SDSS positions of all 60 galaxies are shown in Figure 1.
3. Observations
We observed a total of 55 of the 60 VGS galaxies at the WSRT between 2006-2010, with the instrumental parameters given in Table 1. We list the properties measured from the SDSS in Table 2. All targets were observed in maxi-short configuration, with shortest baselines of 36, 54, 72 and 90 meters to maximize surface brightness sensitivity and a longest baseline of 2754 meters to achieve angular resolutions of using an optimal u,v taper for the detection of low surface brightness emission. This corresponds to spatial scales of 8 kpc at 85 Mpc, the average distance for our sample. As the WSRT is an east-west array, we scheduled full 12 hour track observations to achieve complete UV coverage of each target, however a number of our observations were interrupted by priority target of opportunity observations. Some, but not all, of our incomplete observations were completed at later times. The final total integration time for all galaxies not detected in H i is at least 10.5 hours. The final total integration time for detected galaxies is at least 8 hours, with only VGS_18 having just 5 hours.
| Configuration | Maxi-short |
|---|---|
| Date | 2006-2010 |
| No. telescopes | 13 |
| Total bandwidth | 40 MHz |
| No. channels | 4 512 |
| Shortest spacing | 36 m |
| Longest spacing | 2754 m |
| FWHM primary beam | 36′ |
| Synthesized beam | 19 19′′/sin() |
| rms (robust = 1) | 0.4 mJy Beam-1 |
| velocity resolution | 8.6 km s-1 |
| Name | SDSS ID | ra | dec | Mr | ||||
|---|---|---|---|---|---|---|---|---|
| (J2000) | (J2000) | |||||||
| VGS_01 | J083707.48+323340.8 | 08 37 07.5 | +32 33 41 | 0.018531 | 17.17 | 0.49 | -17.4 | -0.77 |
| VGS_02 | J085453.60+181924.6 | 08 54 53.6 | +18 19 25 | 0.022558 | 17.39 | 0.40 | -17.6 | -0.83 |
| VGS_03 | J090500.99+183128.4 | 09 05 01.0 | +18 31 28 | 0.016868 | 17.51 | 0.46 | -16.9 | -0.80 |
| VGS_04 | J091355.47+244552.3 | 09 13 55.5 | +24 45 52 | 0.016228 | 16.55 | 0.53 | -17.8 | -0.75 |
| VGS_05 | J092252.91+513243.7 | 09 22 52.9 | +51 32 44 | 0.022437 | 15.03 | 0.76 | -19.9 | -0.93 |
| VGS_06 | J093602.69+515638.6 | 09 36 02.7 | +51 56 39 | 0.023032 | 17.40 | 0.31 | -17.6 | -0.85 |
| VGS_07 | J100642.44+511623.9 | 10 06 42.5 | +51 16 24 | 0.016261 | 17.30 | 0.06 | -16.9 | -0.84 |
| VGS_08 | J102235.27+453821.2 | 10 22 35.3 | +45 38 21 | 0.019613 | 17.72 | 0.33 | -16.9 | -0.82 |
| VGS_09 | J102250.68+561932.1 | 10 22 50.7 | +56 19 32 | 0.012995 | 17.52 | 0.26 | -16.2 | -0.78 |
| VGS_10 | J102316.63+091330.1 | 10 23 16.6 | +09 13 30 | 0.015781 | 16.86 | 0.34 | -17.4 | -0.84 |
| VGS_11 | J102351.86+095914.8 | 10 23 51.9 | +09 59 15 | 0.016486 | 16.05 | 0.51 | -18.3 | -0.61 |
| VGS_12 | J102819.23+623502.6 | 10 28 19.2 | +62 35 03 | 0.017804 | 17.41 | 0.26 | -17.0 | -0.74 |
| VGS_13 | J103152.68+315034.6 | 10 31 52.7 | +31 50 35 | 0.019126 | 16.35 | 0.48 | -18.3 | -0.71 |
| VGS_14 | J103506.46+550847.5 | 10 35 06.5 | +55 08 48 | 0.013154 | 16.72 | 0.28 | -17.1 | -0.81 |
| VGS_15 | J103913.14+310650.4 | 10 39 13.1 | +31 06 50 | 0.019071 | 15.40 | 0.56 | -19.2 | -0.76 |
| VGS_16 | J104807.05+430525.4 | 10 48 07.1 | +43 05 25 | 0.013308 | 17.57 | 0.28 | -16.2 | -0.88 |
| VGS_17 | J105042.23+315119.5 | 10 50 42.2 | +31 51 20 | 0.010695 | 16.95 | 0.18 | -16.4 | -0.77 |
| VGS_18 | J105352.26+214549.6 | 10 53 52.3 | +21 45 50 | 0.016383 | 17.47 | 0.39 | -16.8 | -0.78 |
| VGS_19 | J111029.61+134558.1 | 11 10 29.6 | +13 45 58 | 0.014467 | 16.52 | 0.39 | -17.5 | -0.52 |
| VGS_20 | J114124.92+415221.9 | 11 41 24.9 | +41 52 22 | 0.016630 | 18.04 | 0.17 | -16.3 | -0.92 |
| VGS_21 | J114303.00+404939.1 | 11 43 03.0 | +40 49 39 | 0.017344 | 15.02 | 0.83 | -19.4 | -0.87 |
| VGS_22 | J114535.20+270742.5 | 11 45 35.2 | +27 07 43 | 0.019162 | 17.57 | 0.37 | -17.1 | -0.44 |
| VGS_23 | J121716.54+124742.8 | 12 17 16.5 | +12 47 43 | 0.016688 | 15.24 | 0.41 | -19.1 | -0.82 |
| VGS_24 | J121754.98+583935.6 | 12 17 55.0 | +58 39 36 | 0.023207 | 14.90 | 0.55 | -20.1 | -0.80 |
| VGS_25 | J121908.24+372644.1 | 12 19 08.2 | +37 26 44 | 0.019014 | 17.64 | 0.26 | -17.0 | -0.86 |
| VGS_26 | J122032.40+604958.4 | 12 20 32.4 | +60 49 58 | 0.023186 | 16.38 | 0.46 | -18.7 | -0.84 |
| VGS_27 | J122123.12+393659.4 | 12 21 23.1 | +39 36 59 | 0.014941 | 17.77 | 0.35 | -16.3 | -0.71 |
| VGS_28 | J124420.87+082412.5 | 12 44 20.9 | +08 24 13 | 0.015286 | 17.61 | 0.69 | -16.5 | -0.82 |
| VGS_29 | J125119.35+480144.3 | 12 51 19.4 | +48 01 44 | 0.020022 | 16.28 | 0.36 | -18.4 | -0.65 |
| VGS_30 | J130526.08+544551.9 | 13 05 26.1 | +54 45 52 | 0.019435 | 18.05 | 0.22 | -16.6 | -0.89 |
| VGS_31 | J131606.19+413004.2 | 13 16 06.2 | +41 30 04 | 0.020903 | 14.75 | 0.32 | -20.1 | -0.64 |
| VGS_32 | J132232.48+544905.5 | 13 22 32.5 | +54 49 06 | 0.011835 | 14.17 | 0.53 | -19.4 | -0.80 |
| VGS_33 | J132505.06+430405.9 | 13 25 05.1 | +43 04 06 | 0.018236 | 17.61 | 0.45 | -16.9 | -0.82 |
| VGS_34 | J132718.56+593010.2 | 13 27 18.6 | +59 30 10 | 0.016539 | 15.22 | 0.87 | -19.1 | -0.81 |
| VGS_35 | J135113.62+453509.2 | 13 51 13.6 | +45 35 09 | 0.017299 | 16.36 | 0.41 | -18.0 | -0.70 |
| VGS_36 | J135535.46+593041.3 | 13 55 35.5 | +59 30 41 | 0.022398 | 16.46 | 0.36 | -18.5 | -0.75 |
| VGS_37 | J135836.29+292121.4 | 13 58 36.3 | +29 21 21 | 0.019354 | 17.06 | 0.35 | -17.6 | -0.87 |
| VGS_38 | J140034.49+551515.1 | 14 00 34.5 | +55 15 15 | 0.013820 | 16.95 | 0.35 | -16.9 | -0.64 |
| VGS_39 | J140328.54+324151.7 | 14 03 28.5 | +32 41 52 | 0.019037 | 15.25 | 0.81 | -19.4 | -0.74 |
| VGS_40 | J141326.46+503841.6 | 14 13 26.5 | +50 38 42 | 0.023717 | 16.90 | 0.50 | -18.2 | -0.89 |
| VGS_41 | J141916.95+472839.1 | 14 19 17.0 | +47 28 39 | 0.023371 | 17.21 | 0.43 | -17.8 | -0.92 |
| VGS_42 | J142416.41+523208.3 | 14 24 16.4 | +52 32 08 | 0.018762 | 15.88 | 0.61 | -18.7 | -0.68 |
| VGS_43 | J142540.61+443835.2 | 14 25 40.6 | +44 38 35 | 0.021455 | 17.85 | 0.36 | -17.0 | -0.86 |
| VGS_44 | J143052.33+551440.0 | 14 30 52.3 | +55 14 40 | 0.017656 | 14.92 | 0.46 | -19.5 | -0.89 |
| VGS_45 | J143553.77+524400.6 | 14 35 53.8 | +52 44 01 | 0.014553 | 17.33 | 0.26 | -16.7 | -0.62 |
| VGS_46 | J144338.46+322002.7 | 14 43 38.5 | +32 20 03 | 0.015915 | 16.80 | 0.35 | -17.4 | -0.63 |
| VGS_47 | J145314.59+462910.8 | 14 53 14.6 | +46 29 11 | 0.022155 | 14.56 | 0.75 | -20.4 | -0.89 |
| VGS_48 | J145450.57+305729.0 | 14 54 50.6 | +30 57 29 | 0.024966 | 17.13 | 0.64 | -18.1 | -0.88 |
| VGS_49 | J145659.94+313308.5 | 14 56 59.9 | +31 33 09 | 0.024920 | 15.51 | 0.41 | -19.7 | -0.85 |
| VGS_50 | J145909.32+324756.3 | 14 59 09.3 | +32 47 56 | 0.020358 | 15.35 | 0.72 | -19.4 | -0.85 |
| VGS_51 | J151211.61+243344.1 | 15 12 11.6 | +24 33 44 | 0.025307 | 17.02 | 0.23 | -18.3 | -0.93 |
| VGS_52 | J151410.95+064449.0 | 15 14 11.0 | +06 44 49 | 0.018018 | 17.61 | 0.27 | -16.9 | -0.90 |
| VGS_53 | J152523.40+291018.8 | 15 25 23.4 | +29 10 19 | 0.021473 | 15.65 | 0.54 | -19.2 | -0.79 |
| VGS_54 | J153035.83+264408.5 | 15 30 35.8 | +26 44 09 | 0.023895 | 16.28 | 0.70 | -18.9 | -0.68 |
| VGS_55 | J153132.44+343055.8 | 15 31 32.4 | +34 30 56 | 0.025146 | 16.27 | 0.46 | -19.0 | -0.94 |
| VGS_56 | J153341.47+280843.5 | 15 33 41.5 | +28 08 44 | 0.018715 | 15.79 | 0.74 | -18.8 | -0.82 |
| VGS_57 | J153821.22+331105.1 | 15 38 21.2 | +33 11 05 | 0.022171 | 14.59 | 0.53 | -20.4 | -0.69 |
| VGS_58 | J154452.18+362845.6 | 15 44 52.2 | +36 28 46 | 0.011522 | 15.70 | 0.35 | -17.8 | -0.88 |
| VGS_59 | J154615.07+332017.8 | 15 46 15.1 | +33 20 18 | 0.019028 | 17.81 | 0.39 | -16.8 | -0.67 |
| VGS_60 | J155721.55+254718.9 | 15 57 21.6 | +25 47 19 | 0.019646 | 15.85 | 0.81 | -19.0 | -0.78 |
Note. — Units of right ascension are hours, minutes, and seconds, and units of declination are degrees, arcminutes, and arcseconds. and are drawn from the apparent model magnitudes as measured by the SDSS DR7. Absolute magnitudes have been corrected for galactic extinction. gives the filtered density contrast at Rf = 1 h-1 Mpc.
Target observations were done with two polarizations and 512 channels of 19.5 kHz each, for a total bandwidth of 10 MHz. All data reductions were done using AIPS. The absolute flux scale was determined using Baars et al. (1977) and corrected to the observing frequency. Two of the flux calibrators 3C48, 3C286, 3C147 and CTD93 were observed with 15 minute snapshots, one before and one after the target observation, which were also used for phase and bandpass calibration. For the non-standard calibrator CTD93 a 20 cm flux of 4.83 Jy was assumed, as given in the VLA calibrator manual.
Continuum emission is subtracted in the UV plane using the emission free channels of each cube. Image cubes with a robust parameter of 1 were CLEANed down to 0.5 mJy beam-1 (1 ) based on a box around the emission region of each cube, and were Hanning smoothed to a typical velocity resolution of 8.6 km s-1. Zeroth and first moment maps were made using masking by a data cube Hanning and Gaussian smoothed to 25 km s-1 and 30′′, respectively, and 1.5 clipping. We reach typical column density sensitivities of 5 1019 cm-2.
Given the 36′ full width half maximum of the WSRT primary beam and the 10 MHz bandwidth, with each observation we probe a total volume covering 1.2 Mpc and 1,200 km s-1 at 85 Mpc, the average distance of our sample. Blind H i detections were identified using data cubes smoothed to 20 km s-1 and 30′′, increasing the 1 sensitivity to 0.25 mJy beam-1, and 5 clipping in forming a zeroth moment map. We consider only detections within 25′ of the beam center, which corresponds to a factor of five reduced sensitivity. Candidate objects were then confirmed by eye to be extended both spatially and in velocity, and those confirmed to be environmentally located within the void are included here as companion void galaxies (Table 3).
3.1. HI properties
H i parameters of these galaxies are calculated following the methods described in the pilot study (Kreckel et al., 2011c). H i properties for all target and companion galaxies are listed in Table 4. H i mass is calculated as M M☉, where d is distance in Mpc, S is flux density in Jy and is in km s-1. For targets at an average distance of 85 Mpc and assumed velocity width of 100 km s-1 the 3 upper limit on detections is M☉. We measure the 20% and 50% H i line width, W20 and W50, of each galaxy by constructing a global H i profile, summing the flux in each channel for a boxed area surrounding the galaxy. Errors of 15 km s-1 reflect uncertainties of one channel on either side.
| name | SDSS ID | ra | dec | Mr | d | v | ||||
|---|---|---|---|---|---|---|---|---|---|---|
| (J2000.0) | (J2000.0) | (′) | (kpc) | (km s-1) | ||||||
| VGS_07a | J100519.69+511038.3 | 10 05 19.7 | +51 10 38 | 20.12 | 0.03 | -14.1 | 14.2 | 288 | -21 | -0.84 |
| VGS_09a | J102241.41+561208.5 | 10 22 41.4 | +56 12 09 | 22.26 | 0.02 | -11.4 | 7.5 | 121 | -85 | -0.78 |
| VGS_10a | J102308.72+085847.1 | 10 23 08.7 | +08 58 47 | 16.31 | 0.31 | -17.9 | 14.8 | 292 | 20 | -0.84 |
| VGS_26a | J122105.48+610514.2 | 12 21 05.5 | +61 05 14 | 13.79 | 0.52 | -21.0 | 15.8 | 455 | -856 | -0.55 |
| VGS_30a | J130531.13+544553.8 | 13 05 31.1 | +54 45 54 | 18.39 | 0.29 | -16.2 | 0.7 | 17 | -74 | -0.89 |
| VGS_31a | J131614.69+412940.0 | 13 16 14.7 | +41 29 40 | 14.38 | 0.50 | -20.4 | 1.6 | 42 | -10 | -0.64 |
| VGS_31b | J131559.18+412955.9 | 13 15 59.2 | +41 29 56 | 16.78 | 0.21 | -18.0 | 1.3 | 34 | 50 | -0.64 |
| VGS_34a | J132640.92+593202.5 | 13 26 40.9 | +59 32 03 | 20.31 | 0.10 | -14.0 | 5.1 | 104 | 42 | -0.81 |
| VGS_36a | J135533.54+593110.7 | 13 55 33.5 | +59 31 11 | 19.10 | 0.14 | -15.8 | 0.6 | 17 | 0 | -0.75 |
| VGS_37a | J135836.06+292321.3 | 13 58 36.1 | +29 23 21 | 16.26 | 0.36 | -18.3 | 2.0 | 48 | -114 | -0.82 |
| VGS_38a | J140032.44+551445.9 | 14 00 32.4 | +55 14 46 | 17.59 | 0.15 | -16.1 | 0.6 | 9 | -21 | -0.64 |
| VGS_38b | J140025.68+551318.5 | 14 00 25.7 | +55 13 19 | 18.82 | 0.20 | -14.9 | 2.3 | 37 | 10 | -0.64 |
| VGS_39a | J140321.80+324530.3 | 14 03 21.8 | +32 45 30 | 19.48 | -0.04 | -15.2 | 3.9 | 92 | 73 | -0.74 |
| VGS_51a | J151230.45+243352.1 | 15 12 30.4 | +24 33 52 | 20.66 | 0.05 | -14.6 | 4.3 | 133 | 19 | -0.85 |
| VGS_53a | J152641.63+292359.8 | 15 26 41.6 | +29 24 00 | 16.78 | 0.24 | -18.1 | 21.9 | 586 | -26 | -0.79 |
| VGS_54a | J153035.99+264446.1 | 15 30 36.0 | +26 44 46 | 19.05 | 0.42 | -16.1 | 0.6 | 18 | -98 | -0.65 |
| VGS_56a | J153443.07+281309.6 | 15 34 43.1 | +28 13 10 | 18.91 | 0.29 | -15.7 | 14.3 | 333 | 47 | -0.83 |
| VGS_57a | J153836.08+331637.6 | 15 38 36.1 | +33 16 38 | 17.83 | 0.13 | -17.1 | 6.4 | 175 | -72 | -0.61 |
Note. — Units of right ascension are hours, minutes, and seconds, and units of declination are degrees, arcminutes, and arcseconds. and are drawn from the apparent model magnitudes as measured by the SDSS DR7. Absolute magnitudes have been corrected for galactic extinction. , d and v list the displacement from the beam center, projected sky separation, and velocity separation, respectively, between the target and companion galaxy. gives the filtered density contrast at Rf = 1 h-1 Mpc.
As in our pilot study, the majority of the targets are incompletely resolved by the WSRT, many extending no more than 2 or 3 times the H i beam. To estimate the radial extent of the H i we apply the iterative deconvolution method described by Lucy (1974), which sums the H i total intensity along the disk minor axis to create a one dimensional strip profile of the disk. This profile is then iteratively fit assuming an axisymmetric disk to recover the face-on H i radial surface density profile (see Figure 32). We measure the H i radius, r, as that position where the surface density falls below 1 M☉ pc-2, and quote an upper limit where we are resolution limited, with typical errors of 5 2 kpc.

Inclinations are calculated from SDSS -band isophotal radii under the assumption that galaxy disks are intrinsically oblate and axisymmetric with a three dimensional axis ratio of q (Geha et al., 2006), as
| (1) |
Adopting a value of q changes the resulting inclinations by less than 10%. Position angles are determined by considering both the -band optical and H i kinematic major axes. In cases where they disagree significantly (VGS_12) we choose the orientation of the H i disk.
3.2. SDSS optical parameters
As part of the SDSS survey, optical spectra were obtained for each galaxy using a 3′′ fiber, which in addition to being used to determine redshift, may be used to estimate other stellar properties. We use the publicly available MPA-JHU catalog for SDSS DR7 222http://www.mpa-garching.mpg.de/SDSS/DR7/ to obtain estimates of the star formation rate (SFR) and stellar mass in all void and control galaxies (Table 5). Star formation rates are calculated from the emission line features and aperture corrected to estimate the total SFR for the galaxy, using the method developed by Brinchmann et al. (2004). Stellar masses are obtained using fits to the ugriz photometry following the philosophy of Kauffmann et al. (2003c) and Salim et al. (2007), and correcting for the contribution by emission lines to the broadband magnitudes using the fiber spectra. Errors in the SFR are relatively large, roughly a factor of two. Errors on the stellar mass estimate are typically 0.1 dex, with significantly larger scatter for the lowest (M M☉) stellar masses.
| Name | t | D | r90 | r | i | P.A. | Mdyn | M/Lr | ||||
|---|---|---|---|---|---|---|---|---|---|---|---|---|
| (hr) | ( M☉) | (km s-1) | (Mpc) | (kpc) | (kpc) | (km s-1) | (km s-1) | (∘) | (∘) | ( M☉) | M☉/L☉ | |
| VGS_01 | 12.0 | 2.1 | - | - | 2.4 | - | - | - | 60 | - | - | - |
| VGS_02 | 12.0 | 6.49 1.85 | 6637 | 95 | 3.4 | 7.6 | 111 | 136 | 47 | 80 | 1.00 | 0.80 |
| VGS_03 | 12.0 | 1.85 | - | - | 1.8 | - | - | - | 55 | - | - | - |
| VGS_04 | 12.0 | 1.71 | - | - | 1.5 | - | - | - | 46 | - | - | - |
| VGS_05 | 12.0 | 3.27 | - | - | 6.1 | - | - | - | 37 | - | - | - |
| VGS_06 | 12.0 | 15.63 2.52 | 6883 | 98 | 3.9 | 12.9 | 180 | 187 | 71 | 282 | 2.71 | 1.90 |
| VGS_07 | 12.0 | 8.6 0.8 | 4901 | 70 | 2.6 | 9.2 | 119 | 144 | 50 | 270 | 1.28 | 1.9 |
| VGS_07a | 12.0 | 3.23 0.65 | 4880 | 69 | 3.5 | - | 41 | 49 | - | - | - | 9.7 |
| VGS_08 | 12.0 | 3.95 1.51 | 5853 | 84 | 4.4 | 5.7 | 84 | 126 | 51 | 12 | 0.39 | 0.89 |
| VGS_09 | 12.0 | 10.3 1.0 | 3881 | 55 | 3.1 | 9.1 | 110 | 126 | 68 | 105 | 0.74 | 4.4 |
| VGS_09a | 12.0 | 0.57 0.14 | 3796 | 54 | 1.5 | - | 41 | 49 | - | - | - | 20.2 |
| VGS_10 | 12.0 | 15.01 2.00 | 4737 | 68 | 5.4 | 10.2 | 152 | 176 | 87 | 310 | 1.36 | 2.21 |
| VGS_10a | 12.0 | 16.73 1.91 | 6637 | 95 | 6.5 | - | 177 | 193 | - | - | - | 1.5 |
| VGS_11 | 12.0 | 21.73 2.11 | 4907 | 70 | 4.2 | 17.0 | 75 | 100 | 18 | 5 | 6.16 | 1.38 |
| VGS_12 | 12.0 | 29.9 4.2 | 5316 | 76 | 2.4 | 18.0 | 154 | 179 | 29 | 5 | 10.55 | 6.2 |
| VGS_13 | 12.0 | 12.35 2.45 | 5691 | 81 | 3.5 | 12.8 | 213 | 229 | 68 | 275 | 3.89 | 0.82 |
| VGS_14 | 12.0 | 6.4 1.0 | 3933 | 56 | 3.3 | 8.7 | 110 | 134 | 67 | 40 | 0.72 | 1.3 |
| VGS_15 | 0.0 | - | - | - | 7.6 | - | - | - | 53 | - | - | - |
| VGS_16 | 12.0 | 1.16 | - | - | 1.7 | - | - | - | 60 | - | - | - |
| VGS_17 | 0.0 | - | - | - | 3.4 | - | - | - | 79 | - | - | - |
| VGS_18 | 5.0 | 3.91 1.17 | 4850 | 69 | 3.5 | 7.1 | 118 | 134 | 82 | 312 | 0.58 | 0.99 |
| VGS_19 | 12.0 | 3.16 0.76 | 4318 | 62 | 1.7 | 1.5 | 32 | 125 | 60 | 230 | 0.01 | 0.43 |
| VGS_20 | 0.0 | - | - | - | 1.1 | - | - | - | 43 | - | - | - |
| VGS_21 | 8.0 | 21.45 3.58 | 5171 | 74 | 8.8 | 15.8 | 314 | 330 | 79 | 288 | 9.38 | 0.51 |
| VGS_22 | 12.0 | 2.62 | - | - | 1.6 | - | - | - | 63 | - | - | - |
| VGS_23 | 8.5 | 38.52 4.57 | 4990 | 71 | 4.5 | 16.9 | 203 | 236 | 49 | 75 | 7.11 | 1.16 |
| VGS_24 | 12.0 | 3.35 | - | - | 4.6 | - | - | - | 35 | - | - | - |
| VGS_25 | 12.0 | 1.69 0.64 | 5680 | 81 | 2.3 | 2.0 | 135 | 135 | 43 | 325 | 0.46 | 0.37 |
| VGS_26 | 10.5 | 14.90 3.23 | 6942 | 99 | 5.8 | 12.5 | 206 | 231 | 69 | 75 | 3.55 | 0.69 |
| VGS_26a | 10.5 | 100.25 18.28 | 4907 | 70 | 6.8 | - | 171 | 257 | - | - | - | 0.6 |
| VGS_27 | 12.0 | 3.32 0.75 | 4421 | 63 | 1.7 | 3.7 | 41 | 91 | 55 | 55 | 0.05 | 1.31 |
| VGS_28 | 12.0 | 1.67 | - | - | 4.2 | - | - | - | 54 | - | - | - |
| VGS_29 | 0.0 | - | - | - | 3.8 | - | - | - | 65 | - | - | - |
| VGS_30 | 12.0 | 5.5 1.0 | 5666 | 81 | 3.7 | 7.5 | 50 | 93 | 77 | 180 | 0.12 | 1.7 |
| VGS_30a | 12.0 | 4.52 0.79 | 5592 | 79 | 2.1 | - | 24 | 41 | - | - | - | 2.1 |
| VGS_31 | 12.0 | 19.89 2.90 | 6247 | 89 | 4.0 | 10.4 | 153 | 178 | 52 | 155 | 2.31 | 0.25 |
| VGS_31a | 12.0 | 14.63 1.97 | 5691 | 81 | 6.5 | - | 196 | 298 | - | - | - | 0.1 |
| VGS_31b | 12.0 | 1.66 0.95 | 4850 | 69 | 2.1 | - | 110 | 170 | - | - | - | 0.1 |
| VGS_32 | 12.0 | 38.0 4.5 | 3522 | 50 | 4.1 | 19.0 | 171 | 187 | 46 | 310 | 6.29 | 0.9 |
| VGS_33 | 12.0 | 8.39 1.81 | 5443 | 78 | 2.0 | 8.3 | 110 | 117 | 60 | 285 | 0.77 | 1.97 |
| VGS_34 | 12.0 | 23.9 2.9 | 4917 | 70 | 3.6 | 10.2 | 231 | 299 | 50 | 280 | 5.34 | 0.7 |
| VGS_34a | 12.0 | 0.50 0.16 | 4959 | 70 | 1.1 | - | 33 | 58 | - | - | - | 1.7 |
| VGS_35 | 12.0 | 10.7 1.3 | 5191 | 74 | 3.0 | 10.8 | 145 | 187 | 65 | 340 | 1.61 | 0.9 |
| VGS_36 | 12.0 | 19.8 2.7 | 6684 | 95 | 5.0 | 13.0 | 190 | 224 | 79 | 190 | 2.82 | 1.1 |
| VGS_36a | 12.0 | - | 6684 | 95 | 1.6 | - | - | - | - | - | - | - |
| VGS_37 | 12.0 | 13.46 1.89 | 5787 | 83 | 5.6 | 12.8 | 153 | 186 | 67 | 195 | 2.05 | 1.70 |
| VGS_37a | 12.0 | 8.57 1.67 | 4318 | 62 | 3.1 | - | 50 | 92 | - | - | - | 0.5 |
| VGS_38 | 12.0 | 9.1 0.7 | 3853 | 55 | 2.8 | 6.9 | 50 | 92 | 39 | 130 | 0.26 | 2.0 |
| VGS_38a | 12.0 | 0.86 0.14 | 3832 | 54 | 1.3 | - | 67 | 75 | - | - | - | 0.4 |
| VGS_38b | 12.0 | 1.39 0.22 | 3863 | 55 | 1.4 | - | 41 | 66 | - | - | - | 2.0 |
| VGS_39 | 11.0 | 2.59 | - | - | 3.7 | - | - | - | 66 | - | - | - |
| VGS_39a | 11.0 | 2.56 0.39 | 5171 | 74 | 1.1 | - | 16 | 32 | - | - | - | 3.0 |
| VGS_40 | 12.0 | 6.00 1.40 | 7091 | 101 | 2.8 | 4.2 | 206 | 231 | 42 | 77 | 2.32 | 0.43 |
| VGS_41 | 10.5 | 2.86 | - | - | 1.8 | - | - | - | 29 | - | - | - |
| VGS_42 | 12.0 | 4.0 1.5 | 5601 | 80 | 3.5 | 8.1 | 128 | 171 | 58 | 310 | 1.08 | 0.2 |
| VGS_43 | 14.0 | 2.87 | - | - | 2.0 | - | - | - | 30 | - | - | - |
| VGS_44 | 12.0 | 4.9 1.1 | 5295 | 76 | 3.6 | 7.0 | 76 | 110 | 31 | 145 | 0.90 | 0.1 |
| VGS_45 | 12.0 | 3.5 1.3 | 4316 | 62 | 4.0 | 6.9 | 68 | 102 | 66 | 320 | 0.22 | 1.0 |
| VGS_46 | 12.0 | 5.55 1.66 | 4751 | 68 | 2.9 | 4.9 | 186 | 202 | 71 | 260 | 1.10 | 0.80 |
| VGS_47 | 12.0 | 13.02 2.71 | 6630 | 95 | 8.0 | 12.4 | 317 | 325 | 72 | 340 | 7.97 | 0.12 |
| VGS_48 | 0.0 | - | - | - | 3.6 | - | - | - | 68 | - | - | - |
| VGS_49 | 12.0 | 3.60 | - | - | 3.9 | - | - | - | 40 | - | - | - |
| VGS_50 | 12.0 | 55.27 7.30 | 6129 | 88 | 3.2 | 16.1 | 287 | 330 | 83 | 349 | 7.85 | 1.29 |
| VGS_51 | 12.0 | 19.01 2.46 | 7476 | 107 | 4.3 | 10.1 | 172 | 206 | 63 | 285 | 2.18 | 1.27 |
| VGS_51a | 12.0 | 1.00 0.21 | 4990 | 71 | 1.4 | - | 68 | 68 | - | - | - | 2.0 |
| VGS_52 | 12.0 | 9.00 2.25 | 5426 | 78 | 3.8 | 10.0 | 118 | 117 | 70 | 275 | 0.92 | 2.07 |
| VGS_53 | 13.0 | 5.19 1.66 | 6450 | 92 | 5.4 | 2.2 | 162 | 178 | 64 | 155 | 0.42 | 0.14 |
| VGS_53a | 13.0 | 4.38 2.16 | 6942 | 99 | 6.2 | - | 119 | 119 | - | - | - | 0.3 |
| VGS_54 | 9.0 | 33.18 4.00 | 7028 | 100 | 6.7 | 16.5 | 240 | 265 | 80 | 38 | 5.72 | 1.21 |
| VGS_54a | 9.0 | - | 4421 | 63 | 3.0 | - | - | - | - | - | - | - |
| VGS_55 | 8.5 | 17.33 3.56 | 7485 | 107 | 5.7 | 13.2 | 154 | 197 | 55 | 145 | 2.71 | 0.60 |
| VGS_56 | 12.0 | 2.67 | - | - | 3.3 | - | - | - | 59 | - | - | - |
| VGS_56a | 12.0 | 2.15 0.66 | 6247 | 89 | 2.1 | - | 101 | 109 | - | - | - | 1.5 |
| VGS_57 | 13.0 | 6.37 1.48 | 6630 | 95 | 5.7 | 9.0 | 119 | 187 | 30 | 330 | 3.01 | 0.06 |
| VGS_57a | 13.0 | 1.72 0.49 | 5443 | 78 | 1.9 | - | 59 | 101 | - | - | - | 0.3 |
| VGS_58 | 12.0 | 7.0 0.6 | 3351 | 48 | 2.6 | 7.4 | 143 | 151 | 38 | 280 | 2.39 | 0.7 |
| VGS_59 | 12.0 | 2.59 | - | - | 3.1 | - | - | - | 67 | - | - | - |
| VGS_60 | 12.0 | 2.51 1.61 | 5890 | 84 | 4.9 | 5.7 | 273 | 281 | 81 | 106 | 2.53 | 0.09 |
Note. — Non-detections list the 3 upper limit on the H i mass. t lists the total integration time for each object. is the systemic H i velocity, using the optical definition. D is the distance to the target galaxy. r90 and r list the optical and H i radius, respectively. When possible, poorly resolved systems list the upper limit for r and . and are the 50% and 20% H i line widths, respectively, corrected for instrumental broadening. The inclination, , is calculated such that 90∘ is edge-on.
| Name | SFRHα | SFR | SFRHα/ | |
|---|---|---|---|---|
| () | ( yr-1) | ( yr-1) | ( yr-1) | |
| VGS_01 | 4.5 | 0.08 | 15.3 | - |
| VGS_02 | 4.5 | 0.08 | 16.2 | 13.1 |
| VGS_03 | 2.4 | 0.04 | 15.3 | - |
| VGS_04 | 7.4 | 0.14 | 17.0 | - |
| VGS_05 | 129.1 | 0.03 | 0.2 | - |
| VGS_06 | 2.6 | 0.17 | 55.4 | 10.7 |
| VGS_07 | 0.5 | 0.18 | 278.1 | 20.5 |
| VGS_08 | 1.9 | 0.06 | 24.8 | 14.1 |
| VGS_09 | 0.7 | 0.04 | 48.9 | 3.9 |
| VGS_10 | 2.2 | 0.09 | 36.7 | 6.1 |
| VGS_11 | 11.5 | 0.14 | 10.9 | 6.4 |
| VGS_12 | 1.6 | 0.08 | 42.6 | 2.6 |
| VGS_13 | 10.6 | 0.11 | 9.4 | 9.2 |
| VGS_14 | 1.6 | 0.07 | 40.1 | 11.3 |
| VGS_15 | 26.0 | 0.04 | 1.4 | - |
| VGS_16 | 0.9 | 0.03 | 32.6 | - |
| VGS_17 | 0.2 | 0.08 | 277.6 | - |
| VGS_18 | 2.1 | 0.04 | 15.1 | 9.3 |
| VGS_19 | 3.7 | 0.12 | 28.1 | 36.9 |
| VGS_20 | 0.5 | 0.07 | 139.8 | - |
| VGS_21 | 93.6 | 0.11 | 1.0 | 4.9 |
| VGS_22 | 1.9 | 0.04 | 19.8 | - |
| VGS_23 | 19.3 | 0.44 | 19.9 | 11.3 |
| VGS_24 | - | - | - | - |
| VGS_25 | 1.4 | 0.10 | 61.1 | 56.5 |
| VGS_26 | 19.9 | 0.34 | 15.6 | 22.7 |
| VGS_27 | 1.0 | 0.03 | 26.3 | 8.7 |
| VGS_28 | - | - | - | - |
| VGS_29 | 8.1 | 0.21 | 22.1 | - |
| VGS_30 | 1.0 | 0.06 | 48.0 | 10.0 |
| VGS_31 | 35.1 | 1.42 | 35.6 | 71.5 |
| VGS_32 | 27.9 | 0.26 | 8.2 | 6.9 |
| VGS_33 | 1.7 | 0.02 | 10.8 | 2.7 |
| VGS_34 | 75.4 | 0.87 | 10.9 | 36.4 |
| VGS_35 | 6.6 | 0.11 | 13.8 | 10.0 |
| VGS_36 | 8.9 | 0.26 | 26.2 | 13.3 |
| VGS_37 | 4.1 | 0.11 | 24.1 | 8.3 |
| VGS_38 | 0.7 | 0.07 | 88.2 | 7.8 |
| VGS_39 | 102.3 | 0.20 | 1.8 | - |
| VGS_40 | 11.6 | 0.20 | 15.1 | 32.9 |
| VGS_41 | 6.1 | 0.10 | 15.0 | - |
| VGS_42 | 25.3 | 0.16 | 5.7 | 40.8 |
| VGS_43 | 1.9 | 0.05 | 21.7 | - |
| VGS_44 | 32.5 | 0.79 | 21.9 | 161.5 |
| VGS_45 | 1.1 | 0.05 | 39.3 | 13.1 |
| VGS_46 | 3.3 | 0.09 | 24.3 | 16.5 |
| VGS_47 | 213.4 | 0.59 | 2.5 | 45.5 |
| VGS_48 | 19.4 | 0.12 | 5.3 | - |
| VGS_49 | 33.1 | 0.76 | 19.8 | - |
| VGS_50 | 83.5 | 0.36 | 4.0 | 6.5 |
| VGS_51 | 3.6 | 0.27 | 65.7 | 14.0 |
| VGS_52 | 1.3 | 0.06 | 37.5 | 6.3 |
| VGS_53 | 32.0 | 0.27 | 7.6 | 52.7 |
| VGS_54 | 42.5 | 0.18 | 3.8 | 5.6 |
| VGS_55 | 15.7 | 0.17 | 9.2 | 9.6 |
| VGS_56 | 49.0 | 0.27 | 4.9 | - |
| VGS_57 | 113.5 | 1.73 | 13.3 | 271.7 |
| VGS_58 | 3.9 | 0.11 | 25.1 | 16.1 |
| VGS_59 | 1.8 | 0.05 | 22.4 | - |
| VGS_60 | 56.5 | 0.13 | 2.0 | 51.0 |
4. Results
Despite differing void finding methods, there is general agreement that void galaxies are usually faint, late type, blue disk galaxies, but the details of their properties at fixed luminosity and morphological type are less clear, and may depend on an accurate identification of the void galaxy population (Grogin & Geller, 1999, 2000; Rojas et al., 2004, 2005; Patiri et al., 2006; Park et al., 2007; von Benda-Beckmann & Müller, 2008). From our sample of 60 void galaxies, 55 were observed in H i and 14 were not detected. Measurements of the first 15 galaxies are discussed as a pilot study to this project by Kreckel et al. (2011c), and are included again here for completeness. The VGS includes a range of luminosities, from -16.2 Mr -20.4, corresponding to a stellar mass range of M☉ to M☉. We measure H i masses ranging from M☉ to M☉. Distributions for the absolute magnitude, stellar mass and H i masses are shown in Figure 2. Along with the selected galaxy sample, we have detected by their H i emission 18 other void galaxies within 800 km s-1 and 25′ of the VGS targets (Table 3). As these are H i selected they probe to fainter luminosities, as faint as M, with H i masses as low as M☉.
We find that our sample consists almost exclusively of gas-rich blue disk galaxies. Though many of our targets suffer from an H i spatial resolution that is limited to a few beams per galaxy, combined with the kinematic information we judge that about half have strongly irregular or disturbed H i morphologies and kinematics. In the following sections we compare the VGS H i observations at the WSRT with two catalogs of resolved H i observations in the literature. The first is drawn from the Westerbork observations of neutral Hydrogen in Irregular and SPiral galaxies (WHISP), which presents an atlas of the H i morphology and kinematics for a large number of galaxies. This sample is biased towards gas rich targets but unconstrained environmentally. We use the atlas of 73 galaxies presented in Swaters et al. (2002). In addition, we also compare with an atlas of 43 spiral galaxies in the Ursa Major cluster, also observed with the WSRT (Verheijen & Sancisi, 2001). This sample is located within a poor cluster of galaxies, and extends to higher luminosities than Swaters et al. (2002). These two atlases together encompass a large range of galaxy H i morphologies and kinematics, all observed with the same radio interferometer as the VGS.
4.1. Optical color and morphology
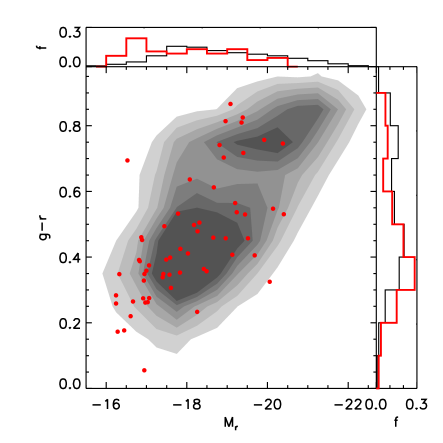
Though we have selected the VGS purely on the basis of their location within the geometrically reconstructed density field, it spans a range of luminosities and colors. In Figure 3 we compare the color-magnitude distribution with a magnitude limited (, m) sample of SDSS galaxies. Our void galaxies exhibit a wide range of colors, however there are significantly fewer red galaxies and more blue galaxies in the void. Our sample of void galaxies is also shifted towards fainter galaxies, with no galaxies brighter than M. This matches the generally observed shift in the luminosity function found in underdense regions and predictions from CDM cosmology (Hoyle et al., 2005; Aragón-Calvo, 2007; Kreckel et al., 2011a). None of the VGS galaxies have a stellar masses above 3 M☉, the observationally identified transition mass below which galaxies are typically younger, and still in the process of assembling (Kauffmann et al., 2003b).
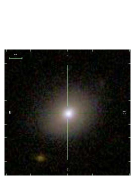
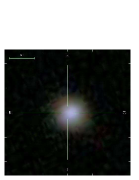
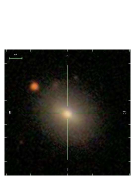
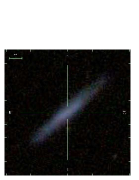
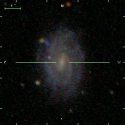
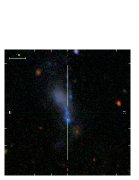
The VGS spans a range of stellar morphologies, however the distance to this sample makes morphological subtypes difficult to distinguish by eye, and we find that it is also very difficult to constrain with simple parameterization. In considering whether any of the VGS are elliptical galaxies, we note that most of the red galaxies with appear to be edge-on disks or bulge-dominated systems. Classification by the galaxy concentration index, defined as the ratio of the Petrosian radius containing 90% of the light to that containing 50% (r90/r50), is also not perfect, as half of those with a high concentration index appear to be bulge dominated disk galaxies. Judging the SDSS images by eye (see Figure 20), only three might be classified as early type galaxies. VGS_24 and VGS_41 have very smooth stellar distributions but are blue, while VGS_05 is red but appears to have a bar and may be an SB0 galaxy. All three are not detected in H i. We show these three, as well as examples of bulge free (VGS_10), spiral (VGS_15) and irregular (VGS_17) galaxies in Figure 4.
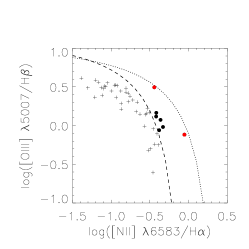
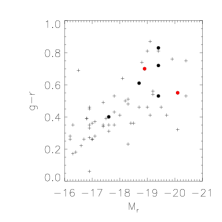
None of the VGS sample shows strong evidence of AGN activity. We detected 1.4 GHz radio continuum emission in 15 VGS galaxies at above 1 mJy, which corresponds to luminosities of less than W Hz-1, consistent with star formation (Smolčić et al., 2008). This can also be constrained optically following a line index classification scheme using the NII 6583, OIII 5007, H and H emission features (Baldwin et al., 1981) measured in the SDSS spectra (Figure 5, left). Using only targets where the signal to noise ratio is greater than three, our galaxies are not classified as AGNs according to the demarcation determined by Kewley et al. (2001). The less strict demarcation determined by Kauffmann et al. (2003a) allows seven of our targets as possible AGNs, two of which (VGS_24 and VGS_54) do fall significantly away from the region containing star-forming galaxies. These seven AGN candidates are among the brighter and redder galaxies in our sample (Figure 5, right). VGS_24 is one of three elliptical galaxies in this sample, and none of these or the AGN candidates have strong radio continuum emission at 1.4 GHz.
4.2. Size
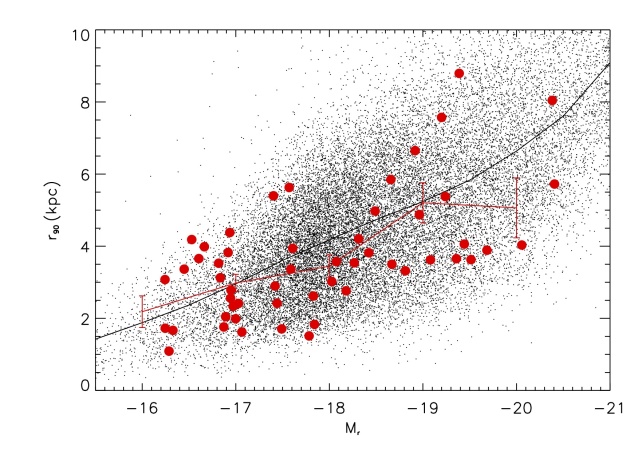
In our pilot study we reported systematically smaller stellar disks in the galaxies compared with a volume limited sample of SDSS galaxies, however this systematic effect appears to be due largely to small number statistics within the original sample of 15 galaxies. Figure 6 shows a preference for smaller stellar disks in late type VGS galaxies as compared to a magnitude limited sample of late type SDSS galaxies (, m). Here we define late type galaxies as those having a light concentration where (Shen et al., 2003). One complication for assessing whether the VGS galaxies are smaller is the relatively large error in the mean. We will consider this question in more detail in an upcoming paper employing deeper optical images.
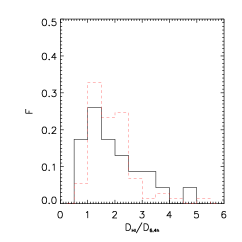
The most robust measure of optical galaxy size available from the SDSS pipeline, r90, differs significantly from the Holmberg, D25 or exponential disk scale length measures that are typically available in the literature for H i galaxy samples. Using D/D90, the VGS spans a reasonable range (Figure 7, left), with the H i disks two to three times more extended than the stellar disks. The SDSS pipeline provides an estimate of the exponential disk scale length, which we find in good agreement with the WHISP sample (Figure 7, right). By this measure, some of the H i disks are comparable or smaller than the stellar disk, however in these cases the galaxies are edge-on disks and we suspect the SDSS pipeline is unable to accurately recover these scale lengths.

4.3. HI non-detections
We detect 41 of the 55 galaxies observed at the WSRT in H i, a 75% detection rate. There is no clear correlation with distance (Figure 8a) as might be expected if H i sensitivity was limiting, or with declination (Figure 8b), which can cause extremely elliptical beam shapes for east-west arrays like the WSRT. In general, we find no significant correlations in the non-detections (Figure 8). As already mentioned, color and concentration index () are not infallible indicators of optical morphology, which might be expected to correlate with the non-detections. There is a slight correlation with color though the errors are large due to the small sample size. Dividing the sample by color at , 77 13% of blue galaxies were detected while only 64 24% of red galaxies were detected. We do note that the only 3 galaxies that look morphologically like elliptical or S0 galaxies are not detected in H i.
Six of the non-detections (VGS_04, VGS_22, VGS_16, VGS_03, VGS_41, VGS_43) have very similar optical morphologies, with particularly small stellar components ( kpc) and blue, disk-like morphologies. All are fainter, with , and presumably have an H i content that is slightly below the detection limits. To test this we scaled the intensity of emission in each cube to a common distance and, assuming the spatial and velocity resolution remains roughly equivalent between targets, stacked the emission for these non-detected targets. This increased the sensitivity to 0.24 mJy per beam and resulted in a (1.2 0.3) M☉ detection, just below the detection limits for the galaxies individually. Stacking limits from combining the other eight non-detections are considerably lower and not statistically significant, (4.9 1.7) M☉. However, we note that the upper limits for the H i content in the non-detected galaxies in general are not inconsistent with the expected H i content based on the galaxy luminosities (see Section 4.5).


4.4. HI morphology and kinematics
H i imaging of the VGS reveals it to contain a diverse collection of H i rich galaxies, with about half showing signs of strongly disturbed gas morphology or kinematics. Five are clearly interacting with companions, four have some gas that does not follow the regular disk rotation, five are asymmetric at the 3 H i contours, six have a lopsided H i distribution, eight are kinematically lopsided, and three have warps (see Figure 31, for the complete atlas). Similar visual inspection of the WHISP galaxies in Swaters et al. (2002) reveal that nearly all their targets have irregularities in the gas morphology or kinematics with similar frequency. This is also found in studies of integrated H i galaxy profiles (Richter & Sancisi, 1994). The Ursa Major cluster galaxies reside in a very different environment and appear significantly more regular, with only about a quarter having strong irregularities in the gas, however as they are larger they may also be affected by deeper gravitational potentials. Both the WHISP and Ursa Major cluster galaxies have a significant number of H i rings, which we would be unable to resolve for the majority of the VGS galaxies.
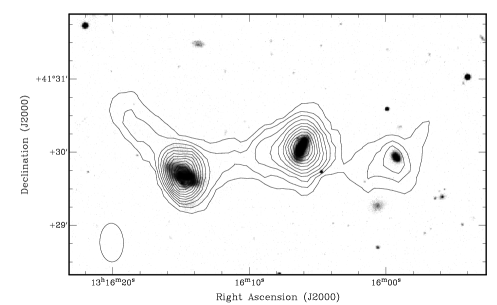
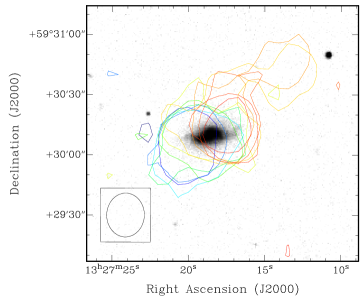
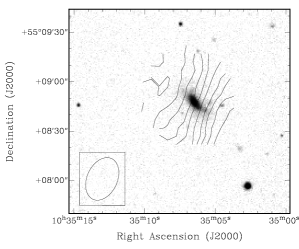
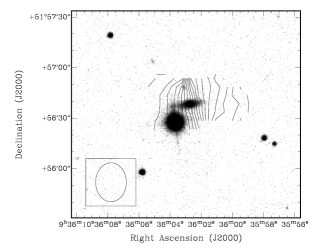
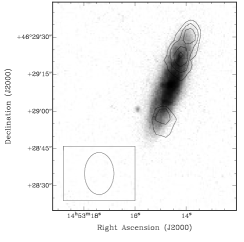
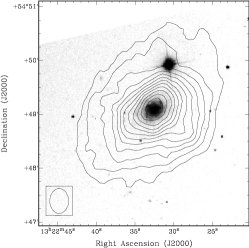
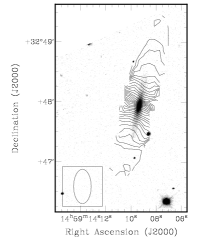
Some of the VGS galaxies are particularly striking. Figure 9 shows two examples of galaxies with kinematically irregular gas located outside the disk with no clear optical counterpart. VGS_34 has an H i disk with regular rotation that is centered on the optical galaxy, however in addition it has low column density gas to the north-west that persists over multiple channels in velocity. This gas is inconsistent with the disk rotation and has no clear optical counterpart, however the optical morphology is quite disturbed, suggesting a recent interaction. It also has a small companion galaxy about 100 kpc away at a nearly coincident velocity. VGS_31 is one of two VGS galaxies discovered to have two nearby companions, and in both cases the three galaxies are linearly aligned and joined within a low column density common envelope of H i. Figure 10 shows three more examples of gas disks that are morphologically or kinematically lopsided. VGS_14 is kinematically lopsided, exhibiting a shallower velocity gradient to the north-east side. VGS_06 is warped in the outer extent, and VGS_47 is very lopsided in the distribution of H i across the disk. We also show for completeness in Figure 11 examples of galaxies that are fairly regular in the H I morphology (VGS_32) and kinematics (VGS_50).
The high fraction of strongly irregular H i disks is surprising if we consider void galaxies as evolving in relative isolation, where galaxies are observed to have a smaller fraction of asymmetric H i profiles (Espada et al., 2011). However void galaxies are not by definition isolated. Szomoru et al. (1996) found that on small scales ( 1 Mpc) the number of neighboring galaxies detected around targeted galaxies in the Boötes void is similar to that in average environments, a result supported by the VGS sample (see Section 5.4). The strong H i irregularities present clear evidence of ongoing interactions and gas accretion, and is fairly typical for gas rich galaxies.
4.5. HI content
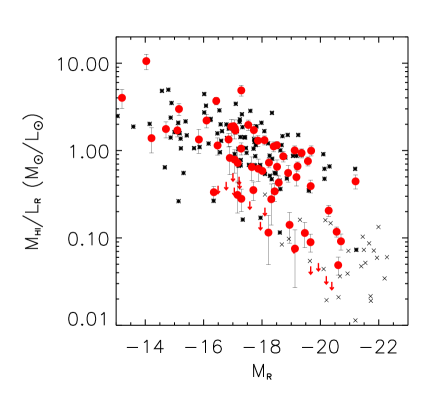
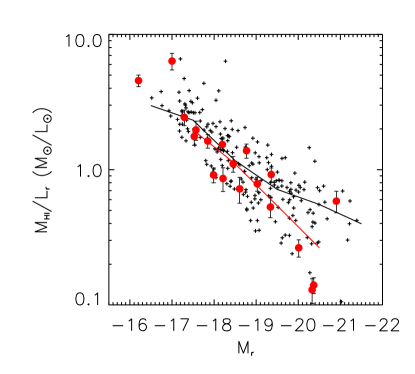
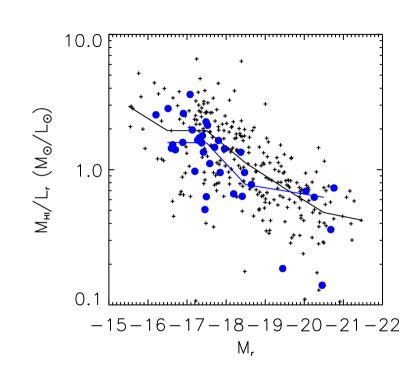
The VGS reproduces the trend for fainter galaxies to be relatively more gas rich than brighter galaxies, as is generally observed in disk galaxies. In Figure 12 we compare the H i mass to light ratio of the void and companion galaxies with H i imaged galaxies in the WHISP sample (Swaters et al., 2002) and the Ursa Major cluster (Verheijen & Sancisi, 2001). Here we have converted the SDSS bands to Johnson-Cousins -band magnitudes following the prescription of Jester et al. (2005). The VGS generally agrees with the two samples within the errors, with the upper limits for the non-detections also falling within the range observed. All three samples achieve similar H i column density sensitivities, though our sample is at significantly larger distances.
Only one galaxy, VGS_12, appears to have an unusually large H i mass to light ratio of 6.2 given its absolute magnitude Mr = -17, and from the misalignment of its H i disk it is clear that the evolution of this system is progressing in an unusual fashion (see also Section 5.1). We observe no systematic increase in the H i mass to light ratio for the VGS, somewhat in contrast to previous observations and predictions from cosmological simulations. Kreckel et al. (2011a) report that simulated galaxies in the most underdense regions have slightly higher H i mass to light ratios at fixed luminosity. An increased H i mass to light ratio has also been reported in observational H i studies of dwarf galaxies in voids (Huchtmeier et al., 1997), and a small sample of void galaxies selected from the Second Byurakan and Case surveys (Pustilnik et al., 2002). The significantly larger sample size in this study allows more robust comparison with ‘average’ galaxies, and provides no evidence for an increased H i mass to light ratio.
4.6. Star formation
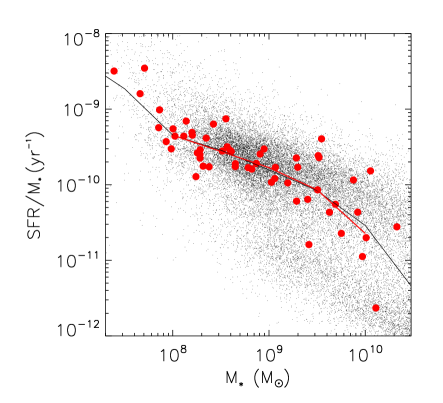
None of the VGS galaxies have SFRs that would suggest they are undergoing a starburst, the highest having 2 M☉ yr-1 but the majority falling below 1 M☉ yr-1. As the SFR is typically lower for smaller galaxies, it is useful to normalize the SFR by the stellar mass and consider the specific star formation rate (SSFR) for these systems. The SSFR has been found to be enhanced in void galaxies at fixed luminosity (Rojas et al., 2005; von Benda-Beckmann & Müller, 2008), which suggests that as a population they are still in the process of building their stellar disks. However, as this is generally the case for smaller galaxies (Kauffmann et al., 2003b), it is not clear if these results hold at fixed luminosity and morphological type (Park et al., 2007). Comparing the VGS with a magnitude limited (, m) sample of SDSS galaxies we find no trend for higher SSFR as a function of galaxy stellar mass (Figure 13). This discrepancy with past results may come from the different range of luminosities probed, as our sample consists of relatively faint void galaxies (Figure 2), whereas the most significant effect on SSFR is identified in void galaxies brighter than M (Rojas et al., 2005; von Benda-Beckmann & Müller, 2008).
Recently the star formation efficiency (SFE), measured as the star formation rate normalized by the H i mass, has been considered as a way to judge the general effectiveness of turning gas into stars. The GALEX Arecibo SDSS Survey (GASS) compares the SFE for a large sample of galaxies with stellar masses above M☉, and finds it stays relatively constant at log10(SFE) -9.5 when considered as a function of parameters such as stellar mass, color, and morphology (Schiminovich et al., 2010). Only four galaxies in the VGS have stellar masses within this range, two of which are detected and have log10(SFE) of -8.6 and -9.1, higher than the average and suggestive that void galaxies are somewhat more efficient in their star formation. Two are not detected in H i, with lower limits on the log10(SFE) of -10 and -9.1. We continue our investigation into the efficiency of star formation in void galaxies with lower stellar masses in Section 5.2.
5. Discussion
Given the observed H i and optical properties of the VGS, we consider what role the large scale environment might play in the evolution of these systems and the implications for cosmology.
5.1. Evidence for ongoing gas accretion
The strong disturbances we observe in the H i morphologies and kinematics (see Section 4.4) present convincing evidence for ongoing gas accretion in these systems. None of the galaxies with lopsided H i disks highlighted in Figure 10 have companions detected in H i, however these galaxies are small enough, with H i radii of 10 kpc and rotational velocities of 150 km s-1, that rotation timescales are only a few hundred million years and without recent gas accretion these disks are expected to settle in much less than a Hubble time (Simonson, 1982). However it is difficult to distinguish the effects of different gas accretion mechanisms, such as interactions, internal gas recycling, and cosmological inflow. Simulations suggest that gas accreted from the intergalactic medium can either be shock heated to form a hot halo or can penetrate directly to the halo center as a cold flow, depending on the halo mass. For low mass halos, found predominantly at higher redshifts and at in low density environments, these cold flows may be the dominant mechanism for galaxy growth (Birnboim & Dekel, 2003; Kereš et al., 2005; Dekel & Birnboim, 2006; Dekel et al., 2009; Kereš et al., 2009).
This appears to be the case for VGS_12, which was found to have an extremely extended and massive H i disk oriented perpendicular to the direction of the stellar disk, and is discussed at length in Stanonik et al. (2009). The polar disk is devoid of stars, and the central stellar disk has retained its rotational support, suggesting a slow accretion of polar material. This mechanism for the formation of polar disks has also been suggested for NGC 4650A (Iodice et al., 2006), and has been reproduced in simulations (Macciò et al., 2006). In the VGS we also find two systems, VGS_38 and VGS_31, with three galaxies linearly aligned and joined by low column density H i, that is very suggestive of filamentary formation. Hierarchical void theory predicts that void galaxies will reside in relatively low density substructure within the void (Dubinski et al., 1993; Sahni et al., 1994; Sheth & van de Weygaert, 2004; Furlanetto & Piran, 2006; Einasto et al., 2011), which has been observed in simulations (Springel et al., 2005) as well as in nearby voids (Popescu et al., 1997), and the VGS systems present a unique location to search for surrounding low column density intergalactic gas.
Further evidence of gas accretion in void galaxies can be found in the literature. Individual studies of dwarf galaxies in voids suggest that they are uniquely unevolved, with lower metallicities and higher star formation rates than typical dwarf galaxies (Corbin et al., 2005; Pustilnik et al., 2006). KK 246, a dwarf galaxy in the Local Void, has an extremely extended H i disk and evidence of gas at anomalous velocities compared to regular disk rotation (Kreckel et al., 2011b). NGC 6946 has been imaged in H i because of its unusual gas kinematics and signs of gas infall (Boomsma et al., 2008), and was selected for these characteristics independent of its location within the Local Void (Sharina et al., 1997). Individually, these examples are interesting, but taken together they convincingly show that voids are a uniquely promising place to search for evidence of ongoing gas accretion.
5.2. Void galaxy H I properties at fixed morphology, luminosity, and stellar mass
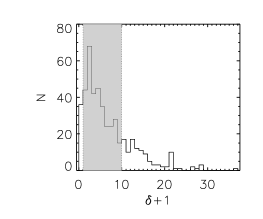
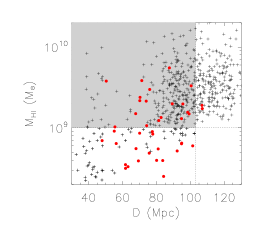
To carefully examine the integrated H i properties for our sample considering their biased morphology, luminosity and stellar mass distributions, we have constructed an environmentally constrained control galaxy sample by cross-matching galaxies in five publicly available catalogs of the Arecibo Legacy Fast ALFA Survey (ALFALFA; Giovanelli et al. 2007; Saintonge et al. 2008; Kent et al. 2008; Martin et al. 2009; Stierwalt et al. 2009) with the Sloan Digital Sky Survey Data Release 7 (SDSS DR7; Abazajian et al. 2009). The ALFALFA catalog identifies H i detected galaxies with a signal-to-noise ratio greater than 6.5 sigma, as well as marginal detections between 4 and 6.5 sigma that have clear optical counterparts. The ALFA receiver’s 3.5 arcminute beam allows sufficient resolution to uniquely determine a corresponding optical counterpart for almost all cataloged H i detections, though confusion of sources within the beam can be an issue for more distant targets. We have restricted this control sample to a redshift range of and a volume limited subset with M M☉ to approximately match the H i sensitivity limits to the WSRT observations (Figure 14, see also Section 3). Following the cross-matching technique described in Toribio et al. (2011), we require that the optical counterpart centers agree in each catalog by less than 10′′, a typical minimum size for the optical disks of galaxies in that redshift range. We also require that the optical and H i redshift velocities agree by less than 300 km s-1, though most source optical redshifts are within 30 km s-1 of the H i detection. We omit any targets flagged as suffering from confusion within the beam, and we further exclude 24 galaxies from this cross-matched catalog that are identified within the SDSS redshift survey to have close companions, within 2′ and a velocity difference of (W50/2 + 50 km s-1). We recalculate the distances for the ALFALFA detections and adjust the H i masses based on the Hubble flow velocity, instead of the cataloged CMB velocity, to remove any bias when comparing with the VGS. Given the imposed lower limit on the redshift range this does not significantly affect our distance estimates. We identify 447 galaxies for this control sample, with 207 in the volume limited subsample. As expected, the bulk of the control sample galaxies are located at average densities, with a limited number in voids and clusters (Figure 14).
We find that late type (r90/r) void galaxies have approximately the same median H i mass to light ratios at fixed luminosity as compared to late type galaxies in the volume limited ALFALFA control sample (Figure 15, left). Here the void sample has been subjected to the same volume limited (M M☉) restrictions to avoid a Malmquist bias. The slight systematic offset to lower values is approximately equal to the typical errors due to uncertainty in the H i mass, however the lack of high H i mass to light ratio galaxies in the VGS brighter than M is striking. As this effect is not apparent when comparing with the WHISP and Ursa Major cluster galaxies (Figure 12), we consider whether the total H i masses may be affected by instrumental differences between the WSRT and Arecibo observations.
Three galaxies in the VGS sample overlap with the ALFALFA control, and for these we find H i masses that agree within the quoted errors. It is also possible that the H i mass mesaurements are strongly contaminated by confusion within the ALFALFA beam, which would result on average in an overestimate of the total H i mass. At a redshift of the 3.5′ beam includes any emission within a physical distance of 50 kpc, approximately the distance from the Milky Way to the Large Magellanic Cloud. This is a relatively small separation, for example five of the target galaxies in the VGS sample when observed by Arecibo would potentially suffer from confusion with their nearby companions, resulting in mass increases of up to a factor of two.
There are further concerns with the absolute mass measured in the ALFALFA sample. Toribio et al. (2011) examined a sample of cross-matched SDSS and ALFALFA galaxies, and for a subsample of well resolved galaxies with known morphological type and optical diameter they calculated the expected H i mass following Haynes & Giovanelli (1984) and Solanes et al. (1996). They reported a negative H i deficiency of 20-30% which increases with redshift, suggesting that their H i masses may be overestimated, however they attribute this to the omission of H i deficient galaxies below the survey detection limits, the inclusion of more gas rich late type galaxies, as well as a difference in the methods used compared to previous work.
While these concerns affect the comparison of absolute H i flux measurements, they should not affect relative comparisons within the ALFALFA sample. In fact, we observe a similarly decreased H i mass to light ratio when comparing the low density () subset of ALFALFA control galaxies with average density ALFALFA galaxies (Figure 15, right). For both the low density ALFALFA galaxies and the VGS, the galaxies in low density regions appear to have an H i mass to light ratio that is approximately 10-20% lower than that of galaxies in average density environments. We consider such a large contribution to the total H i mass by confusion unlikely but possible, as this would require a strongly environmental effect, with gas-rich galaxies in low density regions less clustered. This is in contradiction with our own findings (see Section 5.4).
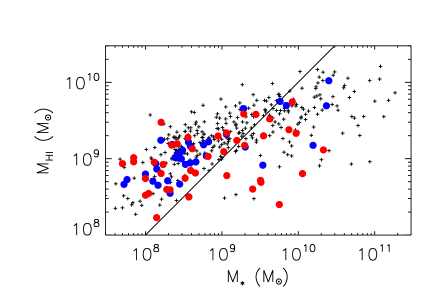
The H i mass to light ratio is in some ways a rough proxy for comparing the H i and stellar masses of a system. As the SDSS spectra allow us to more directly estimate the total mass in stars, we can in this case make an explicit comparison. Figure 16 shows the H i mass as a function of stellar mass, as taken from the MPA-JHU catalog (see Section 3.2), for the VGS and ALFALFA average and underdense samples, with a line indicating equal amounts of mass in stars and gas. We note that in all environments there is a smaller range in H i masses than stellar masses, and a rather sharp transition between gas dominated and stellar mass dominated galaxies. Almost no galaxies with stellar masses below 109 M☉ have less H I than stars, and almost no galaxies with stellar masses above 1010 M☉ have more gas than stars. Given the range of stellar masses probed by these void galaxies, there appear to be very few with high H i masses above 2 109 M☉, and none above M☉, though this is routinely found for galaxies in average density environments. The agreement between all samples appears somewhat better at low 108 M☉ stellar masses. Unfortunately, as ALFALFA is biased towards detecting targets with higher H i masses above M☉, it is misleading to compare the mass distribution of our VGS targets directly with ALFALFA.
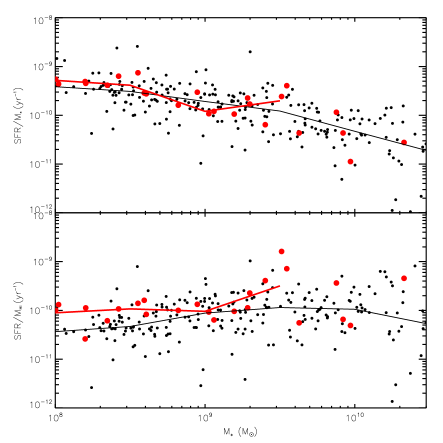
We also compare the normalized star formation of the VGS galaxies with the average density ALFALFA galaxies (Figure 17, top). We find good agreement between the SSFRs when comparing the volume limited VGS and average density ALFALFA samples, which we also find when comparing with a magnitude limited sample of SDSS galaxies (see Section 4.6). This suggests that star formation per stellar mass is the same in voids as in higher density environments. However the SFE appears systematically higher (Figure 17, bottom), as was already suggested by our pilot study. Again, the ALFALFA H i masses are susceptible to contamination within the beam, which would have the effect of decreasing the ALFALFA SFEs, but this observed trend is intriguing if true.
5.3. Baryon content
In Figure 18 we show the -band and baryonic Tully-Fisher relation for the void galaxy sample overplotted on the fit derived by McGaugh et al. (2000) and Geha et al. (2006). W20 values have been corrected for instrumental velocity broadening and inclination. Error bars reflect a 10% uncertainty in the inclination angle. In considering the -band relation, we convert the SDSS bands to the Johnson Cousins -band using the transformation equations of Jester et al. (2005), and find very good agreement with the general relation. We calculate the total baryons by adding the stellar mass and 1.4 times the H i mass, to correct for the contribution from Helium and other metals. While the baryonic relation has been found to typically have less scatter and more reliably fit lower mass galaxies where there is a more significant gas fraction, we find close agreement with relations from the literature but a slight systematic scatter towards higher velocities or lower baryon masses.
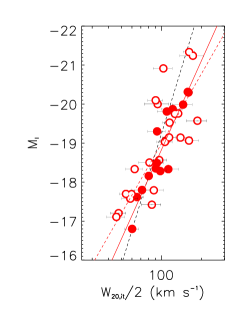
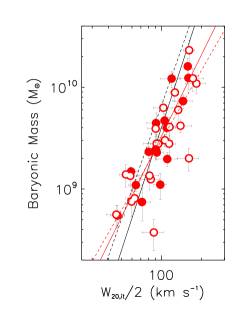
This is particularly interesting as it appears most pronounced for the higher mass galaxies, where the Tully-Fisher relation is typically the most robust, while the low mass systems are generally consistent with average galaxies. All of the targeted void galaxies have inclination corrected velocity widths, W20,it, of more than 40 km s-1, the threshold below which baryon deficiency due to UV photoheating is predicted (Hoeft & Gottlöber, 2010). Excluded from calculations of the baryon mass of these systems is the molecular gas mass, which is not generally considered to contribute significantly (Schombert et al., 1990; Leroy et al., 2005), however considering the possible increase in the efficiency of star formation in these galaxies perhaps this assumption does not hold. Molecular gas has been found to contribute significantly more to the baryonic gas fraction in galaxies at higher redshift, in an earlier phase of their evolution (Tacconi et al., 2010).
It is possible to over-estimate the rotational velocity in systems that are not spatially resolved, as rotation curves can be somewhat centrally peaked, and in fact the agreement is much better when we consider only galaxies with flattened rotation curves resolved (Figure 18, filled symbols). For those galaxies without a turnover observed in the rotation curve, turbulent motions in the disk or beam smearing of central bulge effects on the kinematics may result in overestimation of the rotational velocity width.
5.4. Emptiness of the voids and void galaxy clustering
Though void galaxies have very few nearby galaxies on the large 20 Mpc scale size of the void, they are not necessarily isolated on small 1 Mpc scales. Szomoru et al. (1996) found that the clustering of H i detected galaxies within 1 Mpc of galaxies in the void compared to galaxies in regions of higher global density is the same within a factor of two. Abbas & Sheth (2007) similarly observed that galaxies in the void centers are more clustered than galaxies in the void outskirts, which in turn are less clustered than in moderately overdense regions, and find that this arises naturally from the development of perturbations in a primordial Gaussian density field. In our survey, we are sensitive to H i rich neighboring galaxies, many of which are optically quite faint (M). We detect galaxies up to 25′ (roughly 600 kpc at the average distance of 85 Mpc) and 600 km s-1 away, however we find that the majority of galaxies are within 100 kpc and 100 km s-1.
Because of the pencil beam shape and limited volume of space probed by our observations, calculating nearest neighbor statistics that include the H i detected companions is difficult. Instead, to compare the number of galaxy companions with typical small scale galaxy clustering we examine a volume of the SDSS from containing redshift information for a volume limited sample of all galaxies brighter than M. Within this sample we consider how many would have companions detectable given our observational constraints: sky separations of 600 kpc and velocity differences of 600 km s-1. Additionally, given that the observed VGS velocity separations are strongly biased towards smaller values, and noting a strong threshold in velocity separation at 200 km s-1 for the SDSS sample, we limit our comparison to close companions within 600 kpc and 200 km s-1. Though a 200 km s-1 difference in Hubble flow velocity corresponds to a distance of nearly 3 Mpc, it is within the expected galaxy pairwise velocity dispersion in low density regions (Strauss et al., 1998). As we are comparing with an optically selected redshift survey, we note that the clustering of H i selected galaxies is observed to be weaker than for optically selected samples (Meyer et al., 2007). From a sample of 3,323 SDSS galaxies, we find that 11% have close neighbors observable by our survey, with 8% having one neighbor and 2% having two. For similar clustering in our sample of 55 galaxies, we expect to find about six galaxies with neighbors, four having one neighbor and one having two. In fact, we find eight that have neighbors with M, and one with two neighbors. This remarkable agreement shows that even to relatively faint limits the small scale clustering of galaxies in voids is surprisingly similar to average environments.
Aside from the detection of nearby neighbors, the wide bandwidth of the WSRT observations in our survey also serves as a blind search in H i for galaxies throughout the voids. There has been much debate on the expected distribution of galaxies in the void given a CDM cosmology, which arguably predicts a large population of faint galaxies that fill the void but has not been detected (see Peebles 2001; Tinker & Conroy 2009). We probe with the WSRT a total volume in voids of 485 Mpc3 around the targeted void galaxies, and are sensitive to targets down to 108 M☉. This is significantly smaller than the 1100 Mpc3 probed by Szomoru et al. (1996) in the Boötes void, but an order of magnitude deeper in H i mass sensitivity. It is equivalent to the volume and sensitivity reached with H i Blind searches within the Pisces-Persius void, where no void galaxies are detected (Weinberg et al., 1991; Saintonge et al., 2008). Our sample is inherently biased towards finding at least one void galaxy with each observation, our chosen target, and the many companions we detect are strongly clustered around the target, even though the volume probed away from it is significantly larger. Only one detection, VGS_26a, is at a significant distance from the target and in the void outskirts, however with Mr = -21 it is not a representative of the missing faint void galaxy population.
5.5. Red and dead galaxies within the voids
With the VGS we sample a truncated stellar mass range, where all galaxies have less than M☉. This transition mass is observed to be the point where bulges and spheroids begin to dominate and SFRs decrease (Kauffmann et al., 2003b). Yet within the voids we do observe galaxies representative of the entire Hubble sequence, including three gas-poor early type galaxies (Figure 4). It is interesting to consider how these formed, and how they lost their gas. This small (5%) fraction is suggestive of an extension of the morphology-density relation to the deepest underdensities of the voids, as was also found by Park et al. (2007). We note that in our sample of 60 galaxies none have radio AGNs, which has been suggested as a secular mechanism for halting star formation in void galaxies (Croton & Farrar, 2008). Seven of the VGS galaxies could potentially be classified optically as AGNs, and of these one appears to be an early type galaxy, forming an interesting population for further study.
6. Conclusion
We have identified 60 nearby (d 85 Mpc) void galaxies within the SDSS to form a new Void Galaxy Survey, and imaged 55 of them in H i with the WSRT. Reconstruction of the galaxy density field allows us to carefully select our targets to be situated well inside of geometrically identified voids. We find that optically the VGS galaxies span the entire color range, but they are uniformly small, with no stellar masses in excess of 3 108 M☉. They are generally low luminosity, though not dwarf, blue disk galaxies, yet three appear to be early type galaxies not detected in H i.
41 VGS galaxies are detected in H i, and we find that they are gas rich with regular rotation, about half of which with strongly disturbed gas morphologies and kinematics. This is consistent with galaxies of similar luminosity and optical morphology in average environments. Six of the galaxies not detected in H i appear to have very similar small blue disks, and are presumably gas rich with an H i mass below the detection limits. The H i masses are consistent with galaxies of the same luminosity located in higher density environments. We find no evidence for an increased H i mass to light ratio in low density regions, and in general find very few void galaxies with elevated H i mass to light ratios. The star formation rates normalized by the stellar mass is average given their stellar mass, however there is a hint that the star formation rates normalized by the H i mass is higher in the voids, making them slightly more efficient at forming stars.
The small scale clustering of galaxies in voids is very similar to that in higher density regions, and all but one of the neighboring galaxies detected in H i in the voids appear to be companions of the targeted void galaxy, with most detected within 100 kpc and 100 km s-1. Though we probe 485 Mpc3 within the voids with H i sensitivity of 108 M☉ we find no evidence in H i of the missing low luminosity void galaxy population.
In summary, we find that the large scale underdensities do appear to affect the growth of galaxies, as we find only low mass systems, but the properties of these small galaxies are not different from small galaxies in higher density environments. Through the irregularities in the H i morphology and kinematics of these systems, void galaxies show many signs of ongoing interactions and gas accretion. VGS_12 in particular shows evidence of ongoing cold accretion of gas (Stanonik et al., 2009). In general, void galaxies form a very interesting population of gas rich disk galaxies in which to study galaxy evolution.
References
- Abazajian et al. (2009) Abazajian, K. N., Adelman-McCarthy, J. K., Agüeros, M. A., et al. 2009, ApJS, 182, 543
- Abbas & Sheth (2007) Abbas, U., & Sheth, R. K. 2007, MNRAS, 378, 641
- Aragón-Calvo (2007) Aragón-Calvo, M. 2007, Morphology and Dynamics of the Cosmic Web (Ph.D. Thesis, University of Groningen)
- Aragón-Calvo et al. (2010) Aragón-Calvo, M. A., Platen, E., van de Weygaert, R., & Szalay, A. S. 2010, ApJ, 723, 364
- Baars et al. (1977) Baars, J. W. M., Genzel, R., Pauliny-Toth, I. I. K., & Witzel, A. 1977, A&A, 61, 99
- Baldwin et al. (1981) Baldwin, J. A., Phillips, M. M., & Terlevich, R. 1981, PASP, 93, 5
- Birnboim & Dekel (2003) Birnboim, Y., & Dekel, A. 2003, MNRAS, 345, 349
- Boomsma et al. (2008) Boomsma, R., Oosterloo, T. A., Fraternali, F., van der Hulst, J. M., & Sancisi, R. 2008, A&A, 490, 555
- Brinchmann et al. (2004) Brinchmann, J., Charlot, S., White, S. D. M., et al. 2004, MNRAS, 351, 1151
- Cautun & van de Weygaert (2011) Cautun, M. C., & van de Weygaert, R. 2011, ArXiv e-prints:1105.0370
- Colberg et al. (2008) Colberg, J. M., Pearce, F., Foster, C., et al. 2008, MNRAS, 387, 933
- Corbin et al. (2005) Corbin, M. R., Vacca, W. D., Hibbard, J. E., Somerville, R. S., & Windhorst, R. A. 2005, ApJ, 629, L89
- Croton & Farrar (2008) Croton, D. J., & Farrar, G. R. 2008, MNRAS, 386, 2285
- Dekel & Birnboim (2006) Dekel, A., & Birnboim, Y. 2006, MNRAS, 368, 2
- Dekel et al. (2009) Dekel, A., Birnboim, Y., Engel, G., et al. 2009, Nature, 457, 451
- Dubinski et al. (1993) Dubinski, J., da Costa, L. N., Goldwirth, D. S., Lecar, M., & Piran, T. 1993, ApJ, 410, 458
- Einasto et al. (2011) Einasto, J., Suhhonenko, I., Hütsi, G., et al. 2011, A&A, 534, A128
- Espada et al. (2011) Espada, D., Verdes-Montenegro, L., Huchtmeier, W. K., et al. 2011, A&A, 532, A117
- Furlanetto & Piran (2006) Furlanetto, S. R., & Piran, T. 2006, MNRAS, 366, 467
- Geha et al. (2006) Geha, M., Blanton, M. R., Masjedi, M., & West, A. A. 2006, ApJ, 653, 240
- Giovanelli et al. (2007) Giovanelli, R., Haynes, M. P., Kent, B. R., et al. 2007, AJ, 133, 2569
- Goldberg & Vogeley (2004) Goldberg, D. M., & Vogeley, M. S. 2004, ApJ, 605, 1
- Grogin & Geller (1999) Grogin, N. A., & Geller, M. J. 1999, AJ, 118, 2561
- Grogin & Geller (2000) —. 2000, AJ, 119, 32
- Haynes & Giovanelli (1984) Haynes, M. P., & Giovanelli, R. 1984, AJ, 89, 758
- Hoeft & Gottlöber (2010) Hoeft, M., & Gottlöber, S. 2010, Advances in Astronomy, 2010
- Hoeft et al. (2006) Hoeft, M., Yepes, G., Gottlöber, S., & Springel, V. 2006, MNRAS, 371, 401
- Hoyle et al. (2005) Hoyle, F., Rojas, R. R., Vogeley, M. S., & Brinkmann, J. 2005, ApJ, 620, 618
- Huchtmeier et al. (1997) Huchtmeier, W. K., Hopp, U., & Kuhn, B. 1997, A&A, 319, 67
- Iodice et al. (2006) Iodice, E., Arnaboldi, M., Saglia, R. P., et al. 2006, ApJ, 643, 200
- Jester et al. (2005) Jester, S., Schneider, D. P., Richards, G. T., et al. 2005, AJ, 130, 873
- Kauffmann et al. (2003a) Kauffmann, G., Heckman, T. M., Tremonti, C., et al. 2003a, MNRAS, 346, 1055
- Kauffmann et al. (2003b) Kauffmann, G., Heckman, T. M., White, S. D. M., et al. 2003b, MNRAS, 341, 54
- Kauffmann et al. (2003c) Kauffmann, G., et al. 2003c, MNRAS, 341, 33
- Kent et al. (2008) Kent, B. R., Giovanelli, R., Haynes, M. P., et al. 2008, AJ, 136, 713
- Kereš et al. (2009) Kereš, D., Katz, N., Fardal, M., Davé, R., & Weinberg, D. H. 2009, MNRAS, 395, 160
- Kereš et al. (2005) Kereš, D., Katz, N., Weinberg, D. H., & Davé, R. 2005, MNRAS, 363, 2
- Kewley et al. (2001) Kewley, L. J., Heisler, C. A., Dopita, M. A., & Lumsden, S. 2001, ApJS, 132, 37
- Kirshner et al. (1981) Kirshner, R. P., Oemler, Jr., A., Schechter, P. L., & Shectman, S. A. 1981, ApJ, 248, L57
- Kreckel et al. (2011a) Kreckel, K., Joung, M. R., & Cen, R. 2011a, ApJ, 735, 132
- Kreckel et al. (2011b) Kreckel, K., Peebles, P. J. E., van Gorkom, J. H., van de Weygaert, R., & van der Hulst, J. M. 2011b, AJ, 141, 204
- Kreckel et al. (2011c) Kreckel, K., Platen, E., Aragón-Calvo, M. A., et al. 2011c, AJ, 141, 4
- Lee et al. (2000) Lee, J. C., Salzer, J. J., Law, D. A., & Rosenberg, J. L. 2000, ApJ, 536, 606
- Leroy et al. (2005) Leroy, A., Bolatto, A. D., Simon, J. D., & Blitz, L. 2005, ApJ, 625, 763
- Lucy (1974) Lucy, L. B. 1974, AJ, 79, 745
- Macciò et al. (2006) Macciò, A. V., Moore, B., & Stadel, J. 2006, ApJ, 636, L25
- Martin et al. (2009) Martin, A. M., Giovanelli, R., Haynes, M. P., et al. 2009, ApJS, 183, 214
- McGaugh et al. (2000) McGaugh, S. S., Schombert, J. M., Bothun, G. D., & de Blok, W. J. G. 2000, ApJ, 533, L99
- Meyer et al. (2007) Meyer, M. J., Zwaan, M. A., Webster, R. L., Brown, M. J. I., & Staveley-Smith, L. 2007, ApJ, 654, 702
- Park et al. (2007) Park, C., Choi, Y.-Y., Vogeley, M. S., Gott, J. R. I., & Blanton, M. R. 2007, ApJ, 658, 898
- Patiri et al. (2006) Patiri, S. G., Prada, F., Holtzman, J., Klypin, A., & Betancort-Rijo, J. 2006, MNRAS, 372, 1710
- Peebles (2001) Peebles, P. J. E. 2001, ApJ, 557, 495
- Platen et al. (2007) Platen, E., van de Weygaert, R., & Jones, B. J. T. 2007, MNRAS, 380, 551
- Popescu et al. (1997) Popescu, C. C., Hopp, U., & Elsaesser, H. 1997, A&A, 325, 881
- Pustilnik et al. (2006) Pustilnik, S. A., Engels, D., Kniazev, A. Y., et al. 2006, Astronomy Letters, 32, 228
- Pustilnik et al. (2002) Pustilnik, S. A., Martin, J.-M., Huchtmeier, W. K., et al. 2002, A&A, 389, 405
- Richter & Sancisi (1994) Richter, O.-G., & Sancisi, R. 1994, A&A, 290, L9
- Rojas et al. (2004) Rojas, R. R., Vogeley, M. S., Hoyle, F., & Brinkmann, J. 2004, ApJ, 617, 50
- Rojas et al. (2005) —. 2005, ApJ, 624, 571
- Sahni et al. (1994) Sahni, V., Sathyaprakah, B. S., & Shandarin, S. F. 1994, ApJ, 431, 20
- Saintonge et al. (2008) Saintonge, A., Giovanelli, R., Haynes, M. P., et al. 2008, AJ, 135, 588
- Salim et al. (2007) Salim, S., Rich, R. M., Charlot, S., et al. 2007, ApJS, 173, 267
- Schaap (2007) Schaap, W. 2007, The Delaunay Tessellation Field Estimator (Ph.D. Thesis, University of Groningen)
- Schaap & van de Weygaert (2000) Schaap, W. E., & van de Weygaert, R. 2000, A&A, 363, L29
- Schiminovich et al. (2010) Schiminovich, D., Catinella, B., Kauffmann, G., et al. 2010, MNRAS, 408, 919
- Schombert et al. (1990) Schombert, J. M., Bothun, G. D., Impey, C. D., & Mundy, L. G. 1990, AJ, 100, 1523
- Sharina et al. (1997) Sharina, M. E., Karachentsev, I. D., & Tikhonov, N. A. 1997, Astronomy Letters, 23, 373
- Shen et al. (2003) Shen, S., Mo, H. J., White, S. D. M., et al. 2003, MNRAS, 343, 978
- Sheth & van de Weygaert (2004) Sheth, R. K., & van de Weygaert, R. 2004, MNRAS, 350, 517
- Simonson (1982) Simonson, G. F. 1982, PhD thesis, Yale University., New Haven, CT.
- Smolčić et al. (2008) Smolčić, V., Schinnerer, E., Scodeggio, M., et al. 2008, ApJS, 177, 14
- Solanes et al. (1996) Solanes, J. M., Giovanelli, R., & Haynes, M. P. 1996, ApJ, 461, 609
- Springel et al. (2005) Springel, V., White, S. D. M., Jenkins, A., et al. 2005, Nature, 435, 629
- Stanonik et al. (2009) Stanonik, K., Platen, E., Aragón-Calvo, M. A., et al. 2009, ApJ, 696, L6
- Stierwalt et al. (2009) Stierwalt, S., Haynes, M. P., Giovanelli, R., et al. 2009, AJ, 138, 338
- Strauss et al. (1998) Strauss, M. A., Ostriker, J. P., & Cen, R. 1998, ApJ, 494, 20
- Swaters et al. (2002) Swaters, R. A., van Albada, T. S., van der Hulst, J. M., & Sancisi, R. 2002, A&A, 390, 829
- Szomoru et al. (1996) Szomoru, A., van Gorkom, J. H., Gregg, M. D., & Strauss, M. A. 1996, AJ, 111, 2150
- Tacconi et al. (2010) Tacconi, L. J., Genzel, R., Neri, R., et al. 2010, Nature, 463, 781
- Tinker & Conroy (2009) Tinker, J. L., & Conroy, C. 2009, ApJ, 691, 633
- Toribio et al. (2011) Toribio, M. C., Solanes, J. M., Giovanelli, R., Haynes, M. P., & Masters, K. L. 2011, ApJ, 732, 92
- van de Weygaert & Platen (2009) van de Weygaert, R., & Platen, E. 2009, ArXiv e-prints:0912.2997
- van de Weygaert & Schaap (2009) van de Weygaert, R., & Schaap, W. 2009, in Lecture Notes in Physics, Berlin Springer Verlag, Vol. 665, Lecture Notes in Physics, Berlin Springer Verlag, ed. V. J. Martinez, E. Saar, E. M. Gonzales, & M. J. Pons-Borderia , 291–+
- Verheijen & Sancisi (2001) Verheijen, M. A. W., & Sancisi, R. 2001, A&A, 370, 765
- von Benda-Beckmann & Müller (2008) von Benda-Beckmann, A. M., & Müller, V. 2008, MNRAS, 384, 1189
- Weinberg et al. (1991) Weinberg, D. H., Szomoru, A., Guhathakurta, P., & van Gorkom, J. H. 1991, ApJ, 372, L13
Appendix A Image catalog and discussion of individual systems
This Appendix presents an image atlas of the 60 galaxies comprising the Void Galaxy Survey, as well as an H i atlas presenting an overview of our observations of 55 of the VGS targets and the VGS companions detected in H i. These are followed by a brief discussion of some individually interesting galaxies in our sample.
A.1. Atlas of VGS targets
Figure 20 presents the ugriz combined color image from the SDSS catalog for each of the 60 VGS galaxies, with the VGS catalog name given above each image. All are scaled to the same physical size, such that each image shows approximately a 16 kpc by 16 kpc region of the sky at the distance of the target.
Figure 31 provides an H i atlas of the 41 void galaxies detected with the WSRT. On the left, H i contours from the total intensity map are overlaid on the SDSS -band optical image. In the center, the intensity weighted velocity field is colored to emphasize any rotation in the gas, with contours to guide the eye. On the right, we present a position velocity slice that is aligned with the H i kinematic major axis. All images are created following the uniform reduction described in Section 3, and are shown with uniformly defined contours to aid comparison between the targets.
A.2. Atlas of VGS companions
In addition to the detection of 41 of the 55 VGS targets imaged with the WSRT, we detect in H i 18 neighboring galaxies within the void. Seven of these are shown in Figure 31 along with the target galaxies, and the remaining 11 are shown in Figure 33. As many of these targets are observed within the primary beam but removed from the beam center, the H i sensitivity is typically somewhat worse for these detections than for the primary targets. Thus we show here the H i contours for these detections with a lowest contour at 3, and indicate the corresponding column density in the upper right corner of each image.
A.3. Notes on individual systems
In addition to the very interesting objects previously described in our pilot study (Kreckel et al., 2011c), including interacting systems (VGS_30, VGS_34, VGS_38), misaligned gas disks (VGS_12, VGS_35), optically unusual morphologies (VGS_07) and undisturbed gas morphologies (VGS_32), we highlight here some additional interesting galaxies identified within the VGS.
VGS_05 is not detected in H i, and has an early type optical morphology. Red in color (), it does not present an entirely uniform elliptical morphology, with the light distribution in the center suggesting the presence of a disk or bar. It has the lowest specific star formation rate of the VGS.
VGS_24 is also not detected in H i, and has an optically very smooth, elliptical morphology but a slightly blue () color.
VGS_25 has a small stellar disk and low H i mass, consistent with the small blue disk galaxies not detected that have very uniform optical properties (see Section 4.3). The H i mass detected in this galaxy is just above the stacked detection limit for the six other undetected targets described in Section 4.3, and we expect that this galaxy is analogous to those just below the limits.
VGS_31 is the second void galaxy in our sample to have two H i rich companions, with all three sharing a common envelope in H i. The first, VGS_38, was described in the pilot survey, and presents a very similar linear alignment of the three galaxies, suggesting filamentary structure within the void. The H i bridge connecting all galaxies in VGS_31 is more apparent in Figure 9, where we have imaged with natural weighting to increase our sensitivity. This system shows further signs of ongoing interactions in the left most galaxy, where a gas poor stellar ring is present just at the boundary of the H i disk. This interesting system is discussed in greater detail in Beygu et al. (in prep.).
VGS_47 has an undisturbed stellar disk but extremely lopsided H i morphology. This is not strongly reflected in the gas kinematics, though some evidence of warping may be seen.
VGS_50 is identified as having an extremely extended H i disk, with r/r, though it appears that the r90 optical radius includes only the brighter, redder inner disk and excludes the faint blue, more extended disk observed in the combined color image. With an edge-on gas disk and fairly regular kinematics with no indication of a warp, its 32 kpc physical extent is one of the largest in this sample. The H i surface density profile shows some evidence for a central hole in the gas distribution.
VGS_51 is located the deepest within the void, being at a density of less than a tenth the mean. Optically, it presents a disk morphology with many distinctive blue knots presumably related to areas of high star formation, and the galaxy as a whole does have a relatively high specific star formation rate. The HI distribution appears quite regular both morphologically and kinematically, though the gas disk may be slightly offset from the center of the stellar disk. This is difficult to judge as the optical disk center may be confused by the irregular morphology. It has a very faint (Mr = -14) dwarf companion at nearly coincident velocity and a sky separation of 133 kpc.
VGS_57 has the highest star formation efficiency of the VGS. It is one of the most luminous (Mr = -20.4) galaxies in our sample with one of the highest SFRs, almost 2 M☉ yr-1. Optically, it appears to be a large, face-on strongly barred spiral, however the H i appears as a fairly concentrated disk with a significant warp at the position of the optical spiral arms. It has a smaller companion with a systemic velocity only 70 km s-1 different and a separation on the sky of 175 kpc.
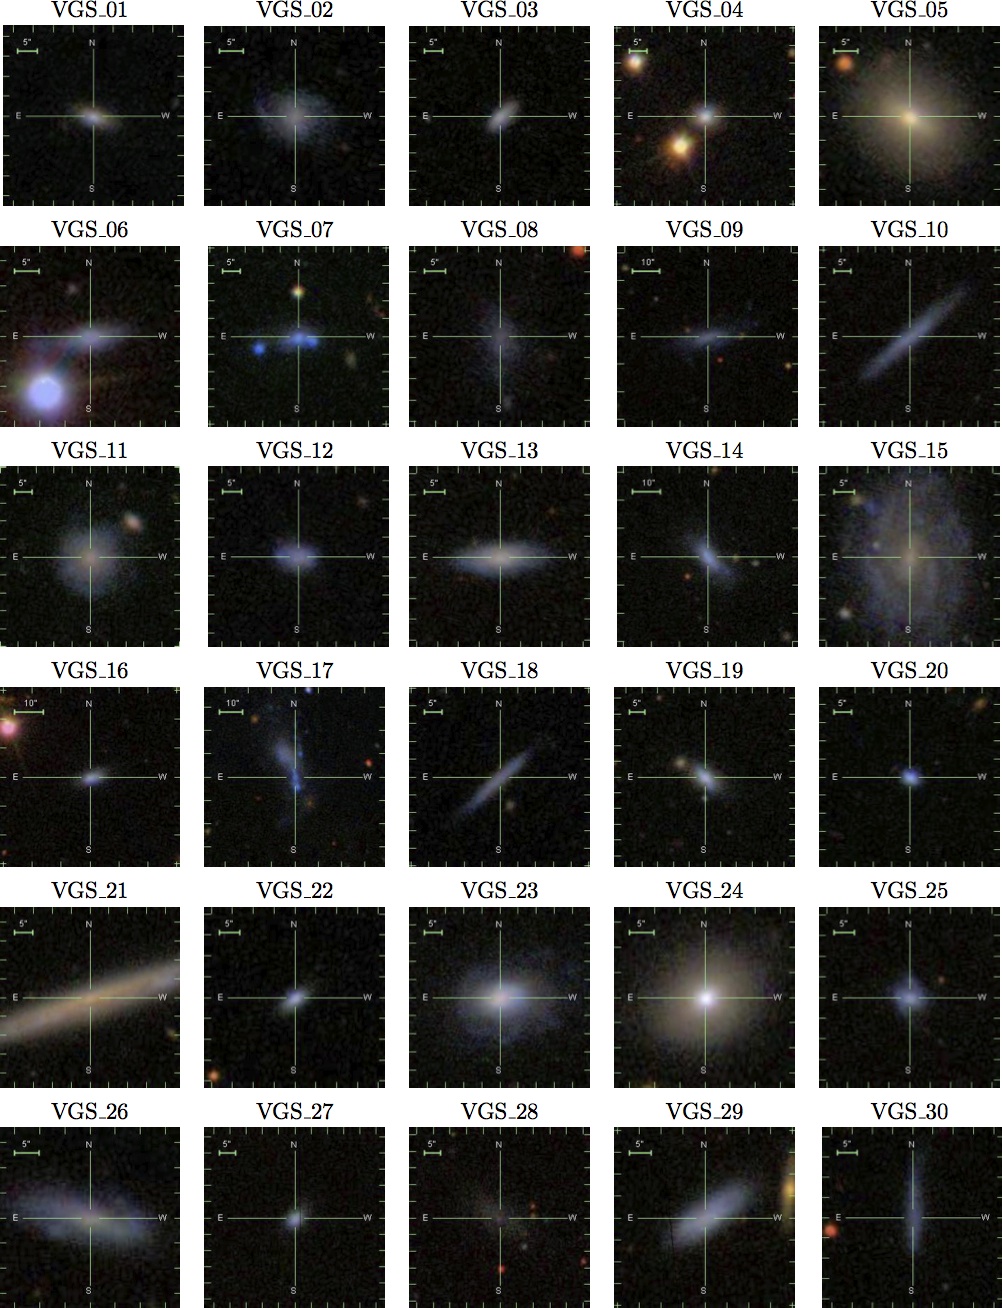
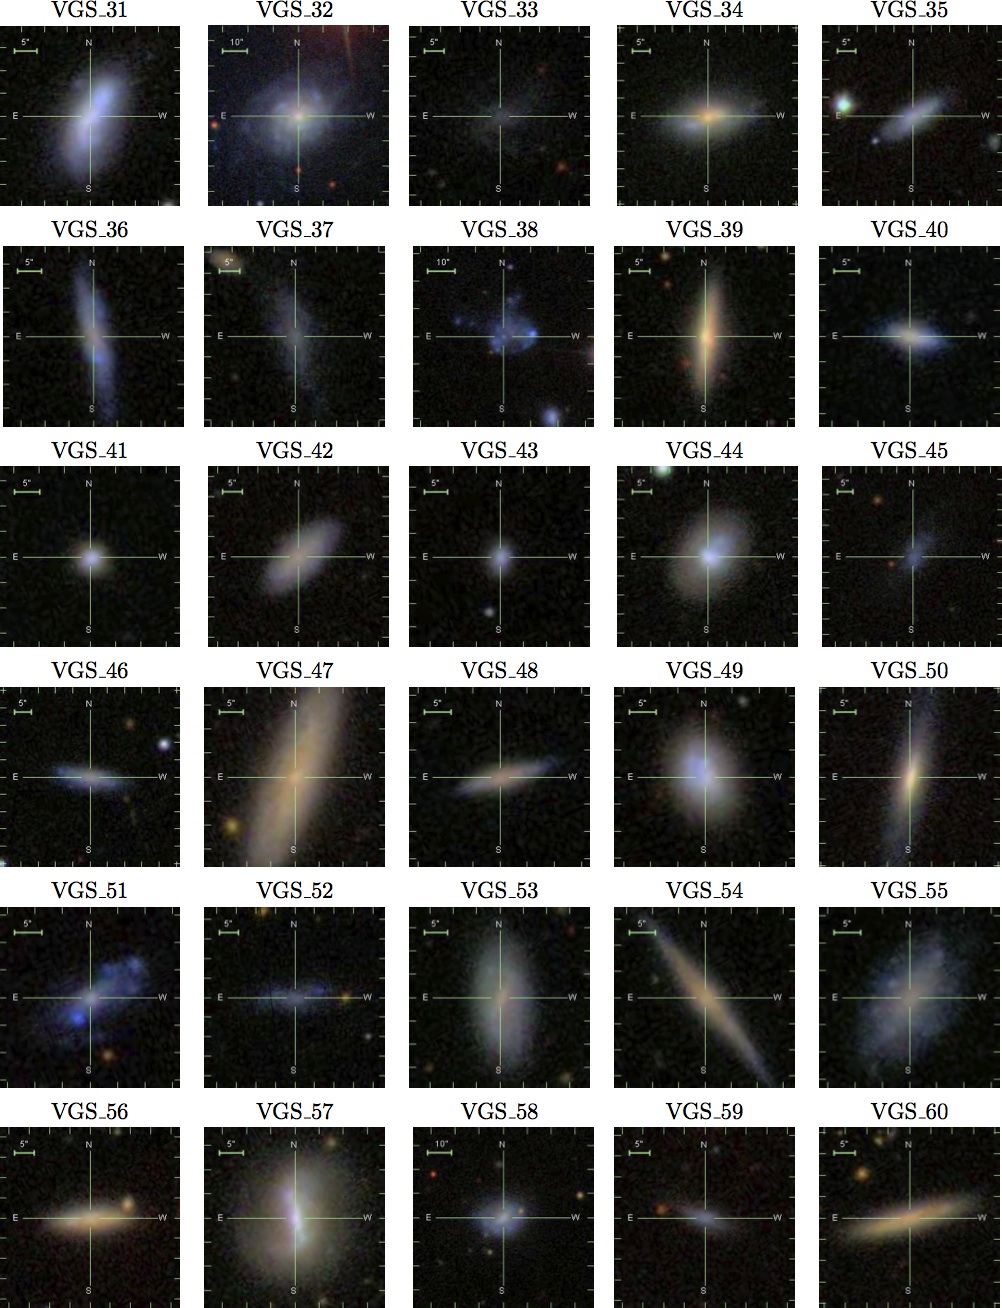
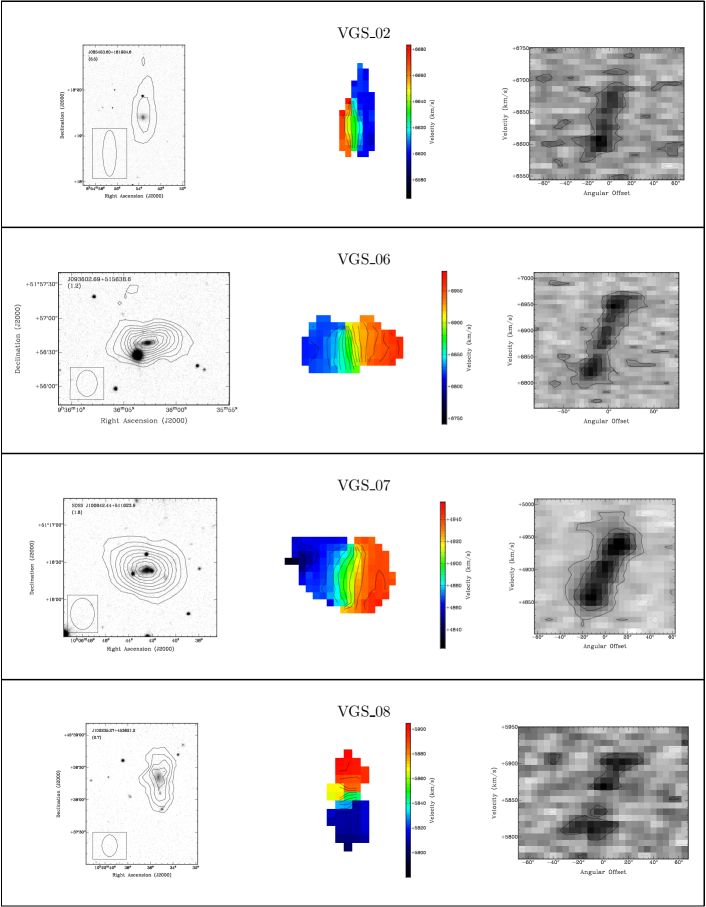
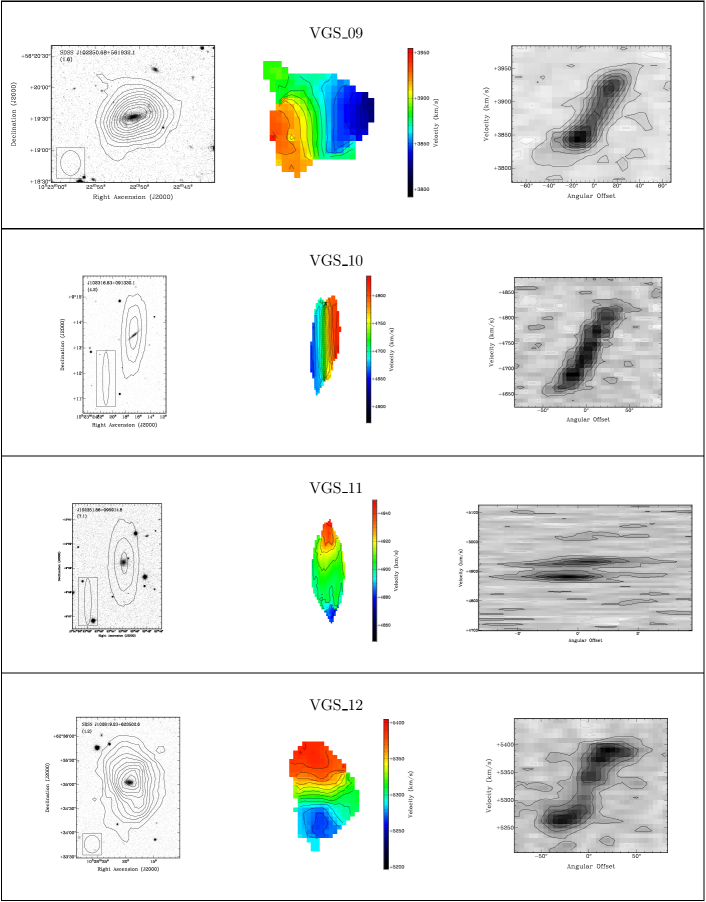
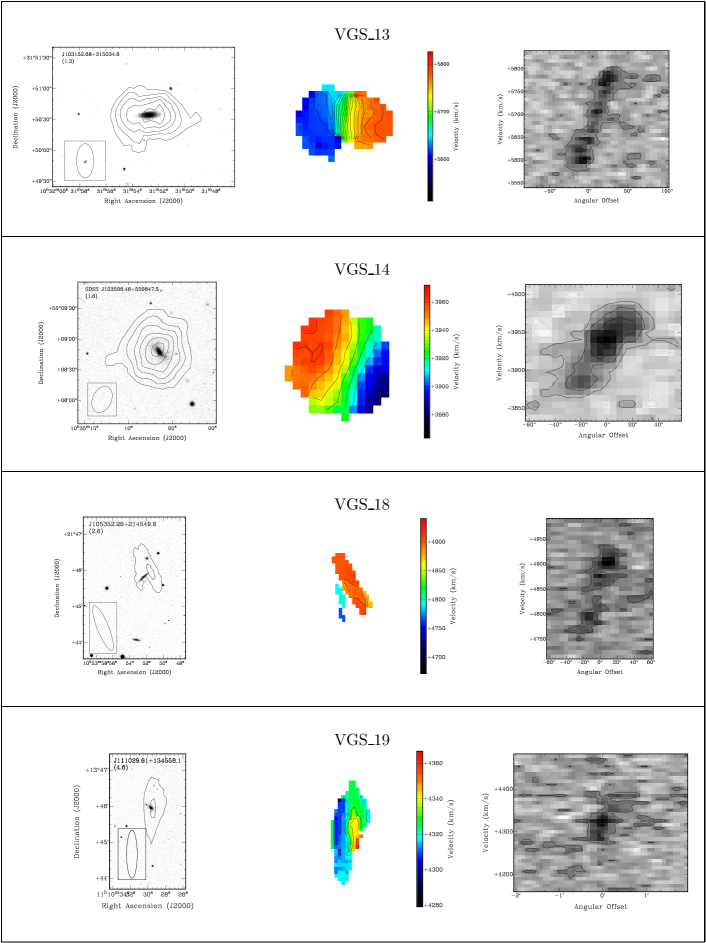
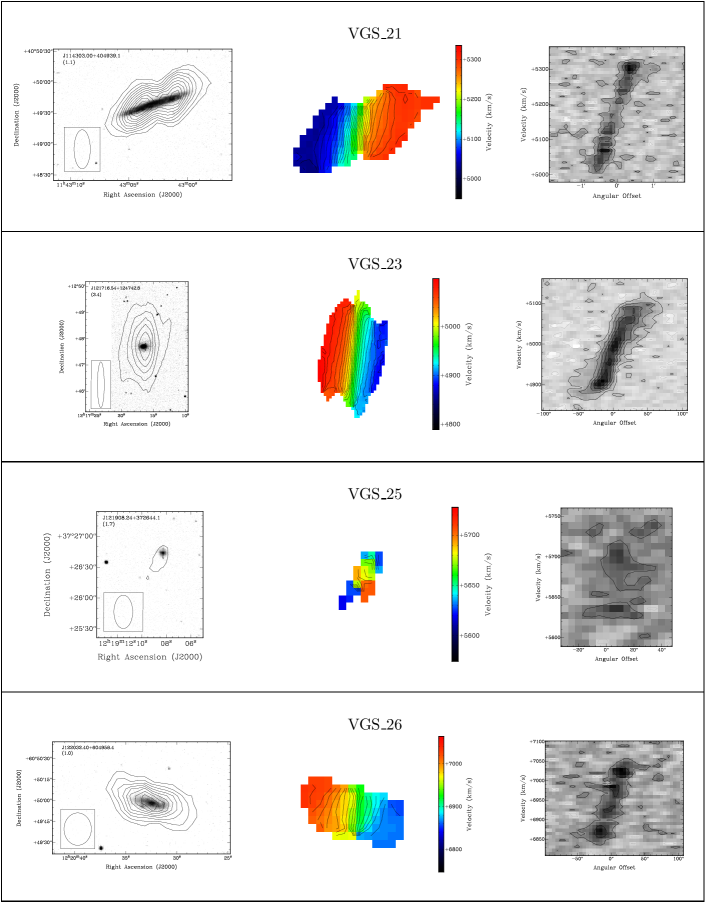
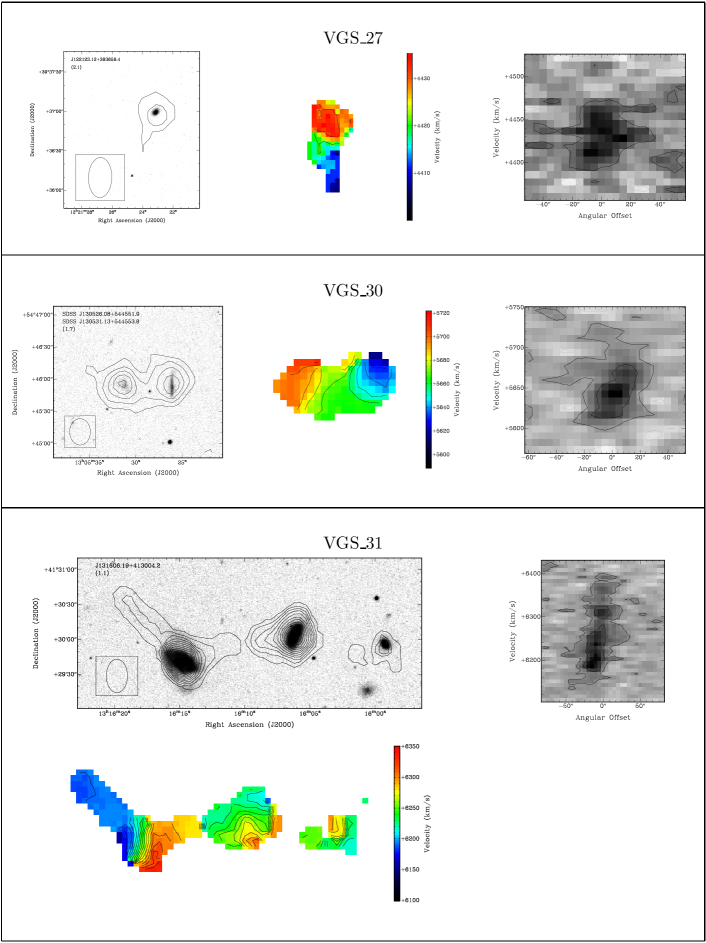
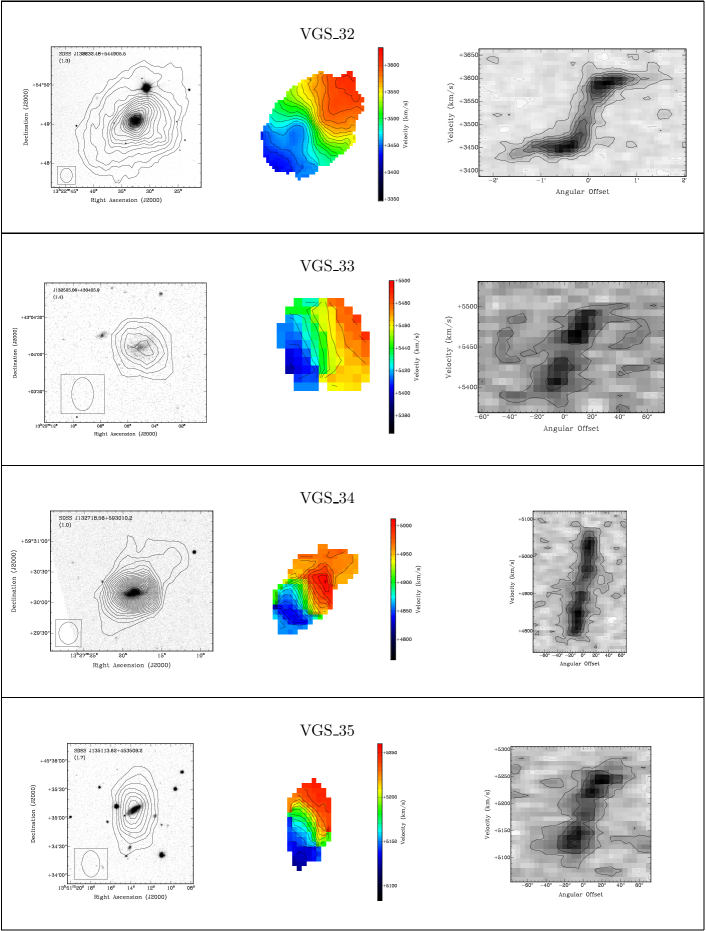
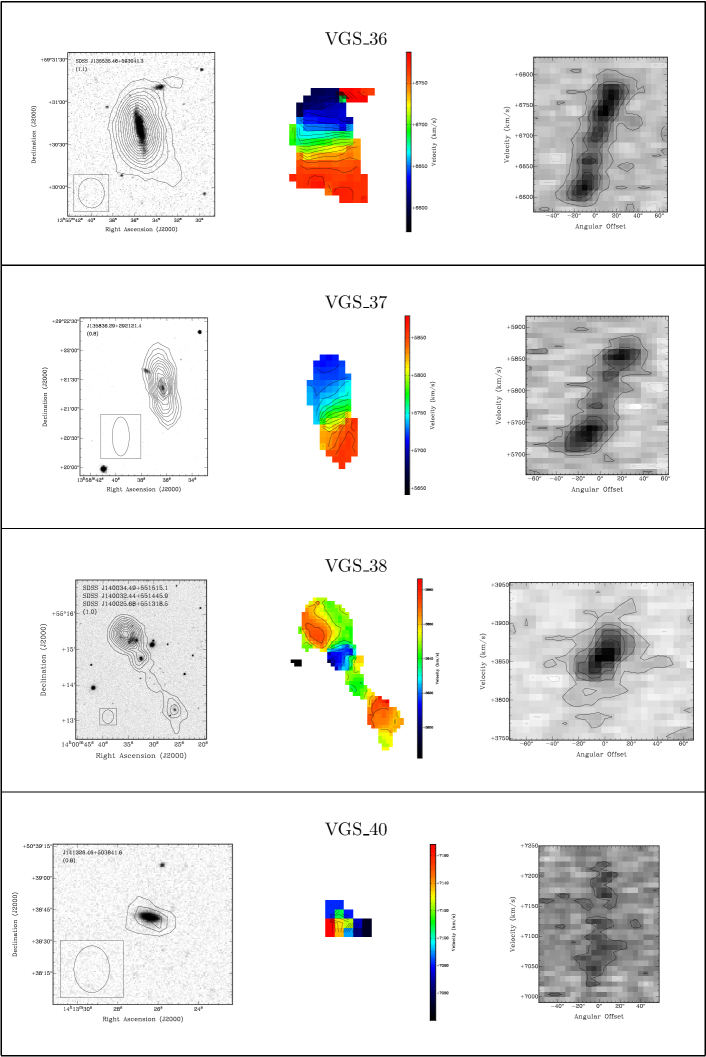
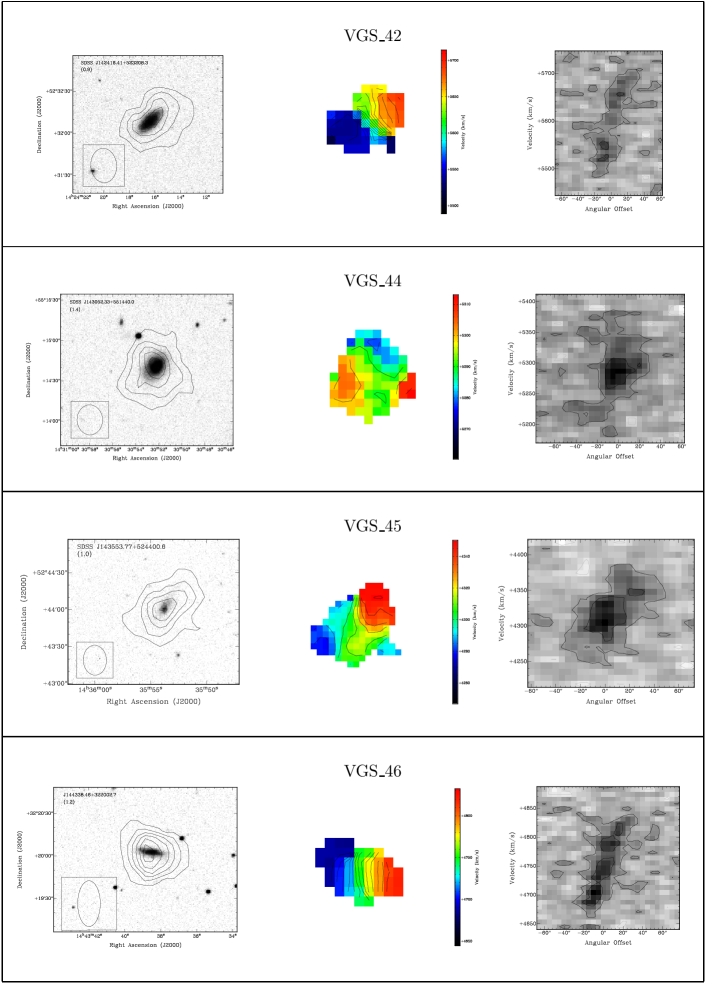
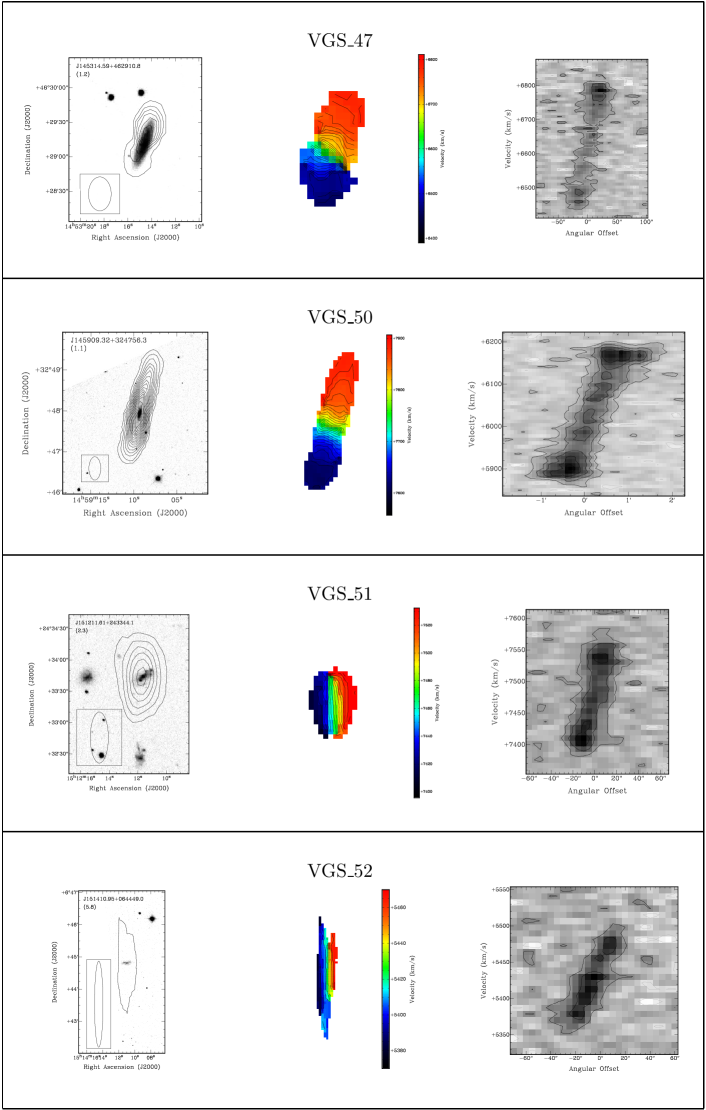
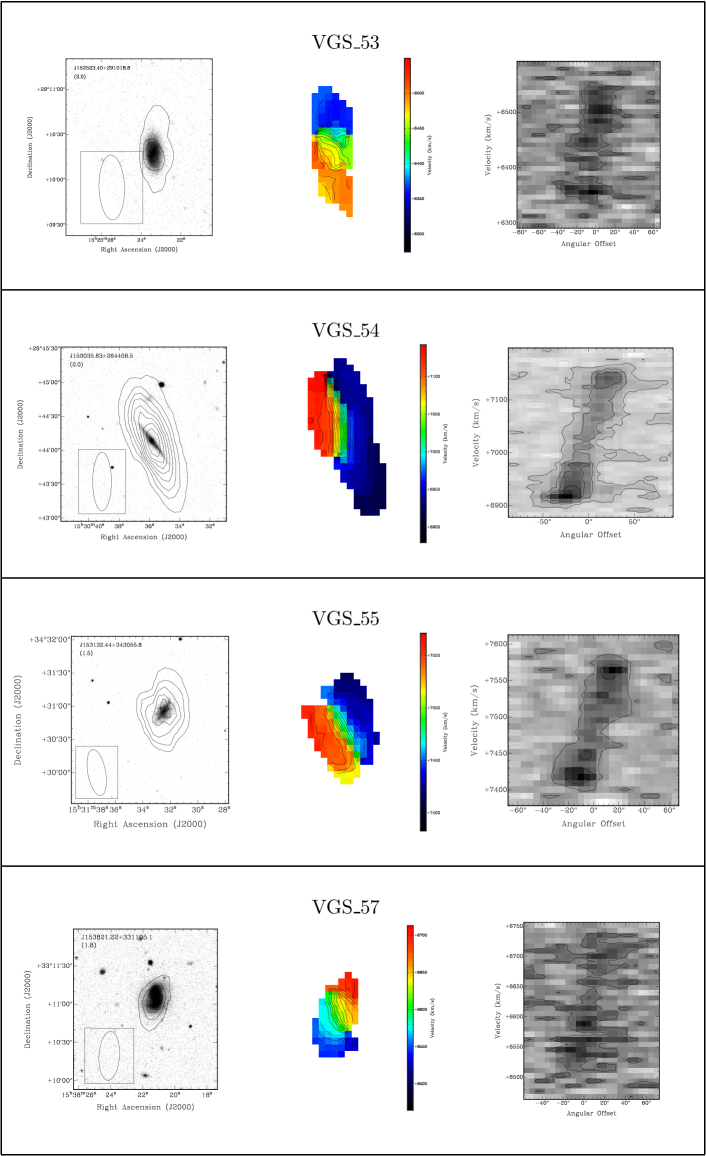
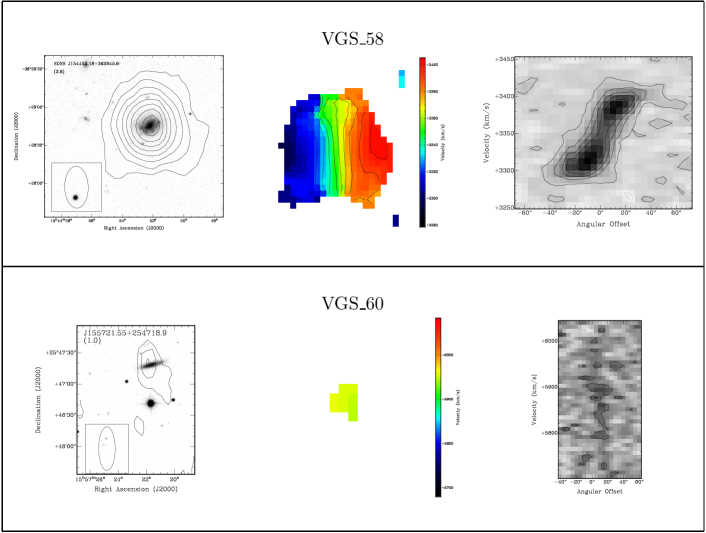

| VGS_07a | VGS_09a | VGS_10a |
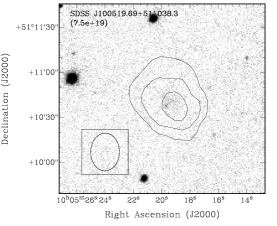 |
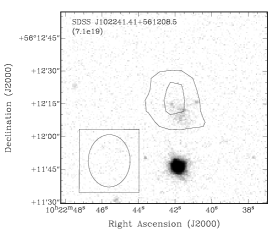 |
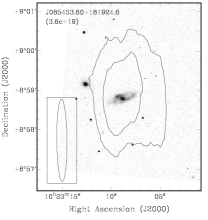 |
| VGS_26a | VGS_34a | VGS_37a |
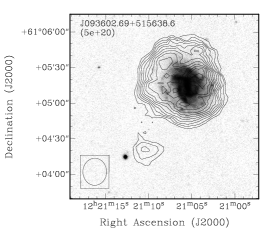 |
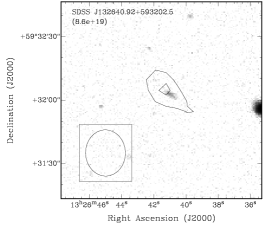 |
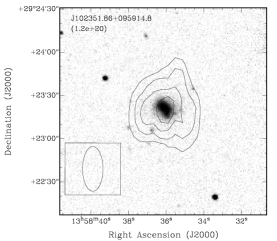 |
| VGS_39a | VGS_51a | VGS_53a |
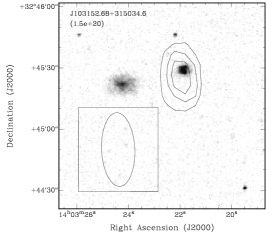 |
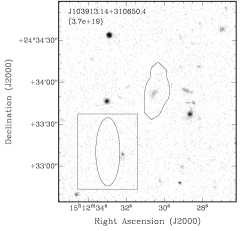 |
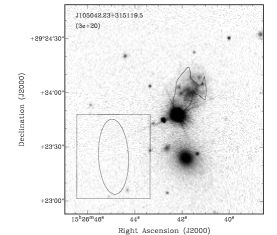 |
| VGS_56a | VGS_57a | |
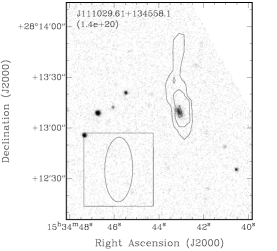 |
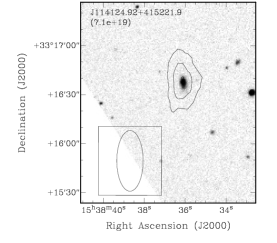 |