Current address: ]Eikhonal Institute, 08750 Barcelona, Spain. Current address: ]Dept. of Physics and Astronomy, James Madison University, Harrisonburg, VA 22807, USA.
Affine and Non-Affine Motions in Sheared Polydisperse Emulsions
Abstract
We study dense and highly polydisperse emulsions at droplet volume fractions . We apply oscillatory shear and observe droplet motion using confocal microscopy. The presence of droplets with sizes several times the mean size dramatically changes the motion of smaller droplets. Both affine and nonaffine droplet motions are observed, with the more nonaffine motion exhibited by the smaller droplets which are pushed around by the larger droplets. Droplet motions are correlated over length scales from one to four times the mean droplet diameter, with larger length scales corresponding to higher strain amplitudes (up to strains of about 6%).
pacs:
83.80.Iz, 47.57.Qk, 83.85.EiAmorphous solids are intriguing in that they have a liquid-like structure yet do not flow like liquids. Window glass is the most common example, and we have some understanding of plastic flow of glass Falk and Langer (1998); Schuh et al. (2007); Bocquet et al. (2009). Glass is not the only amorphous solid; other examples include piles of sand, dense colloidal pastes, and shaving cream foams, which are disordered on the scale of microns or millimeters. Categorizing these as solid-like is reasonable as these materials deform elastically (below a yield stress), rather than flowing. If a stress is applied above the yield stress, then molecules in a glass or particles in a sand pile can rearrange. To make progress, most prior studies used samples comprised of particles of one size or two similar sizes Liu et al. (1996); Mason et al. (1997); Hébraud et al. (1997); Falk and Langer (1998); Yamamoto and Onuki (1998); Losert et al. (2000); Petekidis et al. (2002); Schall et al. (2007); Utter and Behringer (2008); Chen et al. (2010); Hecke (2010); Seth et al. (2011); Sexton et al. (2011); Chikkadi and Schall (2012). The picture that has developed is that the sample flows by having small local groups of particles rearrange. However, many natural materials of interest are highly polydisperse, with particle sizes varying by factors of ten or more. The flow of such materials has been less widely studied Princen (1986); Saint-Jalmes and Durian (1999); Jop et al. (2012). Differences noted from the monodisperse case include a lower strain amplitude required for viscous flow Derkach (2009) and diminished sample viscosity Pal (1996, 2011). The causes of these differences are not well understood.
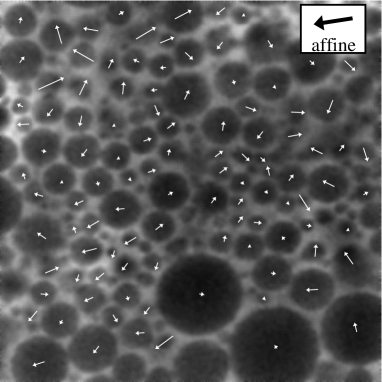
In this Letter, we study the shear of highly polydisperse emulsions and show that the microscopic picture of these samples is quite different from cases where the droplets are all similar-sized. Our emulsions are composed of oil droplets in water, stabilized by a surfactant, and are at sufficiently high volume fractions () that the samples act as amorphous solids Saint-Jalmes and Durian (1999); Derkach (2009); Pal (2011). We subject the samples to low amplitude oscillatory shear and follow the droplet motion in the interior of the sample via confocal microscopy Schall et al. (2007); Chen et al. (2010); Besseling et al. (2009). Most droplets rearrange elastically Hébraud et al. (1997) and move sinusoidally. However, these motions are not necessarily affine, as shown in Fig. 1, where the affine motion has been subtracted off (a uniform displacement to the right for all droplets, indicated by the large arrow). In particular, our main finding is that in a highly polydisperse emulsion, the smaller droplets frequently undergo reversible but highly nonaffine droplet motion. Unlike the shear of monodisperse samples Falk and Langer (1998); Schall et al. (2007); Utter and Behringer (2008); Chen et al. (2010); Sexton et al. (2011), large droplets allow for “cross-talk” between layers at different heights which have different mean velocities. The motions of droplets are correlated over large length scales, up to four times the mean droplet radius, with longer range correlations found for higher applied strain amplitudes. Our observations form a sharp contrast to the localized irreversible rearrangements seen in less polydisperse amorphous samples Falk and Langer (1998); Schall et al. (2007); Utter and Behringer (2008).
We use the shear-rupture method of Ref. Mason and Bibette (1996) to create decane-in-water emulsion droplets stabilized with SDS, skipping the fractionation step. The continuous phase is a 65:35 volume ratio of water and glycerol to index match the decane droplets. Volume fractions are tuned to the range by centrifugation and dilution. Macroscopically, our samples do not flow on their own, indicating they possess a yield stress at these volume fractions Derkach (2009); Mason et al. (1997).
We place the samples in a parallel-plate shear cell Chen et al. (2010). The gap of the cell is fixed at m. The lower glass plate is fixed, and the top plate is driven sinusoidally at a frequency Hz. is chosen to be in the low-frequency limit for this sample, where sample behavior is dominated by elastic properties Mason et al. (1997). The amplitude is typically m, leading to a macroscopic strain amplitude of . Our experiments are conducted at volume fractions and strain amplitudes over which the droplets remain fairly spherical.
The sample is imaged from below through the stationary plate using a confocal microscope. Fluorescein dye is added to the continuous phase to visualize the droplets as shown in Fig. 1. To quantify the size distribution of our system we acquire three-dimensional (3D) image stacks from a static sample of size m3. To observe the dynamics when sheared, we take data as rapidly as possible using only two-dimensional (2D) images. For the 2D experiments, images of size m2 are acquired at a rate of 90 images per second for 33 s.
Using the 3D data from static samples, we determine the droplet radii using custom software implementing the method of Ref. Penfold et al. (2006). The size distribution obtained from this method is shown in Fig. 2. The mean droplet radius is 1.2 m, the standard deviation is 0.6 m, and the Sauter mean radius is 2.3 m. While large droplets with m are uncommon, they account for a nontrivial portion of the volume, as can be seen by the volume-weighted probability distribution shown in the inset to Fig. 2.

For 2D data analysis, we use a slightly different analysis technique. We identify droplets using the 2D-Hough transform Ioannou et al. (1999), which lets us identify the droplets’ radii and positions in each image. From that data, we then use conventional techniques to track their corresponding trajectories Crocker and Grier (1996). Both standard tracking and the iterative image tracking technique described in Ref. Besseling et al. (2009) are used to reconstruct each trajectory. Note that for each droplet, because our observation is only in 2D, we do not know the true radius . However, we observe that droplets are not distinguishable in 2D slices when they are viewed more than away from their center. This is due to the tilt of the droplet interface: the droplet radius changes significantly within the optical section of the 2D confocal image ( m), so the edge of the droplet is blurred in these cases and cannot be clearly determined with our image analysis, and these droplets are not tracked. Accordingly, for each droplet we track, the droplet radius we apparently observe is in the range .
When an oscillatory strain is applied to the emulsion, the majority of droplets rearrange reversibly and periodically at the driving frequency. The droplet-averaged displacement field is (with no motion on average in and ). It is this average motion we term the “affine motion” in the sense that the position predicted by is an affine transformation of the original positions. (This differs from some prior work where affine motion was determined locally in space and time Utter and Behringer (2008); Falk and Langer (1998).) In Fig. 1 the droplet-averaged displacement during the time interval pictured is indicated by the large black displacement arrow. This average motion has been subtracted off from all of the droplets, and the remainder (the non-affine component) is indicated by the white arrows. The largest droplets ( m) move sinusoidally, following , reflected by their short displacement vectors in Fig. 1. In contrast, smaller droplets move in a variety of directions.
This variety of displacements for the smaller droplets is due to the largest droplets. At the equator of a large droplet, it moves with the expected motion for that height , that is, . The droplets deform little and thus move as fairly rigid spheres, and thus the top of a large droplet moves with an amplitude too small relative to the expected velocity at height . Likewise, at height the large droplet moves faster than the mean velocity for that height. Two large droplets that are nearby but with centers at different do not have the same velocities, and as they move back and forth sinusoidally, they push and pull on the smaller droplets between them. These smaller droplets thus have apparently random motions. In practice, the larger droplets are rarer and so less likely to influence each other. Moreover, they move based on the average influence of the smaller droplets surrounding them, and so their motion tends to follow the average motion . The contrast in motion between large and small droplets in a highly polydisperse sample differs qualitatively from cases where large-scale flows cause non-affine motion, and which typically require large amplitude strain Yamamoto and Onuki (1998); Utter and Behringer (2008); Sexton et al. (2011); Jop et al. (2012).
Over the 33 s movies, approximately 8% of the droplets make an irreversible rearrangement at some point. This only occurs with smaller droplets, m. Before and after the irreversible rearrangement, the droplets move periodically. The rarity of plastic rearrangements in our data is similar to a prior study of a more monodisperse emulsion Hébraud et al. (1997). Our typical forcing amplitude for the shear cell ( m) was chosen to limit the amount of plastic rearrangements.
At this point we only study droplets whose trajectories are reversible (elastic) and thus periodic. We respectively denote as and the components of a trajectory parallel and perpendicular to the shear axis at time . A least squares fit is applied to each component with functional forms:
| (1) |
using the known driving frequency . These functional forms provide a good fit to the particle trajectories.
We take data at several depths , relative to defined at the stationary bottom plate. At each height we compute the mean amplitude . For all data, we find a linear relationship between and , and from this linear relationship we define the local strain by ; see Supplemental Material for further details about determining local strain.
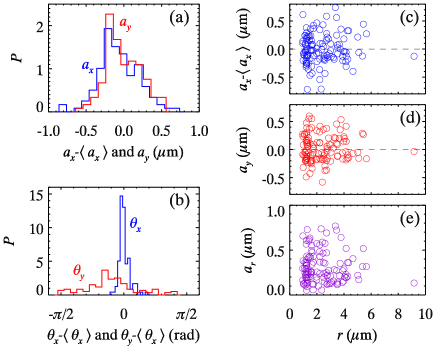
The distributions of the fitting parameters , , and are quite broad, as shown in Fig. 3. While many droplets move with the mean amplitude as appropriate for that height, several have amplitudes that differ by 0.5 m or more from the mean. Negative values of indicate droplets moving with smaller amplitudes than might be expected, and likewise positive values indicate droplets moving with larger amplitudes. These results are equally true in the direction of the applied strain [Fig. 3(a)] and perpendicular to this direction [Fig. 3(b)], showing many droplets have significant nonaffine motion. Note that from our fits (Eqns. Affine and Non-Affine Motions in Sheared Polydisperse Emulsions) is positive: to get values , we assume that all droplets move in phase, and so droplets with phase angles that appear out of phase with the dominant motion are adjusted, . In general we find , as expected by symmetry. The broad amplitude distributions we see in Fig. 3(a,b) are qualitative similar to those seen in Utter and Behringer’s study of sheared 2D bidisperse materials Utter and Behringer (2008). The widths of the amplitude distributions are in agreement with the argument given above: if a large droplet with m pushes on a smaller droplet located at a height away from the center of the large droplet, then the anomalous motion should be m for these data.
Figure 3(c-e) shows a scatter-plot of the data of Fig. 3(a), as a function of the droplet radii . The amplitudes associated with bigger droplets are found at the central peaks of and . The outliers are more likely to be associated with smaller sized droplets. Figure 3(e) in particular shows the total nonaffine amplitude for each droplet, with the larger values of this amplitude generally being seen for smaller droplets – although also some small droplets move nearly affinely.
To understand the spatial character of the particle behavior, Fig. 4 shows images colored based on the values of (left) and (right). Droplets with similar or tend to be close together. This is also apparent in Fig. 1, where nearby droplets have nonaffine displacement vectors in similar directions.

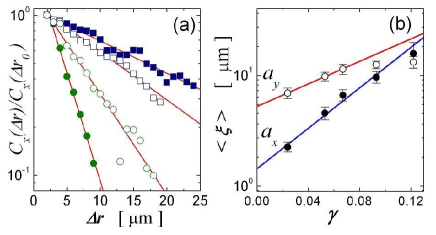
To gain further insight into the spatial clustering of droplets with similar characteristics, we identify droplet pairs which are separated by a surface-to-surface distance , that is, droplets separated by a center-to-center distance , where is the radius of droplet in the 2D image. Then, we compute a spatial correlation function for the amplitude (and similar for ):
| (2) |
where is the number of neighboring droplets, and and are the -amplitudes of droplets and . The average is for all droplets comprised by and corresponds to the variance of the distribution of . The choice of using the surface-to-surface distances rather than center-to-center is perhaps not obvious. However, each individual droplet moves as a solid object, thus completely correlated with itself (distances ). Examining the surface-to-surface motion lets us avoid considering this artificially correlated solid-body motion, and instead probe the properties of the effective medium between droplets. If we consider center-to-center separations, the results are noisy and do not have a simple dependence on the distance.
Figure 5(a) shows these correlation functions for (solid symbols) and (open symbols), for one sample at two different strain amplitudes. The correlation functions exhibit exponential decay with decay lengths in the range of 8-15 m; the decay lengths for different samples are provided in the Supplemental Material and do not vary systematically with volume fraction. These lengths are comparable to the sizes of the larger droplets in the sample. Figure 5(a) shows that correlations in the larger strain case (squares) decay slower than than in the small strain case (circles). We find and depend on as shown in Fig. 5(b) for this sample.
We have studied dense polydisperse emulsions, and observed highly complex droplet motion when our samples are sinusoidally sheared. Most droplets move periodically, but different droplets have different amplitudes and phases. Large droplets push small droplets out of their way, although nearly all of this motion is reversible. In fact, a key point is that the complex droplet motions occur at low strain amplitudes where the behavior is elastic, rather than requiring large amplitude plastic flow. We find length scales over which droplet motions are correlated. These length scales range from 1 to 4 times the mean droplet diameter, with the largest values found for the highest strains (). Overall, our results suggest that the flow of highly polydisperse systems is richer than that of monodisperse samples. Theoretical descriptions derived for less polydisperse systems will likely not apply or need to be modified Liu et al. (1996); Falk and Langer (1998). Preliminary observations of steadily sheared polydisperse emulsions suggest that these results carry over in a qualitative respect, with the largest droplets moving in straightforward fashion under steady shear, and the smallest droplets moving in highly variable trajectories.
We thank G. W. Baxter, R. Besseling, C. Crane, R. Gonzalez, C. Hollinger, and W. C. K. Poon for helpful discussions. Funding from the National Science Foundation (grants DMR-0603055 and DMR-1336401), the Petroleum Research Fund (administered by the American Chemical Society, grant 47970-AC9), and the Swiss National Foundation (grant PBFR2-116930) is gratefully acknowledged.
References
- Falk and Langer (1998) M. L. Falk and J. S. Langer, Phys. Rev. E 57, 7192 (1998).
- Schuh et al. (2007) C. A. Schuh, T. C. Hufnagel, and U. Ramamurty, Acta Materialia 55, 4067 (2007).
- Bocquet et al. (2009) L. Bocquet, A. Colin, and A. Ajdari, Phys. Rev. Lett. 103, 036001 (2009).
- Liu et al. (1996) A. J. Liu, S. Ramaswamy, T. G. Mason, H. Gang, and D. A. Weitz, Phys. Rev. Lett. 76, 3017 (1996).
- Mason et al. (1997) T. G. Mason, M.-D. Lacasse, G. S. Grest, D. Levine, J. Bibette, and D. A. Weitz, Phys. Rev. E 56, 3150 (1997).
- Hébraud et al. (1997) P. Hébraud, F. Lequeux, J. Munch, and D. Pine, Phys. Rev. Lett. 78, 4657 (1997).
- Yamamoto and Onuki (1998) R. Yamamoto and A. Onuki, Phys. Rev. E 58, 3515 (1998).
- Losert et al. (2000) W. Losert, L. Bocquet, T. C. Lubensky, and J. P. Gollub, Phys. Rev. Lett. 85, 1428 (2000).
- Petekidis et al. (2002) G. Petekidis, A. Moussaïd, and P. N. Pusey, Phys. Rev. E 66, 051402 (2002).
- Schall et al. (2007) P. Schall, D. A. Weitz, and F. Spaepen, Science 318, 1895 (2007).
- Utter and Behringer (2008) B. Utter and R. P. Behringer, Phys. Rev. Lett. 100, 208302 (2008).
- Chen et al. (2010) D. Chen, D. Semwogerere, J. Sato, V. Breedveld, and E. R. Weeks, Phys. Rev. E 81, 011403 (2010).
- Hecke (2010) M. V. Hecke, J. Phys.: Cond. Matt.r 22, 033101 (2010).
- Seth et al. (2011) J. R. Seth, L. Mohan, C. A. Locatelli-Champagne, M. Cloitre, and R. T. Bonnecaze, Nature Materials 10, 838 (2011).
- Sexton et al. (2011) M. B. Sexton, M. E. Möbius, and S. Hutzler, Soft Matter 7, 11252 (2011).
- Chikkadi and Schall (2012) V. Chikkadi and P. Schall, Phys. Rev. E 85, 031402 (2012).
- Princen (1986) H. Princen, J. Colloid Interface Sci. 112, 427 (1986).
- Saint-Jalmes and Durian (1999) A. Saint-Jalmes and D. J. Durian, J. Rheo. 43, 1411 (1999).
- Jop et al. (2012) P. Jop, V. Mansard, P. Chaudhuri, L. Bocquet, and A. Colin, Phys. Rev. Lett. 108, 148301 (2012).
- Derkach (2009) S. R. Derkach, Adv. Coll. Int. Sci. 151, 1 (2009).
- Pal (1996) R. Pal, AIChE J. 42, 3181 (1996).
- Pal (2011) R. Pal, Curr. Op. Coll. Int. Sci. 16, 41 (2011).
- Besseling et al. (2009) R. Besseling, L. Isa, E. R. Weeks, and W. C. K. Poon, Adv. Coll. Int. Sci. 146, 1 (2009).
- Mason and Bibette (1996) T. G. Mason and J. Bibette, Phys. Rev. Lett. 77, 3481 (1996).
- Penfold et al. (2006) R. Penfold, A. D. Watson, A. R. Mackie, and D. J. Hibberd, Langmuir 22, 2005 (2006).
- Ioannou et al. (1999) D. Ioannou, W. Huda, and A. F. Laine, Image and Vision Computing 17, 15 (1999).
- Crocker and Grier (1996) J. C. Crocker and D. G. Grier, J. Colloid Interface Sci. 179, 298 (1996).
Affine and Non-Affine Motions in Sheared Polydisperse Emulsions: Supplemental Material
Prior to our experiments, the samples are gently stirred to prevent any size segregation due to sedimentation, although for our high volume fractions sedimentation and size segregation are exceedingly slow. To try to ensure that the sample does not slip, where the sample comes into contact with the glass plates, we add a coating of ScotchGard (3M). The sample wets the ScotchGard, pinning the sample to the coated region and ensuring a no-slip boundary condition at each plate. We do not observe the behavior of purely slipping emulsions in any of our experiments [S1].
We study the sample at depths and 60 m, relative to defined at the stationary bottom plate. At each height we compute the mean amplitude . We find where is the local strain amplitude and is a slip length. does not extrapolate to 0 at , but rather at negative values ranging from to m. The local strain is always smaller than the applied strain. This suggests that the emulsion partially slips at the top plate, or possibly has a shear band somewhere where the local strain is significantly higher. Unfortunately, our confocal could not image deeply enough to observe the behavior at the top plate. We emphasize that the mean strain is uniform throughout within the the volume we image. See the Table for further information about each particular experiment.
Given the dependence of the decay length on (as discussed in the main text), it suggests that perhaps the variation we see for samples with different in the Table is perhaps more due to the variability in for those data.
| 0.65 | 0.070 | -9.0 | 9.4 | 10.3 |
| 0.70 | 0.102 | -13.8 | 14.7 | 9.1 |
| 0.75 | 0.054 | -9.2 | 8.0 | 9.6 |
| 0.85 | 0.070 | -8.8 | 8.3 | 11.7 |
Supplemental Reference
[S1] S. P. Meeker, R. T. Bonnecaze, and M. Cloitre, Phys. Rev. Lett. 92, 198302 (2004).