The black hole candidate MAXI J1659–152 in and towards quiescence in X–ray and radio
Abstract
In this paper we report on Expanded Very Large Array radio and Chandra and Swift X–ray observations of the outburst decay of the transient black hole candidate MAXI J1659–152 in 2011. We discuss the distance to the source taking the high inclination into account and we conclude that the source distance is probably 6 kpc. The lowest observed flux corresponds to a luminosity of erg s-1. This, together with the orbital period of 2.4 hr reported in the literature, suggests that the quiescent X–ray luminosity is higher than predicted on the basis of the orbital period – quiescent X–ray luminosity relationship. It is more in line with that expected for a neutron star, although the outburst spectral and timing properties reported in the literature strongly suggest that MAXI J1659–152 harbors a black hole. This conclusion is subject to confirmation of the lowest observed flux as the quiescent flux. The relation between the accretion and ejection mechanisms can be studied using the observed correlation between the radio and X–ray luminosities as these evolve over an outburst. We determine the behaviour of MAXI J1659–152 in the radio – X–ray diagram at low X–ray luminosities using the observations reported in this paper and at high X–ray luminosities using values reported in the literature. At high X-ray luminosities the source lies closer to the sources that follow a correlation index steeper than 0.6–0.7. However, when compared to other sources that follow a steeper correlation index, the X–ray luminosity in MAXI J1659–152 is also lower. The latter can potentially be explained by the high inclination of MAXI J1659–152 if the X–ray emission comes from close to the source and the radio emission is originating in a more extended region. However, it is probable that the source was not in the canonical low–hard state during these radio observations and this may affect the behaviour of the source as well. At intermediate X–ray luminosities the source makes the transition from the radio underluminous sources in the direction of the relation traced by the ’standard’ correlation similar to what has been reported for H 1743–322 in the literature. However, MAXI J1659–152 remains underluminous with respect to this ’standard’ correlation.
Subject headings:
stars: individual (MAXI J1659–152) — accretion: accretion discs — stars: binaries — X-rays: binaries1. Introduction
Nearly all black hole X–ray binaries (BHXBs) are found in transient sources that show a dramatic increase in their X–ray luminosity (see McClintock & Remillard 2006 for a review). Such transient BHXBs spend long periods at very low X–ray luminosities, referred to as ‘quiescence’. The luminosity increases during occasional outbursts by as much as 7 to 8 orders of magnitude, typically reaching values of tens of per cent of the Eddington luminosity (). The X–ray spectral and timing properties of BHXBs evolve in a characteristic way as the outburst progresses (e.g. Belloni 2010). Furthermore, the X–ray behaviour is a good predictor of the radio behaviour suggesting an intimate connection between the two (e.g. Fender et al. 2009).
Hannikainen et al. (1998) and later Corbel et al. (2003) and Gallo et al. (2003) found that the X–ray and radio luminosity from hard state black holes are correlated. The correlation takes the form . However, since then more data has become available for other sources (e.g. Xue & Cui 2007, Cadolle Bel et al. 2007, Rodriguez et al. 2007, Shaposhnikov et al. 2007, Corbel et al. 2008, Jonker et al. 2010, Coriat et al. 2011, Ratti et al. 2012 accepted) that revealed that several sources follow a steeper correlation between the X–ray and radio luminosity. Recently, Coriat et al. (2011) found that the BHXB H 1743–322 followed the sources on this ’outlier’ branch at X–ray luminosities above erg s-1, but when the source luminosity decreased it showed a transition at an approximately constant radio luminosity of a few erg s-1 to the ’standard’ power–law correlation with index 0.6. The source XTE J1752–223 shows behaviour consistent with the same trend (Ratti et al. submitted).
Homan et al. (2005) found a similar correlation between the X–ray and near–infrared flux in the BHXB GX 339–4. Russell et al. (2006) used a much larger sample of sources and found a similar correlation between the X–ray and near–infrared flux in all the BHXBs in the low–hard state that they investigated: . It is at present not clear to what extend the near–infrared – X–ray correlation is caused by the jet outflow. Nevertheless, besides the potential connection between the radio and X–ray luminosity, the X–ray and near–infrared luminosity in the BHXBs in the hard state are also connected. So far, it has been possible to test the radio/X–ray relation in quiscence only with quasi–simultaneous observations for A 0620–00; (Gallo et al. 2006) and for V404 Cyg (Hynes et al. 2009). It was found that the radio and X–ray flux lie on the extension of the ’standard’ correlation, suggesting that it holds all the way down to quiescence. This seems to rule out models that predict that the relation should significantly steepen around (Yuan & Cui 2005).
Here, we present a study of MAXI J1659–152, it was discovered by the Monitor of All-sky X–ray Image instrument onboard the International Space Station (MAXI; Matsuoka et al. 2009). Shortly thereafter it was detected by the Swift Burst Alert Telescope (BAT; Mangano et al. 2010; note that the BAT detection was reported earlier than the MAXI detection). Initially it was classified as a gamma–ray burst (GRB 100925A), but it was quickly realized that the source is a strong black hole candidate (BHC; Kalamkar et al. 2010).
Dips in the X–ray light curve of MAXI J1659–152 reveal the orbital period. At a period of 2.4 hrs (Kuulkers et al. 2010a; Kennea et al. 2011) this is currently the shortest orbital period known for a BHXB. The X–ray timing and broad–band spectral properties evolve over the outburst in a canonical way (Kennea et al. 2011; Kalamkar et al. 2011; Muñoz-Darias et al. 2011) strengthening the identification of the source as a black hole candidate(BHC). The faintness of the optical counterpart in quiescence (Kong et al. 2010) and the short orbital period will make it difficult to obtain an accurate mass measurement through time–resolved optical spectroscopy of the companion star while the system is in quiescence. Kennea et al. (2011) constrain the distance to the source to be more than 6.1 kpc. An accurate source position was obtained using radio very long baseline interferometry (VLBI) observations using the European VLBI Network (EVN; Paragi et al. 2010).
Here, we report on contemporary Chandra, Swift X–ray and Expanded Very Large Array (EVLA) radio observations of the black hole candidate MAXI J1659–152 aimed at following the X–ray and radio light curves and establishing the X–ray – radio correlation during the last part of the decay to quiescence as well as the X–ray luminosity in quiescence.
2. Observations, analysis and results
2.1. Chandra X–ray data
We observed MAXI J1659–152 with the Chandra satellite using the back–illuminated S3 CCD–chip of the Advanced CCD Imaging Spectrometer (ACIS) detector (Garmire 1997) on six occasions during the decay to quiescence (see Table 1 for a journal of the Chandra observations). We windowed the ACIS–S CCD in all observations, providing a frame time of 0.4104 s. We have reprocessed and analysed the data using the CIAO 4.3 software developed by the Chandra X–ray Center employing the calibration files from the Calibration Database version 4.4.6. The last observation (ID 12443) has been observed with the datamode set to VFAINT. This means that pulse height information in a 5x5 pixel region around the event is telemetered down, allowing for a more rigorous cleaning of background events caused by for instance cosmic rays. In our analysis we have selected events only if their energy falls in the 0.3–7 keV range. All data have been used, as background flaring is very weak or absent in all observations. For the last two observations (ID 12442 and 12443) we produced custom–made bad pixel maps taking into account the change in the Chandra aimpoint on the ACIS CCD.
| Obs ID | Observing | MJD | Time on | Net count rate | wavdetect detected # |
|---|---|---|---|---|---|
| date | (days; UTC) | source (ks) | 0.3-7 keV (cnt s-1) | source counts | |
| 12438a | 2011 Apr. 14 | 55665.96202 | 6.36 | 235 | |
| 12439a | 2011 Apr. 23 | 55674.74944 | 9.08 | 80 | |
| 12440 | 2011 May 03 | 55684.29844 | 13.6 | 8 | |
| 12441a | 2011 May 12 | 55693.21054 | 18.1 | 11761 | |
| 12442a | 2011 Aug. 15 | 55788.83283 | 30.8 | 10 | |
| 12443 | 2011 Oct. 12 | 55846.53179 | 90.7 | 39 |
a This observation is used in Figure 3.
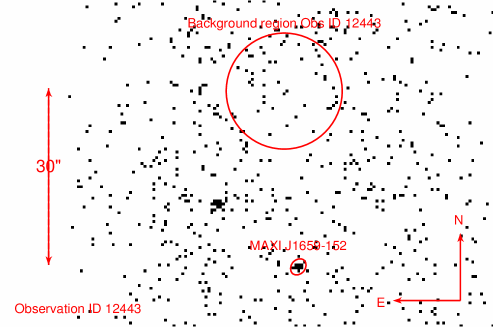
Using wavdetect we detect MAXI J1659–152 in each of the observations. We have selected a circular region of 10′′ radius centered on the accurately known source position (Paragi et al. 2010) to extract the source counts. Similarly, for the first five Chandra observations, we have used a circular region with a radius of 20′′ on a source–free region of the CCD to extract background counts. For the sixth and last observation with observation ID 12443 we used a circular region with a radius of 10′′ as the long integration revealed some weak point sources in the region covered by the 20′′ –radius background circle. Nevertheless, as the exposure is more than 90 ksec. long, there are sufficient counts in this circle in order to reliably estimate the background event rate.
The redistribution response file is the same for the source and background region but we have made auxilliary response matrices for the source region of each of the observations separately. The net, background subtracted, source count rate for each observation is given in Table 1.
Using xspec version 12.6.0q (Arnaud 1996) we have fitted the spectra of MAXI J1659–152 using Cash statistics (Cash 1979) modified to account for the subtraction of background counts, the so called W–statistics111see http://heasarc.gsfc.nasa.gov/docs/xanadu/xspec/manual/ for all six observations. We have used an absorbed power–law model (pegpwrlw in xspec) to describe the data.
Kennea et al. (2011) found evidence for variations in as the outburst progressed. Initially they found 2.30.3 cm-2 whereas later during the outburst an average value of 5 cm-2 was found (no error bar was given for the latter value). Given that in most observations we only detected a low number of counts we decided to fix the to 2.3 cm-2 in our spectral fits. If a significant amount of this extra (local) absorbing material was still present during the time of our observations we will slightly under estimate the value of the power–law index in our fits. Owing to the high count rate during observation ID 12441, we included the pile–up model (Davis 2001) in the fit. For reference we also performed the fit without the pile–up model. The difference between the two fits is small. Finally, we fitted the spectrum of observation ID 12441 leaving the parameter free as well (including or excluding the pile–up model has no significant effect on the best–fit value for ). We found a best fit value cm-2. We list the results of our spectral analysis in Table 2. See Table 3 for the 1–10 keV flux values that we derived.
| Obs | PL | Unabs. 0.5–10 keV | Abs. 0.5–10 keV | Goodness |
|---|---|---|---|---|
| ID | index | erg-1 cm-2 s-1 | erg-1 cm-2 s-1 | per cent |
| 12438 | 2.10.1 | 60 | ||
| 12439 | 2.50.3 | 99 | ||
| 12440 | 2a | 26 | ||
| 12441 | 1.460.02 | 89 | ||
| 12441b | 1.480.03 | 89 | ||
| 12442 | 2a | 67 | ||
| 12443 | 3.20.6 | 75 |
a Parameter fixed at this value.
b Fit–function includes the pile-up model, (Davis 2001).
2.2. Selected Swift XRT observations
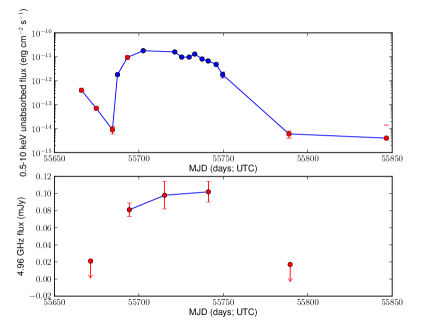
We analyse selected Swift X–ray telescope (XRT) observations that were obtained close in time to our EVLA observations in order to track the radio – X–ray correlation. The Swift data were reduced using dedicated tools within heasoft version 6.11. We applied filtering based on the standard events grades (0–12 in photon counting mode). The calibration database version 4.4 was used. We employed the tools xrtpipeline and xrtproducts to obtain the XRT spectra. We fitted the spectra using xspec following the same procedure as for the Chandra spectra. We plot the unabsorbed 0.5–10 keV X–ray flux obtained from the Swift observations with IDs 00031843014–00031843025 in Figure 2. We excluded the observations with IDs 00031843016 and 00031843017 from our analysis as there are no data products suitable for our purpose. For the radio – X–ray correlation (see below) we calculated 1–10 keV unabsorbed fluxes and we used the Swift observation on MJD 55721.22 (Obs. ID 00031843018) and MJD 55741.02 (Obs. ID 00031843023) as they are close in time to our EVLA observations on 2011 Jun. 03 (MJD 55715.21) and 2011 Jun. 29 (MJD 55741.14), respectively. See Table 3 for the Swift 1–10 keV flux values that we derived.
In the top panel of Figure 2 we show the Swift and Chandra light curve of the last phase of the 2010–2011 outburst of MAXI J1659–152. After an initial decay to (close to) quiescence, a reflare occurred after MJD 55684 (May 03, 2011), where the source brightened by a factor of 180 in less than 3 days. Next, the source remained brighter than 1erg cm-2 s-1 for a period of about 2 months before it decayed to the quiescent flux level of 5erg cm-2 s-1 in less than 40 days.
2.3. EVLA radio observations
We observed MAXI J1659–152 with the Expanded Very Large Array (EVLA; Perley et al., 2011) over 7 epochs from 2011 April 19 through 2011 August 17, under program code SC0346. The array was initially in the relatively extended ‘B’ configuration, had moved to the hybrid ‘BnA’ configuration prior to our observations on 2011 May 13, and by 2011 June 29 was in its most extended ‘A’ configuration. We observed at a central frequency of 4.96 GHz, using 256 MHz of contiguous bandwidth split into two 128-MHz sub-bands, each of which comprised sixty-four 2-MHz channels.
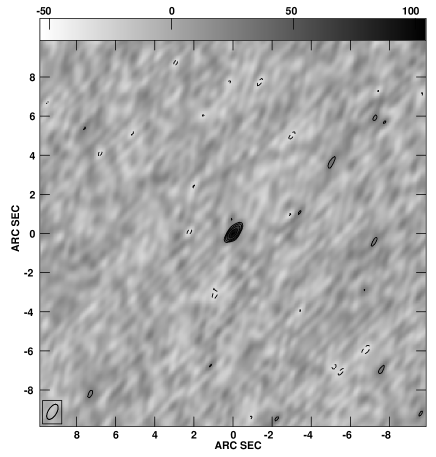
The data were reduced using the Common Astronomy Software Application (casa; McMullin et al., 2007) software package. The initial calibration steps applied the necessary baseline corrections and removed any data affected by shadowing, radio frequency interference (RFI) or instrumental problems. We then used the primary calibrator 3C 286 to carry out bandpass and flux density calibration, setting the flux scale according to the coefficients derived at the EVLA by NRAO staff in 2010. We used the secondary calibrator J1707–1415 to derive amplitude and phase gains for MAXI J1659–152. After applying the calibration, the data on MAXI J1659–152 were averaged in frequency by a factor of 8, and then imaged using natural weighting. The field was not bright enough for self-calibration, so after a single round of deconvolution, when detected, the source was fit in the image plane with an elliptical Gaussian. The fitting results are given in Table 4. We list the MJD times of these observations and the difference between the mid–times of the radio and X–ray exposures in Table 3.
| Satellite | X–ray flux 1–10 keV | Radio flux | Instrument | start MJD X-ray obs | |
|---|---|---|---|---|---|
| erg cm-2 s-1 | mJy | days | days | ||
| Swift | 2.4 | 4.920.04 | WSRT | 55465.7 | 0.14 |
| Swift | 4.8 | 10 | EVN | 55469.7 | 0.42 |
| Chandraa | 1.73 | 0.021b | EVLA | 55670.3a | 1.07a |
| Chandra | 8.3 | 0.0810.008 | EVLA | 55693.2 | 1.00 |
| Swift | 1.4 | 0.0980.016 | EVLA | 55721.2 | 6.01 |
| Swift | 5.8 | 0.1020.012 | EVLA | 55741.0 | 0.12 |
| Chandra | 4.5 | 0.017b | EVLA | 55788.8 | 0.57 |
a The average flux, combining the fluxes measured from
Obs ID 12438 and 12439, is given and used in Figure 3. The MJD
is the average of the MJDs of Obs ID 12438 and 12439. The time
difference between the X–ray and radio observation is with respect to
this average.
b 3 upper limit.
c Difference between the X-ray and radio
mid-exposure times (except for footnote where the difference is
with respect to the average of the start times of the two X–ray observations).
| Observation date | MJD | On source | Array | Bandwidth | Flux density |
|---|---|---|---|---|---|
| (days; UTC) | exp. time (min) | configuration | (MHz) | (mJy beam-1) | |
| 2011 Apr. 19 | 55670.42 | 50 | B | 256 | |
| 2011 Apr. 20a | 55671.37 | 250 | B | 256 | |
| 2011 Apr. 21 | 55672.330.04 | 50 | B | 256 | |
| 2011 May 13 | 55694.310.08 | 117 | BnA | 256 | |
| 2011 Jun. 03 | 55715.210.04 | 50 | BnA | 256 | |
| 2011 Jun. 29 | 55741.140.04 | 50 | A | 256 | |
| 2011 Aug. 16 | 55789.050.06 | 80 | A | 256 | |
| 2011 Aug. 16b | 55789.580.59 | 280 | A | 256 | |
| 2011 Aug. 17 | 55790.110.06 | 80 | A | 256 |
2.4. Radio – X–ray correlation
In Figure 3 we plot the observed correlation between the X–ray and 4.96 GHz radio luminosities for MAXI J1659–152 using the X–ray observations closest in time to the radio observations (converting the fluxes in Table 3 to luminosities using distances of 4 and 8 kpc [see Discussion]). The quoted radio luminosities are calculated starting from the measured flux density and assuming a flat spectrum up to 5 GHz. Besides our quasi–simultaneous EVLA – Chandra/Swift observations we provide two data points using quasi–simultaneous radio and Swift X–ray observations mentioned in the literature. In particular, we used the radio detection obtained with the Westerbork Synthesis Radio Telescope (WSRT) on Sept. 26, 2010 at 4.8 GHz reported in van der Horst et al. (2010) and the detection using the European VLBI Network (EVN) at 4.9 GHz on Sept. 30, 2010 reported in Paragi et al. (2010). Both these observations were early in the outburst of the source when it was possibly still in the low–hard state (cf. Kalamkar et al. 2011) although the source spectrum showed continuous softening and MAXI J1659–152 may well have been in the hard–intermediate state at those times (Kalamkar et al. 2011; see Discussion).
We derived the quasi–simultaneous 1-10 keV X–ray flux from the measurements reported by Kennea et al. (2011). See Table 3 for the MJD times of these observations and the difference between the mid–times of the radio and X–ray exposures. We convert their 2–10 keV fluxes to 1–10 keV using the webtool w3pimms with the power–law index and interstellar extinction, , provided in their paper as input for the w3pimms tool. See Table 3 for all the flux values that have been used to calculate the luminosities in Figure 3.
3. Discussion
We studied the source MAXI J1659–152 during the last phase of the 2010–2011 outburst using contemporaneous Chandra/Swift and EVLA observations.
In order to optimally use the information gained from these observations we first need a distance estimate for MAXI J1659–152. Kennea et al. (2011) applied various scaling relations between observables to obtain distance estimates, but they seem to settle on a d kpc on the basis of the assumption that at the peak of the outburst the source X–ray emission must be above 0.1. Kennea et al. (2011) mention that this assumption contradicts the quiescent counterpart identified by Kong et al. (2010), as the putative quiescent optical counterpart would be too bright given this distance and the known orbital period. However, it only is too bright if there is negligible light coming from the residual accretion disc in quiescence. In several BHXRBs in quiescence, however, optical spectroscopy and variability shows that the disc does contribute significantly to the optical light on many occasions in quiescence (cf. Marsh et al. 1994, Gelino & Harrison 2003; Cantrell et al. 2010). The star can of course be an interloper star unrelated to MAXI J1659–152: time–series optical spectroscopic observations of the star while MAXI J1659–152 is in quiescence will be necessary to decide on this issue. Kuulkers et al. (2011) use the relation between the outburst amplitude in the optical and the orbital period between known sources and their (approximate) distances to estimate a distance of 73 kpc for MAXI J1659–152. In Miller-Jones et al. (2011b), we noted that the reported relation between the optical outburst amplitude and the orbital period (Shahbaz & Kuulkers 1998) does not take the source inclination into account. A high inclination leaves a smaller projected surface area of the accretion disc hence one would be inclined to put the source artificially far away using this method.
Similarly, high inclination sources may be considerably fainter in X–rays (cf. Fujimoto 1988; Narayan & McClintock 2005) explaining the relatively low luminosity at the peak of the outburst that one would derive for distances lower than 6 kpc. Furthermore, the lack of eclipses in sources with values 0.1 for the mass ratio, which we define here as the mass of the secondary divided by the mass of the black hole primary, can be accomodated for inclinations (cf. Horne 1985), this is significantly higher than the canonical 60∘–75∘ (cf. Frank et al. 2002) making the inclination dependent effects on the X–ray luminosity larger.
Assuming that the accretion disc does not contribute significantly to the optical light in quiescence and that the source found by Kong et al. (2010) is related to MAXI J1659–152 we derived a distance lower–limit between 1.6 and 4.2 kpc (Miller-Jones et al. 2011b). Kaur et al. (2012) obtained median-resolution optical spectroscopy of MAXI J1659–152 during the outburst. Those authors use the observed velocity shifts of the Na I D and Ca II H&K interstellar absorption lines with respect to that of the local standard of rest and a kinematic model of Galactic rotation to derive a lower limit to the source distance of 4 kpc. These two lower limits together seem to favour an M2 V companion star over an M5 V companion star as the latter would lead to a lower limit of 1.6 kpc and could only be consistent with a distance lower limit of 4 kpc if the accretion disc is dominating the optical light. This leads us to adopt a lower limit to the distance of MAXI J1659–152 of 4 kpc. Nevertheless, it has often been found that the accretion disc contributes 10–45 per cent to the optical –band light in BHTs in quiescence (see references above and e.g. Reynolds et al. 2008 and references therein). Conservatively assuming an accretion disc contribution of 50 per cent to the –band luminosity and a M2 V companion star we derive a distance of 5.9 kpc, which we round to 6 kpc. Taking uncertainties such as that in the derived interstellar extinction, spectral type of the companion star into account, and allowing for an even higher accretion disc contribution, we subsequently assume that the distance to MAXI J1659–152 is 62 kpc.
During the last two Chandra observations the source flux is consistent with being the same. We interpret this as evidence for the source having reached quiescence, although a future Chandra observation will be necessary to test this better. For our estimated distance of 62 kpc the source quiescent 0.5–10 keV luminosity is erg s-1for a 0.5–10 keV source flux of 5erg cm-2 s-1. The estimated luminosity based on the orbital period – X–ray luminosity correlation would be erg s-1, so significantly lower than what we measured.

Hence, assuming the observed flux for the last two observations corresponds to the quiescent flux and taking the distance derived above, the source quiescent X–ray luminosity is on the high–end for a black hole system given the short orbital period of 2.4 hr (see Figure 4; cf. Garcia et al. 2001; Rea et al. 2011). The quiescent X–ray luminosity is more in line with what would be expected for a neutron star at that orbital period in quiescence. However, this would be at odds with the observed spectral and timing properties as well as with the radio flux during the outburst (Kennea et al. 2011; Kalamkar et al. 2011; Muñoz-Darias et al. 2011). If this quiescent flux level is confirmed by future X–ray observations (an additional deep Chandra observation is planned for the Summer of 2012) there is perhaps more scatter on the known correlation between quiescent X–ray luminosity and orbital period, or the distance to the source has been over–estimated. A distance of 2 kpc would be required to bring the luminosity of MAXI J1659–152 to that estimated using the orbital period – X–ray luminosity relation. Possible effects of the high inclination on the observed X–ray flux would make the intrinsic luminosity higher still.
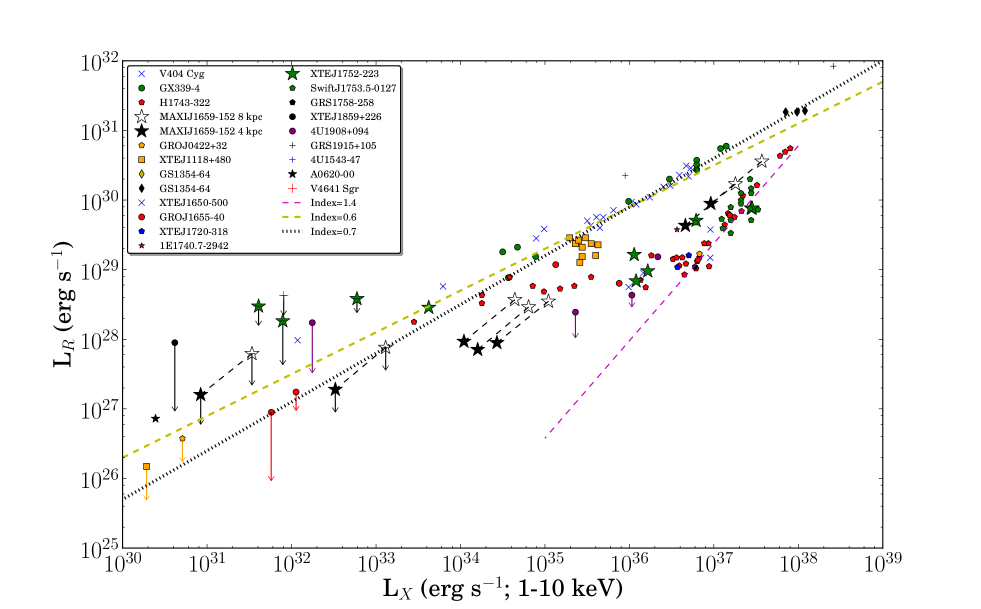
In order to study the relation between accretion and jet ejection in MAXI J1659–152 we add points for MAXI J1659–152 to the known data on the radio – X–ray correlation in BHXBs (Figure 3; cf. Corbel et al. 2003; Gallo et al. 2003; Jonker et al. 2004; Calvelo et al. 2010; Coriat et al. 2011; Miller-Jones et al. 2011a; Soleri & Fender 2011). From Figure 3 it seems that MAXI J1659–152 follows the steeper correlation between the radio and X–ray luminosity at high X–ray luminosities (erg s-1) during the start of the outburst (Gallo et al. 2012), although it is not certain that the two observations reflect the optically thick synchrotron emission typical for the low-hard state. For instance, van der Horst et al. (2010) report a linear polarization of 23 per cent for the WSRT observation on Sept. 26, 2010 which is significantly higher than the 10 per cent maximum for the linear polarisation for optically-thick synchrotron emission (Longair 1994). Furthermore, the source started a gradual transition to the soft state at the end of September 2010 (Kalamkar et al. 2011; Kuulkers et al. 2010b), hence this possibly also affects the radio flux during the EVN observation on Sept. 30. In addition, the EVN observation may resolve out some of the emission. Finally, sub–millimeter observations at 23:30 UT on Sept. 25, 2010 (de Ugarte Postigo et al. 2010), just prior to the WSRT observation of Sept. 26, 2010 found the source at 12.62.4 mJy, a flux significantly higher than that at 4.8 GHz measured 15 hrs later with the WSRT. The high degree of linear polarisation together with the information on the sub–millimeter – 4.8 GHz spectral energy distribution suggests that short–lived, transient, optically thin radio events contributed to the 4.8 GHz radio flux, similar to the GHz radio emission observed by Jonker et al. (2010) in H 1743–322.
During the decay of the outburst as traced by our EVLA and Chandra/Swift observations the source seems to make the transition from the steep branch in the direction of the standard radio – X–ray correlation with power–law index between 0.6 and 0.7, similar to what has been observed by Coriat et al. (2011) for H 1743–322 and by Ratti et al. (2012; accepted) for XTE J1752-223. Although we only have information for two radio – X–ray observations when the source was brighter than erg s-1 those two points have a lower X–ray luminosity than the bulk of sources in this regime, or conversely, a higher radio luminosity, whereas the correlation index seems to be close to the index of 1 of the sources in this branch (Gallo et al. 2012).
At present there is no clear explanation for the steeper slope of index . Potentially, a value of for the power–law index can be explained by optically thin radio emission and radiatively inefficient emission of X–rays as both radio luminosity and X–ray luminosity would scale as the mass accretion rate squared in that case (cf. Falcke & Biermann 1995 and cf. Narayan & Yi 1995, respectively). However, if many optically thin flares would be dominating the radio luminosity, one would naively expect the sources to fall at higher luminosities than those sources following the ’standard’ correlation, the latter being a minimum non–flaring track.
The fact that MAXI J1659–152 falls to the low X–ray luminosity side of the main pack of sources following this steeper correlation can, however, potentially be explained by the high inclination under which we view MAXI J1659–152. If the X–ray emission is formed close to the black hole and accretion disc, its luminosity is reduced because of the high inclination (Fujimoto 1988 and Narayan & McClintock 2005). The radio luminosity will not be hindered by the (partial) self–obscuration and reduced aspect of the source as the radio emission is thought to be formed further out than the X–rays (here, we assume that the radio–jet axis is not nearly parallel to the binary orbital plane). It is unclear if the bulk of the X–ray emission is indeed formed close to the black hole, though. This effect could also slightly alter, i.e. lower, the index of the radio – X–ray correlation. This would thus lead to inclination–dependent scatter on the slope of the sources in the radio – X–ray correlation. Note that Soleri & Fender (2011) investigated whether there is a relation between the correlation that sources trace in the radio – X–ray luminosity plane with inclination but found none. This could mean that any effect of the inclination would only become apparent in sources where the inclination angle is very high. MAXI J1659–152 may be the only known example of such a very high inclination so far. Alternatively, the fact that MAXI J1659–152 has a higher normalization than the main group of sources following the steeper power–law index is 1 correlation could be due to a higher–than–average radio luminosity potentially caused by the presence of radio flares as we discussed above (see also Jonker et al. 2010).
Interestingly, at an X–ray luminosity of 3.3–1.3erg s-1 MAXI J1659–152 was not detected at limits well below the radio luminosity that would be expected extrapolating the correlation for GX 339–4 (see green dashed line Figure 3). Possibly the correlation index is steeper for some sources (Miller-Jones et al. 2011a noted that the best–fit to the data of A0620–00, V404 Cyg and GX 339–4 gives a power–law index of 0.67). Besides our measurements on MAXI J1659–152 other sources may fall below the correlation with index 0.6 at low luminosities as well (e.g. the upper limit to the radio luminosity for XTE J1118+480; cf. Miller-Jones et al. 2011a) although there is uncertainty on the normalization due to distance uncertainties (Jonker & Nelemans 2004; Jonker et al. 2004). Nevertheless, our radio non–detection for an X–ray luminosity of 3.3erg s-1–1.3erg s-1, for a distance of 4 and 8 kpc, respectively is constraining. The discrepancy could be alleviated if the source distance is more than 8 kpc, but this would make the quiescent X–ray luminosity higher still. Only if our lowest measured X–ray flux is not close to the true quiescent X–ray flux and if the source is more than 10 kpc away is the source behaviour consistent with that found for other BHTs before.
Acknowledgments
PGJ acknowledges support from a VIDI grant from the Netherlands Organisation for Scientific Research. Support for this work was provided by the National Aeronautics and Space Administration through Chandra Award Number GO0-11058A issued by the Chandra X-ray Observatory Center, which is operated by the Smithsonian Astrophysical Observatory for and on behalf of the National Aeronautics Space Administration under contract NAS8-03060. This research has made use of the SIMBAD database, operated at CDS, Strasbourg, France, of NASA’s Astrophysics Data System Bibliographic Services, of SAOImage DS9, developed by Smithsonian Astrophysical Observatory, of software provided by the Chandra X-ray Center (CXC) in the application packages CIAO, and of the XRT Data Analysis Software (XRTDAS) developed under the responsibility of the ASI Science Data Center (ASDC), Italy.
References
- Arnaud (1996) Arnaud K. A., 1996, in ASP Conf. Ser. 101: Astronomical Data Analysis Software and Systems V, Vol. 5, p. 17
- Belloni (2010) Belloni T. M., 2010, X-ray Astronomy 2009; Present Status, Multi-Wavelength Approach and Future Perspectives, 1248, 107
- Cadolle Bel et al. (2007) Cadolle Bel M., Ribó M., Rodriguez J., Chaty S., Corbel S., Goldwurm A., Frontera F., Farinelli R., D’Avanzo P., Tarana A., Ubertini P., Laurent P., Goldoni P., Mirabel I. F., 2007, ApJ, 659, 549
- Calvelo et al. (2010) Calvelo D. E., Fender R. P., Russell D. M., Gallo E., Corbel S., Tzioumis A. K., Bell M. E., Lewis F., Maccarone T. J., 2010, MNRAS, 409, 839
- Cantrell et al. (2010) Cantrell A. G., Bailyn C. D., Orosz J. A., McClintock J. E., Remillard R. A., Froning C. S., Neilsen J., Gelino D. M., Gou L., 2010, ApJ, 710, 1127
- Cash (1979) Cash W., 1979, ApJ, 228, 939
- Corbel et al. (2008) Corbel S., Koerding E., Kaaret P., 2008, MNRAS, 389, 1697
- Corbel et al. (2003) Corbel S., Nowak M. A., Fender R. P., Tzioumis A. K., Markoff S., 2003, A&A, 400, 1007
- Coriat et al. (2011) Coriat M., Corbel S., Prat L., Miller-Jones J. C. A., Cseh D., Tzioumis A. K., Brocksopp C., Rodriguez J., Fender R. P., Sivakoff G. R., 2011, MNRAS, 414, 677
- Davis (2001) Davis J. E., 2001, ApJ, 562, 575
- de Ugarte Postigo et al. (2010) de Ugarte Postigo A., Lundrgren A., Wyrowski F., Thoene C. C., Castro-Tirado A. J., Gorosabel J., Jelinek M., 2010, GRB Coordinates Network, 11304, 1
- Falcke & Biermann (1995) Falcke H., Biermann P. L., 1995, A&A, 293, 665
- Fender et al. (2009) Fender R. P., Homan J., Belloni T. M., 2009, MNRAS, 396, 1370
- Frank et al. (2002) Frank J., King A., Raine D. J., 2002, Accretion Power in Astrophysics: Third Edition. Juhan Frank, Andrew King, and Derek J. Raine. Cambridge University Press, 2002, 398 pp.
- Fujimoto (1988) Fujimoto M. Y., 1988, ApJ, 324, 995
- Gallo et al. (2006) Gallo E., Fender R. P., Miller-Jones J. C. A., Merloni A., Jonker P. G., Heinz S., Maccarone T. J., van der Klis M., 2006, MNRAS, 370, 1351
- Gallo et al. (2003) Gallo E., Fender R. P., Pooley G. G., 2003, MNRAS, 344, 60
- Gallo et al. (2012) Gallo E., Miller B., Fender R., 2012, ArXiv e-prints
- Garcia et al. (2001) Garcia M. R., McClintock J. E., Narayan R., Callanan P., Barret D., Murray S. S., 2001, ApJ, 553, L47
- Garmire (1997) Garmire G. P., 1997, in Bulletin of the American Astronomical Society, Vol. 29, Bulletin of the American Astronomical Society, pp. 823–+
- Gelino & Harrison (2003) Gelino D. M., Harrison T. E., 2003, ApJ, 599, 1254
- Hannikainen et al. (1998) Hannikainen D. C., Hunstead R. W., Campbell-Wilson D., Sood R. K., 1998, A&A, 337, 460
- Homan et al. (2005) Homan J., Buxton M., Markoff S., Bailyn C. D., Nespoli E., Belloni T., 2005, ApJ, 624, 295
- Horne (1985) Horne K., 1985, MNRAS, 213, 129
- Hynes et al. (2009) Hynes R. I., Bradley C. K., Rupen M., Gallo E., Fender R. P., Casares J., Zurita C., 2009, MNRAS, 399, 2239
- Jonker et al. (2004) Jonker P. G., Gallo E., Dhawan V., Rupen M., Fender R. P., Dubus G., 2004, MNRAS, 351, 1359
- Jonker et al. (2010) Jonker P. G., Miller-Jones J., Homan J., Gallo E., Rupen M., Tomsick J., Fender R. P., Kaaret P., Steeghs D. T. H., Torres M. A. P., Wijnands R., Markoff S., Lewin W. H. G., 2010, MNRAS, 401, 1255
- Jonker & Nelemans (2004) Jonker P. G., Nelemans G., 2004, MNRAS, 354, 355
- Kalamkar et al. (2011) Kalamkar M., Homan J., Altamirano D., van der Klis M., Casella P., Linares M., 2011, ApJ, 731, L2
- Kalamkar et al. (2010) Kalamkar M., Yang Y., Altamirano D., Casella P., Linares M., Patruno A., Armas-Padilla M., Cavecchi Y., Degenaar N., Russell D., Kaur R., van der Klis M., Watts A., Wijnands R., Rea N., 2010, The Astronomer’s Telegram, 2881, 1
- Kaur et al. (2012) Kaur R., Kaper L., Ellerbroek L. E., Russell D. M., Altamirano D., Wijnands R., Yang Y.-J., D’Avanzo P., de Ugarte Postigo A., Flores H., Fynbo J. P. U., Goldoni P., Thöne C. C., van der Horst A., van der Klis M., Kouveliotou C., Wiersema K., Kuulkers E., 2012, ApJ, 746, L23
- Kennea et al. (2011) Kennea J. A., Romano P., Mangano V., Beardmore A. P., Evans P. A., Curran P. A., Krimm H. A., Markwardt C. B., Yamaoka K., 2011, ApJ, 736, 22
- Kong et al. (2010) Kong A. K. H., Lin C.-C., Chen Y.-T., Price P. A., Magnier E., Chambers K., Kaiser N., Morgan J., Burgett W., Heasley J., Sweeney W., Waters C., Flewelling H., Tonry J., 2010, The Astronomer’s Telegram, 2976, 1
- Kuulkers et al. (2010a) Kuulkers E., Ibarra A., Pollock A., Parmar A., Chenevez J., Kouveliotou C., van der Horst A. J., Paragi Z., Granot J., Taylor G. B., 2010a, The Astronomer’s Telegram, 2912, 1
- Kuulkers et al. (2010b) Kuulkers E., Kouveliotou C., Chenevez J., van der Horst A. J., 2010b, The Astronomer’s Telegram, 2888, 1
- Kuulkers et al. (2011) Kuulkers E., Kouveliotou C., van der Horst A. J., Belloni T., Chenevez J., Ibarra A., Munoz-Darias T., Bazzano A., Cadolle Bel M., De Cesare G., Diaz Trigo M., Jourdain E., Lubinski P., Natalucci L., Ness J. ., Parmar A., Pollock A. M. T., Rodriguez J., Roques J. ., Sanchez-Fernandez C., Ubertini P., Winkler C., 2011, ArXiv e-prints
- Longair (1994) Longair M. S., 1994, High energy astrophysics. Volume 2. Stars, the Galaxy and the interstellar medium., Longair, M. S., ed.
- Mangano et al. (2010) Mangano V., Hoversten E. A., Markwardt C. B., Sbarufatti B., Starling R. L. C., Ukwatta T. N., 2010, GRB Coordinates Network, 11296, 1
- Marsh et al. (1994) Marsh T. R., Robinson E. L., Wood J. H., 1994, MNRAS, 266, 137
- Matsuoka et al. (2009) Matsuoka M., Kawasaki K., Ueno S., Tomida H., Kohama M., Suzuki M., Adachi Y., Ishikawa M., Mihara T., Sugizaki M., Isobe N., Nakagawa Y., Tsunemi H., Miyata E., Kawai N., Kataoka J., Morii M., Yoshida A., Negoro H., Nakajima M., Ueda Y., Chujo H., Yamaoka K., Yamazaki O., Nakahira S., You T., Ishiwata R., Miyoshi S., Eguchi S., Hiroi K., Katayama H., Ebisawa K., 2009, PASJ, 61, 999
- McClintock & Remillard (2006) McClintock J. E., Remillard R. A., 2006, Black hole binaries, Lewin, W. H. G. & van der Klis, M., ed., pp. 157–213
- McMullin et al. (2007) McMullin J. P., Waters B., Schiebel D., Young W., Golap K., 2007, in Astronomical Society of the Pacific Conference Series, Vol. 376, Astronomical Data Analysis Software and Systems XVI, R. A. Shaw, F. Hill, & D. J. Bell, ed., p. 127
- Miller-Jones et al. (2011a) Miller-Jones J. C. A., Jonker P. G., Maccarone T. J., Nelemans G., Calvelo D. E., 2011a, ApJ, 739, L18
- Miller-Jones et al. (2011b) Miller-Jones J. C. A., Madej O. K., Jonker P. G., Homan J., Ratti E. M., Torres M. A. P., 2011b, The Astronomer’s Telegram, 3358, 1
- Muñoz-Darias et al. (2011) Muñoz-Darias T., Motta S., Stiele H., Belloni T. M., 2011, MNRAS, 415, 292
- Narayan & McClintock (2005) Narayan R., McClintock J. E., 2005, ApJ, 623, 1017
- Narayan & Yi (1995) Narayan R., Yi I., 1995, ApJ, 452, 710
- Paragi et al. (2010) Paragi Z., van der Horst A. J., Granot J., Taylor G. B., Kouveliotou C., Garrett M. A., Wijers R. A. M. J., Ramirez-Ruiz E., Kuulkers E., Gehrels N., Woods P. M., 2010, The Astronomer’s Telegram, 2906, 1
- Perley et al. (2011) Perley R. A., Chandler C. J., Butler B. J., Wrobel J. M., 2011, ApJ, 739, L1
- Rea et al. (2011) Rea N., Jonker P. G., Nelemans G., Pons J. A., Kasliwal M. M., Kulkarni S. R., Wijnands R., 2011, ApJ, 729, L21
- Reynolds et al. (2008) Reynolds M. T., Callanan P. J., Robinson E. L., Froning C. S., 2008, MNRAS, 387, 788
- Rodriguez et al. (2007) Rodriguez J., Cadolle Bel M., Tomsick J. A., Corbel S., Brocksopp C., Paizis A., Shaw S. E., Bodaghee A., 2007, ApJ, 655, L97
- Russell et al. (2006) Russell D. M., Fender R. P., Hynes R. I., Brocksopp C., Homan J., Jonker P. G., Buxton M. M., 2006, MNRAS, 371, 1334
- Shahbaz & Kuulkers (1998) Shahbaz T., Kuulkers E., 1998, MNRAS, 295, L1
- Shaposhnikov et al. (2007) Shaposhnikov N., Swank J., Shrader C. R., Rupen M., Beckmann V., Markwardt C. B., Smith D. A., 2007, ApJ, 655, 434
- Soleri & Fender (2011) Soleri P., Fender R., 2011, MNRAS, 413, 2269
- van der Horst et al. (2010) van der Horst A. J., Granot J., Paragi Z., Kouveliotou C., Wijers R. A. M. J., Ramirez-Ruiz E., 2010, The Astronomer’s Telegram, 2874, 1
- Xue & Cui (2007) Xue Y. Q., Cui W., 2007, A&A, 466, 1053
- Yuan & Cui (2005) Yuan F., Cui W., 2005, ApJ, 629, 408