Herschel/HIFI††thanks: Herschel is an ESA space observatory with science instruments provided by European-led Principal Investigator consortia and with important participation from NASA. observation of highly excited rotational lines of HNC toward IRC +10 216††thanks: Based on observations carried out with the IRAM 30-meter telescope. IRAM is supported by INSU/CNRS (France), MPG (Germany) and IGN (Spain).
We report the detection in emission of various highly excited rotational transitions of HNC ( = 6-5 through =12-11) toward the carbon-star envelope IRC +10 216 using the HIFI instrument on-board the Herschel Space Observatory. Observations of the = 1-0 and = 3-2 lines of HNC with the IRAM 30-m telescope are also presented. The lines observed with HIFI have upper level energies corresponding to temperatures between 90 and 340 degrees Kelvin, and trace a warm and smaller circumstellar region than that seen in the interferometric maps of the = 1-0 transition, whose emission extends up to a radius of 20″. After a detailed chemical and radiative transfer modeling, we find that the presence of HNC in the circumstellar envelope of IRC +10 216 is consistent with formation from the precursor ion HCNH+, which in turn is produced through several proton transfer reactions which are triggered by the cosmic-ray ionization. We also find that the radiative pumping through 21 m photons to the first excited state of the bending mode plays a crucial role to populate the high- HNC levels involved in the transitions observed with HIFI. Emission in these high- rotational transitions of HNC is expected to be strong in regions which are warm and dense and/or have an intense infrared flux at wavelengths around 21 m.
Key Words.:
astrochemistry — line: identification — molecular processes — stars: AGB and post-AGB — circumstellar matter — stars: individual (IRC +10 216)1 Introduction
Hydrogen isocyanide (HNC), a metastable isomer of HCN lying 0.6 eV higher in energy, is ubiquitous in the interstellar medium. First observed in several objects through a line at 90.7 GHz (e.g. Zuckerman et al. 1972), the definitive confirmation of this line, the = 1-0 rotational transition of HNC, came through spectroscopic laboratory experiments in the late 1970s (Blackman et al., 1976). HNC is widely observed in different types of astronomical regions, such as diffuse clouds (Liszt & Lucas, 2001), cold dark clouds (Hirota et al., 1998), star-forming regions (Schilke et al., 1992), circumstellar envelopes around evolved stars (Bujarrabal et al., 1994), external galaxies (Aalto et al., 2002), and even in high redshift objects (Guélin et al., 2007). The main formation mechanism of HNC is thought to be the dissociative recombination of the ion HCNH+ (Semaniak et al., 2001). HNC has mostly been observed only in the = 1-0 transition at 3.3 mm, preventing to carry out a detailed excitation analysis (Sarrasin et al., 2010).
The HIFI instrument on-board the Herschel Space Observatory, operating in the 480-1910 GHz frequency range, allows to cover high-energy rotational transitions of HNC. In this study, we present the detection in the C-star envelope of IRC +10 216 of the = 6-5 through = 12-11 rotational transitions of HNC. Observations of the = 1-0 and = 3-2 transitions obtained with the IRAM 30-m telescope are also presented. The large set of observed lines allows us to investigate in detail the abundance distribution and excitation of HNC in IRC +10 216’s circumstellar envelope.
2 Observations and results
The HIFI observations were obtained in the context of a high resolution line survey of IRC +10 216 (Cernicharo et al., 2010). The data were taken in double beam-switching mode with a spectral resolution of 1.1 MHz and channel spacings of 0.5 MHz, and processed using the standard Herschel pipeline up to Level 2, providing fully calibrated spectra. The HNC lines where all observed around the maximum luminosity, i.e. phase . For details regarding the reduction procedure we refer to Cernicharo et al. (2010). The total integration time per frequency setting ranged from 2 to 14 minutes, resulting in antenna temperature rms noise levels of 8-15 mK per 1.1 MHz channel for the HNC spectra in bands 1a, 2a, 2b, and 3a, and of 50 mK for the spectra above 900 GHz. At the frequencies of the HNC lines observed by HIFI ( = 6-5 through = 12-11), the beam sizes range from 39″ down to 20″, and is therefore comparable to the size of the emitting region of HNC in IRC +10 216. The = 1-0 transition, as mapped with the IRAM Plateau de Bure Interferometer (PdBI), shows a ring-like distribution extending up to a radius of nearly 20″(see Guélin et al. 1997), and the higher- transitions observed with HIFI are expected to have a more compact distribution.
The = 1-0 transition of HNC was observed before 2009 with the IRAM 30-m telescope in the course of a 3 mm spectral line survey of IRC +10 216 (Cernicharo et al., in prep.). The achieved rms noise level after averaging different spectra at the frequency of the = 1-0 line is 3 mK per 1 MHz channel. The = 3-2 line was observed in January 2010 during a 0.9 mm spectral line survey of IRC +10 216 (Kahane et al., in prep.), using the new EMIR receivers. The line was observed with a spectral resolution of 2 MHz during about 3 h of good atmospheric conditions ( = 800 K) resulting in a rms noise level of 6 mK per channel. Additionnaly, we make use of the PdBI observations of the line. These observations are described in Guélin et al. (1997) and references therein.
| vLSR | vexpa | v | b | ||
| (MHz) | (km s-1) | (km s-1) | (K km s-1) | ||
| 1-0 | 90663.6 | -26.3(1) | 15.4(2) | 44.9(8) | 0.80 |
| 3-2 | 271981.1 | -26.4(1) | 14.4(1) | 60.7(10) | 0.52 |
| 6-5 | 543897.6 | -26.2(3) | 12.6(3) | 3.53(5) | 0.75 |
| 7-6 | 634510.8 | -26.7(4) | 12.3(4) | 2.75(6) | 0.75 |
| 8-7 | 725107.3 | -26.7(4) | 12.5(4) | 2.87(8) | 0.75 |
| 9-8 | 815684.7 | -25.6(7) | 12.4(7) | 1.95(15) | 0.75 |
| 10-9 | 906240.5 | -25.8(15) | 10.5(20) | 1.23(25) | 0.74 |
| 11-10 | 996772.3 | -27.4(15) | 13.6(18) | 1.55(22) | 0.74 |
| 12-11 | 1087277.9 | -25.3(10) | 12.2(12) | 0.94(20) | 0.74 |
Note.– Number in parentheses are 1 uncertainties in units of the last digits. a vexp is the half width at zero level. b is the efficiency parameter used to convert antenna temperature () into main beam brightness temperature.
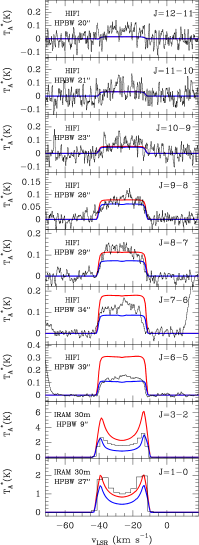
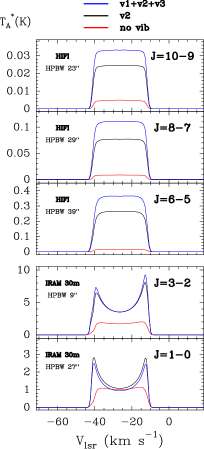
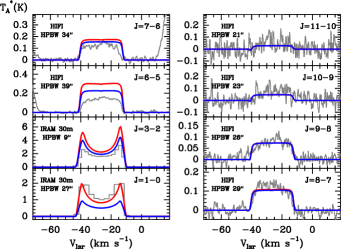
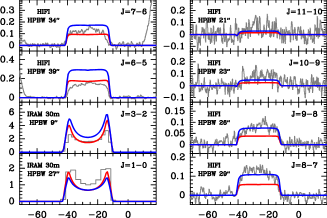
The observed lines of HNC are shown in Fig. 1 and the line and telescope parameters are given in Table 1. All the lines appear free of contamination from other lines. The = 1-0 and = 3-2 lines observed with the IRAM 30-m telescope are the most intense ones and show a U-shaped profile, typical of optically thin emission resolved by the telescope. On the other hand, the lines observed with HIFI show a flat-topped profile, which is typical of optically thin lines not resolved by the telescope, i.e. geometrically diluted in the main beam of HIFI.
3 Modeling
To learn about the excitation conditions and the formation mechanism of HNC in the envelope of IRC +10 216 we have carried out modeling tasks. The model, basically taken from Fonfría et al. (2008) and Agúndez (2009), considers the presence of a central star with an effective temperature K and a radius cm, surrounded by a spherical envelope of gas and dust. The adopted mass loss rate is M yr-1, with a distance of 130 pc, and a terminal expansion velocity of 14.5 km s-1. Following Cordiner & Millar (2009), we consider the presence of density-enhanced shells.
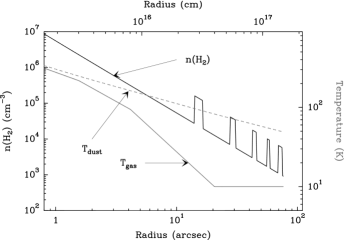
The gas temperature profile was derived using 12CO and 13CO HIFI and IRAM 30-m observations. The adopted 12CO abundance relative to H2 was and the 12CO/13CO abundance ratio 45 (Kahane et al., 2000). The best fit to the whole set of lines is given by a 3-fold power law, i.e. with for , for and for greater radii, with the scale fixed by setting at . The estimated uncertainty in is of 50 %. The physical parameters that describe the circumstellar envelope, i.e. the dust and gas temperature as well as the H2 volume density are presented in Fig. 2.
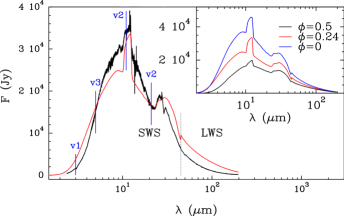
As will be shown below, infrared (IR) pumping to excited vibrational states of HNC plays an important role in the excitation of the observed lines. Hence, a good description of the IR flux is needed. For that purpose the spectral energy distribution (SED) observed by ISO at phase (Cernicharo et al., 1999) has been modeled to derive dust opacities suitable for IRC +10 216, which are given by a mixture of silicon carbide, amorphous carbon and MgS dust grains (see Fig. 3). The HNC lines were observed at phase , around the maximum luminosity. Therefore, the dust temperature and SED were recomputed modifying the star radius accordingly and using photometric points observed at maximum (Le Bertre, 1992). More details concerning the modeling of IRC +10 216’s SED can be found in De Beck et al. (2012). The parameters used in the present study to describe the dust (i.e. the dust opacities and dust-temperature profile) are the same as those described in the latter article. The differences in the computed SEDs mainly come from the inclusion of the density-enhanced shells (see Sect. 4), of which the main effect is that the flux at wavelengths longer than 25 um is slightly increased.
3.1 Chemical model
The chemical composition of the gas has been computed as it expands from a radius of cm up to 1018 cm. To deal with the density-enhanced shells we have proceeded as Cordiner & Millar (2009), running a model for the smooth component of the envelope and another for a density-enhanced shell. The cosmic-ray ionization rate of H2 is taken as 1.2 10-17 s-1 (Agúndez & Cernicharo, 2006) and the ultraviolet interstellar radiation field of Draine (1978) is adopted. The chemical network comprises 470 gas phase species (composed of H, He, C, N, O, Si, P, and S) linked by 7400 reactions, whose rate constants are taken from databases such as udfa06111See http://www.udfa.net (Woodall et al., 2007) and from the recent literature on chemical kinetics. The abundances at the initial radius are taken from Agúndez (2009).
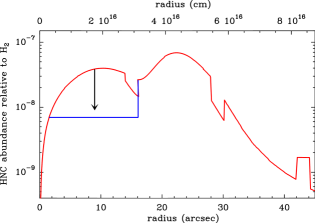
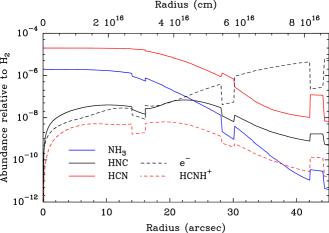
The resulting abundance distribution of HNC in the envelope of IRC +10216 is plotted in Fig. 4 and the abundance of the species chemically related to HNC in Fig. 5. Apart from the abrupt changes at 15″, 29″, and 43″, which correspond to the presence of density-enhanced shells, we see that the fractional abundance of HNC starts to increase at small radii, well before the molecular shell located at 15″. This occurs because the formation of HNC is, to a large extent, driven by cosmic rays that can penetrate deeper in the envelope than interstellar ultraviolet photons. In the regions inward of cm, HNC is mostly formed through the reaction:
| (1) |
Ammonia is relatively abundant in the inner layers of IRC +10 216 (2 10-6 relative to H2; Hasegawa et al. 2006), while the precursor ion HCNH+ is formed from several reactions of proton transfer to HCN (a species which is also fairly abundant in the inner envelope of IRC +10 216, relative to H2 according to Fonfría et al. 2008):
| (2) |
| (3) |
| (4) |
These processes are driven by the cosmic-ray ionization of H2 and the subsequent fast formation of H, which yields HCO+ and C2H through proton transfer to CO and C2H2, respectively. Reactions (1–4) have been experimentally found to be rapid (rate constants are in excess of 10-9 cm3 s-1 at 300 K; Anicich 2003). For reaction (1), however, it is not clear what are the branching ratios yielding HCN and HNC, so that we consider that both channels occur at the same rate, as is done by e.g. the databases udfa061 and KIDA222See http://kida.obs.u-bordeaux1.fr. This assumption will be discussed in Sect. 4.
The peak abundance of HNC, 7 10-8 relative to H2, is reached beyond 1016 cm, concretely at about 4 1016 cm. In this region the formation of HNC occurs mostly through the reactions:
| (5) |
| (6) |
where the formation of HCNH+ is again driven by cosmic rays while reaction (6) occurs as a consequence of the photochemistry, with atomic carbon and NH2 coming from the photodissociation of acetylene and ammonia, respectively. Reaction (5) has been well studied in the laboratory (Semaniak et al., 2001), but there are still some uncertainties regarding the branching ratios yielding HCN and HNC. On the other hand, the kinetics of reaction (6) is poorly known and the rate constant has been taken from an estimate of Smith et al. (2004). The destruction of HNC in IRC +10 216’s envelope is dominated by photodissociation, for which the rate is taken from udfa061. Despite the lack of accurate branching ratios and rate constants for some of the reactions involved in HNC formation, its predicted abundance has the right order of magnitude, although these inaccuracies may introduce some errors in the abundance radial distribution calculated, as will be shown in Sect. 4.
3.2 Radiative transfer model
The radiative transfer calculations were performed with the code described in Daniel & Cernicharo (2008). The first 20 rotational levels of HNC in the ground and in the excited vibrational states (bending mode at 21 m with -type doubling), (NH stretching mode at 2.7 m), and (NC stretching mode at 4.9 m) were included with the spectroscopic parameters given by Maki & Mellau (2001). The experimental electric dipole moment of HNC, 3.05 Debye (Blackman et al., 1976), was used for the rotational transitions in each vibrational state. For ro-vibrational transitions the dipole moments were taken from Harris et al. (2002). The collisional rate coefficients computed by Dumouchel et al. (2010) for the first 26 rotational levels and for temperatures between 5 and 500 K were used for pure rotational transitions. For the densities prevailing in the region where HNC has a significant abundance, the collisional excitation of the vibrational levels of HNC is expected to be negligible (c.f. Sect. 4). Therefore, for ro-vibrational transitions, the same set of rate coefficients was used but they were scaled down by an arbitrary factor of 100.
4 Results
The HNC line profiles that result from the abundance distribution given by the chemical model are plotted in Fig. 1, as red lines. It is seen that the model overestimates the intensity of some of the HIFI lines, in particular the . A better overall agreement is obtained if the abundance of HNC is lowered to , relative to H2, for (see blue lines in Fig. 4 and Fig. 1). It, thus, seems that the chemical model overestimates the abundance of HNC in the regions inward of 15″ by a factor of .
4.1 HNC excitation
The influence of the different vibrational excited states on the excitation of the observed HNC lines is illustrated in Fig. 6. It is seen that the line intensities are largely increased when the =1 state is included, and to a lesser extent when the the stretching modes are considered. From the results shown in this figure, it is concluded that the excitation of HNC rotational levels is mainly dominated by infrared pumping to the excited vibrational states, and to a lesser extent by inelastic collisions. Therefore, results should not be substantially altered by the uncertainty in the profile, something that has been checked adopting alternative profiles. We note that this also validates the use of an arbitrary set of ro-vibrational collisional rate coefficients. This point has been checked by considering scaling factors that differ by a factor 2 with respect to the value of 100 used to scale down the ro-vibrational rate coefficients. No differences were found between the various results. Owing to the efficiency of the radiative pumping to the vibrational levels, the accuracy of the radiative-transfer model largely relies upon the correctness of the SED. In order to test the error that would result from inaccuracies in the SED modeling, we adopted alternate models for the dust composition, that result in qualitatively good representations of the overall SED, but with variations in its shape (i.e. with maximum variations of the order of 10-20% at a given frequency, in comparison to the current model). From these tests, it is concluded that the line fluxes will show variations of the same order as the variations observed for the continuum at 11 and 21 . Thus, even if the quality of the SED can play a role in explaining the differences observed between the observations and the model, the effect should be modest and may not explain the differences observed (a factor 2 for the line).
4.2 Density-enhanced shells
Another aspect worth considering is the inclusion of density enhanced shells. Such shells have been characterized through optical imaging by Mauron & Huggins (2000) and would originate from an episodic increase of the mass loss rate of the star. From this study, it appears that their exact characterization is complex: rather than continuous spherical shells, various disrupted arcs of matter are detected. These shells have more recently been characterized with the PACS instrument on-board Herschel (Decin et al., 2011). This study shows that the shell structure extend at least out to 320″ and that the shells have a density which is typically enhanced by a factor 4 with respect to the intershell medium. An attempt in introducing such shells in order to deal with the analysis of molecular emission has been proposed by Cordiner & Millar (2009). These authors introduce 2″ wide shells with an intershell distance of 12″. This model is successful in reproducing the spatial distribution of CnH molecular species, and we therefore adopted the same structure for the shells in the current work.
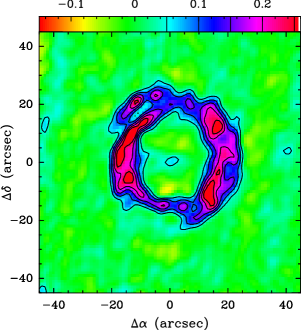
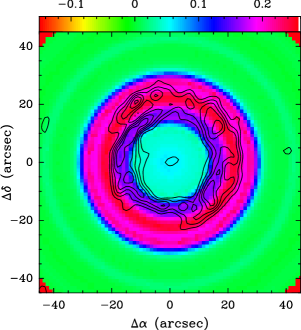
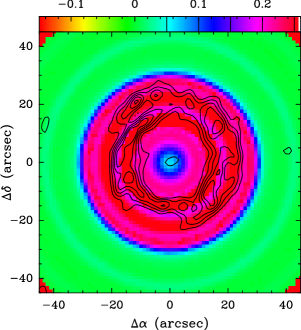
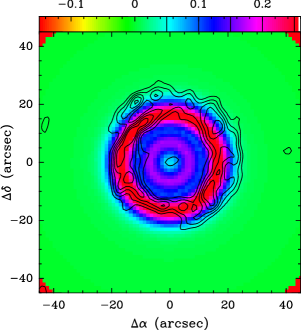
The main effect introduced by these shells is on the radial profile of the molecular abundance predicted by the chemical modeling. Indeed, without density-enhanced shells, the photodissociation of the molecules is efficient down to smaller radii, as compared to a model including such shells, and therefore the peak abundance of the molecules formed by photochemistry is shifted inward. This result is similar to the one described by De Beck et al. (2012) while dealing with the interpretation of the C2H HIFI observations. This is illustrated in Fig. 8 for the case of HNC where the abundance of the molecule is presented for the two models. The line profiles obtained for the two HNC radial distributions are shown in Fig. 9. Except for the line, omitting the density-enhanced shells would result in a better agreement between the model and observations. Still, in the model without density-enhanced shells, the line is overestimated, the intensity being 35% higher in the model in comparison to the observation. Fig. 7 shows the flux of the line, integrated over a 10 km/s wide interval centered on the of the source. Panel (a) corresponds to the IRAM Plateau de Bure observations described in Guélin et al. (1997). In this figure, the extent of the emission predicted by the models is shown for various cases: (b) with density-enhanced shells and including a central drop in the HNC abundance, as derived from the HIFI observations (c) with density-enhanced shells, with the abundance profile predicted by the chemical modeling (d) without density-enhanced shells and with the abundance profile predicted by the chemical modeling. First, a comparison of panels (c) and (d) shows that the inclusion of the density-enhanced shells has a profound influence on the extent of the emission. As commented previously, the density-enhanced shells attenuate the UV field, reducing the amount of photodissociation. This entails that the inclusion of the density-enhanced shells increases the extent of the emission of the line to larger radii. Comparing the prediction of the two models with the observations, it seems that a good fit to the observations would correspond to a structure intermediate, in the sense of the attenuation of the external UV field, to the models with and without density-enhanced shells considered here. Moreover, none of these models is able to reproduce the extent of the ring-shaped structure which is observed. On the other hand, and considering panel (b), we see that the central drop introduced to fit the HNC lines observed with HIFI permits to reproduce this ring-shaped structure. Moreover, we note that such a decrease in the HNC abundance would have to be introduced in any model intermediate to the two models presented in Fig. 8. Indeed, the model without density-enhanced shells corresponds to the lowest abundance possible for HNC, as predicted by the chemical modeling, for radii . Whatever could be the structure considered for the shells, the abundance of HNC would have to be reduced in this region in order to reproduce the observed line and to fit the ring-shaped structure of the emission. Finally, by considering various studies that deal with the geometrical structure of IRC +10 216, it is evident that density-enhanced shells are present in the source and have to be included (e.g. Mauron & Huggins, 2000; Cordiner & Millar, 2009; De Beck et al., 2012). However, the model adopted in the present study is a simplification of the exact structure of the shell morphology which is observed through optical imaging (Mauron & Huggins, 2000) or through CO lines (Fong et al., 2003; Cernicharo et al., 2012) and this introduces a source of uncertainty in the current modeling. But, as discussed earlier when considering the ”extreme case” of an envelope without density-enhanced shells, the fact that the HNC abundance has to be decreased with respect to the prediction of the chemical modeling should not be altered by the description adopted to model the shells.
4.3 HNC chemistry
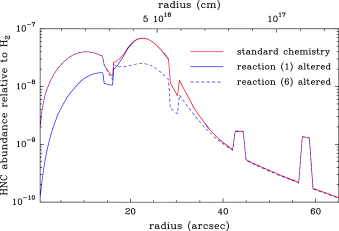
As discussed in Sect. 3.1, the formation of HNC in the region is mainly driven by three reactions, of which two have poorly constrained branching ratios or rate constants. In what follows, we examine how the uncertainties on these reactions, i.e. reactions (1) and (6) of Sect. 3.1, could explain why the chemical modeling overestimates the HNC abundance. Fig. 10 shows the HNC abundance profile obtained by modifying the rate constant of reactions (1) and (6). For the case of reaction (1), the alteration consists in modifying the branching ratio of the reaction and for the curve shown in Fig. 10, the abundance is shown for the case where 75% of the collisions lead to HCN and 25% to HNC. For the case of reaction (6), the abundance shown in Fig. 10 corresponds to the case where this reaction is omitted from the chemical network. For these two cases, the corresponding line profiles are presented in Fig. 11. First, we see from Fig. 10 that altering reaction (1) can introduce a reduction of the HNC abundance for radii below 15″. This is the region where the HNC abundance has been found to be overestimated when modeling the observations. However, considering the line profiles shown in Fig. 11, solely changing the branching ratio of this reaction would not enable to reproduce the observations. Indeed, fitting the line would require to lower the amount of HNC produced via this reaction below 25% and in such a case, the higher excited lines would have their intensities largely underestimated. The removal of reaction (6) from the chemical network modifies the HNC abundance for radii . The effect on the line profile, in comparison to the standard network is rather low, and only lead to a slight lowering of the intensities of the and lines. So within to the current chemical network the most probable source of uncertainty lies in the chemical kinetics of reaction (1) and its branching ratio. We stress that the amount of HNC produced via this reaction also depends on the NH3 abundance. In the case of IRC +10 216, the NH3 abundance in the innermost part of the envelope has been derived to be in the range X(NH3) (Hasegawa et al., 2006; Keady & Ridgway, 1993). In the current model, we assume an abundance that corresponds to the upper limit (see Fig. 2). We tested the lower limit for the NH3 central abundance and found that the decrease in the HNC abundance was lower than in the model where the branching ratio of reaction (1) is modified.
4.4 Conclusion
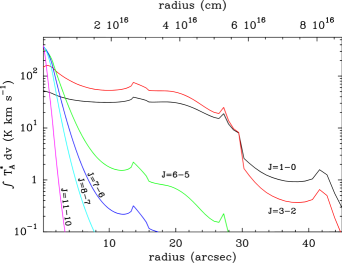
Several conclusions may be obtained from the radiative transfer modeling. Firstly, HNC transitions with higher energies have smaller emitting regions. For instance, the emission region of the high- transitions observed with HIFI is noticeably smaller than that of the = 1-0 transition, which emits up to a radius of 20″ (see Guélin et al. 1997). The model clearly illustrates this on Fig. 12, where the velocity-integrated intensity of various lines is plotted as a function of radius. A second conclusion is that infrared pumping to the =1 state is the main mechanism to populate the HNC rotational levels of the ground vibrational state in IRC +10 216’s envelope. Thus, the emission of high- lines of HNC is favored in regions which are warm and/or have a large radiation flux at 21 m. It is worth here to comment on the detection of HNC =1 in the carbon-rich pre-planetary nebula CRL 618 (Schilke et al., 2003). These authors found that vibrationally excited HNC is confined to the hot circumstellar layers, although it is likely pumped by 21 m photons because of the high radiation flux at this wavelength in CRL 618. In IRC +10 216, the radiative transfer model predicts that rotational lines within the =1 state would have intensities of a few mK, and thus may have escaped detection due to the lack of sensitivity.
5 Summary
The detection of highly excited rotational lines of HNC toward IRC +10 216 evidences the existence of a warm HNC component whose emission arises from regions smaller (extending up to a few arcseconds) than those traced by the fundamental rotational transition, previously mapped at 3 mm with the PdBI, and whose emission extends up to 20″ (see Guélin et al. 1997). These results are still compatible with HNC being formed not close to the star, but in the intermediate and outer layers where cosmic-ray ionization drives the formation of the precursor ion HCNH+. This study has shown that the infrared pumping through the first excited state of the bending mode dominates the excitation of the high- rotational levels involved in the transitions observed with HIFI. Emission in these high- rotational transitions of HNC is expected to be strong in regions where HNC is either present in a warm and dense region and/or surrounded by intense infrared radiation at wavelengths around 21 m.
The present study shows that the HNC abundance can be qualitatively reproduced by the chemical modeling and using the currently available reaction network. However, a quantitative estimate of the HNC abundance points toward multiple origins concerning the discrepancies between observations and the models. The discrepancies may arise from a too simplistic description of the physical structure of the envelope and particularly of the density-enhanced shells. Another origin could be in the description of the SED of the source or, finally, in the uncertainties in the reaction rates, branching ratio and missing reactions in the chemical network. We stress that a 2D description of the chemistry and radiative transfer modeling could enable to disentangle between these various possibilities but such a work would require additional observations in order to constrain the geometrical structure of the source. In the next years, the observing capabilities that will be available through the ALMA interferometer will shed light on this, since the J=1-0, 3-2, 4-3, 7-6 and 9-8 HNC lines could then be observed in this object with high angular resolution.
Acknowledgements.
HIFI has been designed and built by a consortium of institutes and university departments from across Europe, Canada, and the United States (NASA) under the leadership of SRON, Netherlands Institute for Space Research, Groningen, The Netherlands, and with major contributions from Germany, France and the US. Consortium members are Canada: CSA, U. Waterloo; France: CESR, LAB, LERMA, IRAM; Germany: KOSMA, MPIfR, MPS; Ireland: NUI Maynooth; Italy: ASI, IFSI-INAF, Osservatorio Astrofísico di Arcetri-INAF; Netherlands: SRON, TUD; Poland: CAMK, CBK; Spain: Observatorio Astronómico Nacional (IGN), Centro de Astrobiología (INTA-CSIC); Sweden: Chalmers University of Technology - MC2, RSS & GARD, Onsala Space Observatory, Swedish National Space Board, Stockholm University - Stockholm Observatory; Switzerland: ETH Zurich, FHNW; USA: CalTech, JPL, NHSC. M.A. is supported by a Marie Curie Intra-European Individual Fellowship within the European Community 7th Framework Programme under grant agreement n∘ 235753, consolider CSD2009-00038 and AYA2009-07304.References
- Aalto et al. (2002) Aalto, S., Polatidis, A. G., Hüttemeister, S., & Curran, S. J. 2002, A&A, 381, 783
- Agúndez & Cernicharo (2006) Agúndez, M., & Cernicharo, J. 2006, ApJ, 650, 374
- Agúndez (2009) Agúndez, M. 2009, PhD Thesis, Universidad Autónoma de Madrid
- Anicich (2003) Anicich, V. G. 2003, JPL Publication 03-19
- Bechtel et al. (2006) Bechtel, H. A., Steeves, A. H., & Field, R. W. 2006, ApJ, 649, L53
- Blackman et al. (1976) Blackman, G. L., Brown, R. D., Godfrey, P. D., & Gunn, H. I. 1976, Nature, 261, 395
- Bujarrabal et al. (1994) Bujarrabal, V., Fuente, A., & Omont, A. 1994, A&A, 285, 247
- Cernicharo et al. (1999) Cernicharo, J., Yamamura, I., González-Alfonso, E., et al. 1999, ApJ, 526, L41
- Cernicharo et al. (2010) Cernicharo, J., Waters, L. B. F. M., Decin, L., et al., 2010, A&A, 521, L8
- Cernicharo et al. (2012) Cernicharo, J., Marcelino, N., Agúndez, M., Guélin, M. et al., 2012, A&A, to be submitted
- Cordiner & Millar (2009) Cordiner, M. A. & Millar, T. J. 2009, ApJ, 697, 68
- Daniel & Cernicharo (2008) Daniel, F., & Cernicharo, J. 2008, A&A, 488, 1237
- De Beck et al. (2012) De Beck, E., Lombaert, R., Agúndez, M., et al. 2012, A&A, 539, A108
- Decin et al. (2011) Decin, L., Royer, P., Cox, N. L. J., et al. 2011, A&A, 534, A
- Draine (1978) Draine, B. T. 1978, ApJS, 36, 595
- Dumouchel et al. (2010) Dumouchel, F., Faure, A., & Lique, F. 2010, MNRAS, 406, 2488
- Fonfría et al. (2008) Fonfría, J. P., Cernicharo, J., Richter, M. J., & Lacy, J. H. 2008, ApJ, 673, 445
- Fong et al. (2003) Fong, D., Meixner, M., & Shah, R. Y. 2003, ApJ, 582, L39
- Guélin et al. (1997) Guélin, M., Lucas, R., & Neri, R. 1997, in IAU Symp. 170, CO: Twenty-Five Years of Millimeter Wave Spectroscopy, ed. W. B. Latter, S. J. E. Radford, P. R. Jewell, J. G. Magnum & J. Bally (Dordrecht: Kluwer)
- Guélin et al. (2007) Guélin, M., Salomé, P., Neri, R., et al. 2007, A&A, 462, L45
- Harris et al. (2002) Harris, G. J., Polyansky, O. L., & Tennyson, J. 2002, Spectrochim. Acta Part A, 58, 673
- Hasegawa et al. (2006) Hasegawa, T. I., Kwok, S., Koning, N., et al. 2006, ApJ, 637, 791
- Hirota et al. (1998) Hirota, T. Yamamoto, S., Mikami, H., & Ohishi, M. 1988, ApJ, 503, 717
- Kahane et al. (2000) Kahane, C., Dufour, E., Busso, M., et al. 2000, A&A, 357, 669
- Keady & Ridgway (1993) Keady, J. J., & Ridgway, S. T. 1993, ApJ, 406, 199
- Le Bertre (1992) Le Bertre, T. 1992, A&AS, 94, 377
- Liszt & Lucas (2001) Liszt, H. & Lucas, R. 2001, A&A, 370, 576
- Maki & Mellau (2001) Maki, A. G. & Mellau, G. Ch. 2001, J. Mol. Spectr., 206, 47
- Mauron & Huggins (2000) Mauron, N., & Huggins, P. J. 2000, A&A, 359, 707
- Sarrasin et al. (2010) Sarrasin, E., Abdallah, D. B., Wernli, M., et al. 2010, MNRAS, 404, 518
- Schilke et al. (1992) Schilke, P., Walmsley, C. M., Pineau des Forêts, G., Roueff, E., Flower, D. R., & Guilloteau, S. 1992, A&A, 256, 595
- Schilke et al. (2003) Schilke, P., Comito, C., & Thorwirth 2003, ApJ, 582, L101
- Smith et al. (2004) Smith, I. W. M., Herbst, E., & Chang, Q. 2004, MNRAS, 350, 323
- Semaniak et al. (2001) Semaniak, J., Minaev, B. F., Derkatch, A. M., et al. 2001, ApJS, 135, 275
- Woodall et al. (2007) Woodall, J. Agúndez, M., Markwick-Kemper, A. J. & Millar, T. J., 2007, A&A, 466, 1197
- Zuckerman et al. (1972) Zuckerman, B., Morris, M., Palmer, P., Turner, B. E. 1972, ApJ, 173, 125