![[Uncaptioned image]](/html/1204.4496/assets/x1.png) DØ Note 6260-CONF
DØ Note 6260-CONF
Evidence for and production in final states with -tagged jets
Abstract
We present evidence for the combined production of ( or ) events in final states containing charged leptons (electrons or muons) or neutrinos, and heavy flavor jets, using data collected by the DØ detector at the Fermilab Tevatron Collider. The analyzed samples correspond to 7.5 to 8.4 fb-1 of collisions at TeV. Assuming the ratio of the production cross sections and as predicted by the standard model, we measure the total cross section to be (stat) (syst) pb. This corresponds to a significance of 3.3 standard deviations above the background only hypothesis. Furthermore, we have separately measured the cross sections for the and processes to be = 5.9 1.4 (stat) 0.7 (syst) pb and = 0.45 0.61 (stat) 1.2 (syst) pb, in agreement with the standard model prediction.
Preliminary Results for the HCP 2011 Conference
I Introduction
The production of () boson pairs provides an important test of the electroweak sector of the standard model (SM). In collisions at TeV, the next-to-leading order (NLO) SM cross sections for these processes are pb, pb and pb dibo . Measuring a significant departure in cross section or deviations in the predicted kinematic distributions would indicate the presence of anomalous gauge boson couplings bib:anocoups or new particles in extensions of the SM bib:newphen . The production in collisions at the Fermilab Tevatron Collider has been observed in fully leptonic decay modes bib:leptonic and in semi-leptonic decay modes bib:hadronic , where the combined cross section was measured.
In this note we report evidence of and production in final states where one of the boson decays to (although there is some signal contribution from , ) and the other weak boson decays to charged leptons or neutrinos (, , or , with ). This analysis is also relevant as a proving ground for the searches for a low-mass Higgs boson produced in association with a weak boson and decaying into a pair bib:higgs , which share the exact same selection criteria and analysis techniques.
II Summary of Contributing Analyses
This result is the combination of three analyses dzWHl ; dzZHv ; dzZHl outlined in Table 1. These analyses utilize data corresponding to integrated luminosities ranging from 7.5 to 8.4 fb-1, collected by the D0 detector dzero at the Fermilab Tevatron Collider. They are organized into multiple sub-channels for different configurations of final state particles. To facilitate proper combination of signals, the analyses were constructed to use mutually exclusive event selections.
In the analysis dzWHl , events containing an isolated electron or muon, and two or three jets are selected. The presence of a neutrino from the decay is inferred from a large imbalance of transverse momentum (). The analysis dzZHv selects events containing large and exactly two jets. Finally, in the analysis dzZHl , events are required to contain two electrons or two muons and at least two jets. In the and analyses, each lepton flavor of the boson decay () is treated as an independent channel. To ensure that the samples for the different analyses do not overlap, the analysis rejects events in which a second isolated electron or muon is identified, and the analysis rejects events in which any isolated electrons or muons are identified.
To isolate the decays, an algorithm for identifying jets consistent with the decay of a heavy-flavor quark is applied to each jet (-tagging). Several kinematic variables sensitive to displaced decay vertices and jet tracks with large transverse impact parameters relative to the hard-scatter vertices are combined in a -tagging discriminant based on boosted decision trees. This algorithm is an upgraded version of the neural network -tagging tool used previously bib:btagnn . By adjusting the minimum requirement on the -tagging output, a spectrum of increasingly stringent -tagging operating points is achieved. Each of the analyses is separated into two groups: a double-tag (DT) group in which two of the jets are -tagged with a loose tag requirement ( and ) or one loose and one tight tag requirement (); and an orthogonal single-tag (ST) group in which only one jet has a loose ( and ) or tight () -tag. A typical per-jet efficiency and fake rate for the loose (tight) -tag selection is about 80% (50%) and 10% (0.5%), respectively. The corresponding efficiency for jets from -quarks is 45% (12%). Furthermore, the and analyses use the output from the -tagging alogrithm as input to final discriminants. The signal in the DT sample is mainly composed of events with decays with smaller contributions from and decays. In the ST sample, which places a much less stringent requirement on the -jet content of the event, the contributions from the three decay modes are comparable. All three analyses use multivariate discriminants (MVA) based on decision trees as the final variables for extracting the signal from the backgrounds.
| Channel | Luminosity (fb-1) | Reference |
|---|---|---|
| , ST/DT, 2/3 jets | 7.5 | dzWHl |
| , ST/DT 2 jets | 8.4 | dzZHv |
| , ST/DT 2 jets | 7.5 | dzZHl |
The backgrounds from multijet production are measured from control samples in the data. The other backgrounds are generated by alpgen alpgen and comphep comphep , with pythia pythia providing parton-showering and hadronization. The primary background is from +jets, and is modeled with alpgen. The and analyses normalize these background to the data, whereas the analysis normalizes them to the prediction from alpgen. The fraction of the +jets in which the jets arise from heavy quarks ( or ) is obtained from NLO calculations using MCFM mcfm . The background from events is normalized to the approximate NNLO cross section ttbar_xsec . The -channel and -channel cross sections for the production of single-top quarks are from approximate NNLO+NNLL calculations schan_top_xsec and approximate NNNLO+NLL calculations tchan_top_xsec , respectively. The background from events is normalized to NLO calculations from MCFM dibo .
III Systematic Uncertainties
The main sources of systematic uncertainty varies between the different analyses dzWHl ; dzZHv ; dzZHl . Here we summarize only the largest contributions. The and analyses carry an uncertainty on the integrated luminosity of 6.1% lumi , while the overall normalization of the analysis is determined from the NNLO cross section dyxsec in data events near the peak of decays. The uncertainty from the identification and measurement of jets is 7%. The uncertainty arising from the -tagging rate ranges from 1 to 10%. All analyses include uncertainties associated with lepton measurement and acceptances, which range from 1 to 9% depending on the final state. The largest contribution for all analyses is the theoretical uncertainty on the background cross sections at 7-20% depending on the analysis channel and specific background. The uncertainty on the expected multijet background is dominated by the statistics of the data sample from which it is estimated. In addition, the analyses incorporate shape-dependent uncertainties on the kinematics of the dominant backgrounds. These shapes are derived from the potential variations of the MVA distributions due to generator and background modeling uncertainties. Further details on the systematic uncertainties are given in Tables 2-4. All systematic uncertainties originating from a common source are held to be correlated, as detailed in Table 5.
IV Measurement of the Cross Section
The total cross section is determined from a fit of the MVA distributions of the background and signal samples to the data. The ratio of the and cross sections is fixed to its SM prediction. The production of events is considered as a background. This fit is performed simultaneously on the distributions in all sub-channels by minimizing a negative log likelihood ratio function with respect to the signal cross section and variations in the systematic uncertainties bib:poisson . This function is constructed from terms for Poisson fluctuations in the data, and a Gaussian prior for each systematic uncertainty. The magnitude of the systematic uncertainties is effectively constrained by the regions of the MVA distribution with low signal over background ratio. Different uncertainties are assumed to be mutually independent, but those common to multiple sub-channels are assumed to be 100% correlated.
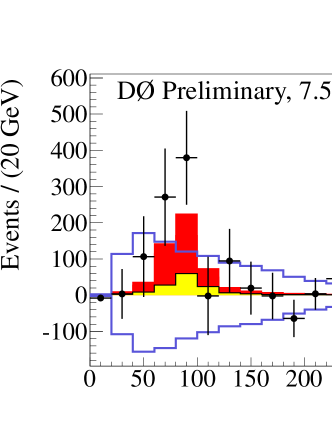
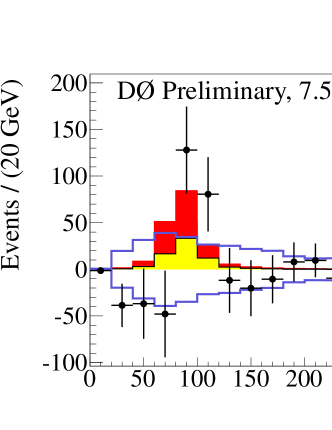
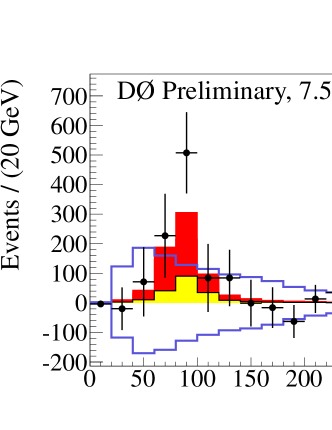
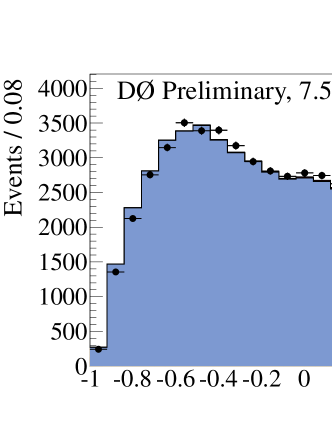
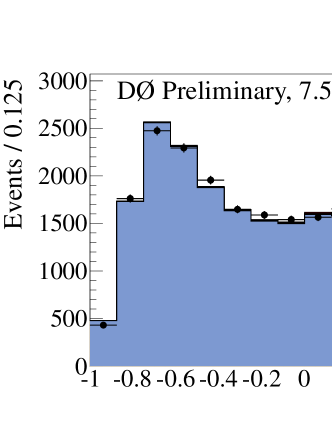
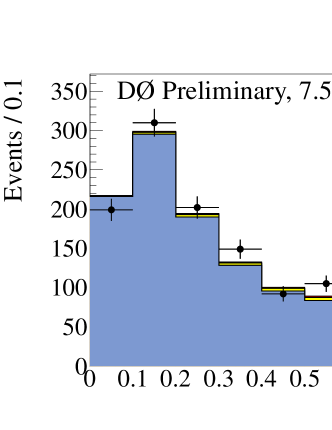
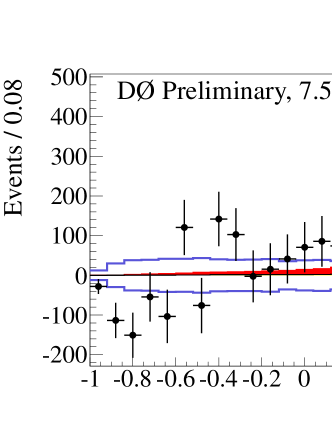
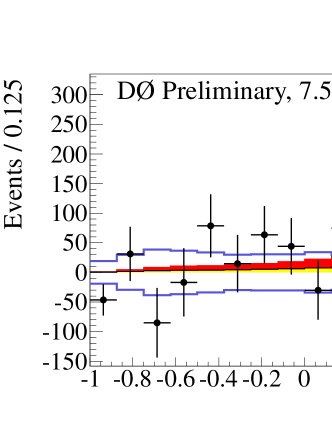
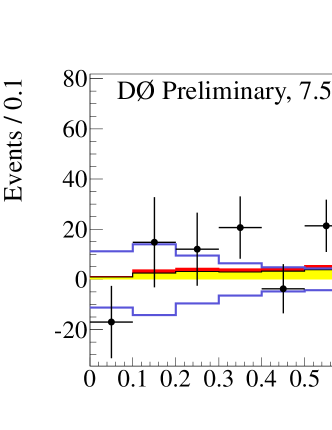
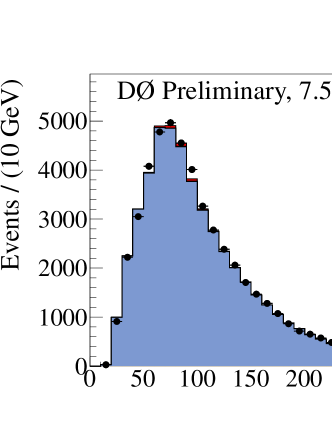
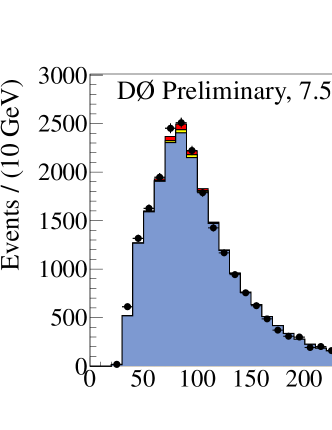
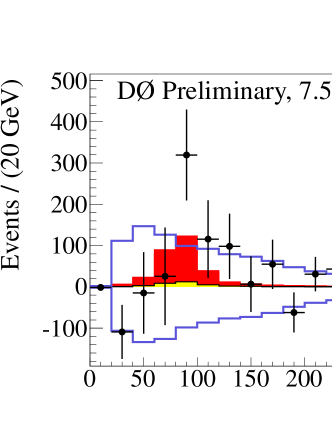
The combined fit for the total cross section distributions yields (stat) (syst) pb. This measurement is consistent with the NLO SM prediction of pb dibo . To visualize the sensitivity of the combined analysis, we calculate the signal over background (s/b) in each bin of the MVA distributions from the contributing analyses. Bins with similar s/b are then combined to produce a single distribution, shown in Figure 1. In Figure 2 we show the distributions of the invariant mass of the dijet system after adjusting the signal and background predictions according to the results of the fit. Figure 3 shows the background subtracted dijet mass distributions after the fit. Distributions of the MVA and dijet mass for the contributing analyses can be found in the Appendix.
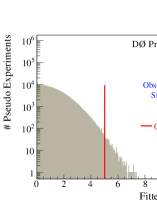
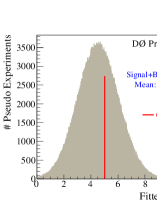
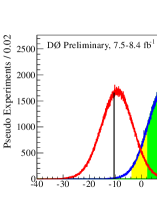
We estimate the statistical significance of the measured signal by performing the same measurement on an ensemble of pseudo-experiments drawn from the background only hypothesis. Figure 4 shows the distribution of cross sections obtained from the background only pseudo-experiments compared to the cross section measured from data. The significance is found to be 3.3 standard deviatons (s.d.). The expected significance is 2.9. Also shown in Figure 4 is the distribution of cross sections obtained from pseudo-experiments drawn from the SM signal+background hypothesis. It is also interesting to compare the distributions of the negative log-likelihood ratio (LLR) test statistic cls for the two hypotheses to the LLR observed in data. We display the results of this comparison in Figure 5.
 |
 |
 |
| (a) | (b) | (c) |
 |
 |
 |
| (a) | (b) | (c) |
 |
 |
| (a) | (b) |
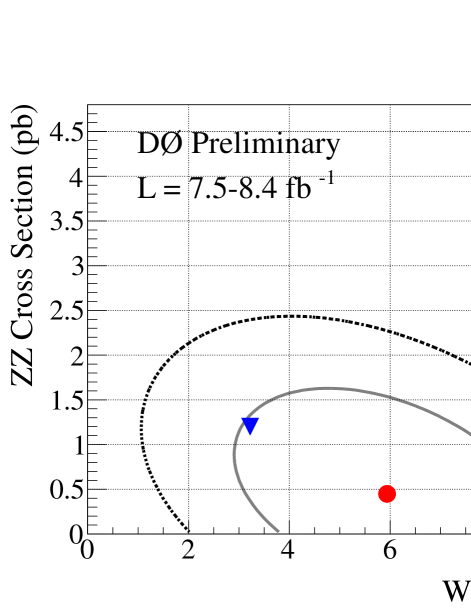
We also perform the fit with the signal divided into its separate and components, which are allowed to float independently. The result of this simultaneous fit of and using the MVA output distributions is shown in Figure. 6. It yields = 5.9 1.4 (stat) 0.7 (syst) pb and = 0.45 0.61 (stat) 1.2 (syst) pb. These results are to be compared to the NLO predictions of 3.2 0.2 pb and 1.2 0.1 pb.
V Summary
In summary, we have combined analyses in the , , and () final states to obtain evidence with a significance of 3.3 s.d., for the production of ( or ) events. The analyzed samples correspond to 7.5 to 8.4 fb-1 of collisions at TeV. We measure the total cross section for production to be (stat) (syst) pb. Furthermore, we have separately measured the cross sections for the and processes to be = 5.9 1.4 (stat) 0.7 (syst) pb and = 0.45 0.61 (stat) 1.2 (syst) pb, in agreement with the SM predictions. These results demonstrate the ability of the D0 experiment to measure a signal containing two heavy-flavor jets in a background-dominated final state directly relevant to low mass Higgs searches.
Acknowledgements.
We thank the staffs at Fermilab and collaborating institutions, and acknowledge support from the DOE and NSF (USA); CEA and CNRS/IN2P3 (France); FASI, Rosatom and RFBR (Russia); CNPq, FAPERJ, FAPESP and FUNDUNESP (Brazil); DAE and DST (India); Colciencias (Colombia); CONACyT (Mexico); KRF and KOSEF (Korea); CONICET and UBACyT (Argentina); FOM (The Netherlands); STFC and the Royal Society (United Kingdom); MSMT and GACR (Czech Republic); CRC Program and NSERC (Canada); BMBF and DFG (Germany); SFI (Ireland); The Swedish Research Council (Sweden); and CAS and CNSF (China).References
- (1) J. M. Campbell and R. K. Ellis, Phys. Rev. D 60, 113006 (1999) [arXiv:hep-ph/9905386].
- (2) K. Hagiwara, S. Ishihara, R. Szalapski, and D. Zeppenfeld, Phys. Rev. D 48 (1993).
-
(3)
J. C. Pati and A. Salam, Phys. Rev. D 10, 275 (1974); 11 703(E) (1975);
G. Altarelli, B. Mele, and M. Ruiz-Altaba, Z. Phys. C 45, 109 (1989); 47, 676(E) (1990);
L. Randall and R. Sundrum, Phys. Rev. Lett. 83, 3370 (1999);
H. Davoudiasl, J. L. Hewett, and T. G. Rizzo, Phys. Rev. D 63, 075004 (2001);
H. He et al., Phys. Rev. D 78, 031701 (2008). -
(4)
T. Aaltonen et al. (CDF Collaboration), Phys. Rev. Lett. 104, 201801 (2010);
V. M. Abazov et al. (D0 Collaboration), Phys. Lett. B 695, 67 (2011);
V. M. Abazov et al. (D0 Collaboration), Phys. Rev. D 84, 011103 (2011). -
(5)
T. Aaltonen et al. (CDF Collaboration), Phys. Rev. Lett. 103, 091803 (2009);
T. Aaltonen et al. (CDF Collaboration), Phys. Rev. Lett. 104, 101801 (2010). -
(6)
V. M. Abazov et al. (D0 Collaboration), Phys. Rev. Lett. 104, 071801 (2010);
V. M. Abazov et al. (D0 Collaboration), Phys. Rev. Lett. 105, 251801 (2010);
V. M. Abazov et al. (D0 Collaboration), Phys. Lett. B 698, 6 (2011). - (7) DØ Collaboration, DØ Note 6220-CONF (2011).
- (8) DØ Collaboration, DØ Note 6223-CONF (2011).
- (9) DØ Collaboration, DØ Note 6256-CONF (2011).
- (10) DØ Collaboration, V. Abazov et. al., Nucl. Instrum. Meth. A 565, 463 (2006) [arXiv:hep-ph/0507191].
- (11) DØ Collaboration, V. Abazov et. al., Nucl. Instrum. Methods in Phys. Res. Sect. A 620, 490 (2010) [arXiv:1002.4224].
- (12) M. L. Mangano, M. Moretti, F. Piccinini, R. Pittau and A. D. Polosa, JHEP 0307, 001 (2003). [arXiv:hep-ph/0206293].
- (13) A. Pukhov et al., arXiv:hep-ph/9908288 (1999).
- (14) T. Sjöstrand, L. Lonnblad and S. Mrenna, arXiv:hep-ph/0108264.
-
(15)
J. Campbell and R. K. Ellis,
http://mcfm.fnal.gov/.
J. M. Campbell, R. K. Ellis, Nucl. Phys. Proc. Suppl. 205-206, 10-15 (2010). [arXiv:1007.3492 [hep-ph]]. - (16) U. Langenfeld, S. Moch and P. Uwer, Phys. Rev. D 80, 054009 (2009) [arXiv:0906.5273 [hep-ph]].
-
(17)
N. Kidonakis,
arXiv:1005.3330 [hep-ph] (2010);
N. Kidonakis, Phys. Rev. D 81, 054028 (2010). - (18) N. Kidonakis, Phys. Rev. D 74, 114012 (2006) [arXiv:hep-ph/0609287].
- (19) T. Andeen et al., Report No. FERMILAB-TM-2365, 2007.
- (20) R. Hamberg, W.L. van Neerven and W.B. Kilgore, Nucl Phys. B359 343 (1991), errata B644 403, hep-ph/0308087.
- (21) W. Fisher, FERMILAB-TM-2386-E.
- (22) T. Junk, Nucl. Intrum. Meth. A 434, 435 (1999); A.Read, CERN 2000-005 (30 May 2000).
Appendix A Additional Material
Single Tag (ST) channels relative uncertainties (%)
| Contribution | Dibosons | +l.f. | single top | Multijet | ||
| Luminosity | 6.1 | 6.1 | 6.1 | 6.1 | 6.1 | – |
| Electron ID/Trigger efficiency (S) | 1–5 | 2–4 | 2–4 | 1–2 | 1–2 | – |
| Muon Trigger efficiency (S) | 1–3 | 1–2 | 1–3 | 2–5 | 2–3 | – |
| Muon ID efficiency/resolution | 4.1 | 4.1 | 4.1 | 4.1 | 4.1 | – |
| Jet ID efficiency (S) | 2–5 | 1–2 | 1–3 | 3–5 | 2–4 | – |
| Jet Energy Resolution (S) | 4–7 | 1–3 | 1–4 | 2–5 | 2–4 | – |
| Jet Energy Scale (S) | 4–7 | 2–5 | 2–5 | 2–5 | 2–4 | – |
| Vertex Conf. Jet (S) | 4–10 | 5–12 | 4–10 | 7–10 | 5–10 | – |
| -tag/taggability (S) | 1–4 | 1–2 | 3–7 | 3–5 | 1–2 | – |
| Heavy-Flavor K-factor | – | 20 | – | – | – | – |
| Multijet model, (S) | 1–2 | 2–4 | 1–3 | 1–2 | 1–3 | 15 |
| Multijet model, | – | 2.4 | 2.4 | – | – | 20 |
| Cross Section | 6 | 9 | 9 | 10 | 10 | – |
| ALPGEN MLM pos/neg(S) | – | SO | – | – | – | – |
| ALPGEN Scale (S) | – | SO | SO | – | – | – |
| Underlying Event (S) | – | SO | – | – | – | – |
| PDF, reweighting | 2 | 2 | 2 | 2 | 2 | – |
Double Tag (DT) channels relative uncertainties (%)
| Contribution | Dibosons | +l.f. | single top | Multijet | ||
| Luminosity | 6.1 | 6.1 | 6.1 | 6.1 | 6.1 | – |
| Electron ID/Trigger efficiency (S) | 2–5 | 2–3 | 2–3 | 1–2 | 1–2 | – |
| Muon Trigger efficiency (S) | 2–4 | 1–2 | 1–2 | 2–4 | 1–3 | – |
| Muon ID efficiency/resolution | 4.1 | 4.1 | 4.1 | 4.1 | 4.1 | – |
| Jet ID efficiency (S) | 2–8 | 2–5 | 4–9 | 3–7 | 2–4 | – |
| Jet Energy Resolution (S) | 4–7 | 2–7 | 2–7 | 2–9 | 2–4 | – |
| Jet Energy Scale (S) | 4–7 | 2–6 | 2–7 | 2–6 | 2–7 | – |
| Vertex Conf. Jet (S) | 4–10 | 5–12 | 4–10 | 7–10 | 5–10 | – |
| -tag/taggability (S) | 3–7 | 4–6 | 3–10 | 5–10 | 4–10 | – |
| Heavy-Flavor K-factor | – | 20 | – | – | – | – |
| Multijet model, (S) | 1–2 | 2–4 | 1–3 | 1–2 | 1–3 | 15 |
| Multijet model, | – | 2.4 | 2.4 | – | – | 20 |
| Cross Section | 6 | 9 | 9 | 10 | 10 | – |
| ALPGEN MLM pos/neg(S) | – | SO | – | – | – | – |
| ALPGEN Scale (S) | – | SO | SO | – | – | – |
| Underlying Event (S) | – | SO | – | – | – | – |
| PDF, reweighting | 2 | 2 | 2 | 2 | 2 | – |
Single Tag (ST) channels relative uncertainties (%)
| Contribution | Top | +l.f. | Dibosons | Multijet | |
|---|---|---|---|---|---|
| Jet ID efficiency (S) | 2.0 | 2.0 | 2.0 | 2.0 | – |
| Jet Energy Scale (S) | 2.2 | 1.6 | 3.1 | 1.0 | – |
| Jet Energy Resolution (S) | 0.5 | 0.3 | 0.3 | 0.9 | – |
| Vertex Conf. / Taggability (S) | 3.2 | 1.9 | 1.7 | 1.8 | – |
| b Tagging (S) | 1.1 | 0.8 | 1.8 | 1.2 | – |
| Lepton Identification | 1.6 | 0.9 | 0.8 | 1.0 | – |
| Trigger | 2.0 | 2.0 | 2.0 | 2.0 | – |
| Heavy Flavor Fractions | – | 20.0 | – | – | – |
| Multijet model | – | – | – | – | 25 |
| Cross Sections | 10.0 | 10.2 | 10.2 | 7.0 | – |
| Luminosity | 6.1 | 6.1 | 6.1 | 6.1 | – |
| Multijet Normalilzation | – | – | – | – | – |
| ALPGEN MLM (S) | – | – | SO | – | – |
| ALPGEN Scale (S) | – | SO | SO | – | – |
| Underlying Event (S) | – | SO | SO | – | – |
| PDF, reweighting (S) | SO | SO | SO | SO | – |
Double Tag (DT) channels relative uncertainties (%)
| Contribution | Top | +l.f. | Dibosons | Multijet | |
|---|---|---|---|---|---|
| Jet ID efficiency | 2.0 | 2.0 | 2.0 | 2.0 | – |
| Jet Energy Scale | 2.1 | 1.6 | 3.4 | 1.2 | – |
| Jet Energy Resolution | 0.7 | 0.4 | 0.5 | 1.5 | – |
| Vertex Conf. / Taggability | 2.6 | 1.6 | 1.6 | 1.8 | – |
| b Tagging | 6.2 | 4.3 | 4.3 | 3.7 | – |
| Lepton Identification | 2.0 | 0.9 | 0.8 | 0.9 | – |
| Trigger | 2.0 | 2.0 | 2.0 | 2.0 | – |
| Heavy Flavor Fractions | – | 20.0 | – | – | – |
| Multijet model | – | – | – | – | 25 |
| Cross Sections | 10.0 | 10.2 | 10.2 | 7.0 | – |
| Luminosity | 6.1 | 6.1 | 6.1 | 6.1 | – |
| Multijet Normalilzation | – | – | – | – | – |
| ALPGEN MLM pos/neg (S) | – | – | SO | – | – |
| ALPGEN Scale (S) | – | SO | SO | – | – |
| Underlying Event (S) | – | SO | SO | – | – |
| PDF, reweighting (S) | SO | SO | SO | SO | – |
Single Tag (ST) channels relative uncertainties (%)
| Contribution | Multijet | +l.f. | Dibosons | Top | ||
| Jet Energy Scale (S) | – | 3.0 | 8.4 | 10 | 3.3 | 1.5 |
| Jet Energy Resolution (S) | – | 3.9 | 5.2 | 5.3 | 0.04 | 0.6 |
| Jet ID efficiency (S) | – | 0.9 | 0.6 | 0.2 | 1.0 | 0.3 |
| Taggability (S) | – | 5.2 | 7.2 | 7.3 | 6.9 | 6.5 |
| Model (S) | – | 2.7 | 1.4 | 1.5 | – | – |
| HF Tagging Efficiency (S) | – | – | 5.0 | 9.4 | – | 5.2 |
| LF Tagging Efficiency (S) | – | 73 | – | – | 5.8 | – |
| Multijet Shape (S) | 53 | – | – | – | – | – |
| Multijet Normalization | 20-50 | – | – | – | – | – |
| +jets Jet Angles (S) | – | 1.7 | 2.7 | 2.8 | – | – |
| Alpgen MLM (S) | – | 0.3 | – | – | – | – |
| Alpgen Scale (S) | – | 0.4 | 0.2 | 0.2 | – | – |
| Underlying Event (S) | – | 0.2 | 0.1 | 0.1 | – | – |
| Trigger (S) | – | 0.03 | 0.2 | 0.3 | 0.3 | 0.4 |
| Cross Sections | – | – | 20 | 20 | 7 | 10 |
| Normalization | – | 1.3 | 1.3 | 1.3 | 8.0 | 8.0 |
| PDFs | – | 1.0 | 2.4 | 1.1 | 0.7 | 5.9 |
Double Tag (DT) channels relative uncertainties (%)
| Contribution | Multijet | +l.f. | Dibosons | Top | ||
| Jet Energy Scale (S) | – | 4.0 | 6.4 | 8.2 | 3.8 | 2.7 |
| Jet Energy Resolution(S) | – | 2.6 | 3.9 | 4.1 | 0.9 | 1.5 |
| JET ID efficiency (S) | – | 0.7 | 0.3 | 0.2 | 0.7 | 0.4 |
| Taggability (S) | – | 8.6 | 6.5 | 8.2 | 4.6 | 2.1 |
| Model (S) | – | 1.6 | 1.3 | 1.4 | – | – |
| HF Tagging Efficiency (S) | – | – | 1.3 | 3.2 | – | 0.7 |
| LF Tagging Efficiency (S) | – | 72 | – | – | 4.0 | – |
| Multijet Shape (S) | 59 | – | – | – | – | – |
| Multijet Normalization | 20-50 | – | – | – | – | – |
| +jets Jet Angles (S) | – | 2.0 | 1.5 | 1.5 | – | – |
| Alpgen MLM (S) | – | 0.4 | – | – | – | – |
| Alpgen Scale (S) | – | 0.2 | 0.2 | 0.2 | – | – |
| Underlying Event(S) | – | 0.1 | 0.02 | 0.1 | – | – |
| Trigger (S) | – | 0.3 | 0.2 | 0.1 | 0.2 | 0.5 |
| Cross Sections | – | – | 20 | 20 | 7 | 10 |
| Normalization | – | 1.3 | 1.3 | 1.3 | 8.0 | 8.0 |
| PDFs | – | 1.0 | 2.4 | 1.1 | 0.7 | 5.9 |
| Source | |||
|---|---|---|---|
| Luminosity | |||
| Normalization | |||
| Jet Energy Scale | |||
| Jet ID | |||
| Electron ID/Trigger | |||
| Muon ID/Trigger | |||
| -Jet Tagging | |||
| Background | |||
| Background Modeling | |||
| Multijet Background | |||
| Signal |
 |
 |
 |
| (a) | (b) | (c) |
 |
 |
 |
| (d) | (e) | (f) |
 |
 |
 |
| (a) | (b) | (c) |
 |
 |
 |
| (d) | (e) | (f) |