Identifying Ultra-Cool Dwarfs at Low Galactic Latitudes: A Southern Candidate Catalogue
Abstract
We present an Ultra-Cool Dwarf (UCD) catalogue compiled from low southern Galactic latitudes and mid-plane, from a cross-correlation of the 2MASS and SuperCOSMOS surveys. The catalogue contains 246 members identified from 5042 deg2 within and , for . Sixteen candidates are spectroscopically confirmed in the near-IR as UCDs with spectral types from M7.5V to L9, the latest being the unusual blue L dwarf 2MASS J11263991-5003550. Our catalogue selection method is presented enabling UCDs from M8V to the L–T transition to be selected down to a 2MASS limiting magnitude of (for ). This method does not require candidates to have optical detections for catalogue inclusion. An optimal set of optical/near-IR and reduced proper-motion selection criteria have been defined that includes: an RF and IN photometric surface gravity test, a dual RF-band variability check, and an additional photometric classification scheme to selectively limit numbers of potential contaminants in regions of severe overcrowding. We identify four candidates as possible companions to nearby Hipparcos stars – observations are needed to identify these as potential benchmark UCD companions. We also identify twelve UCDs within a possible distance 20 pc, three are previously unknown of which two are estimated within 10 pc, complimenting the nearby volume-limited census of UCDs. An analysis of the catalogue spatial completeness provides estimates for distance completeness over three UCD MJ ranges, while Monte-Carlo simulations provide an estimate of catalogue areal completeness at the 75 per cent level. We estimate a UCD space density of over the range of , similar to values measured at higher Galactic latitudes () in the field population and obtained from more robust spectroscopically confirmed UCD samples.
keywords:
stars: low mass, brown dwarfs - star: kinematics - infrared: stars - surveys: techniques - photometric - techniques - spectroscopic1 Introduction
For about four decades before the advent of large area near-IR sensitive detectors, the M dwarfs marked the observational limit at the lower luminosity (and lower mass) end of the main sequence. Early searches for Very Low-Mass Stars (VLMS) and brown dwarfs were limited to all-sky surveys based on optical photographic plates, which are not sensitive to the very red spectral energy distributions of these intrinsically faint objects. The first photographic plates to be used were the blue (103aO) and red (103aE) sensitive emulsions in the northern first Palomar Observatory Sky Survey (POSS-I: 1949-1957). Later in the 1970s, the UK/AAO and ESO (40inch Chile) Schmidt telescopes began surveys in the southern hemisphere using blue-green IIIaJ, and far-red IIIaF/IN plate emulsions respectively. Second epoch photographic surveys were carried out in the northern sky by the POSS-II in the late 1980s, which added an IN sensitive emulsion, and also in the south using the UK/AAO (blue and red plates) in the late 1990s.
The first all-sky search exploiting these initial photographic surveys for nearby stars was by Luyten, who published two proper motion catalogues: the Luyten Half-Second catalogue (LHS: Luyten 1979a), and the New Luyten Two-Tenths catalogue (NLTT: Luyten 1979b, c, 1980a, 1980b). However, the low sensitivity of the photographic surveys to VLMS meant that only a limited number of the nearest examples were identified. Among these are the well known and well studied examples Wolf 359 (M5.5V), VB 8 (M7V), VB 10 (M8V), LHS 2924 (M9V), and LHS 2065 (M9V). The bottom of the main sequence was observationally defined by VB 10 for nearly 40 years, until in 1983 LHS 2924 was identified as an unusual low luminosity late-M dwarf (Probst & Liebert 1983). The mass of LHS 2924 appears to be close to that of the stellar hydrogen-burning mass limit (HBML), but is probably not a sub-stellar brown dwarf due to weak H emission and no detectable Li i absorption (inferring older age: Martin et al. 1994). Current theoretical models give the HBML as M (e.g., Chabrier et al. 2000; Baraffe et al. 2002, for Solar metallicity).
More recently digitised automated scanning of these photographic plates has opened up the possibility of discovering many more nearby VLMS, and even brown dwarfs, either directly or by cross-correlation with near-IR surveys. Digitised catalogues that are currently available and containing photometric and proper motion data are: SuperCOSMOS Sky Survey and SuperCOSMOS Science Archive (SSS and SSA respectively: Hambly et al. 2001c, b, a), USNO-B1.0 (Monet et al. 2003), GSC-2 (Jenkner et al. 1990; Lasker et al. 2008), and the APS archive (Cabanela et al. 2003, POSS-I only). One automated digitised scanning process in particular (which uses specialised software called SUPERBLINK) was developed specifically to search for new high proper-motion stars in both the northern hemisphere (Lépine & Shara 2005, ), and southern hemisphere (Lépine 2008, ).
The term ‘Ultra-Cool Dwarf’ (UCD) has recently become synonymous with low-mass late-type dwarfs of spectral types M7 (both VLMS and brown dwarfs). The term UCD was first deployed in Kirkpatrick (1999), and then began to be used more extensively (e.g., Martín et al. 1999). The justification for M7 in defining the earliest spectral sub-type is based on two observed physical characteristics of dwarf late-M stars: the first is that the sub-stellar boundary is located at about the spectral type of M6.5 in the Pleiades Galactic cluster (having an age of Myrs), as inferred by the Lithium depletion edge test (Martin et al. 1996a; Stauffer et al. 1998). The second is the observed dramatic decrease in the 0.65 – 0.75m TiO band strength, also located at around M6.5 for field dwarfs (Jones & Tsuji 1997).
At the time of writing there were just over 600 L dwarfs, and nearly 200 T dwarfs known (from the M, L, and T dwarf compendium housed at: http://dwarfarchives.org)111The http://dwarfarchives.org compendium is maintained by Chris Gelino, Davy Kirkpatrick, and Adam Burgasser., which had been mostly discovered photometrically in the red-optical and near-IR: DENIS (DEep Near Infrared Survey of the southern sky: Epchtein et al. 1999), 2MASS (Two Micron All-Sky Survey: Skrutskie et al. 2006), SDSS (Sloan Digital Sky Survey: York et al. 2000), and UKIDSS (UKIRT Infrared Deep Sky Survey: Lawrence et al. 2007). Using these more recent surveys, early searches for L and T dwarfs have largely avoided the Galactic plane (i.e., ), with the first attempt to systematically search the ‘zone of avoidance’ by Reid (2003), who identified two UCDs: one M8V and an L1.5. Both of these objects had been previously discovered by the SUPERBLINK survey of Lépine et al. (2002b). The search by Reid (2003) used a near-IR selection criteria requiring . More recently, a search of the Galactic plane conducted by Phan-Bao et al. (2008) published results for 26 confirmed UCDs from DENIS – 15 of which have been independently identified here, and previously in Folkes et al. (2007).
The Galactic plane represents a significant area of sky ( per cent within ), offering considerable latent potential for new discoveries of UCDs, from deeper searches over a wider range of spectral types. It is possible that such discoveries may contain highly interesting, unusual, and nearby/bright examples. Such a search will also compliment those made at higher Galactic latitudes, in particular by adding to the statistics of the 10 pc and 20 pc volume-limited census (e.g., RECONS222See http://www.recons.org/ for details of the research consortium. and 2MU2, Reid et al. (2008); Cruz et al. (2007) respectively), which aim to produce complete luminosity and field mass functions of the stellar/sub-stellar population within the Solar neighbourhood.
However, the Galactic plane is referred to as the ‘zone of avoidance’ for very good reasons as it contains the highest stellar densities down to faint limiting magnitudes. One also has to contend with regions of dark molecular clouds, nebulosity, and regions of current star formation. It is interesting to note that per cent of all the objects contained in the 2MASS Point Source Catalogue (PSC) lie within . The Galactic plane is also host to several types of objects that cause confusion and contamination in a search to identify UCDs, e.g., ‘O’-rich and ‘C’-rich Long Period Variable (LPV) AGB stars, distant highly reddened luminous early-type main sequence and giant branch stars, Young Stellar Objects (YSOs) – primarily CTTS (Classical T-Tauri Stars), and Herbig AeBe stars. All these sources of contamination can mimic the near-IR, and in some cases optical-NIR, colours of UCDs.
Here, we present a method which uses a comprehensive set of photometric and proper motion criteria, to create a catalogue of field UCDs at low Galactic latitudes in the southern hemisphere. Our method has been tailored to discriminate UCDs from sources of contamination, that one is most likely to encounter in the crowed regions of the Galactic plane.
2 Defining the Selection Method
In considering the choice of photometric survey data to use for the primary near-IR query, the 2MASS all-sky release and the DENIS catalogue could have been utilised. DENIS has been used to great effect in discovering many UCDs (Delfosse et al. 1997; Martín et al. 1999; Phan-Bao et al. 2003; Crifo et al. 2005; Phan-Bao et al. 2008; Martín et al. 2010), and offers J,K, and I-band (Gunn-i) photometry. The (Gunn-i) passband is effectively contemporaneous with its near-IR bands and can be used to impose a colour constraint to good effect for selection of very red candidates (e.g., Phan-Bao et al. 2008). However, DENIS lacks H-band photometry, preventing the use of the / two-colour plane and colour indices for a primary near-IR selection. Therefore, the requirement to have an I-band detection significantly limits the depth to which one can identify very red objects, thus probing a smaller space volume. The 2MASS Point Source Catalogue (PSC) has contains data for the J,H, and Ks bands and has extensive quality flag information for the catalogue entries, and has also been extensively mined in searches for UCDs at higher Galactic latitudes since its first data release (e.g., Kirkpatrick 1999; Kirkpatrick et al. 2000; Gizis 2002; Cruz et al. 2003; Wilson et al. 2003; Kendall et al. 2003; Knapp et al. 2004; Cruz et al. 2007; Kirkpatrick et al. 2007). Thus, we chose 2MASS for the primary near-IR photometric data to enable a more flexible search method, while allowing a self consistent comparison to the pervious UCD searches at higher Galactic latitude. The 2MASS photometry can then be combined with multi-band photometry from an optical survey of complimentary depth.
For optical photometry there were two choices available at the beginning of our search, which could facilitate a cross-correlation with the 2MASS data: the SuperCOSMOS Science Archive (SSA) and the USNO-B1.0 catalogue – both of which contain digitised photographic BJ, R63F, R59F and IN plate scans covering the whole sky. The SSA and SSS resources were chosen due to the availability of excellent database mining tools and the extensive enhanced quality information for each detection.
While the near-IR photometric data from the three 2MASS JHKs bands are contemporaneous, the optical photometric data from the individual bands of the SSA will not be, as the original photographic plates range in epoch from (POSS-I) to the late-nineties (IN). A significant proportion of the contaminant objects in the Galactic plane are mostly in the form of distant AGB Long Period Variable (LPV) stars which can exhibit a large amplitude in variability of up to five magnitudes in the V-band, and typically have periods of 200 to 500 days (Aller 1991). Thus, non-contemporaneous colours of LPV stars resulting from combining the near-IR and optical photometry are expected to exhibit a large range in scatter. Due to this behaviour in the optical/near-IR colours it was necessary to construct selection criteria which utilise the full range of photometric bands (J, H, Ks, BJ, R63F, R59F and IN) available, to remove as much of the contamination as possible.
Although intrinsic differences exist in the loci of optical/near-IR colours between UCDs and LPVs, variability induced scatter in the colour ranges of these latter objects spreads them through the UCD loci. The more optical/near-IR two-colour planes one has, the greater the chance of ’catching’ these contaminants outside the selection criteria defined for UCDs. In defining this method we have characterised seven colours, as well as a reduced proper-motion criterion, over the UCD spectral range of interest. These have been utilised in both our primary near-IR candidate selection, and secondary optical/near-IR selection process.
The characterisation of these selection criteria was achieved using a sample of 186 known bright reference UCDs (mostly L dwarfs but with some late-M dwarfs) with reliable near-IR 2MASS photometry (), which were obtained from http://dwarfarchives.org. SSA R63F, R59F and IN photometry was also obtained for these reference UCDs.
In total we searched an area of sky of 5042 deg2 at low southern Galactic latitudes ( and ), partitioned into smaller regions we termed ’sky tiles’, to facilitate a more manageable number of objects to be checked in each instance. A sky tile area typically of 200 deg2 was found adequate for this purpose, especially through the Galactic mid-plane ().
2.1 The Near-IR Candidate Selection
The primary near-IR candidate selections were obtained via the 2MASS Point Source Catalogue (PSC) gator333Available at http://irsa.ipac.caltech.edu/applications/Gator/ tool. A number of query parameters were set to govern the spatial and photometric constraints for a specific sky tile query. The following parameters and quality flags have been used consistently throughout:
-
cc_flg: The JHKs Artefact/confusion/contamination flag: set to ’000’.
-
mp_flg=0: Minor planet identification flag: is always set to ’0’.
-
gal_flg=0: Flag indicating if object is contaminated by an extended source – always set to ’0’.
-
prox: Nearest neighbour distance in the PSC. Always set to prox arcsec .
-
ph_qual: Photometric quality flag: set to .
We also use a combination of the ph_qual flag value and the 2MASS source uncertainty () for each candidate to retain those candidates with an implied . Using this SNR limit should allow limiting magnitudes of , , and to be reached (see the 2MASS users guide documentation444see http://www.ipac.caltech.edu/2mass/releases/allsky/doc/sec2_2.html.). However, these PSC limiting magnitudes are for high Galactic latitudes (b) and the true limiting magnitudes in the Galactic plane due to confusion noise will be brighter at about , , and . In § 2.6 we define a candidate selection and classification criteria which has this photometric limit of as a baseline, and thus compliments this.
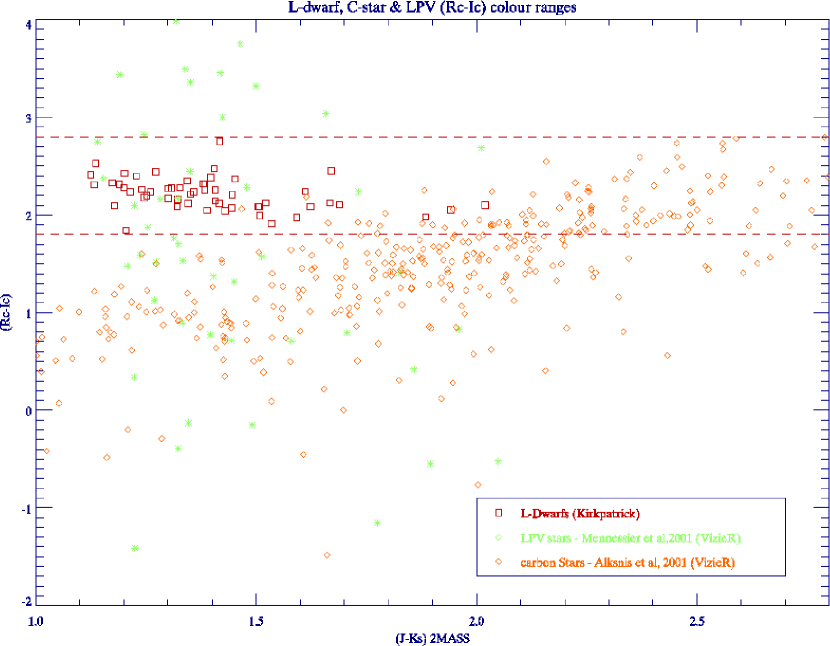
The primary near-IR candidate selection is achieved by passing the 2MASS photometry through a custom set of JHKs two-colour, and colour criteria. These were devised by carefully characterising the loci of known LPV Carbon and ‘O’-rich AGB stars (S-type Zirconium group AGB stars also exist, but are not considered here as they have a much lower observed frequency), in relation to the 186 known bright reference L dwarfs. Photometric data for these known LPV stars were obtained from catalogues available through VizieR (Mennessier et al. 2001; Alksnis et al. 2001). The slopes defining the / selection region were carefully crafted such that they were kept as tight as possible to the L dwarf locus, avoiding as best as possible the main bulk of the LPV locus along the red end of the region.
Three of the reference L dwarfs fell outside of the two-colour selection cut, but this was felt acceptable as adjusting the criteria to accommodate them would let through an unacceptable amount of contaminant objects. In addition to this reason two of the three L dwarfs have unusal properties which may explain their bluer colours: LSR 1610-0040 (2MASS J16102900-0040530), an older metal-poor early-type L subdwarf (sdL: Lépine et al. 2003); 2MASS J00145575-4844171, a young field L dwarf with a slightly peculiar spectrum, perhaps indicative of lower metallicity (L2.5pec: Kirkpatrick et al. 2008). The third object is 2MASS J21373742+0808463, an L5 not reported as having unusal properties (Reid et al. 2008) which lies close to the redder colour selection boundary.
It was also noted that there is an overlap in between late-M dwarfs and early-L dwarfs. Under further investigation, four of the 186 reference L dwarfs were found to be bluer than expected, and to accommodate these we carefully adjusted the lower blue-ward limit to whilst still allowing field M dwarf contamination to be reduced, compared to the range in this colour expected for late-M and L-dwarfs in the literature (e.g., Leggett 1992; Leggett et al. 2001; Dahn et al. 2002; Cruz et al. 2003; Phan-Bao et al. 2003; Vrba et al. 2004). The final , , and colour cuts allow objects in the spectral range from M8V to the L–T transition to be selected.
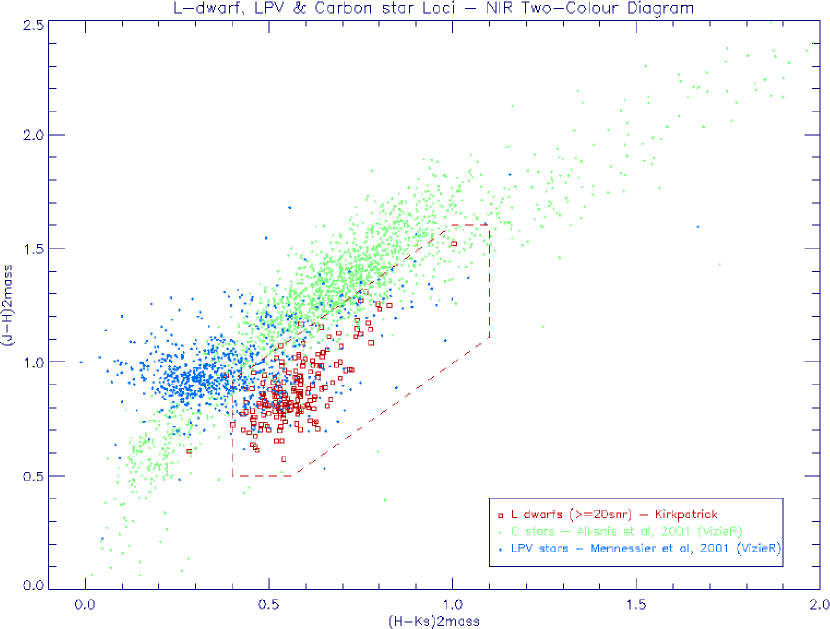
The adopted / two-colour UCD selection criteria is shown in Fig. 1, which also plots the reference L dwarfs with the high signal-to-noise 2MASS photometry, along with the LPV ‘O’-rich and carbon stars. The JHKs selection criteria are defined as follows:
In this JHKs two-colour plane the criterion results in the following:
2.2 The Optical SSA Cross-Correlation
The SSA R-band magnitudes are obtained from digitised scans of R63F and R59F photographic plates. These photographic RF passbands have non-standard profiles that differ quite considerably from the standard Kron-Cousins Rc profile, which has a long declining transmission tail that extends nearly 1500Å further into the red. As a result this can lead to significant differences when comparing uncorrected magnitudes between the two systems for very red objects (e.g., see Bessell 1986, for details on the passband profiles and system transformations). However, the situation appears much better between the IN-band and Ic magnitudes, with only very small offsets being required. Where possible, all the R63F, R59F and IN photometry obtained from the SSA are transformed onto the standard Kron-Cousins system (Rc and Ic) using the transformations defined by Bessell (1986), to produce consistent magnitudes across the whole dataset which are also more readily comparable to those in the literature, such as those used in defining the selection criteria.
For the SSA optical photometry query we return the magnitudes calibrated for point sources (sCorMag[band]), and determine the quality of each detection via the bitwise quality flags (qual[band]). Photometric detections of each band which have quality flags are rejected in line with the advice given on the SSA on-line data overview.
Due to the significantly increased source density in the Galactic plane, identifying the correct optical counterparts to 2MASS detections will be more problematic compared to regions at higher Galactic latitude. SSA query cross-matching search radii of 2 arcsec and 5 arcsec were tested on the same 2MASS dataset for a region of the Galactic plane; it was found that the 2 arcsec radius let through significantly more objects inhabiting regions of a Ks/() CMD and / two-colour diagram that are consistent with being mid- to late-M dwarfs. This is most likely due to the larger proper-motions of nearby late-type dwarf stars, whose motion over the average 2MASS–SSA epoch difference ( years: see § 5.2) resulted in the 2 arcsec angular radius being exceeded. Thus, these objects passed the primary near-IR colour selection, but were not subject to the full set of criteria that would have rejected them. Therefore, throughout our search we used a 5 arcsec cross-matching radius, noting the possibility that some nearby high proper-motion objects may not be cross-matched with an SSA detection. However, as optical SSA detections are not a requirement for candidate selection, any genuine nearby (possibly bright) high proper-motion UCD should still be identified from our full range of selection criteria.
2.3 Optical Data Preparation
2.3.1 Gravity Skewed Photographic-to-Cousins Conversion
If either, or both, of the SSA RF-bands are available then the RF-band(s) and IN-band are transformed onto the standard Cousins system. These RF-band transformations are valid to a red limit of , which is the same as the red limit defined in our c colour criterion (see § 2.4.3). However, due to the spectral differences between the late-M and L dwarfs, it is uncertain how valid these transformations are for the later UCD spectral types of interest here. To limit the possible effects of such differences, the optical colour selection criteria were all defined around the reference L dwarfs (as mentioned above), as well as LPV stars with well constrained photometry, using Rc and Ic magnitudes transformed from the SSA photometry.
An interesting and potentially useful aspect of one of these transformations is that they appear to be dependant on the stellar luminosity class, i.e., on their surface gravity. The R63F magnitudes show differences of up to between K- and M-type giants compared to dwarfs of the same spectral types (Bessell 1986). Use is made of this property by only applying the dwarf transformation to all the candidates which have an R63F and an IN detection. Thus, if a potential candidate has a low surface gravity – i.e., is of luminosity class I-III – the converted Rc magnitude will be offset compared to the Rc magnitude derived from the R59F detection (unaffected by gravity). This gravity induced offset between the two Rc derived magnitudes will assist in the rejection of giant and AGB contaminant stars during the check for variability as discussed next in § 2.3.2, if both RF-bands are available. The transformations are carried out according to the following procedure:
-
1.
If one, or both, of the RF-bandsand the IN-band are present then all are transformed to the standard (Cousins) system.
-
2.
If only one or both of the RF-bands are present, but there is no IN-band, then an offset is applied to the RF-band assuming (typical for an L dwarf).
-
3.
When only an IN detection is available no correction is made, as the match to Ic is good enough to be acceptable.
2.3.2 Dual Epoch RF-Band Variability
The availability of two R-band detections at different epochs from the SSA gives the ability to test for brightness variability for each candidate. As mentioned previously one of the main types of contaminant object which share similar areas in the near-IR colour planes are the LPV stars, of both Oxygen-rich, and Carbon-rich types. These LPV stars typically have periods of between 200 and 500 days, and brightness variability of up to five magnitudes (visual). This makes them easy to distinguish as long as their minimum apparent R-band magnitudes are bright enough to accommodate a realistic chance of a detection, at two widely spaced epochs.
In contrast, optical variability in L dwarfs has only been observed at a very low level (in a small number of cases): Gelino et al. (2002) showed RMS I-band variations to be no more than , while Littlefair et al. (2006) find evidence variability induced by dust-cloud weather in the L dwarf 2MASS J1300+1912 (L1) at the 5 per cent level, using the fast cadence photometer ULTRACAM (also see Martin et al. 1996b; Tinney & Tolley 1999; Martín et al. 2001). Therefore, R- and I-band variability in UCDs is not considered to be significant compared to variations due to the larger photometric uncertainties. However, flare activity in can lead to significantly increased H emission in Late-M dwarfs (e.g., Martín & Ardila 2001), potentially causing a rejection in the R-band variability test here. However, the occurrence of such flares appears to be low at 3 per cent (for late-M subtypes at low Galactic latitudes: Hilton et al. 2010), therefore, such flares are not expected to cause a significant problem here.
To apply the variability test in a consistent way requires a variability threshold to be defined in relation to a control sample: our reference UCD sample with well constrained near-IR photometry, for which both R63F and R59F detections are also available (a total of 65 objects). This threshold value was defined as the modulus of the maximum difference between the R63F and R59F transformed Rc magnitudes, which was found to be . Thus, any candidate displaying a variability of
is rejected.
2.3.3 RF-band Brightness Bias
For cases where candidates have both RF-bands available a choice has to be made which transformed Rc magnitude will be used for the optical selection criteria. Rather than just choosing the R59F detection for all candidates, which generally has a better correction and SNR than R63F, and also reaches to a fainter limiting magnitude by (Hambly et al. 2001b), the brightest of the two detections is chosen instead. For the more unlikely cases where the two magnitudes are equal the R59F is selected in preference.
The problematic carbon stars lie very close to, and slightly overlap with, the L dwarf loci and two-colour plane selection criteria shown in Fig. 3 and Fig. 5. Using a positional argument based on the overwhelming number of these contaminant objects, even small differences between the R63F and R59F transformed Rc magnitudes () can be exploited by choosing the brightest Rc magnitude, to bias in favour of a non-selection. While this potentially applies to a genuine UCD candidates, it is more likely that this bias will aid in the rejection of LPV stars.
2.4 Near-IR/Optical Selection Criteria
As might be expected from looking at the overlap between the AGB stellar locus with that of the UCDs in the two-colour plane of Fig. 1, that 2MASS JHKs data alone are not adequate for a selection to be made. The sheer number of intrinsically bright contaminant objects detected to large distances, and thus large space volumes, swamps any near-IR selection made close to the Galactic plane. To alleviate this contamination problem it was therefore necessary to combine the 2MASS near-IR photometry with optical photometry and proper-motion data from the SSA. We thus defined a set of well characterised optical-NIR and RPM based selection criteria, by investigating the photometric and kinematic properties of the distinct contaminant and non-contaminant populations.
2.4.1 The Criterion
Although UCDs are not usually detected in the B-band, very nearby examples could be. Furthermore, we expect there to be many bright contaminants with detections in the B-band, such as ‘O’-rich LPVs in which the dominant molecular absorber is titanium oxide that blankets more of the red end of the spectrum compared with carbon stars. Thus it is important to constrain the candidate sample using this colour.
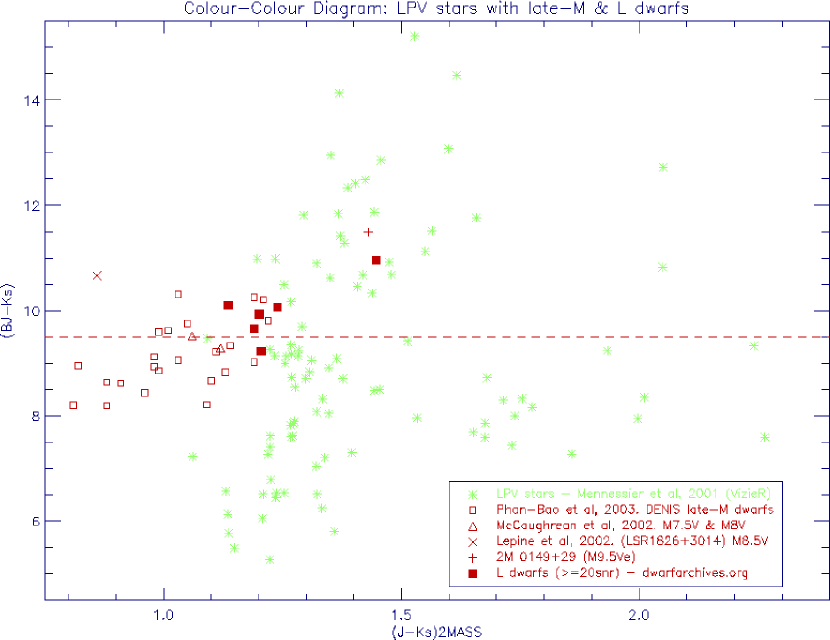
To define a colour cut, SSA BJ photometry was extracted for 96 of the LPVs from the catalogue of Mennessier et al. (2001), as well as for a selection of late-M dwarfs with good B-band photometry available from the literature: LSR1826+3014 (Lépine et al. 2002a); LHS2065 (Leggett 1992); 2M0149+2956 (Liebert et al. 1999); LP775-31 and LP655-48 (McCaughrean et al. 2002; Phan-Bao et al. 2003). We aso obtained BJ magnitudes from the SSA for six further UCDs listed on http://dwarfarchives.org; two late-M dwarfs and four L dwarfs from our high S/N reference sample (photometry for these six UCDs are presented in Table. 1), which together, allowed a boundary between the M- and L-type dwarfs to be defined in relation to the LPV objects. The resulting two-colour diagram is shown in Fig. 2, in which a trend appears to be visible extending from the M dwarf to the L dwarf spectral types as the colour increases with an increasing index. A range in variability spanning magnitudes in was seen to exist for the ‘O’-rich LPV stars, with an average colour of . A cut in this colour plane was made such that objects with are accepted, corresponding to a value of (our lower limit) along the visible trend, and therefore an approximate spectral type of M8V.
| (SSA) | (2MASS) | (Optical/Near-IR) | ||
|---|---|---|---|---|
| Name | BJ | SpT | ||
| 2MASS J23453903+0055137 | 22.238 | 9.66 | 1.190 | M9V/— a |
| DENIS J220002.05-303832.9 | 22.261 | 10.06 | 1.240 | —/L0 b |
| 2MASS J10220489+0200477 | 22.829 | 9.93 | 1.201 | L0 pec/— c |
| 2MASSI J0523382-140302 | 22.594 | 10.96 | 1.446 | L2.5/L5 d |
| SDSS J161928.31+005011.9 | 22.414 | 9.23 | 1.205 | L2/— e |
| SSSPM J0109-5101 | 21.193 | 10.10 | 1.136 | M8.5V/L2 f |
(a) Discovery and optical spectral type by Reid et al. (2008).
(d) Discovery and optical spectral type by Cruz et al. (2003). Near-IR spectral type from Wilson et al. (2003).
(e) Discovery and optical spectral type by Hawley (2002).
2.4.2 The and Criteria
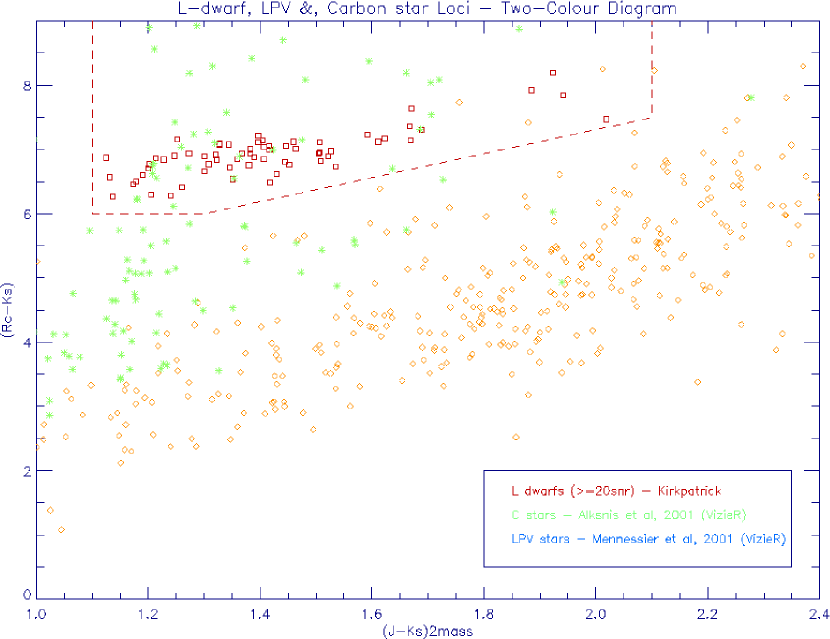
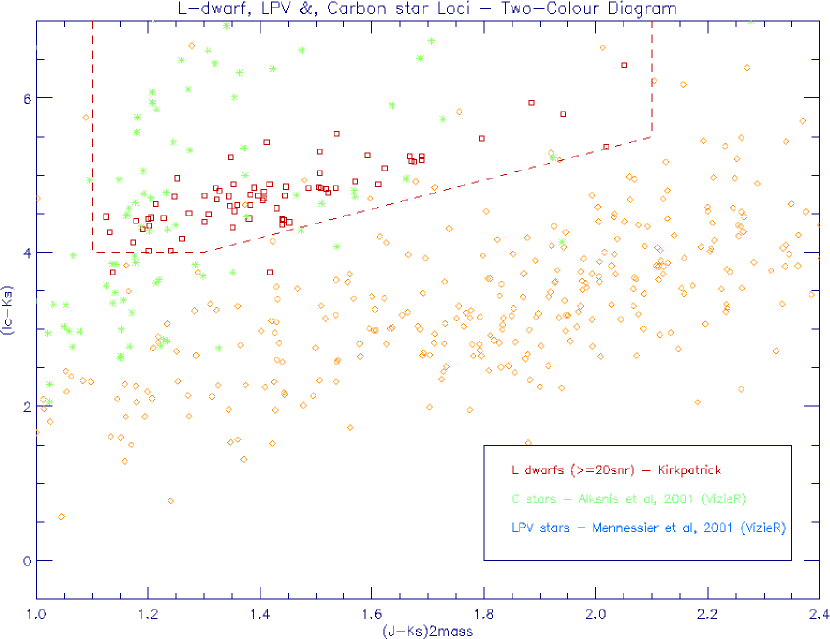
To maximise the efficiency of the contaminant rejection these two selection criteria were defined as slopes in the two-colour planes against . As well as using our reference set of L dwarfs (65 with both R-band and I-band data), scatter in the colours of L dwarfs was taken into account from the literature (see § 2.1) in defining these slopes. Although the colour generally gives a better monotonic relation for UCDs (Dahn et al. 2002) extending down to the latest T-dwarfs (as the I- and J-bands are relatively unaffected by CH4, but are heavily dependant on the K i absorption (Dahn et al. 2002)), we decided to use the colour in preference because it gives a better baseline separation in the two-colour selection plane of magnitudes, instead of magnitudes. As can be seen in Fig. 3 and Fig. 4, the locus of the L dwarfs is separated better from the carbon stars in than in , but appear to overlap more in both at the extreme red end of the L dwarf range . The ‘O’-rich LPVs, on the other hand, extend right through the L dwarf locus upwards to redder and colours, and in general have much bluer colours than the carbon stars (). Thus, these two-colour selection criteria together should provide a good rejection efficiency against carbon star contamination. Our adopted and selection criteria are given in Exp. 1 and Exp. 2 below, and are also outlined as dashed lines on the two-colour planes shown in Fig. 3, and Fig. 4.
| The ()/() selection plane; | |||
| and, | |||
| (1) | |||
| The ()/() selection plane; | |||
| and, | |||
| (2) |
As shown in Fig. 4 a couple of the known reference L dwarfs would be rejected due to their values being just under the lower limit of . We do not adjust the lower limit to include them as the values of mid-to-late M dwarfs appear to be very sensitive to small changes in in the range of , due at least in part to variations in dust, cloud coverage, and metallicity (e.g., see Leggett 1992; Liebert & Gizis 2006, for details), and show scatter in this colour. Thus, lowering the limit could potentially let through many early- to mid-M dwarfs.
2.4.3 The c Criterion
Initially, no selection was made using this colour as this was implied from both the previous and criteria (i.e., ). However, we subsequently included this colour criterion as some bright () variables, which had passed both the previous and two-colour criteria, had c colours outside that expected for L dwarfs due to variability between the non-contemporaneous R-band and I-bandepochs. Therefore, an criterion was developed around our reference set of L dwarfs that was found to occupy a flat locus with increasing , having a narrow range of . The flat relation is not surprising as they display similar slopes in their loci for both the and colours against . The selection criterion has been defined in Exp. 3, and is shown in Fig. 5;
| (3) |
The c criterion contributes significantly to removing many bright contaminant stars. The narrow selection range in this colour acts to constrain the possible range of and colours in a way that behaves as a second pseudo variability constraint, for objects which either pass the dual R-band variability test (see § 2.3.2), or those that have just a single R-band detection along with an I-band. Our selection limits in this colour match very well with the range of values obtained by Liebert & Gizis (2006) for spectral types greater than mid-M to L–T transition.
2.5 Reduced Proper-Motion Criterion
Many of the photometric selected candidates were found to be bright compared to that expected for typical UCDs (i.e., ), with the number increasing dramatically toward Galactic longitudes of and latitudes of . Therefore, these are clearly dominated by contaminant objects that would be expected to have little or no discernible proper motion. Nearby UCDs and contaminant distant luminous giants and supergiants represent kinematically distinct stellar populations within the Galaxy, allowing proper motions and apparent magnitudes to be combined to create a reduced proper-motion selection criterion. When reduced proper-motion is plotted against a suitable colour to create a Reduced Proper-Motion Diagram (RPMD), it becomes a powerful discriminant in segregating stellar (and sub-stellar) population types (Luyten 1978). Here we utilise the 2MASS Ks-band apparent magnitude as our UCD candidates are brightest in the near-IR spectral region.
We determine reduced proper-motion as follows;
| (4) |
where the proper motion, , is in units of arcseconds yr-1 .
The H(K) selection criterion we developed was chosen by accessing the same ‘O’- and ‘C’-rich LPV star catalogues, and reference L dwarfs used previously, for which reliable proper-motions could be obtained from the SSA. For ‘O’-rich types there were 221, for carbon stars 546, while 65 L dwarfs were used (from http://dwarfarchives.org). The accuracy of the SSA derived proper-motions (see Hambly et al. 2001a, for details) are primarily dependant on the number of bands which have a detections (maximum of four), the separations in epoch of the scanned plates, and the faintness of individual detections. Typical uncertainties are mas yr-1 for magnitudes between , and become larger for short epoch baselines with faint detections.
Our RPMD can be seen in Fig. 6, which shows that the reference L dwarfs can be effectively segregated from the ‘O’-rich LPV stars. The carbon stars are also reasonably well segregated from the L dwarfs, but do appear to have some overlap. This may be due to the Alksnis et al. (2001) carbon star catalogue being contaminated by the recently identified population of dwarf carbon stars. These carbon dwarfs share the same disk kinematics of nearby M dwarfs, and are potentially more numerous than carbon giants (e.g., Lowrance et al. 2003; Mauron et al. 2004).

The H(K) selection criterion was defined to reject objects with . This limit was found to work well in removing many of the bright candidates that we know are dominated by contamination. In Fig. 6 one reference L dwarf is seen as rejected (representing 1.5 per cent of the reference sample), and a couple of other L dwarfs lie close to this limit. However, given the number of potential contaminant objects at lower H(K) values we consider it wise to stay with this conservative limit.
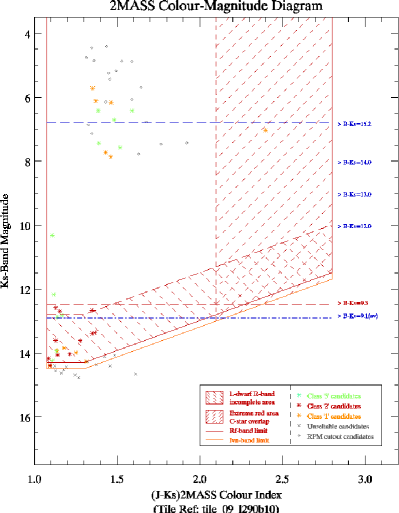
The effectiveness of the H(K) cut can be seen in the Ks/() colour-magnitude diagram of Fig. 7, taken from one of the sky tiles (200 deg2) centred on and . The 18 grey circles in this diagram are candidates that were removed by the H(K) cut, which amounts to 62 per cent of the bright objects with .
2.6 Candidate Classification
As our search progressed eastwards to Galactic longitudes of the number of candidates per typical sky tile increased significantly to several hundred (number dependent on exact and ). Confronted with such large numbers of candidates a classification scheme was developed to help identify the ‘quality’ of the candidates, in terms of their likelihood of being genuine UCDs.
This was achieved by defining a quality parameter which is defined in two parts, both in relation to a Ks/() CMD. The first part indicates whether there is a detection in each optical BRI-band, and whether that detection falls inside or outside the photometric completeness limit defined for that band. The photometric completeness limits of the optical bands are derived in relation to the Ks-band limiting magnitude using the following information;
-
1.
The limiting magnitude that corresponds to the SuperCOSMOS Sky Survey plate detection limits at an 80 per cent confidence level of an object being detected as a star (see Hambly et al. 2001b, for details). These limits for each band are: ; ; ; . Given the two RF-bands we adopt a limit of .
-
2.
How the slopes of the / and / selection criteria, coupled with the above magnitude limits, translate onto the Ks/() CMD.
For an Rc magnitude limit case this translates onto the Ks/() CMD as a faint photometric completeness limit defined as;
For an IN magnitude limit, this translates onto the Ks/() CMD as a faint photometric completeness limit defined as;
The BJ magnitude limit is , which translates onto the Ks/() CMD as a single faint photometric completeness limit defined by;
This part of the parameter contains a set of three character indicators, one for each of the BRI bands, which have been given one of the following attributes:
-
‘-’: for a non-detection which would fall outside the completeness limit of that band, given its Ks magnitude.
-
‘N’: for a non-detection that lies within the completeness limit of that band, so is theoretically bright enough to be detected as an UCD.
-
‘W’: for a detection in that band which lies within the photometric completeness limit.
-
‘O’: for a detection in that band which lies outside the photometric completeness limit (but has passed the error flag check).
So far this parameter can therefore contain combinations of the three individual band indicators such as ‘NOW’ or ‘-NW’, which in this example have the meaning in the first case of: has no detection in BJ, but is within the expected photometric limits, has an RF magnitude outside of the detection limits, and has an IN magnitude which falls within the Ic limit. In this example the RF-band detection indicator was said to be outside the completeness limits; for some of the RF and IN plate scans the detection limits have been found to be fainter than the and limits expected, but still have SSA quality flags set to , therefore these objects have been accepted as candidates if they pass all the selection criteria.
The full quality parameter is now defined based on the first part, and is designed to prioritise the candidates into four classes to denote their ‘quality’ as an aid to the visual checking process. This parameter (which we have termed OP - an ‘Optimistic Parameter’ to denote optimism in finding a potential UCD) classifies the candidates according to their position on the Ks/() CMD, relative to the photometric completeness limits, and according to the combination of indicators in the first parameter. Thus, encoded in these indicators are potentially useful information such as the likelihood of a candidate being a bright high proper-motion nearby object – based on how many, and which, optical detections they have. Therefore, a bright candidate having an indicator attribute combination of ‘NNN’ would be very interesting as it might be nearby and have a high proper motion, explaining why it has no optical detections in the merged SSA – when it should have. Conversely, an object with a combination of ‘- - O’ has only an I-band detection outside of the completeness limit, and is most likely to be a faint, distant, and reddened contaminant object.
This classification scheme has been defined such that the differentiation in class indicate the likelihood of a true UCD detection – Class ‘3’ being the best. Candidates whose position falls outside the Rc- and Ic-band limits on the CMD, with or without actual optical detections are classified as Class ‘0’. These are most likely highly reddened distant giants and/or luminous main sequence stars.
The definition of each of the OP ‘classes’ were carefully chosen from different combinations of attributes from the first quality parameter, such that they are likely to indicate the most promising candidates in priority of each ‘class’. These combinations are listed below:
-
‘Class 3’: Potentially the most interesting with possible large proper-motions and being bright enough in the Ks-band to have at least two optical detections (actual or possible). Have the attributes of: ‘NNN’, ‘NWN", ‘NON’, ‘-NN’, ‘-WN’, and ‘NWW’.
-
‘Class 2’: Good candidates with a mixture of one or two optical detections for either brighter or fainter candidates. Have the attributes of: ‘NOW’, ‘NNO’, ‘NOO’, ‘OWW’, ‘-OW’, ‘-WW’, ‘-NW’, ‘-ON’, and ‘- -W’.
-
‘Class 1’: Are possible candidates, but may also be contaminants, and include attribute combinations not given in the previous ‘Class 3’ and ‘Class 2’ cases, and also for‘Class 0’ (see below). Comprise of the fainter candidates near the photometric limits.
-
‘Class 0’: Objects in this class lie below the photometric limits with either one, or no, optical detections, and are not considered reliable candidates. Have the attributes of: ‘- - -’, ‘- -O’, and ‘-O-".
All the ‘Class 3’ to ‘Class 1’ candidates are retained for the final visual checking stage.
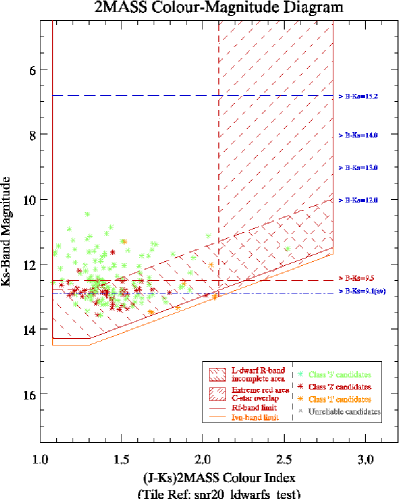
The validity of the classification scheme was tested by comparing the attribute combinations of the first quality parameter for the reference L dwarfs, relative to their positions on the same CMD to check that these differing classes do reflect their potential to indicate nearby/interesting UCDs. This reference Ks/() CMD is shown in Fig. 8, and it may be seen that the classification scheme works well with the brightest L dwarfs being given the best rating (green symbols), and the L dwarfs near the lower edge of the limits having the least rating (orange).
2.7 Additional selection requirements in Highly Overcrowded Regions
For Galactic longitudes of and , and eastwards of for the colour and H(K) selection alone returned up to several hundred UCD candidates for a typical 200 deg2 region, due to problems of overcrowding and reddening. The majority of the candidates saturating the colour and H(K) selection method were of the fainter ‘class 1’ candidates (largely without proper-motion measurements).
An additional approach was developed to address this issue that also retains the best chance of detecting bright/nearby UCD candidates, and is summarised thus: ( i) A limit of one class [321] candidate per square degree (averaged over an individual sky tile) was chosen to facilitate a sensible number to be checked by visual means.( ii) To impose a magnitude limit of .
A favourable aspect of this approach is that it can be used to bias the candidate selection away from pockets of highly clumped near-IR only detections due to regions of high reddening, to one that is from a more homogeneous distribution. However, this additional overcrowding and photometric ‘clipping’ criteria would only be activated when the surface density of ‘class [321]’ candidates exceeded , and was implemented as part of our automated procedure with details summarised as follows:
-
1.
Breaks each sky tile into a 2-dimensional grid of elements in and b.
-
2.
Candidates are selected from these elements begining with elements containing the least number, but which have been sorted such that the best quality candidates (class [321]) are selected first in a stepwise fashion.
-
3.
The selection continues until the maximum number of candidates (equal to the whole number of square degrees in the sky tile) is reached, or would be exceeded, given the number in the next element.
-
4.
Candidates are then selected from the remaining elements until the maximum permitted number is reached, except that this time only Candidates with magnitudes of are selected. If not enough bright candidates are found to reach the maximum limit, then different elements containing successively greater number densities are checked in ascending order using the criterion, until it is reached, or no more bright candidates are found.
The advantage of this approach is that most of the candidates in the elements are selected in the same way to regions where the overcrowding procedure does not apply (i.e., ), except that they are biased towards the best candidate class 3 objects. In practice it was found that typically only a few photometrically ‘clipped’ candidates of either ‘class’ brighter than were selected from a typical region.
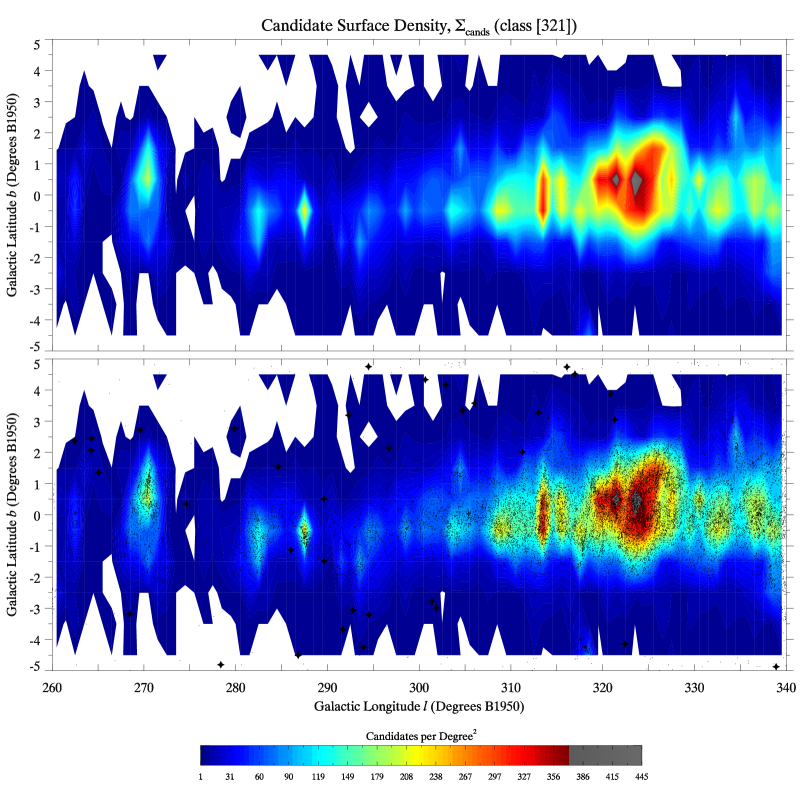
The problems of overcrowding, and our effectiveness in dealing with it, are illustrated in both panels of Fig. 9 and Fig. 10, which show colour-coded contour maps of the candidate surface density, , for an 800 deg2 region along the Galactic plane within , and a 1500 deg2 region within respectively. These surface density maps are based on all class [321] candidates (55,782) before the overcrowding criteria have been applied, illustrating the degree of structure in the distribution of these candidates, as well as indicating the shear number involved. The base level contour in Fig. 9 and Fig. 10 is set at , the same value that is used to force the method to switch to using the overcrowding selection process. The contouring shows that there are still significantly large areas with low values of for longitudes between , with the lower panels of both Fig. 9 and Fig. 10 over-plotting the actual class [321] candidates. This confirms that there is a large degree of clumping on small scales of one square degree or less, presumably from dense regions of high reddening such as in small isolated dark clouds (i.e., see Bourke et al. 1995). Also plotted on the lower panels of these two Figures are the final UCD catalogue members (as black filled star symbols) that trace a more homogeneous distribution of lower surface density.
It is interesting to note that the region of high surface density (red colour) in Fig. 9 centred around and , is a reddening hot spot known as the Norma dark cloud – a giant molecular cloud and site of massive star formation. Another region of high reddening showing a high surface density is located at about and (left side in Fig. 10), and coincides with the Lupus molecular clouds – one of nearest regions of low-mass star formation and part of the Sco-Cen OB association lying at a distance of 150 pc (e.g. see Crawford 2000, and references therein). Consequently, at these location there exists a large fraction of class [321] candidates with only near-IR detections (23.6 per cent).
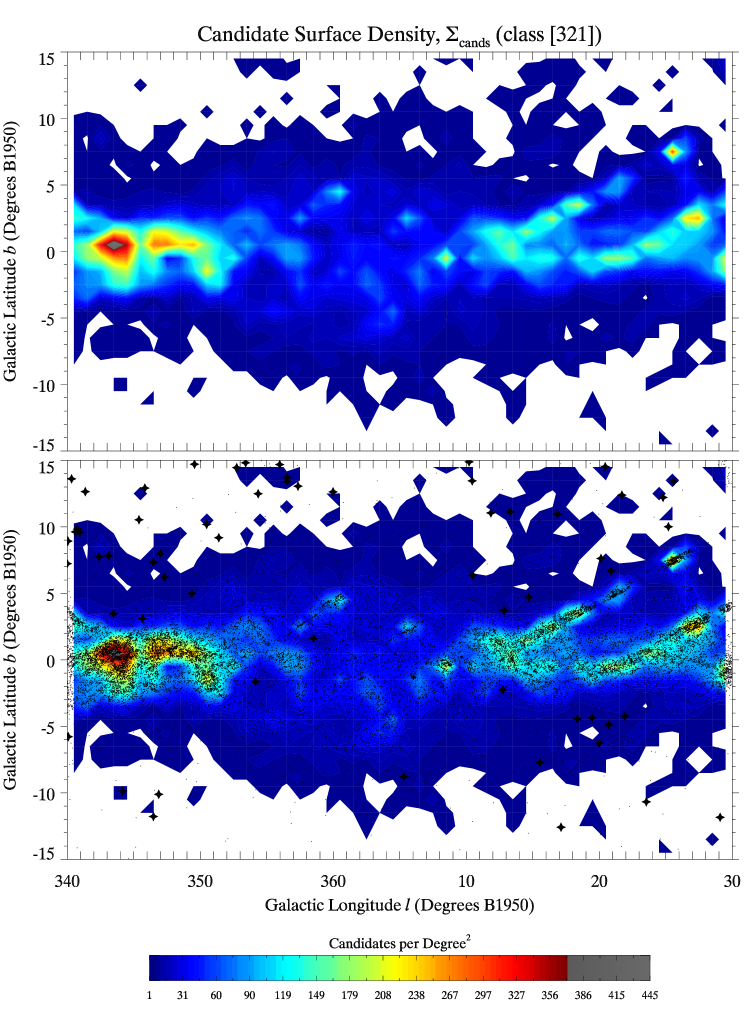
On the right of Fig. 10 (primarily between ) there appear to be curious linear features that look artificial in nature. On further investigation these features appear to run in declination (constant in ) and trace the East and West overlap regions of the degree SSS scanned photographic plates. However, plotting the SSA scanned source catalogue data for these regions reveals there to be an over density of detections in these overlap regions, caused by spurious detection records from a combination of two or more plates in these overcrowded and reddened regions of sky (N. Hambly, priv. comm.).
What appears to be happening is that the SSA query returns less optical counterparts in these overlap regions, most likely due to the constraint on the quality flags rejecting the spurious and confused detections. The linear features seen in Fig. 10 are then caused by an over density of selected candidates with only near-IR photometry along these overlap regions, which cannot be matched to optical data. These linear features, along with the other over-densities of near-IR only candidates, will serve to limit the efficiency of our method in detecting genuine UCDs in these difficult regions.
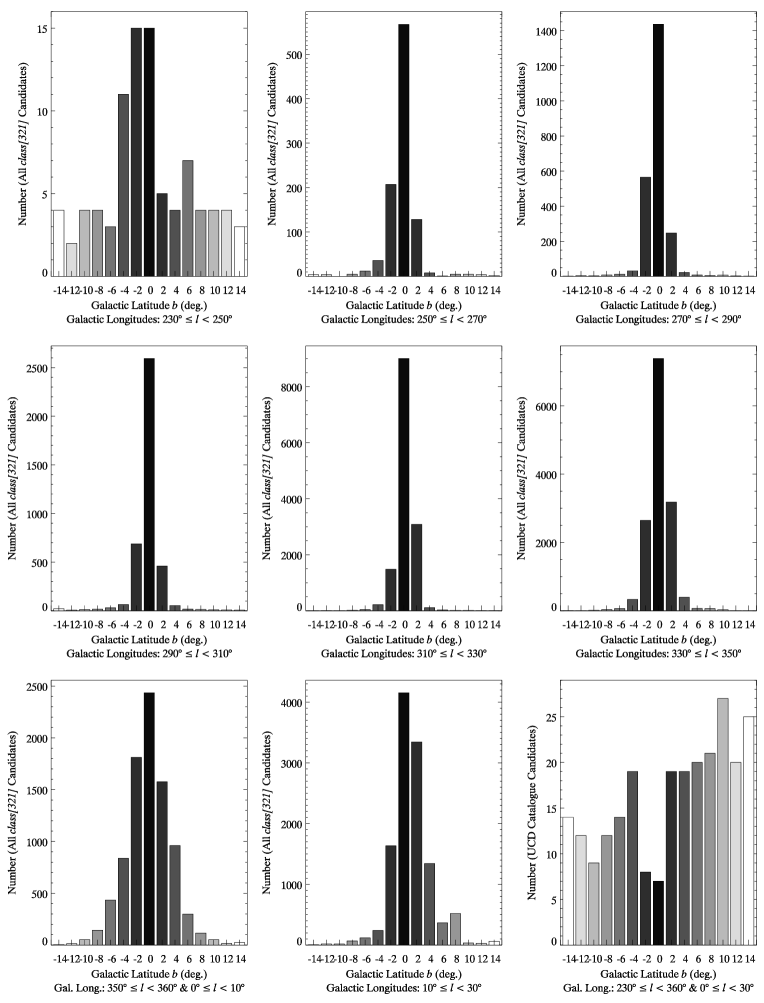
To assess the degree of success our method has in dealing with overcrowding and reddening, we studied the spatial distribution of the class [321] candidates before application of the overcrowding criteria, with that of the final UCD catalogue members selected from the remaining candidates after application. We plotted the class [321] candidates as a function of Galactic latitude for seven consecutive ranges in Galactic longitude, which are shown as histograms in Fig. 11. It is clear from these histograms that the number of candidates increases dramatically within eastwards of , indicating that a large majority will be highly reddened contaminants due to the high stellar densities seen through the disk as the Galactic centre is approached.
In the lower right histogram of Fig. 11 we have also plotted the distribution of all our UCD catalogue members (246: for ). This shows that the UCD catalogue members have been selected from a much more homogeneous distribution of sky over the area searched, more in-line with what would be expected for a UCD population within a 100 pc radius. Interestingly, this histogram suggests that the efficiency of our candidate selection process slightly favours northern Galactic latitudes, for reasons which are currently unclear.
2.8 Visual Checking: Refining the Candidate Sample
Visually checking all the sky tile candidates obtained from the automated method represented a significant investment of time, requiring somewhere in the region of separate images to be examined. Here we discuss our approach used to produce the final catalogue by removing additional contaminants, the majority due to the following:
-
1.
associated with plate artefact’s/defects.
-
2.
associated with small isolated dark clouds, or in highly reddened regions and showing no proper-motion.
-
3.
associated with regions of bright nebulosity (if no proper-motion is evident).
-
4.
detections associated with bright stellar halos.
-
5.
bright variable stars (e.g., giant LPVs) without SSA listed detections (i.e., through confusion).
-
6.
photometrically confused/blended objects in highly crowded regions showing no sign of proper-motion.
2.8.1 Visual Checking Procedure
For each candidate we examined FITS images for each BJ, R63F, R59F, and IN band obtained from the SSS. The positions of the candidate 2MASS catalogue entries were overlaid on the images to identify the optical counterpart; highlight any astrometric calibration problems if present (i.e., calibration offsets not being confused with proper-motion); and determine by-eye if the candidate displays any proper-motion (if SSA database values were unavailable), or has a consistent proper-motion with an SSA measured value. In many cases 2MASS images were also checked and ’blinked’ compared with the SSA images to aid in this process.
For candidates where the optical counterparts were easily identifiable and isolated (i.e., not photometrically blended with nearby objects), the checking process consisted of verifying that the SSA magnitudes for each band had: stellar profiles, brightness differences consistent with very red optical colours of UCDs (i.e., to identify spurious photometric measurements), and that any discernible proper-motion was consistent with epoch differences. For these situations the SSA proper-motion measurements were used if available and deemed reliable if having small uncertainties. Unfortunately, well behaved situations like this were quite uncommon, especially so for regions covering the Galactic plane (). So, for the majority of cases many problems were encountered that required different approaches to be taken to accept, or reject, a potential catalogue candidate. Two particular recurrent problems were identified:
-
1.
SSA R- and/or I-band photometry for objects in the initial candidate list is missing, or is obviously incorrect compared to the brightness of the optical counterpart in the SSS image(s); this maybe due the object faintness, proximity to nearby objects (i.e., ″), or an SSA miss-match due to high proper-motion and/or high stellar densities.
-
2.
An object would have an optical detection in one or all of the BJ, R63F, R59F, and IN images (and may or may not have SSA magnitudes), but show no sign of proper-motion. This situation usually occurred when: (i) the variability of an LPV star was caught in each non-contemporaneous band such that the derived optical and optical-NIR colours pass each criterion, (ii) an object with only one faint R- or I-band detection that passes the colour criterion – this was a common occurrence and such candidates are highly reddened distant objects, (iii) objects (bright or faint) that are photometrically blended with very nearby objects in crowded fields, and thus have incorrectly measured magnitudes.
Solutions to these two recurrent problems were devised which were included as part of the method:
-
1.
In this situation the photometry available in the SSS image FITS detection tables was utilised. However, sometimes IN detections had incorrect pairings with the corresponding R63F and/or R59F detections, especially in highly crowded regions or for higher proper-motion objects. Once optical counterparts were correctly identified, FITS table RF-band(s) and IN band magnitudes were then converted onto the Cousins system (as discussed in § 2.3.1), with the resulting colour indices then subjected to the same criteria as applied in the initial selection process (details given in § 2.4). In these cases proper motions (where evident) were calculated from the astrometric differences between the 2MASS detection (from the PSC) and an SSS optical detection(s). The SSS optical detection with the longest temporal baseline and bright enough to give a reliable centroid was used.
-
2.
The solution for the second case was to impose an astrometric criterion based on the argument that if any measured difference in the object positions between two (2MASS and SSA) epochs is less than the typical SSA astrometric uncertainty of , then the object is unlikely to have any significant real proper-motion. If an object under test had a motion greater than this lower limit, and the resulting H(K) value passed the selection criteria (see § 2.5), then the candidate was retained. One potential problem with this solution is that caused by small epoch differences of less than ten years. As mentioned, the average RF and IN plate epoch difference to 2MASS is years, but in some regions the epoch difference between the R59F, and IN plates can be significantly less than this (e.g., as low as two years in some cases). Potentially this could lead to some genuine UCD candidates being rejected. However, 2MASS / UKST/ESO epoch differences of less than ten years are not common, so for the majority of cases this was not an issue.
Both of these approaches were effective in greatly reducing the numbers of contaminants in the initial candidate list, particually from longitudes of for , and all regions eastward of .
There were a number of objects during this search for which no optical detections could be identified with the 2MASS position in any of the SSS image pass-bands. Reasons for this may include the following:
-
1.
variability of contaminant LPV stars which have been coincidentally observed in each optical pass-band at the stars minimum has resulted in them being too faint to detect.
-
2.
a fast moving Solar system object such as a minor planet or Near Earth Object (NEO).
-
3.
a genuine high proper-motion nearby UCD, and/or one of late spectral type.
To help address these possibilities the DENIS database and I-, J-, and K-band images were checked to see if any detections were visible at the 2MASS locations. If no DENIS database entry or detection was visible in the DENIS J-band (with a limiting magnitude of – similar to 2MASS), then we assumed the candidate was a transient Solar system object or variable star, and it was rejected. However, if a detection was visible at (or near) the 2MASS position then the object was retained.
2.8.2 Examples of Visually Based Rejections
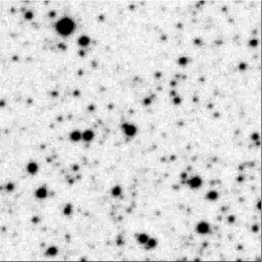
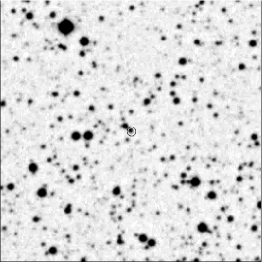
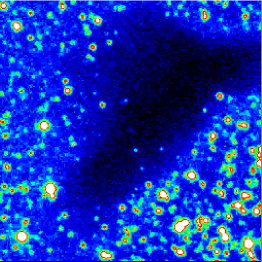
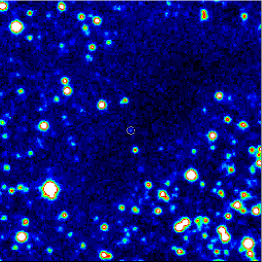
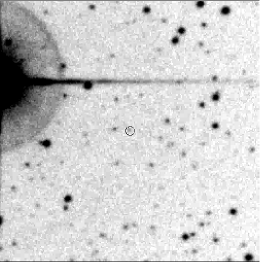
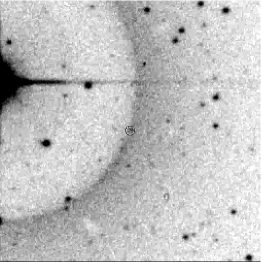
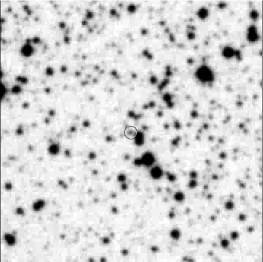
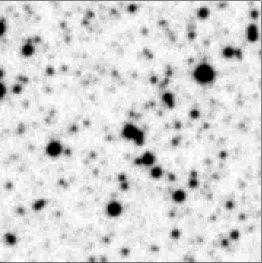
Figures 12(a)-12(d) and 13(a)-13(d) show examples of typical problem objects encountered during the visual checking stage. The problem of photometric blending is highlighted in Fig. 12(a)-12(b) and Fig. 13(c)-13(d) which show how the proximity of these objects to their close neighbours blends their photometry, rendering their magnitudes inaccurate or absent in the SSA. In the former two Figures (12(a) and 12(b)) the object in question appears to be a LPV due to its large brightness difference between the SSS RF-band images. This object had no SSA optical magnitudes listed, and was rejected due to its variability after inspection. For the latter case in Figures 13(c) and 13(d) this candidate appeared to be a non-variable giant which only had an SSA BJ magnitude listed, again probably due to photometric blending in both the RF and IN detections. The BJ image in this example (panel 13(c)) was used to reject this candidate, as its measured proper-motion gave an reduced proper-motion value outside the H(K) criterion.
Figures 12(c) and 12(d) show one of the better examples of a number of small dark molecular clouds that were encountered, causing distant luminous stars to be reddened into the near-IR colour selection planes. The circled object lies in the most dense part of this cloud and has only an SSA IN magnitude listed which passed the criterion. This object was also rejected due to its H(K) value falling below the criterion, using the approach of the ‘second solution’ mentioned above. The last example pertains to a candidate which lies in the halo of a bright star, which can be seen prominently in the IN image of panel 13(b). This object has RF and IN SSA magnitudes listed, but no IN magnitude was used due to the error flag warning status. The object appears to show motion between the R63F and IN images relative to the 2MASS position identified by a circle in panel 13(a) and 13(b). However, the motion is not consistent with the SSS and 2MASS epochs and is therefore an artefact of the halo – this object was rejected.
3 The Southern Galactic Plane Ultra-Cool Dwarf Candidate Catalogue (SGPUCD)
Our candidate UCD catalogue contains 246 objects and is presented in Table 2555please refer to on-line version for the full catalogue table, which provides the primary astrometric, photometric, and proper-motion data for each catalogue member, as well as spectral type and distance estimates derived for both the spectroscopic and photometric samples. We indicate the distinction between the photometric and spectroscopic members in column 17 by the use of the following keys: ‘P’ = Photometric analysis, ‘S’ = Spectroscopic analysis, and also indicate if a catalogue member has been previously discovered or independently identified using; ‘K’ = Known object. For some of these known objects we use the spectral type, distance, or proper-motion data provided in the literature, as indicated in the table footnotes (see Table 3 and § 3.1 for details of these objects).
For each object listed in Table 2 we present near-IR 2MASS photometry and optical/near-IR colours using optical data from the SSA, where the RF- and IN-band photometry is transformed onto the standard Cousins system if both are available (Bessell 1986). Column 11 gives the values of reduced proper-motion (H(K)) used in the candidate selection for where proper motions were available from the SSA.
During the visual checking stage of the candidate selection, proper motions were determined by visual examination of the 2MASS images and SSS RF- and IN-band optical images, and also DENIS I-band or J-band images. We indicate here in Table 2 if proper motion was identified for the catalogue members in column 12 (Visual PM) denoted by ‘Yes’, and if no optical SSA or DENIS counterpart could be identified we denote this by ‘—’.
| SGPUCD No.[#]a | 2MASS J Designationb | 2MASS Photometryc | SSA/2MASS Coloursd | H(K)e | Visualf PM | Proper Motion (arcsec yr-1 )e | Sp-T | Memberg Type | d (pc) | Refs | |||||
|---|---|---|---|---|---|---|---|---|---|---|---|---|---|---|---|
| c | |||||||||||||||
| 1 | 06164933-1411434 | 15.146 | 0.671 | 1.109 | 4.255 | — | — | Yes | — | — | — | M7.0V 0.5 | P | 74.39 4.59 | |
| 2 | 06300140-1840143 | 12.681 | 0.751 | 1.220 | — | — | — | Yes | 0.586 | 0.298 | -0.505 | M9.0V 0.5 | S/K | (1) | |
| 3 | 06362726-1226531 | 15.332 | 0.963 | 1.702 | — | — | — | Yes | — | — | — | L4.5 4.0 | P | 25.17 14.94 | |
| 4 | 06400355-1449104 | 14.143 | 0.666 | 1.095 | 4.187 | 2.275 | 14.70 | Yes | 0.054 | -0.054 | 0.001 | M7.5V 0.5 | P | 45.14 2.23 | |
| 5 | 06431685-1843375 | 13.009 | 0.724 | 1.206 | 4.279 | 2.634 | 13.08 | Yes | 0.234 | 0.188 | -0.139 | M8.0V 0.5 | S | ||
| 6 | 06450029-2333259 | 15.548 | 0.575 | 1.169 | 4.081 | — | — | Yes | — | — | — | M7.5V 1.0 | P | 85.56 14.27 | |
| 7 | 06465202-3244011 | 15.032 | 0.679 | 1.184 | 4.044 | 2.169 | 16.02 | Yes | — | — | — | M7.0V 0.5 | P | 72.79 2.91 | |
| 8 | 06482289-2916280 | 14.315 | 0.627 | 1.082 | — | — | — | Yes | — | — | — | M7.0V 0.5 | P | 49.59 2.93 | |
| 9 | 06495677-2104472 | 15.257 | 0.785 | 1.329 | 4.327 | — | — | Yes | — | — | — | M7.5V 1.5 | P | 70.79 14.74 | |
| 10 | 06512977-1446150 | 13.811 | 0.732 | 1.154 | — | — | — | Yes | — | — | — | M7.5V 0.5 | S | ||
| 11 | 06525508-1614191 | 14.504 | 0.723 | 1.408 | 5.057 | 2.222 | 13.44 | Yes | 0.084 | -0.067 | 0.051 | M8.0V 0.5 | P | 48.52 5.21 | |
| 12 | 06533530-2129406 | 15.121 | 0.853 | 1.397 | — | — | — | Yes | — | — | — | M9.0V 2.0 | P | 53.34 17.41 | |
| 13 | 06573154-1940057 | 15.238 | 0.742 | 1.234 | 4.329 | — | — | Yes | — | — | — | M8.0V 1.5 | P | 65.29 16.54 | |
| 14 | 07102532-0633215 | 14.627 | 0.725 | 1.179 | 4.158 | 2.460 | 12.98 | Yes | — | — | — | M7.5V 1.5 | P | 53.68 10.60 | |
| 15 | 07134978-0656011 | 15.431 | 0.748 | 1.403 | 5.105 | — | — | Yes | — | — | — | L3.0 3.5 | P | 32.35 17.55 | |
| 16 | 07164790-0630369 | 13.899 | 0.831 | 1.334 | — | — | — | Yes | 0.152 | -0.052 | 0.143 | L0.0 0.5 | S/K | (1) | |
| 17 | 07230144-1616209 | 14.187 | 0.719 | 1.181 | 4.923 | 2.571 | 16.72 | Yes | — | — | — | L0.0 1.0 | P | 29.81 5.14 | |
| 18 | 07233749-2300321 | 15.667 | 0.709 | 1.376 | — | — | — | Yes | — | — | — | L1.0 3.0 | P | 52.49 22.80 | |
| 19 | 07234556-1236532 | 14.294 | 0.704 | 1.128 | 4.333 | 2.513 | 12.14 | Yes | 0.060 | 0.001 | -0.060 | M8.0V 0.5 | P | 44.96 3.65 | |
| 20 | 07252641-1025122 | 15.179 | 0.661 | 1.123 | — | — | — | Yes | 0.110 | 0.042 | -0.102 | M8.0V 1.5 | P | 63.27 16.20 | |
a The entry number of the SGPUCD members.
b The 2MASS designation as obtained from the Point Source Catalogue: 2MASS Jhhmmss[.]sddmmss.
c 2MASS photometry obtained from the Point Source Catalogue: j_m, h_m, and k_m parameters.
d SSA optical colours: RF- and IN-band photometry is transformed onto the standard Cousins system where both are available (Bessell 1986), otherwise SSA RF and IN magnitudes are used.
e The reduced proper-motion (H(K)) calculated using the 2MASS Ks magnitude, and the proper-motion data from the SSA in units of arcseconds yr-1 .
f Possible proper motions determined by visual examination of the 2MASS images, SSS RF- and IN-band optical images, and/or DENIS I-band or J-band images.
g The mode by which catalogue membership was based, and how the subsequent spectral types and distances were calculated: ‘P’ = Photometric analysis,‘S’ = Spectroscopic analysis. Also, we indicate if a catalogue member was previously discovered using; ‘K’ = Known object.
† Indicates that the proper-motion data are taken from Phan-Bao et al. (2008).
‡ Indicates that the proper-motion data, spectral types, and distances have been taken from the these authors where available.
References: (1) Phan-Bao et al. (2008); (2) Scholz & Meusinger (2002); (3) Lodieu et al. (2005); (4) López Martí et al. (2004); (5) Luhman et al. (2005); (6) Vuong et al. (2001); (7) Kendall et al. (2007); (8) Burgasser et al. (2007); (9) Comerón et al. (2003); (10) Luhman et al. (2005); (11) Luhman (2007); (12) Folkes et al. (2007): (13) Hambaryan et al. (2004): (14) Kirkpatrick et al. (2010).
3.1 Known Objects Identified in this Survey
The UCD catalogue members identified as previously known objects in SIMBAD or http://dwarfarchives.org, or that have been independently identified by Phan-Bao et al. (2008), are listed in Table 3 by their 2MASS name and other known identifiers. We primarily list the relevant data for each object sourced from those references given in the last column of Table 3, but also from this work where indicated.
Objects identified by Phan-Bao et al. (2008) have been highlighted as shaded rows in Table 3, with the data presented for these objects originating entirely from those authors. Note that 2MASS J1126-5003 was first discovered in Folkes et al. (2007) from this work, but is included in Table 3 as previously published object.
| 2MASSJ | arcseconds yr-1 | |||||||||
| Designationa | Other name | SpT | d (pc) | Notes | Refs. | |||||
| 06300140-1840143 | DENIS-P 0630-1840 | 3.17 | 11.28 | M8.5V1.0 | 19.33.0 | 0.613 | 0.350 | -0.503 | — | 1 |
| 07164790-0630369 | DENIS-P 0716-0630 | 3.55 | 12.19 | L11.0 | 22.03.7 | 0.122 | -0.016 | 0.121 | — | 1 |
| 07511645-2530432 | DENIS-P 0751-2530 | 3.31 | 12.38 | L1.51.0 | 14.82.9 | 0.896 | -0.885 | 0.142 | — | 1 |
| 08123170-2444423 | DENIS-P 0812-2444 | 3.38 | 12.38 | L1.51.0 | 20.14.3 | 0.191 | 0.096 | -0.165 | — | 1 |
| 08230313-4912012 | DENIS-P 0823-4912 | 3.56 | 12.38 | L1.51.0 | 17.43.6 | 0.138 | -0.137 | 0.017 | — | 1 |
| 08283419-1309198 | DENIS-P 0828-1309 | 3.37b | 12.19b | L2 | 11.61.4 | 0.593c | -0.593c | 0.014c | — | 1,2,3 |
| SSSPM J0828-1309 | ||||||||||
| 10482788-5254180 | DENIS-P 1048-5254 | 3.26 | 12.38 | L1.51 | 21.04.6 | 0.182 | -0.179 | 0.033 | — | 1 |
| 11085176-7632502 | — | — | M7.25/M8 | — | — | — | — | Chamaeleon I Brown Dwarf | 4,5 | |
| 11085497-7632410 | — | — | M5.5 | — | — | — | — | Chamaeleon I Brown Dwarf | 4 | |
| 11104006-7630547 | — | 8.5 | M7.25h(M) | 160 | — | — | — | Chamaeleon I Brown Dwarf | 10,11 | |
| 11263991-5003550 | DENIS-P 1126-5003 | 14.44f | L9.0 | f | 1.650f | -1.580f | 0.450f | Blue L dwarf | 1,12 | |
| 11592743-5247188 | DENIS-P 1159-5247 | 3.12 | 11.47 | M9.0V1 | 9.61.9 | 1.085 | -1.077 | -0.131 | X-Ray flaring + strong H emission | 13 |
| 1RXS J115928.5-524717 | ||||||||||
| 12531092-5709248 | DENIS-P 1253-5709 | 3.29 | 12.01 | L0.51.0 | 19.44.0 | 1.634 | -1.575 | -0.435 | — | 1 |
| 13030905-7755596 | DENIS-P 1303-7756 | — | — | — | — | — | — | Chamaeleon II PMS object | 6 | |
| C51 | ||||||||||
| 15200224-4422419d | DENIS-P 1520-4422 | L/L | Binary separation | 1,7,8 | ||||||
| 16081603-3903042 | Par-Lup3-1/cc1 | — | M5V | — | — | — | — | M5V/M7.5V binary: Lupus 3 YSO | 9 | |
| CFB2003 | ||||||||||
| 17054744-5441513 | DENIS-P 1705-5441 | 3.20 | 11.28 | M8.5V1.0 | 27.25.7 | 0.078 | -0.072 | 0.030 | — | 1 |
| 17343053-1151388 | — | 3.940 | 11.5 | M9.0V0.5 | 21.30 | 0.427 | 0.133 | -0.405 | 2MASS Near-IR proper motion survey | 14 |
| 17453466-1640538 | DENIS-P 1745-1640 | 3.37 | 12.38 | L1.51.0 | 18.74.1 | 0.161 | 0.116 | -0.111 | — | 1 |
| 17562963-4518224 | DENIS-P 1756-4518 | 3.14 | 11.47 | M9.0V1.0 | 14.83.0 | 0.194 | 0.064 | -0.183 | — | 1 |
| 17502484-0016151d | — | 4.10 | 14.7 | L5.5 | 0.491 | -0.440 | 0.218 | — | 7 | |
| 19090821-1937479 | DENIS-P 1909-1937 | 3.58 | 12.19 | L11 | 26.96.0 | 0.158 | -0.064 | -0.145 | — | 1 |
a The 2MASS designation as obtained from the Point Source Catalogue: 2MASS Jhhmmss[.]sddmmss.
b These data are taken from Phan-Bao et al. (2008).
c These data are taken from Lodieu et al. (2005).
d Discovered by Kendall et al. (2007).
e These data are taken from Burgasser et al. (2007).
f or other data are from this work.
g Magnitude is on the CIT system.
h From Luhman (2007).
i Distance to Cham-I taken from Whittet et al. (1997).
References: (1) Phan-Bao et al. (2008); (2) Scholz & Meusinger (2002); (3) Lodieu et al. (2005); (4) López Martí et al. (2004); (5) Luhman et al. (2005); (6) Vuong et al. (2001); (7) Kendall et al. (2007); (8) Burgasser et al. (2007); (9) Comerón et al. (2003); (10) Luhman et al. (2005); (11) Luhman (2007); (12) Folkes et al. (2007): (13) Hambaryan et al. (2004): (14) Kirkpatrick et al. (2010).
3.2 Catalogue Sky Coverage and Selection Numbers
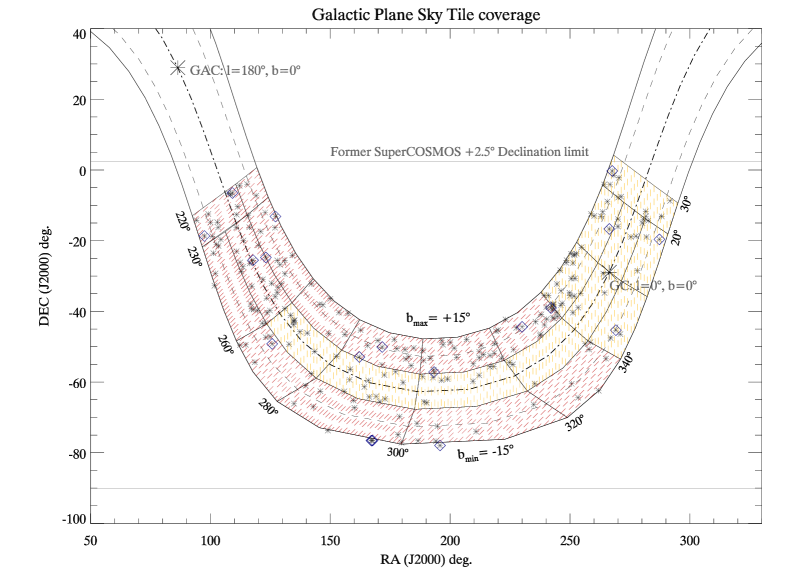
We applied our method to 24 discrete areas (sky tiles) at low Galactic latitudes and through the mid-plane, ranging in area from between 100 deg2 to 300 deg2, with most being 200 deg2. In Table 4 we present the details of each sky tile along with a breakdown of the results for successive stages through the selection process. A map of the sky tile coverage over the range of Galactic longitude searched is shown in Fig. 14 beginning at . The regions where the overcrowding criteria have been applied () have been highlighted as shaded rows in Table 4, and are also represented by orange crosshatching in Fig. 14.
Due to the selection criteria being different for these regions, we have broken down the contribution made to the total area searched in these tiles, into that from which candidates have been selected using the primary criteria (without the photometric ‘clipping’), and from that which invoked the photometric ‘clipping’ criterion. The ‘clipped’ area is split into three parts:
-
1.
‘clipped’ selected area (column 8 in Table 4): The area from which candidates have been selected using the overcrowding photometric clipping criterion.
-
2.
Non selected area (column 9 in Table 4): The area within the sky tile that contains no class[321] candidates, either from primary selection, or the photometric clipped selection ().
-
3.
Unused ‘clipped’ area (column 10 in Table 4): The area within the sky tile that contains photometrically clipped () candidates, that have not been included due to the candidate limit being reached for that tile (equal to the number of square degrees in total area).
The sum of these three areas plus the primary selection area in column 6, is equal to the total available for a given tile (column 5). However, for those tiles where the overcrowding criteria was not applied () the area searched is simply the total available within that tile (i.e., the primary selected area), i.e., an area not included in our analysis.
For each tile in Table 4 are listed five columns that contain the number of candidates after the following key stages in the selection process:
-
1.
Column 11: Objects returned from the 2MASS query surviving the initial near-IR selection criteria.
-
2.
Column 12: Candidates which passed all the optical photometric and reduced proper-motion selection criteria.
-
3.
Column 13: The number of class[321] candidates selected after the classification scheme was applied (class[0] rejected) in the tile.
-
4.
Column 14: For tiles where this is the number of class[321] candidates remaining after the overcrowding criteria have been applied, with a maximum candidate number equal to the number of square degrees in that tile (i.e., the one per deg2 criterion: see § 2.7).
-
5.
Column 15: The final number of candidates from the sky tile after the visual checking stage.
The last column in Table 4 lists values of the candidate surface density (based on the numbers in column 13 of Table 4), used in activating the overcrowding criteria when (see § 2.7). It is interesting to note how the value of varies with Galactic and b, as it remains below a value of one as far east as for . Tile number 16 has the greatest candidate surface density () and lies some west of the Galactic centre. This region covers the large reddening hot spot seen in Fig. 9 known as the Norma dark molecular cloud. Consequently this region has a large fraction of candidates with only near-IR detections ( per cent).
| Deg. (Galactic) | Area (deg2) | Candidate Numbers | |||||||||||||
|---|---|---|---|---|---|---|---|---|---|---|---|---|---|---|---|
| Tile No.# | bmin | bmax | Totala in tile | Primaryb selected | ‘clipped’c selected | Nond selected | Unusede ‘clipped’ | 2MASSf sources | Opticalg selected | class[321] sourcesh | class[321] clippedi | Finalj number | |||
| 1 | 220 | 230 | 98.4 | 98.4 | — | — | — | 45,754 | 10 | 7 | — | 3 | 0.08 | ||
| 2 | 220 | 230 | 198.2 | 198.2 | — | — | — | 140,503 | 162 | 55 | — | 12 | 0.27 | ||
| 3 | 230 | 260 | 295.1 | 295.1 | — | — | — | 138,044 | 41 | 28 | — | 11 | 0.01 | ||
| 4 | 230 | 260 | 299.6 | 299.6 | — | — | — | 311,486 | 534 | 129 | — | 21 | 0.43 | ||
| 5 | 230 | 260 | 295.1 | 295.1 | — | — | — | 165,270 | 52 | 31 | — | 12 | 0.11 | ||
| 6 | 260 | 280 | 196.7 | 196.7 | — | — | — | 96,143 | 32 | 20 | — | 8 | 0.10 | ||
| 7 | 260 | 280 | 199.7 | 78.9 | 6.0 | 99.8 | 15.0 | 375,162 | 6,726 | 1,788 | 200 | 9 | 8.96 | ||
| 8 | 260 | 280 | 196.7 | 196.7 | — | — | — | 129,077 | 50 | 22 | — | 7 | 0.11 | ||
| 9 | 280 | 300 | 196.7 | 196.7 | — | — | — | 114,718 | 46 | 33 | — | 14 | 0.17 | ||
| 10 | 280 | 300 | 199.7 | 94.8 | 0.0 | 51.9 | 53.0 | 312,020 | 7,579 | 2,672 | 196 | 12 | 13.28 | ||
| 11 | 280 | 300 | 196.7 | 196.7 | — | — | — | 149,261 | 75 | 54 | — | 12 | 0.27 | ||
| 12 | 300 | 320 | 196.7 | 196.7 | — | — | — | 159,372 | 92 | 63 | — | 20 | 0.32 | ||
| 13 | 300 | 320 | 199.7 | 73.8 | 5.0 | 28.9 | 92.0 | 386,707 | 20,791 | 8,124 | 199 | 10 | 40.67 | ||
| 14 | 300 | 320 | 196.7 | 196.7 | — | — | — | 157,900 | 131 | 98 | — | 7 | 0.50 | ||
| 15 | 320 | 340 | 196.7 | 196.7 | — | — | — | 180,523 | 202 | 112 | — | 18 | 0.57 | ||
| 16 | 320 | 340 | 199.7 | 62.8 | 1.0 | 18.0 | 117.9 | 395,060 | 30,211 | 13,616 | 197 | 4 | 68.18 | ||
| 17 | 320 | 340 | 196.7 | 196.7 | — | — | — | 128,314 | 90 | 83 | — | 6 | 0.42 | ||
| 18 | 340 | 360 | 196.7 | 87.8 | 0.0 | 91.1 | 17.9 | 222,342 | 1,023 | 376 | 194 | 25 | 1.95 | ||
| 19 | 340 | 360 | 199.7 | 35.9 | 2.0 | 10.0 | 151.9 | 374,028 | 24,820 | 12,985 | 191 | 5 | 65.16 | ||
| 20 | 340 | 360 | 196.7 | 80.0 | 2.0 | 103.8 | 10.9 | 109,697 | 561 | 312 | 195 | 4 | 1.59 | ||
| 21 | 0 | 20 | 196.7 | 88.6 | 12.9 | 76.4 | 18.9 | 262,453 | 1,153 | 416 | 197 | 6 | 2.11 | ||
| 22 | 0 | 20 | 199.7 | 32.9 | 1.0 | 4.0 | 161.8 | 335,012 | 15,231 | 8,635 | 193 | 5 | 43.23 | ||
| 23 | 0 | 20 | 196.7 | 74.9 | 9.9 | 82.1 | 29.8 | 137,402 | 1,424 | 579 | 195 | 4 | 2.95 | ||
| 24 | 20 | 30 | 296.6 | 102.8 | 3.0 | 115.9 | 74.9 | 483,616 | 14,781 | 6,264 | 289 | 11 | 21.13 | ||
| Totals: | — | — | — | — | 5041.6 | 3573.2 | 42.8 | 681.9 | 744.0 | 5,309,864 | 125,817 | 56,502 | 2,246 | 246 | — |
(a) Total area on the sky of each tile region used for the primary near-IR 2MASS query (adjusted for spherical geometry).
(b) The area within the sky tile for which candidates have been selected using the primary near-IR and optical criteria, without any overcrowding photometric clipping criteria being applied (see § 2.7).
(c) The area within the sky tile from which candidates have been selected using the additional overcrowding photometric clipping criteria, for where (see § 2.7).
(d) The area within the sky tile which no class[321] candidates were found from the primary selection when using the additional overcrowding and photometric clipping criteria.
(e) The area within the sky tile that was found to contain photometrically clipped () candidates, but have not been included due to the candidate number limit already being reached for that tile (see § 2.7).
(f) The number of near-IR selected sources returned from the 2MASS query that survived the near-IR selection criteria as well as the quality flag rejection and SNR filtering (see § 2.1).
(g) The number of candidates which survived all the near-IR/optical and reduced proper-motion selection criteria, but before the candidate classification scheme and overcrowding criteria were applied.
(h) The total number of class[321] candidates in the tile before the overcrowding criteria were applied.
(i) The number of class[321] candidates remaining after the overcrowding and photometric clipping criteria ) were applied, for the maximum number limit of that tile (i.e., typically one per deg2: see § 2.7).
(j) The final number of class[321] candidates from the sky tile after the visual checking stage.
(k) The surface density of all class[321] sources within the whole sky tile used in activating the overcrowding criteria when (see § 2.7).
4 Properties of the Catalogue members
4.1 Near-IR and Optical Spectroscopy
We obtained near-IR spectroscopy for sixteen of our catalogue candidates, using both the SOFI spectrograph mounted on the ESO maintained 3.6-metre New Technology Telescope (NTT) situated at La Silla Chile, and the IRIS2 spectrograph mounted on the 3.9-metre Anglo Australian Telescope (AAT) at Siding Spring Australia. Thirteen spectra where obtained using SOFI on two separate observing runs666ESO programmes ID 076.C-0382 and ID 077C.0117. on 2006 January 17–19, and on 2006 April 7–9. The spectrum of another candidate777ESO programme ID 279.C-5039A. was obtained using SOFI from directors discretionary time on 2007 August 26. A further three spectra888service mode programmes IR086 and IR091. were taken at the AAT on 2007 May 25–26.
The blue JH grism was used for the 2006 SOFI observations, with the August 2007 DDT spectrum also including the red HK grism. The wavelength coverage using just the JH grism is 0.95–1.65m, while including the HK grism extended this continuous range to m. A slit width of 0.6 arcsec was used for all observations giving a resolving power of and a dispersion999All quoted dispersions are linearised wavelength values after reduction. of 6.96Åpixel-1. For all these SOFI observations the seeing was good, and generally between 0.5–1.0 arcsec.
The spectra acquired under AAT service time were obtained using both the Jlong (SAPPHIRE_240) and Hs (SAPPHIRE_316) grisms with a slit width of 1.0 arcsec, giving a resolving power of . The wavelength coverage in the J-band is between 1.11–1.35m with a dispersion of 2.362Åpixel-1, and for the H-band between 1.47–1.83m with a dispersion of 3.517Åpixel-1. Standard calibration Xenon arc frames and spectroscopic flats were also taken, and the seeing was between 0.8–1.0 arcsec with photometric observing conditions.
Near-IR image reduction and spectral extraction were performed using standard packages within the iraf environment after the AB and BA nodded pairs were subtracted, however, the telluric corrections and flux calibrations were made using the IDL based xtellcor_general routine provided by the NASA InfraRed Telescope Facility (IRTF), as part of the spextool data reduction package (see Vacca, Cushing, & Rayner 2003, for details). Telluric standard stars of spectral types between B9V and A0V were observed before and after the target acquisitions, that are required for this procedure. Flux calibration was achieved also within this package by using the known Johnson-Morgan B and V magnitudes of the telluric standards which were obtained from SIMBAD, resulting in a F flux scale for all our spectra.
We obtained a red optical spectrum for one other catalogue candidate using the IMACS/F2 spectrograph mounted on the 6.5-metre Baade/Magellan telescope situated at Las Campanas Chile, over the period 2009 September 30 to October 2. We used the following instrumental setup: the red grism (200 lines mm) with a 0.7 arcsecond wide longslit mask aligned to the parallactic angle, providing a wavelength coverage of 0.500–1m with an average resolving power of R, and a dispersion of about 2 Åpixel-1. The OG590 longpass filter was used to eliminate second order light shortward of 0.5m. The primary flux standards GD 71 (Hamuy et al. 1992) and ESO68-8 were observed twice per night using the same instrumental setup. Flat-field quartz lamp exposures were used for pixel response calibration. The spectrum was extracted and calibrated using standard packages within the iraf environment, with the dispersion solutions obtained from OH sky line spectra extracted using the same dispersion object trace; solutions were accurate to about 0.3–0.5 Å.
4.2 Spectral Types and Distances
All of the sixteen near-IR spectral we obtained show spectral features typical of late-type field dwarfs. To spectral type these objects we used a combination of spectral indices and template fitting of optically defined spectral standards. We used spectral indices defined in the J- and H-bands by Reid et al. (2001); McLean et al. (2003); Burgasser et al. (2006) for older field dwarfs (0.5–10 Gyr). For the L spectral types we used the spectral indices of Burgasser et al. (2006) that are reliable from L0 to T8 as the primary indicator of spectral type, while the older Reid et al. (2001); McLean et al. (2003) indices were used for the M-type dwarfs which are also valid up to late-L. The spectral range of the H2O-B index defined by McLean et al. (2003) falls outside that of the AAT H-band coverage, so was therefore omitted for those objects affected.
A summary of the results from the spectral indices are given in Table 5, showing the actual index values along with their implied spectral types in rounded brackets; the average index derived spectral type; the best fitting template spectral type, and final adopted spectral types determined for each object. For two objects (the shaded rows in Table 5), the index values quoted in square brackets denote that these values are not reliable indicators of spectral type. For 2MASS J11263991-5003550 (hereafter 2M1126-5003) this is due to this object being a blue L dwarf, for which a detailed analysis of its spectral features was presented in Folkes et al. (2007). For 2M1110-7630 – a young low surface gravity Chamaeleon-I brown dwarf (see § 4.5) – the spectral indices will only serve as a guide since they are defined for the older field population with higher surface gravities ().
Finally, we consider an optical spectrum of 2MASS J18300760-1842361. This object was selected for spectroscopic follow-up due to its apparent brightness ( magnitude) and therefore its possible proximity if a genuine UCD; this was despite being flagged as variable in our dual RF-bands test. We note this object passed all the near-IR, , , and colour criteria, but would not have been selected by our method if it had not been a possible nearby interesting object. However, late-M dwarf template spectra failed to give a good match to this object, with strong TiO absorption bands seen blue-ward of m, and also at m and m. There is a noticeable absence of the K i doublet at m and m, and absence of FeH and CrH between m and m. These combined observed spectral features are not normally evident in either the older field dwarf population, or in young late-M dwarfs (Kirkpatrick et al. 2006). A ‘by-eye’ comparison to M-type giant template spectra gave a good fit for an M7 III giant, which is shown in Fig. 19. Consequently, this object was removed from our catalogue and is not considered further in our analysis.
| 2MASS Namea | Obs.Date | Telescope | Band | Field dwarf indices | Indexe SpT | Bestf fitting | Finalg SpT | MJh | d(pc)j | ||||
|---|---|---|---|---|---|---|---|---|---|---|---|---|---|
| H2OBb | H2OAc | H2OBc | H2O-Jd | H2O-Hd | |||||||||
| 0630-1840 | 18 Jan.06 | NTT 3.6m | JH | 0.83(M9.3) | 0.73(M9.0) | 0.86(M9.9) | — | — | M9.4 | M9.0 | M9.0V0.5 | 11.5 | 17.5 |
| 0643-1843 | 18 Jan.06 | NTT 3.6m | JH | 0.90(M7.6) | 0.77(M7.9) | 0.95(M7.6) | — | — | M7.7 | M8.0 | M8.0V0.5 | 11.2 | 23.5 |
| 0651-1446 | 18 Jan.06 | NTT 3.6m | JH | 0.92(M7.0) | 0.79(M7.5) | 0.96(M7.4) | — | — | M7.3 | M8.0 | M7.5V0.5 | 11.0 | 37.1 |
| 0716-0630 | 18 Jan.06 | NTT 3.6m | JH | 0.81(L0.0) | 0.64(L1.4) | 0.81(L0.9) | — | — | L0.4 | L0.0 | L0.00.5 | 11.7 | 27.2 |
| 0823-4912 | 26 May 07 | AAT 3.9m | J&H | 0.68(L3.3) | 0.61(L2.2) | — | 0.77(L5.3) | 0.75(L4.8) | L3.9 | L3.0 | L4.01 | 13.1 | 12.4 |
| 0827-1619 | 18 Jan.06 | NTT 3.6m | JH | 0.89(M7.8) | 0.82(M6.7) | 0.94(M7.9) | — | — | M7.5 | M8.0 | M8.0V0.5 | 11.2 | 38.9 |
| 0844-2924 | 18 Jan.06 | NTT 3.6m | JH | 0.71(L2.6) | 0.54(L4.0) | 0.67(L4.1) | 0.78(L4.8) | 0.74(L4.8) | L4.1 | L4 | L4.00.5 | 13.1 | 29.2 |
| 0955-7342 | 26 May 07 | AAT 3.9m | J&H | 0.83(M9.4) | 0.61(L2.0) | — | 0.86(L2.5) | — | L1.3 | L0.5 | L0.01 | 11.7 | 46.1 |
| 1048-5254 | 08 Apr.06 | NTT 3.6m | JH | 0.75(L1.6) | 0.73(M9.0) | 0.79(L1.4) | 0.85(L2.9) | 0.82(L1.9) | L1.0 | L0-L1 | L0.50.5 | 11.9 | 27.0 |
| 1050-4517 | 07 Apr.06 | NTT 3.6m | JH | 0.87(M8.4) | 0.75(M8.4) | 0.88(M9.2) | — | — | M8.7 | M9.0 | M9.0V0.5 | 11.5 | 32.4 |
| 1110-7630 | 25 May 07 | AAT 3.9m | J&H | 0.90[M6.3] | 0.79[M7.6] | — | — | — | M7.0 | M8-M8.5 | M8.00.5 | ||
| 1126-5003 | 07 Apr.06 | NTT 3.6m | JH | 0.56[L6.6] | 0.356[L8.7] | 0.53[L7.3] | 0.72[<L8] | 0.65[L9.5] | L7-L9 | L7-T0 | L91 | ||
| 1308-4925 | 08 Apr.06 | NTT 3.6m | JH | 0.90(M7.5) | 0.79(M7.4) | 0.91(M8.6) | — | — | M7.8 | M8-M9 | M8.5V0.5 | 11.3 | 27.5 |
| 1415-5212 | 09 Apr.06 | NTT 3.6m | JH | 0.83(M9.5) | 0.76(M8.3) | 0.79(L1.4) | — | — | M9.4 | M9.5 | M9.5V0.5 | 11.6 | 41.3 |
| 1426-5229 | 09 Apr.06 | NTT 3.6m | JH | 0.92(M7.0) | 0.85(M5.8) | 0.93(M8.2) | — | — | M7.0 | M8.0 | M8V1.0 | 11.2 | 41.9 |
| 1734-1151 | 26 Aug.07 | NTT 3.6m | JHK | 0.86(M8.5) | 0.71(M9.6) | 0.91(M8.8) | — | — | M9.0 | M9.0 | M9.0V0.5 | 11.5 | 21.3 |
| 1830-1842 | Sept–Oct 09 | Baade 6.5m | RIZ | — | — | — | — | — | — | M7.0 | M7.0 III1 | — | — |
(a) Abbreviated 2MASS designation obtained from the Point Source Catalogue: 2MASS Jhhmmddmm. (b) This is the H2OB index defined by Reid et al. (2001). (c) These are the McLean et al. (2003) H2OA and H2OB indices. (d) These indices are defined by Burgasser et al. (2006). (e) This is the average of the separate spectral types derived from each given index. (f) The optically classified spectral type of the best fitting template ‘standard’ near-IR spectrum (obtained from both Cushing et al. 2005; McLean et al. 2003) to that of the object spectrum. In all cases the template spectrum was first smoothed to the instrument resolution element of the object. (g) Final spectral type assigned from both the spectral template fitting and the average of the H2O spectral indices. (h) Absolute J-band magnitude (2MASS) derived from the spectral type/MJ relation of Cruz et al. (2003), except for the two shaded rows. The uncertainty in MJ reflects only the uncertainty in the spectral type. (j) Distance in parsecs derived from the MJ and 2MASS J-band magnitude, except for the two shaded rows. The uncertainty in the distance reflects only the uncertainty in MJ. (†) MJ for this object is on the CIT photometric system, and derived from this work (see § 4.5). (‡) Distance to 2M1110 taken as the distance to the Chamaeleon-I dark cloud given by Whittet et al. (1997).
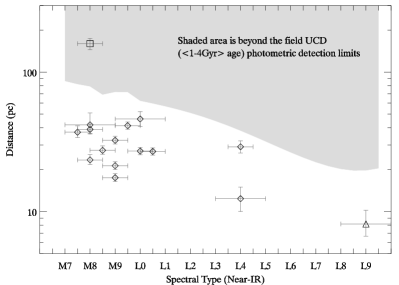
Medium resolution near-IR template spectra of M- and L-type dwarfs which cover the whole of the JHK bands were obtained from both the IRTF spectral library (SpeX instrument: Cushing et al. 2005), and from the NIRSPEC brown dwarf spectroscopic survey (McLean et al. 2003). These templates were used to find the best fitting spectral types from a direct comparison with our objects. The template spectra were first smoothed to the same FWHM instrument resolution as the object spectrum, and their flux scales normalised at m for all spectra (except that of 2M1734-1151: normalised at m), before being over-plotted. The best fitting spectrum was the one that had the closest match in a ‘by-eye’ comparison to the pseudo continuum flux levels across the spectrum, as well as the depths of the absorption features. A goodness-of-fit between the objects and templates were also performed as an aid in the fitting process. The final spectral types were determined by assigning more weighting towards the template fitting, but where discrepancies occurred between the two methods more reliance was placed on the average of the spectral indices instead. The spectra of all the confirmed UCDs and the best fitting spectral templates are shown in Fig. 16(a), Fig. 16(b), Fig. 17, and in Fig. 18 for the JH-band SOFI spectra, JHK-band SOFI spectrum, and AAT IRIS2 spectra, respectively.
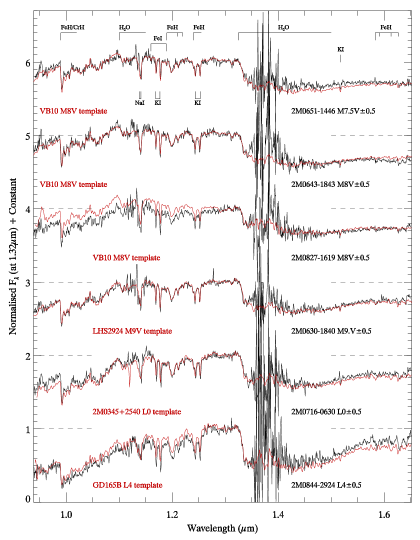
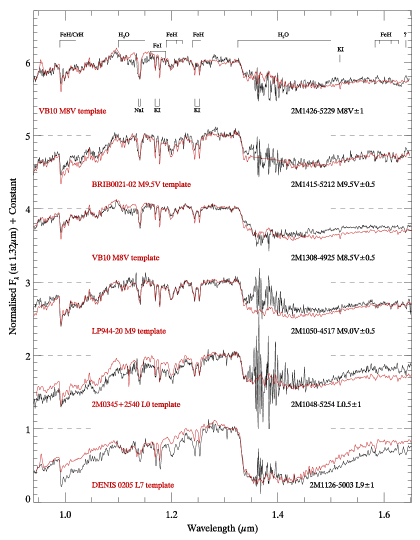
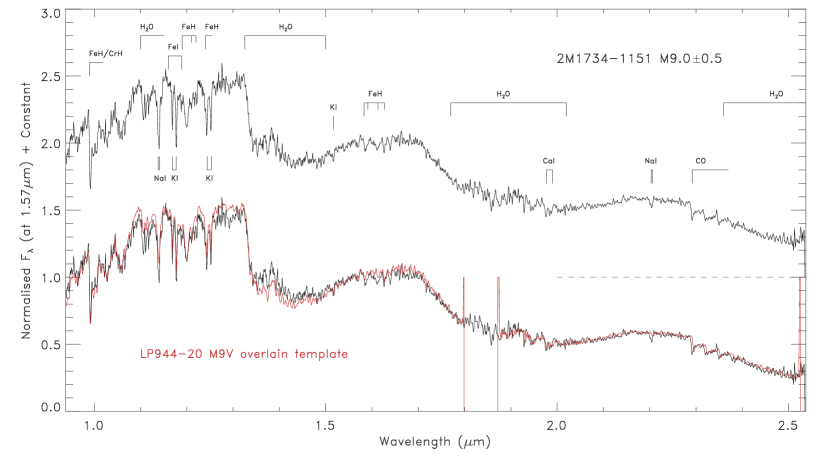
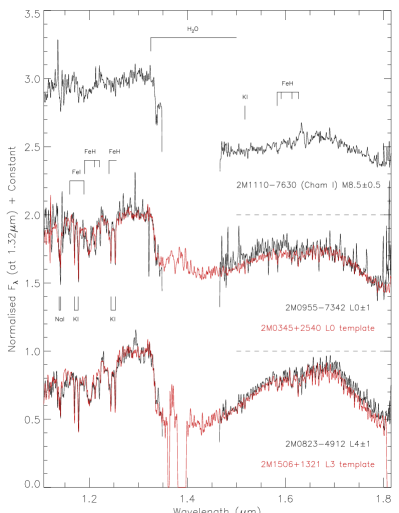
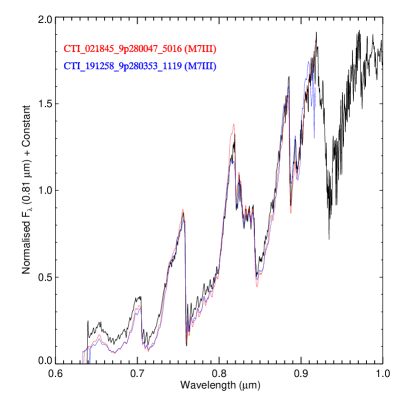
We derive the spectro-photometric distances to our UCD spectroscopic sample (except for 2M1126-5003 and 2M1110-7630) by using the spectral type/MJ relation of Cruz et al. (2003), which are plotted in Fig. 15 as a function of spectral type (and given in Table 5). Also plotted in Fig. 15 for reference are the approximate UCD distance limits that our search is sensitive too (denoted by the shaded region), which follows from the 2MASS photometric detection limits across the UCD spectral type range (dependent on ).
To determine the form of this region we obtained the colours of all L dwarfs listed in the http://dwarfarchives.org database with well constrained spectral types ( sub-types) and with good photometry (), which gave 54 in total. For the late-M dwarfs, a query of the SIMBAD database for known objects of M7V to M9.5V spectral sub-types having 2MASS photometry was made, which gave us mean values for objects in each spectral sub-type. A linear ( minimised) relation was fitted to the /spectral-type data which was then used to find the J apparent magnitudes given the 2MASS limiting magnitude of , for the range of spectral types required. The fit to the L dwarf /spectral-type data gave;
| (5) |
allowing the distance detection limits to be obtained by deriving the absolute J magnitudes for spectral types in the range of M6V to L9, using the MJ/spectral-type relation of Cruz et al. (2003).
An interesting aspect of Fig. 15 is the data point plotted well into the shaded region that appears to be either over luminous or too distant to be detected. However, note that this is the young Chamealeon-I brown dwarf (2M1110-7630) some four magnitudes brighter in MJ compared to a typical higher mass M8V older field dwarf (see § 4.5).
4.3 Photometric Spectral Types and Distances
As the majority of the objects listed in our UCD candidate catalogue have not been spectroscopically confirmed, estimates of spectral types and distance of these candidates need to be determined by other means where possible.
This was achieved for most of the candidates by the use of the MJ/( ) and MJ/spectral-type relations of Dahn et al. (2002). Most of the candidates have SSA IN detections (129), converted to Ic, to give the needed colour of the relation. However, the SSA magnitudes typically have uncertainties of mag, potentially leading to large scatter in the spectral types and distances. To alleviate this problem we obtained I-band magnitudes from the DENIS catalogue for 77 of the candidates without spectroscopy. The DENIS I-band uses a Gunn-i filter response with a limiting magnitude of (0.82 effective centre: Epchtein et al. 1999), and a filter response close enough to the standard Ic system that no transformation is necessary ( mag: e.g., Phan-Bao et al. 2008). DENIS also includes uncertainties for each detection, which give a mean uncertainty of mag for our sample.
Using the MJ/ relation and the 2MASS J-band magnitudes, candidate distances and spectral types were determined from both the DENIS and SSA derived colours. Propagated uncertainties in distance and spectral type were calculated assuming an SSA IN uncertainty of mag, or using the individual DENIS Gunn-i uncertainties. In all cases the J-band uncertainties obtained from 2MASS were also propagated through to the distance and spectral type uncertainties. All the photometric spectral types (and uncertainties) have been rounded to the nearest 0.5 sub-type.
In Fig. 20 we compare the spectroscopic classifications with those of the photometric spectral types derived from . In this figure most of the objects appear clustered around the dashed line indicating one-to-one correspondence, suggesting that both spectral types are generally in good agreement within the uncertainties. However, three of the late-M dwarfs having SSA IN data show considerably overestimated photometric spectral types, most likely caused by photometric errors that scatter to a redder colour. When calculating the uncertainties for the photometric catalogue sample a typical uncertainty of mag was assumed for all the SSA IN magnitudes, while individual uncertainties for DENIS I-band and 2MASS J-band magnitudes were used.
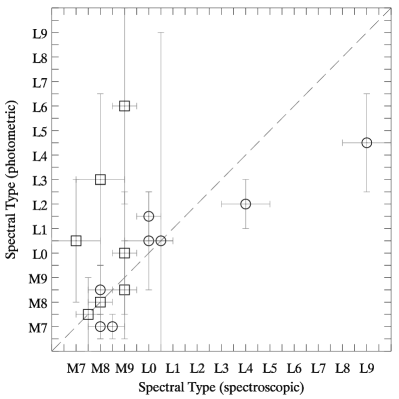
The DENIS CCD I-band data shows much better correspondence with the spectroscopic classifications, with the apparent exception of one object – 2M1126-5003. This object was found to be a blue L dwarf with a near-IR spectral type of L9 by Folkes et al. (2007), and was originally considered to be an L–T transition object. However, analysis by Burgasser et al. (2008) found 2M1126-5003 to have an optical spectral type of L4.5, which places it in agreement with the photometric spectral type. This suggests that the colour may not be sensitive to the reduced condensate opacity of blue L dwarf atmospheres (Burgasser et al. 2008). We retain the spectral classification of L9 for 2M1126-5003 here for consistency with the way we have analysed all the catalogue members.
The total number of UCD catalogue members for which we have reliable spectral types and distances derived from either spectroscopic or photometric data (from M7V to L9) is 194. The number with usable I-band magnitudes is 166 (not including the spectroscopic sample), split between 120 from the SSA, and 46 from DENIS. A further 28 candidates have data, but these fall outside the valid range of the MJ/ , and MJ/spectral-type relations of Dahn et al. (2002) and are not considered in the catalogue analysis. A plot of the resulting distance/spectral-type distribution is shown in Fig. 21, which differentiates the contribution between the spectroscopic, and photometric samples, by symbol and colour. For the photometric sample, those which use DENIS I-band detections are shown as red circles, while the blue squares denote objects using SSA I-band data. For the spectroscopic sample, those shown as filled grey stars are our near-IR spectroscopically confirmed UCDs, while the grey diamonds are other known objects we identified that have been spectroscopically classified. Table 6 lists all the colours, spectral types, and distance estimates for the photometric sample where I-band band data was available, and also indicates those objects which have MJ and spectral type values that lie outside the valid range of the Dahn et al. (2002) relation.
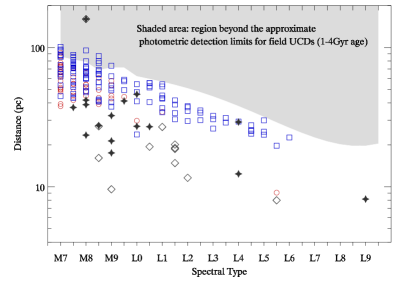
| 2MASS Namea | Photometric | 2MASS Namea | Photometric | 2MASS Namea | Photometric | ||||||
|---|---|---|---|---|---|---|---|---|---|---|---|
| SpTb | Dist.c (pc) | SpTb | Dist.c (pc) | SpTb | Dist.c (pc) | ||||||
| 0616-1411 | 2.814 | M7.0V 0.5 | 74.39 4.59 | 0630-1840 | 3.147 | Spec. | Spec. | 0636-1226 | 3.810 | L4.5 4.0 | 25.17 14.94 |
| 0640-1449 | 2.896 | M7.5V 0.5 | 45.14 2.23 | 0643-1843 | 3.070 | Spec. | Spec. | 0645-2333 | 2.910 | M7.5V 1.0 | 85.56 14.27 |
| 0646-3244 | 2.718 | M7.0V 0.5 | 72.79 2.91 | 0648-2916 | 2.866 | M7.0V 0.5 | 49.59 2.93 | 0649-2104 | 3.000 | M7.5V 1.5 | 70.79 14.74 |
| 0651-1446 | 2.990 | Spec. | Spec. | 0652-1614 | 3.043 | M8.0V 0.5 | 48.52 5.21 | 0653-2129 | 3.250 | M9.0V 2.0 | 53.34 17.41 |
| 0657-1940 | 3.095 | M8.0V 1.5 | 65.29 16.54 | 0710-0633 | 2.980 | M7.5V 1.5 | 53.68 10.60 | 0713-0656 | 3.700 | L3.0 3.5 | 32.35 17.55 |
| 0716-0630 | — | Spec. | Spec. | 0723-1616 | 3.379 | L0.0 1.0 | 29.81 5.14 | 0723-2300 | 3.465 | L1.0 3.0 | 52.49 22.80 |
| 0723-1236 | 3.015 | M8.0V 0.5 | 44.96 3.65 | 0725-1025 | 3.100 | M8.0V 1.5 | 63.27 16.20 | 0728-0427 | 2.320 | <M7V | — |
| 0729-4931 | 3.060 | M8.0V 1.5 | 72.13 17.10 | 0729-2608 | 3.125 | M8.5V 0.5 | 39.16 3.90 | 0731-2841 | 2.910 | M7.5V 1.0 | 74.55 12.30 |
| 0734-2724 | 3.430 | L0.5 2.5 | 52.81 21.93 | 0735-1957 | — | — | — | 0739-4926 | 3.000 | M7.5V 0.5 | 54.55 5.04 |
| 0741-0359 | 3.140 | M8.5V 1.5 | 40.89 11.15 | 0743-1257 | 2.830 | M7.0V 1.0 | 101.22 13.05 | 0744-1611 | 2.818 | M7.0V 0.5 | 74.27 4.69 |
| 0745-2624 | 3.210 | M9.0V 2.0 | 62.21 19.20 | 0747-3753 | 3.530 | L1.5 3.0 | 38.90 17.95 | 0748-3918 | 2.059 | <M7V | — |
| 0749-3252 | 3.338 | M9.5V 1.5 | 44.23 9.83 | 0751-2530 | — | — | — | 0752-3925 | 3.216 | M9.0V 1.0 | 43.03 7.19 |
| 0753-5421 | 2.790 | M7.0V 0.5 | 61.55 2.74 | 0756-0715 | 3.159 | M8.5V 1.0 | 43.55 5.40 | 0758-3945 | 3.493 | L1.0 2.5 | 34.45 12.19 |
| 0759-2117 | 3.000 | M7.5V 1.5 | 43.75 9.06 | 0803-1723 | 2.810 | M7.0V 1.0 | 75.05 8.88 | 0806-4320 | 3.710 | L3.5 3.5 | 31.20 17.08 |
| 0807-3056 | 3.690 | L3.0 3.5 | 30.55 16.55 | 0811-1201 | 3.000 | M7.5V 1.5 | 77.52 16.23 | 0811-4319 | 2.990 | M7.5V 1.5 | 52.07 10.55 |
| 0812-4719 | 3.320 | M9.5V 2.5 | 58.65 21.11 | 0812-2444 | — | — | — | 0813-3614 | 3.410 | L0.5 2.5 | 55.56 22.70 |
| 0814-4020 | 2.827 | M7.0V 0.5 | 51.43 2.40 | 0819-3944 | 1.772 | <M7V | — | 0819-4706 | 2.950 | M7.5V 1.0 | 46.41 8.50 |
| 0822-3204 | 3.020 | M8.0V 1.5 | 79.75 17.65 | 0823-4912 | 4.480 | Spec. | Spec. | 0827-1619 | 2.750 | Spec. | Spec. |
| 0828-3549 | 2.687 | M7.0V 0.5 | 77.74 2.67 | 0828-1309 | — | — | — | 0831-3437 | 3.650 | L2.5 3.5 | 30.08 15.50 |
| 0831-2535 | 3.023 | M8.0V 0.5 | 54.05 5.62 | 0832-3310 | 2.604 | M7.0V 0.5 | 91.32 1.09 | 0836-2648 | 2.890 | M7.5V 1.0 | 57.50 8.94 |
| 0838-3211 | 2.572 | <M7V | — | 0844-3914 | 3.088 | M8.0V 5.0 | 65.82 54.26 | 0844-2530 | — | — | — |
| 0844-2924 | 3.090 | Spec. | Spec. | 0851-4916 | 3.079 | M8.0V 1.0 | 54.17 7.18 | 0853-4106 | 3.920 | L6.0 4.0 | 22.60 14.74 |
| 0856-2408 | 2.980 | M7.5V 1.5 | 65.29 12.96 | 0858-4345 | 2.999 | M7.5V 1.0 | 70.97 11.97 | 0858-4240 | — | — | — |
| 0859-6605 | 3.040 | M8.0V 1.5 | 72.37 16.47 | 0900-4227 | 3.421 | L0.5 2.5 | 55.59 22.73 | 0918-6101 | 3.440 | L0.5 2.5 | 51.64 21.61 |
| 0921-4607 | 2.522 | <M7V | — | 0928-3214 | 3.115 | M8.5V 1.0 | 60.48 11.20 | 0928-5739 | 3.050 | M8.0V 1.5 | 60.40 13.95 |
| 0931-6659 | 2.810 | M7.0V 1.0 | 87.57 10.43 | 0933-5119 | 3.490 | L1.0 3.0 | 45.24 19.94 | 0942-3758 | 3.110 | M8.0V 1.5 | 47.66 12.32 |
| 0943-6234 | 2.747 | M7.0V 0.5 | 85.92 5.36 | 0947-3810 | 3.260 | M9.0V 2.0 | 37.56 12.40 | 0955-7342 | 3.41 | Spec. | Spec. |
| 0957-4612 | 3.090 | M8.0V 1.5 | 66.87 16.77 | 0959-3626 | — | — | — | 1010-5245 | 2.760 | M7.0V 0.5 | 88.30 8.39 |
| 1014-4018 | 2.870 | M7.0V 1.0 | 64.27 9.39 | 1023-6238 | 3.350 | L0.0 2.5 | 41.07 15.29 | 1024-4630 | 2.630 | M7.0V 0.5 | 95.06 3.14 |
| 1029-4031 | 2.890 | M7.5V 1.0 | 77.57 12.13 | 1032-5920 | 3.590 | L2.0 3.0 | 35.01 17.19 | 1033-5621 | 3.030 | M8.0V 1.5 | 95.14 22.21 |
| 1038-6511 | 3.790 | L4.5 3.5 | 25.48 14.91 | 1040-6716 | 3.860 | L5.0 4.0 | 23.65 14.62 | 1048-5254 | 3.620 | Spec. | Spec. |
| 1050-4517 | 3.350 | Spec. | Spec. | 1056-6122 | 1.281 | <M7V | — | 1102-4940 | 2.509 | <M7V | — |
| 1103-5933 | — | — | — | 1104-6412 | — | — | — | 1108-7632 | — | — | — |
| 1108-7632 | — | — | — | 1110-7630 | 3.650 | Spec. | Spec. | 1116-6403 | 2.980 | M7.5V 1.5 | 85.87 17.31 |
| 1119-4815 | 2.803 | M7.0V 0.5 | 71.90 5.31 | 1122-6533 | 3.340 | L0.0 2.5 | 23.75 8.70 | 1126-5507 | 3.620 | L2.5 3.0 | 34.02 17.08 |
| 1126-5003 | 3.700 | Spec. | Spec. | 1130-5759 | 2.935 | M7.5V 0.5 | 41.91 2.29 | 1131-6446 | 3.122 | M8.5V 0.5 | 40.57 4.07 |
| 1146-4754 | 3.180 | M8.5V 2.0 | 51.68 15.15 | 1148-5705 | — | — | — | 1150-5032 | 3.213 | M9.0V 1.5 | 57.64 12.62 |
| 1153-7454 | 2.950 | M7.5V 1.0 | 73.63 13.62 | 1155-6945 | 2.237 | <M7V | — | 1158-7708 | 3.610 | L2.0 3.0 | 37.28 18.69 |
| 1159-5247 | — | — | — | 1201-6007 | 2.650 | M7.0V 0.5 | 85.73 3.67 | 1204-5048 | 2.870 | M7.0V 1.0 | 70.24 10.26 |
| 1206-5326 | 2.755 | M7.0V 0.5 | 63.04 2.55 | 1210-5252 | 2.920 | M7.5V 1.0 | 74.28 12.77 | 1214-5519 | — | — | — |
| 1219-5021 | 2.757 | M7.0V 0.5 | 39.32 1.01 | 1224-7141 | 3.161 | M8.5V 1.0 | 49.50 9.05 | 1226-7638 | 3.033 | M8.0V 0.5 | 51.45 5.48 |
(a) The abbreviated 2MASS designation obtained from the Point Source Catalogue: 2MASS Jhhmmddmm.
(b) Photometric spectral types obtained from the MJ/ , and MJ/SpT relations of Dahn et al. (2002) valid for UCD spectral types of M7V to L9. The spectral types and uncertainties have been rounded to the nearest 0.5 of a sub-type. An uncertainty of I=0.3 mag was assumed for all the distance and spectral type propagated errors for candidates with IN SSA magnitudes, else for DENIS I-band data the individual object uncertainties were used.
(c) Photometric distance estimates are obtained from the distance modulus where the apparent J-band magnitude is from 2MASS, and MJ is from the MJ/ relation (Dahn et al. 2002).
() This symbol indicates that the photometric spectral types and distances have been calculated from colours using DENIS I-band magnitudes (Gunn-).
Fig. 22 shows a stacked histogram of the spectral-type distribution of our catalogue (without any correction for multiplicity or incompleteness in the sample), with light shading representing the whole catalogue, and dark shading the spectroscopically characterised sub-sample (our spectroscopic sub-sample plus other known objects). The distribution shows a general decrease in number from a peak at M8V down to late-L, but with small peaks centred at L1 and L5, with none occupying the L7 and L8 bins. The shape of our spectral-type distribution is broadly consistent with that derived in the 20 pc spectral-type distribution obtained by Cruz et al. (2007, ; see their fig.10). However, our distribution does appear to have two small differences: an increase in number at L0, and no sharp increase seen at L7 compared to the distribution of Cruz et al. (2007). These differences are most likely due to the sample of Cruz et al. (2007) being pseudo distance limited, so structure in the spectral type distribution will be more evident. Our sample is magnitude limited. In any case, the L0 and L7 frequencies in the Cruz et al. (2007) sample are small number statistics.
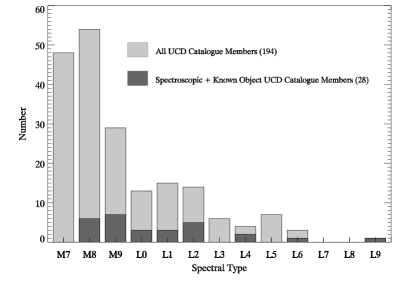
4.4 Hipparcos Companions
In order to identify any UCD catalogue members as possible wide companions to nearby known stars, which would provide good constraints (through association with the primary) for the UCD (e.g., distance, age, and metallicity), a cross-correlation with the Hipparcos catalogue was made. The binary fraction of wide common proper-motion brown dwarf companions to stellar-mass primaries is estimated to be as high as per cent by Pinfield et al. (2006), for separations between au (these authors assume a mass function power-law to be ), therefore such companions should be reasonably common.
We defined an angular radius around each Hipparcos star that corresponds to a projected linear distance of 30,000 au at the distance of each star. We chose a separation limit of 30,000 au because star–star field binaries appear to exist with separations up to a few times au (see fig.9 of Burgasser et al. 2003). Interestingly though, a young Castor moving group binary system has been found with a very wide separation of pc ( Librae + KU Librae: Caballero 2010). However, in the field population low mass binary systems (with a total system mass ) appear to have smaller separations of no greater than au (e.g., Zhang et al. 2010; Radigan et al. 2009).
The cross-correlation produced a total of 30 matches with 19 Hipparcos stars, and in Fig. 23 we plot the minimum physical projected separation of pairings (in units of au) found between catalogue members and the matched Hipparcos stars, against distance. For a few of the closest Hipparcos stars, multiple catalogue members were matched (eight candidates were matched more than once) due to the larger sky area corresponding to 30,000 au radii (i.e., at 2.7 pc), as denoted by the plotted points at close distances.

We rejected 23 candidate matched companions as their total proper motions were not consistent with those of their paired Hipparcos stars. A further three candidate companions were rejected as their derived photometric distances were much further than the primary Hipparcos star. This leaves four other possible Hipparcos candidate companions:
-
HIP 48072/2M0947-3810 Although SSS R-band and I-band images show the proper motion of HIP 48072 and 2M0947-3810 to be similar in RA, a slight southern motion is seen in DEC compared to the SSA value of . However, given the large uncertainty, the SSA measurement is ignored. Due to the proximity of 2M0947-3810 to a nearby bright stellar halo its colour is not reliable, and we therefore derive its distance from the SpT/ relation (see Eq. 5 on page 5) and MJ/spectral-type relation of Cruz et al. (2003) used in conjunction with the 2MASS J-band magnitude. The distance is consistent with that of HIP 48072 to within the measurement uncertainties.
-
HIP 48661/2M0955-7342 The SSA proper motion of 2M0955-7342 is and , which have fairly large uncertainties. The distance estimate of 46 pc for the UCD is too low based on the colour, however, if it is an unresolved binary itself its distance could be under-estimated. Assuming 2M0955-7342 is an equal mass binary will increase its luminosity by a factor of two, and adjusting its apparent magnitude by 0.75 mag increases its distance to 75 pc, consistent with the primary Hipparcos star distance. 2M0955-7342 is a member of our spectroscopic sample with a spectral type of L01, and may therefore be an interesting object.
-
HIP 64765/2M1315-5908 The proper motions of HIP 64765 and 2M1315-5908 are consistent from inspection of the SSS IN image. The colour cannot be used to derive a distance estimate as the SSA IN magnitude is not reliable. Using the SpT/ relation again we obtain a spectral type of M9V for 2M1315-5908 giving a photometric distance estimate of pc, which is somewhat less than the candidate primary Hipparcos stars distance of 92 pc. As in the previous example unresolved (equal mass) binary may explain this difference, so this pair is retained as a wide binary candidate.
-
HIP 81181/2M1634-2531 2M1634-2531 appears from visual inspection of SSS images to be a closely separated optical binary composed of both a redder and bluer component, which may possibly make the spectral type of M9V derived from the colour uncertain. For a spectral type M9V a photometric distance estimate of 40 pc is obtained which is very similar to that of HIP 81181. Due to the potential for this to be an interesting object, it was decided to retain it as a candidate binary, despite the uncertainty surrounding it.
A summary of the basic data for these four candidate binary systems are presented in Table 7. If binarity is confirmed from more accurate follow-up measurements, then age and metallicity constraints can be inferred for the UCD binary candidate companions from their Hipparcos primaries.
Assuming these four candidate companions are confirmed as real binary members, we can estimate the implied companion fraction to main-sequence stars. For this, we applied the same approach as used by Pinfield et al. (2006), to first count the number of stars up to the search distance limits for each candidate, and then determine the companion fraction by summing the reciprocal for each of these numbers. For the distance limit, we chose the limit that corresponds to the MJ range over which our search is complete (see Table 11) for each candidate companion. We obtain a very low wide-companion fraction estimate of about per cent, considerably lower than the estimates of per cent by Pinfield et al. (2006), and per cent by (Gizis et al. 2001), for the L dwarf population. Based on the number of Hipparcos stars within our search area of sky, assuming an average distance to the binary candidates of 50 pc, and using a normalised Poisson probability distribution function, we should expect to find about 33 such UCD companions in our catalogue (also assuming a late-M binary fraction of 40 per cent: Fischer & Marcy 1992).
Our low wide-companion fraction estimate suggests that our search method is inefficient at finding companions around bright stars. This is most likely due to a combination of the different forms of incompleteness in our search method that we identify and discuss, resulting from the high stellar surface densities encountered at low Galactic latitude. A more in-depth analysis to identify the exact causes of our low wide-companion fraction estimate, is not justified by the current number of spectroscopic confirmed catalogue members, but this can be addressed at a later stage.
| Hipparcos Source Data | GP UCD Candidate Data | ||||||||
| HIP No. | Dist. | SpT | 2MASSJ | Sep. | SpT | b | Dist. | ||
| (pc) | Namea | (′′) | (pc) | ||||||
| 48072 | 38.74 | G2V | 0947-3810 | 727.1 | M9Vf | 161 | 37f | ||
| 48661 | 72.15 | G6V | 0955-7342 | 365.6 | L01 | 168 | 466c (75)e | ||
| 64765 | 91.66 | F0IV/V | 1315-5908 | 294.9 | M9Vf? | 57 | 74f | ||
| 81181 | 46.02 | — | 1634-2531 | 472.1 | M9V | 200 | 4020d | ||
(a) Abbreviated 2MASS PSC designation: 2MASS Jhhmmddmm.
(b) The approximate proper motion measured between the 2MASS position and one of the SSS images (brightest and/or widest epoch difference), in units of mas yr-1 .
(c) Distance derived from the MJ/SpT relation of Cruz et al. (2003) for this object, which is part of the spectroscopic sub-sample (see § 4.2).
(d) Distance based on the colour from the MJ/ relation of (Dahn et al. 2002).
(e) This corrected distance in parenthesis is the distance assuming the object is an unresolved binary of mass ratio , and thus components of equal luminosity (see text for details).
4.5 2M1110-7630: A Chamaeleon-I Brown Dwarf
During the search of the sky tile (see Table 4), which includes part of the Chamaeleon-I (hereafter Cham-I) dark cloud complex, two objects were identified that were found to be previously known Cham-I brown dwarfs/YSOs (see Table 3 for object details) in SIMBAD. Another object not identified by SIMBAD (2MASS J11104006-7630547: hereafter 2M1110-7630) was located near to these known Cham-I brown dwarfs with a similar red colour of .
We obtained a J and H band spectrum for 2M1110-7630 from which it is immediately apparent that it differs from ‘normal’ older field late-M dwarfs, due to the lack of deep absorption features in the J-band such as FeH and the normally prominent K i doublets. During subsequent analysis of this object it was realised that 2M1110-7630 had been previously identified as a Cham-I brown dwarf by Luhman (2007), but we include it in our analysis here as we obtain improved constraints for its physical parameters.
In Fig. 24 we present the J- and H-band spectra of 2M1110-7630 which has been de-reddened using a total extinction of derived for 2M1110-7630 by Luhman (2007), and converted to a visual extinction () using the transformation of Rieke & Lebofsky (1985) and a ratio of total to selective extinction of . The prominent K i doublets at m and m seen in the field dwarfs are almost absent in 2M1110-7630, while the deep FeH absorption band at m is missing. Indeed, Gorlova et al. (2003) have shown that the J-band K i doublets and FeH band absorption have a strong dependence on surface gravity, while the pseudo-equivalent width of the K i m doublet can be used to measure the surface gravity in a systematic way. Other indicators of youth seen in the spectra are the presence of the VO (Vanadium Oxide) absorption band at m (Kirkpatrick et al. 2006), as well as the peaked triangular shape of the H-band (e.g., Lucas et al. 2001).
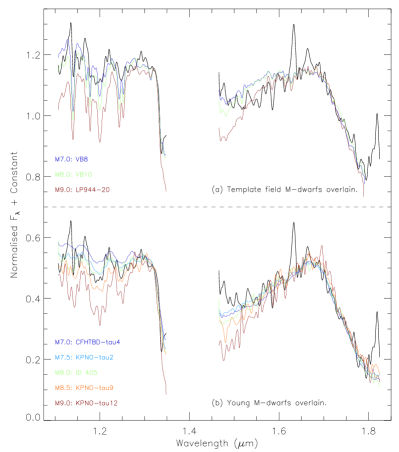
In Fig. 24 we compare the spectra of 2M1110-7630 against representative field (a), and young cluster (b), brown dwarf spectra for a range of late-M sub-types. All the J and H band spectra have been normalised at m and m respectively, with the field dwarf (obtained from Cushing et al. 2005) and 2M1110-7630 spectra smoothed to the same FWHM resolution element of m, consistent with the young brown dwarfs. These young objects are 1–3 Myr Taurus and IC 348 brown dwarfs obtained from lucas (priv.comm.), which have spectral types derived from optical de-reddened spectra.
The presence of Na i absorption is known to be a good indicator of late-type dwarf status, with young (–10 Myr) cluster brown dwarfs showing Na i absorption intermediate between those of older field dwarfs and giants of the same effective temperature. The Na i absorption at m is not as strong as in the field dwarfs, and therefore suggests that 2M1110-7630 is a low surface gravity young dwarf. It can be seen that the J-band spectral morphology is traced much better by the young M-type spectra in Fig. 24b, especially for spectral types M8.0–M8.5, with the best fit to 2M1110-7630 being M8.0 when taking the VO and Na i absorption into account. Looking at the H-band, the blue wing of the H2O absorption of 2M1110-7630 is too low compared to the field objects, but is a better match with the triangular shape of the young objects. From this comparison 2M1110-7630 appears to be a young late-M type dwarf with a spectral type of M8.0.
2M1110-7630 was found to be sub-stellar in nature with a mass of 0.04–0.05 M⊙ by Luhman et al. (2003), and here we derive our own mass and Teff estimates using the DUSTY model evolutionary tracks and isochrones for masses between 0.007-0.07 M⊙ available from Chabrier et al. (2000) and Baraffe et al. (2002). The spectral type of M8.0 gives an effective temperature of for 2M1110-7630, and within the range 2600 K to 2800 K for the spectral type uncertainty using the SpT-Teff relation of Luhman et al. (2003). Taking the known distance to the Cham-I dark cloud as pc (Whittet et al. 1997), the de-reddened absolute Ks magnitude can be obtained for 2M1110-7630 from the 2MASS apparent Ks magnitude. Once M is converted onto the CIT photometric system (using the transformation of Carpenter 2001, to match the model data), these two independently derived parameters can then be plotted onto the model isochrones.
In Fig. 25 the results for 2M1110-7630 are plotted on the isochrones for the ages of 1, 5, 10, and 50 Myrs, and joined by the evolutionary tracks for the mass range mentioned above. This confirms that 2M1110-7630 is indeed sub-stellar with our mass estimate between 0.02–0.04 M⊙, and with an age at the lower end of the range between Myr, thus improving on the previous estimate of Luhman et al. (2003). The results of the 2M1110-7630 analysis are summarised in Table 8, along with those derived by Luhman et al. (2003) for comparison.
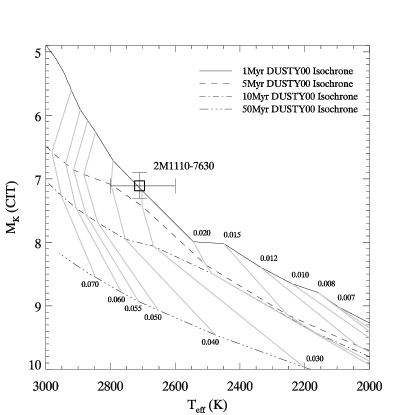
| Source | SpT (band)a | 2MASS Ks mag | MKb | Teff | M/M⊙ | ||
|---|---|---|---|---|---|---|---|
| (K) | |||||||
| This work | M8.0(NIR) | 13.34 | 7.11 | -2.13c | 3.72c | 0.03c | |
| Luhman (2007) | M7.25(Opt) | 13.34 | — | -2.09 | 2838 | — | 0.04/0.05 |
(a) Denotes whether 2M1110-7630 was spectral typed optically (Opt) or from the near-IR (NIR).
(b) MK is on the CIT photometric system and corrected for reddening (see text for details).
4.6 A Nearby pc sample and Red Colours
Our initial photometric candidate sample contained a number of objects with very red colours implying late-L spectral types, or with colours outside the valid range expected from the MJ/( ) and MJ/spectral-type relations of Dahn et al. (2002). These colours were mostly derived using the IN, or converted Ic magnitudes, obtained from the SSS image FITS extension tables or the SSA. Twenty one such objects were identified, many with colours that appeared much bluer than expected for late-L spectral sub-types. These objects all had implied distances within 20 pc.
However, an explanation for these red colours lies in the correction procedure for systematic plate errors of stellar colour distributions which are applied to the SSA (see Hambly et al. 2001b) photometry (obtained from the sCorMag query flag used in this work). As BJ is used as the reference passband for this correction, offsets are applied to the R and I band magnitudes. Although effective in correcting systematic plate errors, it also has the side effect of calibrating out any differential reddening across each plate. The implication here is that in the Galactic plane many regions will exhibit such reddening, resulting in systematic offsets to the R and I band magnitudes, and leading to the red colours we find for some objects.
We obtained DENIS I-band magnitudes for nine of these objects, and for all the remaining ones we obtained I-band magnitudes from the SSS that are not corrected for systematic plate errors. The results from the new colours are significantly different: twelve objects with previously implied spectral types of late-L or >L9 are now classified as late-M, with three of out of the original fourteen remaining as L dwarfs, five objects have new colours too blue for the MJ/( ) relation of Dahn et al. (2002, implying <M7V). As is not a selection criterion we retain catalogue members with implied spectral types <M7V and >L9 (26 and 2 respectively).
With the new I-band photometry none of these previously red objects now have photometric distances of pc. However, twelve others do and four of them with well constrained near-IR spectral types and spectro-photometric distances from our spectroscopic sample (see § 4.2). Details of these nearby UCDs are given in Table 9, and require parallax observations to potentially add them to the Solar neighbourhood 20 pc census (e.g., Reid et al. 2008; Cruz et al. 2007). Six of these objects were identified by Phan-Bao et al. (2008), and one by Kirkpatrick et al. (2010, (2MASS J17343053-1151388)), and for any of these not part of our spectroscopic sample we have used the spectral type and distance estimates from these authors. One object is a known L5.5 field dwarf (Kendall et al. 2007) and for this we use the spectral type and distance estimates from the literature. Two other objects were found to be known Young Stellar Objects (YSOs): 2MASSJ 11085176-7632502 part of Chamaeleon-I (M7.25 Luhman 2007), and 2MASSJ 13030905-7755596 part of Chamaeleon-II (L1 Vuong et al. 2001). These two objects were therefore removed from this list as they belong to star forming complexes much further than 20 pc distant. Finally, three previously unknown objects with distances potentially pc are reported here for the first time: 2MASS J18000116-1559235, 2MASS J18300760-1842361, and 2MASS J14083421-5307378.
| 2MASSJ | (2MASS) | ||
| Namea | J | d (pc)b | SpTc |
| 0630-1840 | 12.681 | M9.0V | |
| 0751-2530 | 13.161 | L1.5 | |
| 0823-4912 | 13.547 | L4 | |
| 0828-1309 | 12.803 | L1.0 | |
| 1126-5003 | 13.997 | L9 | |
| 1408-5307 | 15.155 | L5.5 | |
| 1520-4422 | 13.228 | L1.0 | |
| 1734-1151 | 13.110 | M9.0V | |
| 1750-0016 | 13.294 | L5.5 | |
| 1756-4518 | 12.386 | M9.0V | |
| 1800-1559 | 13.431 | L5.5 | |
| 1830-1842 | 10.427 | M7.5V |
(a) The abbreviated 2MASS designation obtained from the Point Source Catalogue: 2MASS Jhhmmddmm.
(b) Photometric spectral types obtained from the MJ/( ), and MJ/spectral-type relation of Dahn et al. (2002), rounded to the nearest 0.5 of a sub-type.
(c) Photometric distance estimates obtained from the distance modulus where is the 2MASS J-band magnitude and MJ is from the MJ/ relation (Dahn et al. 2002).
() Near-IR spectral type and distance estimates from Folkes et al. (2007). Both Near-IR and optical (Burgasser et al. 2008) spectral types give distance estimates under 20 pc).
() Indicates objects independently discovered by Phan-Bao et al. (2008).
() Spectral types and distances from Phan-Bao et al. (2008).
() Discovered by Kirkpatrick et al. (2010).
() Previously known object: spectral type and distance from Kendall et al. (2007).
5 Catalogue Completeness and Analysis
In this section we discuss, and establish the level of, the main causes of incompleteness in our catalogue, and derive space densities corrected for this incompleteness.
Our search for UCDs will exhibit incompleteness due to colour, reduced proper-motion, magnitude, and spatial selection criteria. Also, a search made at low Galactic latitude (especially in the southern hemisphere) will suffer additional completeness complications due to mismatches from the cross-correlation between the 2MASS and SSA databases, in regions of very high stellar densities and reddening.
5.1 Photometric Incompleteness
5.1.1 Near-IR Colours
Only three out of the 186 reference L dwarfs fall outside the ( )/() selection box limits. However, photometric errors for fainter objects, and the effects of unusual gravity and/or metallicity on these near-IR colours may scatter some UCDs outside our selection box.
To assess the likely degree of completeness using the ( )/() selection box limits, we queried http://dwarfarchives.org for all known dwarfs with well constrained optical spectral types of . We obtained JHKs photometry from the 2MASS all-sky PSC using the same quality flag selection as described in § 2.1, and subjected the sample to the ( )/() and selection criteria used in our search. We find that our overall near-IR colour selected completeness to be at the 91 per cent level, from a total number of 42 M-type dwarfs and 427 L dwarfs across these spectral subtype range. In Fig. 26 we plot the colour completeness confidence level for each 0.5 spectral subtype range as the dark solid bars for the ( )/() selection, which shows scatter between and 100 per cent.
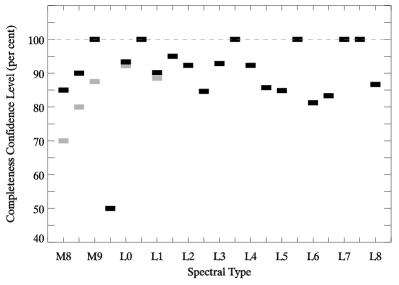
Our lower limit of was carefully chosen primarily to allow dwarfs of spectral types M8V or later to pass through the criterion, but will also pass a percentage of M7V dwarfs. Cruz et al. (2003) defined their colour lower limit as , and found an incompleteness level of per cent for spectral types of M8V or later. For our limit we find that only seven UCDs out of the 469 total fail our selection (1.5 per cent), bringing the overall completeness for both the ( )/() and selection to a level of 89 per cent. However, combining the completeness for both the and / selection across the spectral subtype range shows there to be a more systematic drop off in completeness for the earlier spectral types, and down to a level of 70 per cent for M8V (denoted as light solid bars Fig. 26).
Interestingly, a query of the SIMBAD database for known M8 dwarfs reveals thirteen with 2MASS J- and Ks-band photometry, none with a colour of , and a mean value of .
Until more of our photometric sample have spectroscopic confirmation we can not be certain as to the true level of completeness for the earliest spectral type UCD in our candidate catalogue, therefore, no correction is made to the spectral type number distribution of Fig. 22 for near-IR photometric completeness.
5.1.2 Optical and Optical-NIR Colours
In Fig. 2 the colours indicate an overlap in the late-M and L dwarfs, with one L dwarf and a few late-M dwarfs falling outside the adopted limit of (for ). We note that of the twelve UCDs discovered by Phan-Bao et al. (2008) and were missed by our method (see § 5.1.3 below), four have colours outside our criterion. However, only one of these objects was rejected as a result of this colour criterion alone. As most UCDs will not have a BJ detection (i.e., too red and/or faint), significant incompleteness introduced by this colour is not expected in the catalogue.
The lower end of the and colour selection range criteria were conservatively adjusted to accommodate M8V and later dwarfs, but also to exclude as many contaminants as possible. As mentioned in § 2.4.2 the colour appears to be sensitive to small changes in with scatter evident in both these colours, with two of our 65 reference L dwarfs falling outside of the selection box in Fig. 4. We found the colour to be better behaved in this respect as none of our 65 reference L dwarfs (with both Rc and Ic photometry) were outside the lower limits. We therefore note it is possible that some lower metallicity late-M dwarfs may be rejected due to this colour limit.
We do not expect the c colour will be a source of incompleteness in the photometric selection, as again none of the 65 reference L dwarfs fell outside the c limits, and they form a tight sequence within a range of one magnitude.
The Rc and Ic colours, and optical-NIR (2MASS) colours, of UCD spectral types in our selection range were explored in detail by Liebert & Gizis (2006). From a comparison with these authors work, any incompleteness from our optical-NIR colour selections is not expected to amount to more than a few percent, with the most problematic colour possibly being due to intrinsic scatter, especially concerning the late-M dwarfs.
5.1.3 A Comparison With Known Objects
Although fifteen of the UCDs identified by Phan-Bao et al. (2008) were also identified in this work, twelve were missed by our method. Further investigation revealed the following reasons why these objects were not selected (listed by their DENIS identifier – DENIS-P J[name]);
-
0615493-010041 (L2.5): Not within our selection area.
-
0644143-284141 (M9.5): The , , , and c colours all below the selection limits (SSA optical data).
-
0652197-253450 (L0.0): Below our 2MASS ’Prox’ flag limit of 6 arcsec (at 5.4 arcsec).
-
0805110-315811 (M8.0): value less than our lower limit.
-
1157480-484442 (L1.0): Does not fulfil the 2MASS cc_flg flag selection requirement.
-
1159274-524718 (M9.0): With the SSA IN magnitude (which is saturated) it was outside the colour selection limit. However, using DENIS I-band it passes this limit and was therefore included later in our catalogue.
-
1232178-685600 (M8.0): The , , and c colours all below the selection limits (SSA optical data), and flagged as variable.
-
1347590-761005 (L0.0): Does not fulfil the 2MASS cc_flg flag selection requirement.
-
1454078-660447 (L3.5): The and c colours are below the selection limits (SSA optical data).
-
1519016-741613 (M9.0): Outside the 2MASS and colour selection criteria.
-
1733423-165449 (L1.0): Not returned in the 2MASS query covering this region.
-
1756561-480509 (L0.0): The colour is below the selection limit (SSA optical data).
It can be seen that these objects were not selected as they did not fulfil one of the astrometric, photometric, or quality selection requirements imposed by our method. Therefore, although they may represent an overall source of incompleteness in our UCD sample, we confirm that it is primarily well characterised photometric, and areal selection incompleteness which we discuss in this section (e.g., § 5.1.1, § 5.1.2, and § 5.4.1).
Based on the eleven objects listed above (ignoring DENIS-P J0615493-010041) our selection appears to be incomplete compared to the UCD sample identified by Phan-Bao et al. (2008). However, we also note that out of the seventeen UCDs in our spectroscopic sample, eleven of them (with spectral types ) were missed by the method of Phan-Bao et al. (2008), indicating an incompleteness of compared to that obtained by our selection method. The UCD selection method outlined in this paper, and that used by Phan-Bao et al. (2008) are different, and both are working in a very difficult region of the sky, so one cannot expect to recover the exact same object samples from both.
5.2 Proper-Motion and Survey Cross-Matching
The 5 arcsec cross-match radius between the 2MASS and SSA surveys implies that the efficiency of this method in detecting SSA optical counterparts is (on average) sensitive to them lying beyond a certain distance (assuming an average Vtan) due to proper motion. This also implies a corresponding limiting UCD absolute magnitude at this distance. Given the average epoch difference between the ESO/SERC (1982) and 2MASS (1998) plates being years, and using the 5 arcsec cross-match radius, gives a proper-motion limit of arcsec yr-1 ), then the inferred distance limit can be found from Eq.6:
| (6) |
Where the normalised proper motion at a distance of 1 pc for 1 km s-1 is , using a typical tangential velocity for disk stars of km s-1 (Dahn et al. 2002). The corresponding UCD absolute Ks-band magnitude using the 2MASS photometric limit of at this distance is about M, equivalent to a spectral type of about L8 (Burgasser 2007).
Thus, for regions with greater epoch differences an UCD with a lower proper motion, or one possessing a greater distance, would be required to allow an SSA optical detection. Therefore, a level of kinematic incompleteness may be expected to exist in our catalogue due to the 5 arcsec cross-match radius imposed, and there remains the possibility that higher proper motion UCDs with fainter apparent magnitudes could be missed from our search criteria. However, as fainter UCD examples are most likely to have only measured IN-band magnitudes, the expected kinematic incompleteness will be lower as many IN plates will have epoch differences considerably less than the average of yrs.
At present, any kinematic incompleteness in our catalogue is not easily quantifiable especially without a larger spectroscopically confirmed sample, but we expect most UCDs spanning the full spectral range (M8V to the L–T transition) passing the selection criteria to have an optical counterpart within 5 arcsec of the primary 2MASS location.
5.3 Reduced Proper-Motion
To asses whether any incompleteness might be introduced from the H(K) cut alone, due to both the tangential velocity distribution of UCDs and apparent Ks magnitude, a number of Monte-Carlo simulations were carried out to test for the probability of catalogue inclusion.
To achieve this, a population of test candidates with random distances up to a maximum of 100 pc was created (based on a distribution), each assigned with a random spectral type in the range from M8V to L8. Next, a check was made to see if the random distance of the test candidate was closer than the maximum possible for its spectral type, given the limiting 2MASS magnitude of Ks=14.5 of the catalogue. This was done by obtaining MJ from the MJ/spectral-type relation of Cruz et al. (2003), and the apparent limiting J magnitude from its value obtained from the /Spectral-type relation from Eq. 5 (on page 5). If the random distance was closer than the limiting test distance, then the test candidate was retained for the simulation.
Each test candidate was then assigned a Vtan value based on a normal distribution with the and mean of the normal distribution taken from Vrba et al. (2004); 18.7 km s-1 and 30.0 km s-1 respectively. Next the proper motion was obtained from
where the conversion to km s-1 and arcseconds yields the conversion factor , and by finding the apparent Ks magnitude from the distance modulus using . The final step was to find if the test candidate passed the H(K) criterion using Eq. 4.
The results of this simulation for an arbitrary large tests show that 99.5 per cent of the test candidates passed the H(K) criterion, indicating that any incompleteness introduced from this H(K) cut is negligible and can be ignored.
5.4 Areal Completeness
5.4.1 2MASS PSC Selection
Our initial query of the 2MASS PSC for near-IR candidates used a proximity flag parameter set to arcsec to avoid confusion with nearby neighbours (the effective resolution of 2MASS). The area lost in our search due to this proximity radius can be significant for regions where the stellar densities are particularly high, such as the Galactic plane. The 2MASS executive summary documentation101010see http://www.ipac.caltech.edu/2mass/releases/allsky/doc/sec2_2.html for further details shows that approximately 75 per cent of all detections in the PSC are within , which is approximately 25 per cent of the sky, giving a high average source count density of per arcmin2 averaged over this low Galactic latitude region.
Using a method based on that devised by Deacon et al. (2005) we investigated the effect of areal incompleteness introduced by the 2MASS proximity flag for all regions we searched. We performed a set of simulations to test how many times a number of randomly placed point sources fell outside the proximity flag radius in an area of one arcmin2, and if the point source fell inside the 6 arcsec radius the test failed. The simulations were carried out using a number density of point sources in the range of 1–100 per arcmin2. The fraction which passed gave the probability of detecting a point source as a function of number density. The results indicate probability detection fractions in the range of 0.8–0.2 can be expected, corresponding to number densities from –55 per arcmin2 respectively.
To determine the probability fractions to apply to each sky tile, we obtained the average 2MASS PSC source count number density for twelve test regions spread along four locations along the Galactic plane in longitude (), and three locations in latitude (, and ). To calculate the corresponding probability fractions for each sky tile centre, order polynomials were fitted through the probability fractions of the test areas, along each Galactic latitude. Fig. 27 shows these polynomials, which allow an interpolation to be made for each sky tile centre. For Galactic longitudes of , the polynomial fits were assumed to be symmetrical about the Galactic centre.

To correct for areal incompleteness due to the 2MASS proximity flag the probability fractions for each sky tile centre were multiplied by the total area of each tile. The final corrected individual sky tile areas and total areal areas searched are given in Table 10. The total area searched per tile is the sum of each contribution from the primary, and overcrowded selection criteria, as well as from the area where no selections were made (from columns seven, eight, and nine in Table 4). The total corrected area quoted at the end of column six is used in the subsequent space density analysis.
| Tilea No.# | (Deg2) | (Deg2) | |||
|---|---|---|---|---|---|
| Total area (incomplete)b | Tile detection probability fractionc | Primary selection. Areal completed | Overcrowding selection (Areal complete)e | Total area (Areal complete)f | |
| 1 | 98.4 | 0.872 | 85.8 | — | 85.8 |
| 2 | 198.2 | 0.827 | 163.9 | — | 163.9 |
| 3 | 295.1 | 0.909 | 268.2 | — | 268.2 |
| 4 | 299.6 | 0.758 | 227.1 | — | 227.1 |
| 5 | 295.1 | 0.873 | 257.7 | — | 257.7 |
| 6 | 196.7 | 0.901 | 177.2 | — | 177.2 |
| 7 | 184.7 | 0.665 | 118.9 | 4.0 | 122.8 |
| 8 | 196.7 | 0.863 | 169.8 | — | 169.8 |
| 9 | 196.7 | 0.864 | 170.0 | — | 170.0 |
| 10 | 146.7 | 0.573 | 84.0 | 0.0 | 84.0 |
| 11 | 196.7 | 0.832 | 163.7 | — | 163.7 |
| 12 | 196.7 | 0.812 | 159.8 | — | 159.8 |
| 13 | 107.7 | 0.478 | 49.1 | 2.4 | 51.5 |
| 14 | 196.7 | 0.784 | 154.2 | — | 154.2 |
| 15 | 196.7 | 0.756 | 148.8 | — | 148.8 |
| 16 | 81.8 | 0.393 | 31.7 | 0.4 | 32.1 |
| 17 | 196.7 | 0.722 | 142.0 | — | 142.0 |
| 18 | 178.9 | 0.707 | 126.5 | 0.0 | 126.5 |
| 19 | 47.9 | 0.329 | 15.1 | 0.7 | 15.8 |
| 20 | 185.8 | 0.649 | 119.3 | 1.3 | 120.6 |
| 21 | 177.9 | 0.707 | 116.7 | 9.1 | 125.8 |
| 22 | 37.9 | 0.329 | 12.1 | 0.3 | 12.5 |
| 23 | 166.9 | 0.649 | 101.9 | 6.4 | 108.4 |
| 24 | 221.7 | 0.607 | 132.8 | 1.8 | 134.6 |
| Totals: | 4297.9 | — | 3196.3 | 26.4 | 3222.8 |
(a) See Table 4 for details of the sky tile regions.
(b) The total area searched for candidates without any areal incompleteness correction applied (the addition of columns 7, 8, and 9 in Table 4).
(c) This is the probability of detection fraction (the areal completeness) as a function of source density (sources per arcmin2) derived for the centres of each tile (see Fig. 27, and text for details).
(d) The area searched for candidates from using only the primary selection criteria (without the overcrowding criteria), corrected for areal incompleteness.
(e) The area searched for candidates from using only the overcrowding criteria, corrected for areal incompleteness.
(f) The total final area searched for candidates from column 2 corrected for areal incompleteness. The total of this column is used in subsequent space density analysis.
5.4.2 2MASS and SSA object mismatches
Object mismatches between the 2MASS source and the true SSA optical counterpart could potentially lead to incompleteness in the catalogue sample for the crowded regions of the Galactic plane. UCDs with high proper motions that place them outside the 5 arcsec SSA search radius could be confused with an optical detection not associated with the 2MASS source. Additionally, mismatches may also occur for objects whose true optical counterparts are too faint to be detected in the SSA. Thus, an incorrect pairing between these two survey data-sets may cause a genuine UCD candidate to be rejected, by apparent optical/near-IR colour(s) that place them outside the selection criteria.
In Fig. 28 we show the results of a simulation to calculate the probability of a mismatch between the 2MASS source and an SSA optical detection not associated with the source, using a 5 arcsec search radius, as a function of stellar surface density. The simulation was carried out using the same procedure outlined in detail in § 5.4.1 where we find the probability of a mismatch as a function of point sources per arcmin2 and Galactic latitude. The mismatch probability in this case is taken as 1-(probability of detection).

These results indicate that incompleteness in our catalogue sample due to the 5 arcsec cross-match radius will be most significant ( per cent level) in the Galactic mid-plane within of the Galactic centre, and also within of the Galactic centre for higher Galactic latitudes of .
5.5 Volume Completeness
5.5.1 Cumulative Distribution
To gauge whether our catalogue sample is uniformly distributed with increasing space volume, we investigate the cumulative number distribution as a function of the volume () over four MJ ranges. The point where the distribution systematically deviates from the line of uniformity in each MJ range, may be used to indicate where incompleteness begins. Non-uniformity should ideally occur near the distance limits of each MJ range.
The four MJ ranges were chosen to sample similar photometric distance limits within each range (, , , and ), and also to provide relevance with the literature (e.g., Cruz et al. (2007)). Cumulative numbers were found for each successive distance shell over a distance range up to, and exceeding, the photometric limit expected for each MJ range.
The three panels of Fig. 29(a–c) show the distribution results as solid lines in each MJ range, along with the gradient expected for a uniform distribution (dashed line). All panels of Fig. 29 show a degree of uniformity that flattens off at progressively further distances, and with a decreasing total number of objects within each MJ range (125, 43, and 23 respectively). The faintest MJ range only contains one object within 10 pc, and shows no uniformity, therefore we do not plot this MJ range. For all three MJ ranges shown in panels (a–c) we divide the distance into shells of bin-width equal to 0.2 dex.
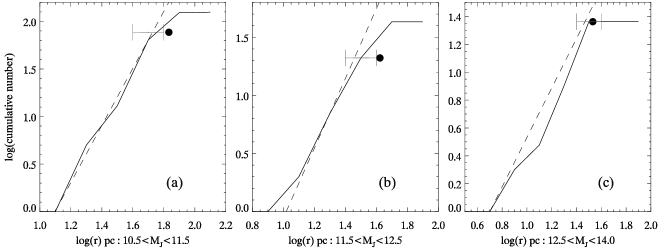
The solid circles in each panel of Fig. 29 are points representing our adopted distance completeness limits of our UCD catalogue, and were obtained in an iterative process between this cumulative number distribution investigation and the volume statistic analysis (see § 5.5.2 below). This was achieved by taking into account the form of the volume statistic and space density distributions, and cross-identifying the bin where these cumulative distributions depart from uniformity. The number of objects represented by the plotted points in panels (a–c) are the cumulative number within the distance completeness limits indicated in Fig. 30.
5.5.2 Volume Statistic and Space Density
To help assess the degree of completeness throughout our catalogue, we also followed an approach used by Reid et al. (1995) (originally devised by Schmidt 1975) referred to as the volume statistic (), in conjunction with the cumulative number distribution. This differential statistic will produce a mean value of from the ratios of the individual objects, if the sample is uniformly distributed. Here, takes the form of successive steps (shells) of increasing distance (), within which the cumulative number of objects is found. We apply this method using the same MJ ranges and maximum distance limits in § 5.5.1, and the results are presented in Fig. 30.
The average volume statistics are shown as open circles derived from the distances to individual objects that are less than the test distance (), and are plotted against in each case in increments of 2 pc. The line conforming to uniformity in the sample is indicated by a dashed horizontal line in each panel (a–d). We also over-plot the cumulative mean space densities () which uses the total (completeness corrected) sky area searched in the creation of our UCD catalogue (3223 deg2: see Table 10).
We derive distance limits over which we consider our UCD catalogue to be complete where begins to systematically drop below 0.5 (within the standard error of the mean), and where the space density is also beginning to systematically drop. Our adopted distance limits are indicated by vertical dashed-dot lines in panels (a–c). For the fainest MJ range in panel (d) no completeness limit can be reliably obtained as only one object exists here. However, to obtain a lower limit to the total space density we use a distance of 10 pc, which is the distance bin containing the only object in this faintestMJ range, to calculate a space density.
Finally, we derive space densities from a total number of objects within our complete space volume (125), and these density values that we denoted as are listed in Table 11, along with the number of objects () found within each MJ range and corresponding complete distance limit. Also listed for comparison in Table 11 are the space densities derived by Cruz et al. (2007) (in square brackets – last column) from their 20 pc 2M2U sample of M7–L8 UCDs derived from higher Galactic latitudes ().
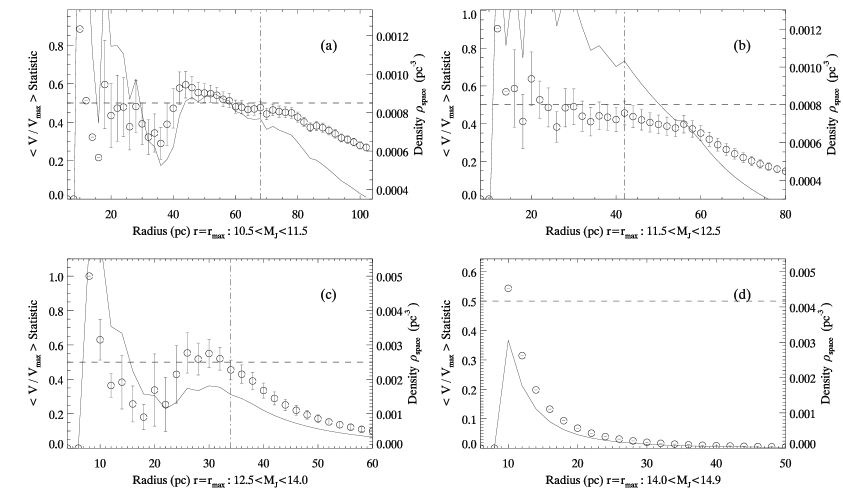
We obtain a total space density of that is in agreement with the value of of Cruz et al. (2007). However, some of our individual space densities over each MJ range differ slightly to those of the same authors. The most significant difference is the lower space density for the late-M dwarfs. We also note that our total space density has a large contribution from the faintest MJ range, which is highly uncertain. Omitting the faintest MJ range from the total space density gives , a result more in line with that obtained by Gizis et al. (2000).
We now compare our results with the space density derived by Phan-Bao et al. (2008) using the DENIS data set over at low Galactic latitude. For the comparison we re-calculated our space density for the same MJ range used by these authors (: M8–L3.3), and we obtain a value of , which is in very good agreement with the their result of . As this MJ range covers our first two highest luminosity ranges in Table 11, we assumed a distance of 50 pc as representing a complete sample in our calculation, but choosing higher and lower complete distances of 46 pc and 56 pc give respective space densities of and , both still in good agreement with Phan-Bao et al. (2008).
Although we have defined space volumes over which our UCD southern Galactic plane UCD catalogue is uniformly distributed, the reasons for our lower late-M dwarf () space density in comparison with Cruz et al. (2007), most likely stems from the following probable causes:
-
1.
The volume limited sample from Cruz et al. (2007) was optimised for objects with spectral types not M8V as in our selection requirement, and these authors find almost equal numbers of M7 and M8 dwarfs. Thus, the highest luminosity (spectral type) bin these authors consider may well have an increased space density estimate due to the M7V spectral type contribution.
-
2.
The combination of individual causes potentially leading to incompleteness in our UCD catalogue as discussed in § 5.
| Magnitude Range | Sp-T Range | Completeness Limitsa (pc) | b | ||
|---|---|---|---|---|---|
| Total c | d | ||||
| M7V–M9V | 68 | [] | |||
| M9.5V–L2.5 | 42 | [] | |||
| L3–L6 | 34 | [] | |||
| L6.5–L9 | — | [] | |||
| Total | M7–L9 | — | 125 | ||
(a) The distance limits over which our UCD catalogue is considered to be complete in each MJ magnitude range.
(b) The cumulative number of objects within the complete space volumes of the specified MJ magnitude ranges.
(c) The space densities for the UCD catalogue derived using the distance limits from column three (see text for details). Uncertainties for each MJ magnitude range are calculated based on the Poisson error in the number of objects within each MJ range and each corresponding completeness derived distance estimates, then propagated through the space density calculations. The uncertainties quoted in our total space densities were found by adding the individual MJ range uncertainties in quadrature.
(d) The space densities found for the 20 pc 2M2U sample of Cruz et al. (2007) given for comparison.
6 Conclusions
In this paper we have demonstrated that it is possible to systematically search the ‘zone of avoidance’ of the southern Galactic plane for UCDs, using near-IR and optical photometric constraints, as well as utilising proper motion data, down to the 2MASS and SSA limiting magnitudes of (, and ). The more well characterised colours and two-colour planes one can work with, the better the efficiency in rejecting contaminant objects encountered at low Galactic latitudes (seven optical/near-IR colours used here). We also find reduced proper-motion is an effective tool in this respect. In our analysis we highlight and quantify difficulties and limitations working at low Galactic latitude using these existing survey data sets, in particular the cross-correlation with the digitised optical photographic plate material, that can lead to issues of incompleteness.
We have presented a candidate UCD catalogue compiled at southern low Galactic latitudes with a sky coverage of 5042 deg2 (completeness corrected areal coverage of 3223 deg2), within . Our catalogue contains 246 members, sixteen of which have spectroscopic confirmation (94 per cent of the spectroscopic targets). From an analysis of the characterised photometric and spectroscopic UCD samples, we derive completeness corrected space densities over three UCD MJ ranges, and a lower limit to the space density on our forth lowest luminosity range. We find a total space density of (for ) in agreement with the value derived at higher Galactic latitudes by Cruz et al. (2007). We also compare our space density results with Phan-Bao et al. (2008) and find a value of when re-binned to the same MJ range used by these authors (M8–L3.5), a result which is in almost exact agreement.
Our UCD catalogue also contains some potentially very interesting objects, which include possible companions to known Hipparcos stars, and a nearby pc sample based on spectro-photometric, and photometric distance estimates. This catalogue may also contain some interesting examples of UCDs with unusual metallicity/gravity. Due to the locations of these objects in the Galactic plane they will also make ideal candidates for future high-strehl adaptive optics imaging (high stellar densities for reference tip-tilt correction stars), to search for low-mass sub-stellar/planetary mass companions.
Acknowledgements
This publication makes use of data products from the Two Micron All Sky Survey, which is a joint project of the University of Massachusetts and the Infrared Processing and Analysis Center/California Institute of Technology, funded by the National Aeronautics and Space Administration and the National Science Foundation.Our research has also made use of data obtained from the SuperCOSMOS Science Archive, prepared and hosted by the Wide Field Astronomy Unit, Institute for Astronomy, University of Edinburgh, which is funded by the UK Science and Technology Facilities Council. This research has also made use of the SIMBAD database, operated at CDS, Strasbourg, France, as well as of NASA’s Astrophysics Data System Bibliographic Services. We acknowledge that our research has benefited extensively from the M, L, and T dwarf compendium housed at http://dwarfarchives.org and maintained by Chris Gelino, Davy Kirkpatrick, and Adam Burgasser, and also from the IRTF Spectral Library: http://irtfweb.ifa.hawaii.edu/spex/IRTF_Spectral_Library. The authors would also like to acknowledge the use of David Fanning’s very useful ’Coyote’s Guide to IDL Programming’ resource located at http://www.dfanning.com/index.html#toc.
S.L.F. acknowledges funding support from the ESO-Government of Chile Mixed Committee 2009, and from the GEMINI–CONICYT grant # 32090014/2009. Support for S.L.F. is also provided by the Ministry for the Economy, Development, and Tourism’s Programa Iniciativa Científica Milenio through grant P07-021-F, awarded to The Milky Way Millennium Nucleus. Support for R.K. is provided by Proyecto FONDECYT Regular # 1080154, by Proyecto DIUV23/2009, and the Centro de Astrofísica de Valparaíso. A.D.J. is supported by a FONDECYT postdoctorado fellowship under project number # 3100098.
References
- Alksnis et al. (2001) Alksnis, A., Balklavs, A., Dzervitis, U., et al. 2001, VizieR Online Data Catalog, 3227, 0
- Aller (1991) Aller, L. H. 1991, Atoms, Stars, and Nebulae (Atoms, Stars, and Nebulae, by Lawrence H. Aller, pp. 380. ISBN 0521325129. Cambridge, UK: Cambridge University Press, September 1991.)
- Baraffe et al. (2002) Baraffe, I., Chabrier, G., Allard, F., & Hauschildt, P. H. 2002, A&A, 382, 563
- Bessell (1986) Bessell, M. S. 1986, PASP, 98, 1303
- Bourke et al. (1995) Bourke, T. L., Hyland, A. R., Robinson, G., James, S. D., & Wright, C. M. 1995, MNRAS, 276, 1067
- Burgasser (2007) Burgasser, A. J. 2007, ApJ, 659, 655
- Burgasser et al. (2006) Burgasser, A. J., Geballe, T. R., Leggett, S. K., Kirkpatrick, J. D., & Golimowski, D. A. 2006, ApJ, 637, 1067
- Burgasser et al. (2003) Burgasser, A. J., Kirkpatrick, J. D., Reid, I. N., et al. 2003, ApJ, 586, 512
- Burgasser et al. (2008) Burgasser, A. J., Looper, D. L., Kirkpatrick, J. D., Cruz, K. L., & Swift, B. J. 2008, ApJ, 674, 451
- Burgasser et al. (2007) Burgasser, A. J., Looper, D. L., Kirkpatrick, J. D., & Liu, M. C. 2007, ApJ, 658, 557
- Burgasser & McElwain (2006) Burgasser, A. J. & McElwain, M. W. 2006, aj, 131, 1007
- Caballero (2010) Caballero, J. A. 2010, aap, 514, A98
- Cabanela et al. (2003) Cabanela, J. E., Humphreys, R. M., Aldering, G., et al. 2003, PASP, 115, 837
- Carpenter (2001) Carpenter, J. M. 2001, AJ, 121, 2851
- Chabrier et al. (2000) Chabrier, G., Baraffe, I., Allard, F., & Hauschildt, P. 2000, ApJ, 542, 464
- Comerón et al. (2003) Comerón, F., Fernández, M., Baraffe, I., Neuhäuser, R., & Kaas, A. A. 2003, A&A, 406, 1001
- Crawford (2000) Crawford, I. A. 2000, MNRAS, 317, 996
- Crifo et al. (2005) Crifo, F., Phan-Bao, N., Delfosse, X., et al. 2005, aap, 441, 653
- Cruz et al. (2007) Cruz, K. L., Reid, I. N., Kirkpatrick, J. D., et al. 2007, AJ, 133, 439
- Cruz et al. (2003) Cruz, K. L., Reid, I. N., Liebert, J., Kirkpatrick, J. D., & Lowrance, P. J. 2003, AJ, 126, 2421
- Cushing et al. (2005) Cushing, M. C., Rayner, J. T., & Vacca, W. D. 2005, ApJ, 623, 1115
- Dahn et al. (2002) Dahn, C. C., Harris, H. C., Vrba, F. J., et al. 2002, AJ, 124, 1170
- Deacon et al. (2005) Deacon, N. R., Hambly, N. C., & Cooke, J. A. 2005, A&A, 435, 363
- Delfosse et al. (1997) Delfosse, X., Tinney, C. G., Forveille, T., et al. 1997, A&A, 327, L25
- Epchtein et al. (1999) Epchtein, N., Deul, E., Derriere, S., et al. 1999, A&A, 349, 236
- Fischer & Marcy (1992) Fischer, D. A. & Marcy, G. W. 1992, ApJ, 396, 178
- Folkes et al. (2007) Folkes, S. L., Pinfield, D. J., Kendall, T. R., & Jones, H. R. A. 2007, MNRAS, 378, 901
- Gelino et al. (2002) Gelino, C. R., Marley, M. S., Holtzman, J. A., Ackerman, A. S., & Lodders, K. 2002, ApJ, 577, 433
- Gizis (2002) Gizis, J. E. 2002, ApJ, 575, 484
- Gizis et al. (2001) Gizis, J. E., Kirkpatrick, J. D., Burgasser, A., et al. 2001, ApJL, 551, L163
- Gizis et al. (2000) Gizis, J. E., Monet, D. G., Reid, I. N., et al. 2000, AJ, 120, 1085
- Gorlova et al. (2003) Gorlova, N. I., Meyer, M. R., Rieke, G. H., & Liebert, J. 2003, ApJ, 593, 1074
- Hambaryan et al. (2004) Hambaryan, V., Staude, A., Schwope, A. D., et al. 2004, aap, 415, 265
- Hambly et al. (2001a) Hambly, N. C., Davenhall, A. C., Irwin, M. J., & MacGillivray, H. T. 2001a, MNRAS, 326, 1315
- Hambly et al. (2001b) Hambly, N. C., Irwin, M. J., & MacGillivray, H. T. 2001b, MNRAS, 326, 1295
- Hambly et al. (2001c) Hambly, N. C., MacGillivray, H. T., Read, M. A., et al. 2001c, MNRAS, 326, 1279
- Hamuy et al. (1992) Hamuy, M., Walker, A. R., Suntzeff, N. B., et al. 1992, pasp, 104, 533
- Hawley (2002) Hawley, S. L. e. a. 2002, AJ, 123, 3409
- Hilton et al. (2010) Hilton, E. J., West, A. A., Hawley, S. L., & Kowalski, A. F. 2010, aj, 140, 1402
- Jenkner et al. (1990) Jenkner, H., Lasker, B. M., Sturch, C. R., et al. 1990, AJ, 99, 2082
- Jones & Tsuji (1997) Jones, H. R. A. & Tsuji, T. 1997, apjl, 480, L39
- Kendall et al. (2004) Kendall, T. R., Delfosse, X., Martín, E. L., & Forveille, T. 2004, aap, 416, L17
- Kendall et al. (2007) Kendall, T. R., Jones, H. R. A., Pinfield, D. J., et al. 2007, MNRAS, 374, 445
- Kendall et al. (2003) Kendall, T. R., Mauron, N., Azzopardi, M., & Gigoyan, K. 2003, A&A, 403, 929
- Kirkpatrick et al. (2006) Kirkpatrick, J. D., Barman, T. S., Burgasser, A. J., et al. 2006, ApJ, 639, 1120
- Kirkpatrick et al. (2008) Kirkpatrick, J. D., Cruz, K. L., Barman, T. S., et al. 2008, apj, 689, 1295
- Kirkpatrick et al. (2007) Kirkpatrick, J. D., Looper, D. L., Burgasser, A. J., et al. 2007, in American Astronomical Society Meeting Abstracts, Vol. 210, American Astronomical Society Meeting Abstracts, 17.07–+
- Kirkpatrick et al. (2010) Kirkpatrick, J. D., Looper, D. L., Burgasser, A. J., et al. 2010, apjs, 190, 100
- Kirkpatrick et al. (2000) Kirkpatrick, J. D., Reid, I. N., Liebert, J., et al. 2000, AJ, 120, 447
- Kirkpatrick (1999) Kirkpatrick, J. D. e. a. 1999, ApJ, 519, 802
- Knapp et al. (2004) Knapp, G. R., Leggett, S. K., Fan, X., et al. 2004, AJ, 127, 3553
- Lasker et al. (2008) Lasker, B. M., Lattanzi, M. G., McLean, B. J., et al. 2008, AJ, 136, 735
- Lawrence et al. (2007) Lawrence, A., Warren, S. J., Almaini, O., et al. 2007, mnras, 379, 1599
- Leggett (1992) Leggett, S. K. 1992, ApJS, 82, 351
- Leggett et al. (2001) Leggett, S. K., Allard, F., Geballe, T. R., Hauschildt, P. H., & Schweitzer, A. 2001, ApJ, 548, 908
- Lépine (2008) Lépine, S. 2008, AJ, 135, 2177
- Lépine et al. (2002a) Lépine, S., Rich, R. M., Neill, J. D., Caulet, A., & Shara, M. M. 2002a, ApJL, 581, L47
- Lépine et al. (2003) Lépine, S., Rich, R. M., & Shara, M. M. 2003, apjl, 591, L49
- Lépine & Shara (2005) Lépine, S. & Shara, M. M. 2005, AJ, 129, 1483
- Lépine et al. (2002b) Lépine, S., Shara, M. M., & Rich, R. M. 2002b, AJ, 124, 1190
- Liebert & Gizis (2006) Liebert, J. & Gizis, J. E. 2006, pasp, 118, 659
- Liebert et al. (1999) Liebert, J., Kirkpatrick, J. D., Reid, I. N., & Fisher, M. D. 1999, ApJ, 519, 345
- Littlefair et al. (2006) Littlefair, S. P., Dhillon, V. S., Marsh, T. R., Shahbaz, T., & Martín, E. L. 2006, MNRAS, 370, 1208
- Lodieu et al. (2002) Lodieu, N., Scholz, R.-D., & McCaughrean, M. J. 2002, aap, 389, L20
- Lodieu et al. (2005) Lodieu, N., Scholz, R.-D., McCaughrean, M. J., et al. 2005, A&A, 440, 1061
- López Martí et al. (2004) López Martí, B., Eislöffel, J., Scholz, A., & Mundt, R. 2004, A&A, 416, 555
- Lowrance et al. (2003) Lowrance, P. J., Kirkpatrick, J. D., Reid, I. N., Cruz, K. L., & Liebert, J. 2003, ApJL, 584, L95
- Lucas et al. (2001) Lucas, P. W., Roche, P. F., Allard, F., & Hauschildt, P. H. 2001, MNRAS, 326, 695
- Luhman (2007) Luhman, K. L. 2007, ApJS, 173, 104
- Luhman et al. (2005) Luhman, K. L., Lada, C. J., Hartmann, L., et al. 2005, ApJL, 631, L69
- Luhman et al. (2003) Luhman, K. L., Stauffer, J. R., Muench, A. A., et al. 2003, ApJ, 593, 1093
- Luyten (1978) Luyten, W. J. 1978, in IAU Symposium, Vol. 80, The HR Diagram - The 100th Anniversary of Henry Norris Russell, ed. A. G. D. Philip & D. S. Hayes, 63–+
- Luyten (1979a) Luyten, W. J. 1979a, LHS catalogue. A catalogue of stars with proper motions exceeding 0”5 annually (Minneapolis: University of Minnesota, 1979, 2nd ed.)
- Luyten (1979b) Luyten, W. J. 1979b, in New Luyten Catalogue of stars with proper motions larger than two tenths of an arcsecond, 1, 0 (1979), 0–+
- Luyten (1979c) Luyten, W. J. 1979c, in New Luyten Catalogue of stars with proper motions larger than two tenths of an arcsecond, 2, 0 (1979), 0–+
- Luyten (1980a) Luyten, W. J. 1980a, in New Luyten Catalogue of stars with proper motions larger than two tenths of an arcsecond, 3, 0 (1980), 0–+
- Luyten (1980b) Luyten, W. J. 1980b, in New Luyten Catalogue of stars with proper motions larger than two tenths of an arcsecond, 4, 0 (1980), 0–+
- Martín & Ardila (2001) Martín, E. L. & Ardila, D. R. 2001, aj, 121, 2758
- Martín et al. (1999) Martín, E. L., Delfosse, X., Basri, G., et al. 1999, AJ, 118, 2466
- Martín et al. (2010) Martín, E. L., Phan-Bao, N., Bessell, M., et al. 2010, aap, 517, A53
- Martin et al. (1994) Martin, E. L., Rebolo, R., & Magazzu, A. 1994, apj, 436, 262
- Martin et al. (1996a) Martin, E. L., Rebolo, R., & Zapatero-Osorio, M. R. 1996a, apj, 469, 706
- Martín et al. (2001) Martín, E. L., Zapatero Osorio, M. R., & Lehto, H. J. 2001, apj, 557, 822
- Martin et al. (1996b) Martin, E. L., Zapatero Osorio, M. R., & Rebolo, R. 1996b, in Astronomical Society of the Pacific Conference Series, Vol. 109, Cool Stars, Stellar Systems, and the Sun, ed. R. Pallavicini & A. K. Dupree, 615
- Mauron et al. (2004) Mauron, N., Azzopardi, M., Gigoyan, K., & Kendall, T. R. 2004, A&A, 418, 77
- McCaughrean et al. (2002) McCaughrean, M. J., Scholz, R.-D., & Lodieu, N. 2002, A&A, 390, L27
- McLean et al. (2003) McLean, I. S., McGovern, M. R., Burgasser, A. J., et al. 2003, ApJ, 596, 561
- Mennessier et al. (2001) Mennessier, M. O., Mowlavi, N., Alvarez, R., & Luri, X. 2001, VizieR Online Data Catalog, 337, 40968
- Monet et al. (2003) Monet, D. G., Levine, S. E., Canzian, B., et al. 2003, AJ, 125, 984
- Phan-Bao et al. (2008) Phan-Bao, N., Bessell, M. S., Martín, E. L., et al. 2008, MNRAS, 383, 831
- Phan-Bao et al. (2003) Phan-Bao, N., Crifo, F., Delfosse, X., et al. 2003, A&A, 401, 959
- Pinfield et al. (2006) Pinfield, D. J., Jones, H. R. A., Lucas, P. W., et al. 2006, MNRAS, 368, 1281
- Probst & Liebert (1983) Probst, R. G. & Liebert, J. 1983, ApJ, 274, 245
- Radigan et al. (2009) Radigan, J., Lafrenière, D., Jayawardhana, R., & Doyon, R. 2009, apj, 698, 405
- Reid (2003) Reid, I. N. 2003, AJ, 126, 2449
- Reid et al. (2001) Reid, I. N., Burgasser, A. J., Cruz, K. L., Kirkpatrick, J. D., & Gizis, J. E. 2001, AJ, 121, 1710
- Reid et al. (2008) Reid, I. N., Cruz, K. L., Kirkpatrick, J. D., et al. 2008, aj, 136, 1290
- Reid et al. (1995) Reid, I. N., Hawley, S. L., & Gizis, J. E. 1995, AJ, 110, 1838
- Rieke & Lebofsky (1985) Rieke, G. H. & Lebofsky, M. J. 1985, ApJ, 288, 618
- Schmidt (1975) Schmidt, M. 1975, ApJ, 202, 22
- Scholz & Meusinger (2002) Scholz, R.-D. & Meusinger, H. 2002, MNRAS, 336, L49
- Skrutskie et al. (2006) Skrutskie, M. F., Cutri, R. M., Stiening, R., et al. 2006, aj, 131, 1163
- Stauffer et al. (1998) Stauffer, J. R., Schultz, G., & Kirkpatrick, J. D. 1998, apjl, 499, L199
- Tinney & Tolley (1999) Tinney, C. G. & Tolley, A. J. 1999, mnras, 304, 119
- Vacca et al. (2003) Vacca, W. D., Cushing, M. C., & Rayner, J. T. 2003, PASP, 115, 389
- Vrba et al. (2004) Vrba, F. J., Henden, A. A., Luginbuhl, C. B., et al. 2004, AJ, 127, 2948
- Vuong et al. (2001) Vuong, M. H., Cambrésy, L., & Epchtein, N. 2001, A&A, 379, 208
- Whittet et al. (1997) Whittet, D. C. B., Prusti, T., Franco, G. A. P., et al. 1997, A&A, 327, 1194
- Wilson et al. (2003) Wilson, J. C., Miller, N. A., Gizis, J. E., et al. 2003, in IAU Symposium, Vol. 211, Brown Dwarfs, ed. E. Martín, 197–+
- York et al. (2000) York, D. G., Adelman, J., Anderson, Jr., J. E., et al. 2000, AJ, 120, 1579
- Zhang et al. (2010) Zhang, Z. H., Pinfield, D. J., Day-Jones, A. C., et al. 2010, mnras, 404, 1817
0
Appendix 0.A Supplementary Materials
The following supplementary material is available on-line for the article:
0.A.1 On-line Complete Photometric Candidate Data Table
Spectral type and distance estimates are presented for the southern Galactic plane photometric UCD catalogue candidate members.
0.A.2 On-line complete SGPUCD Catalogue Table
The full Southern Galactic Plane UCD catalogue (SGPUCD) containing 246 members. Astrometric, photometric, and proper-motion data are presented, as well as spectral types and distances derived for both the spectroscopic and photometric samples.