Na2IrO3 as a Novel Relativistic Mott Insulator with a 340 meV Gap
Abstract
We study Na2IrO3 by ARPES, optics, and band structure calculations in the local-density approximation (LDA). The weak dispersion of the Ir 5- manifold highlights the importance of structural distortions and spin-orbit coupling (SO) in driving the system closer to a Mott transition. We detect an insulating gap meV which, at variance with a Slater-type description, is already open at 300 K and does not show significant temperature dependence even across K. An LDA analysis with the inclusion of SO and Coulomb repulsion U reveals that, while the prodromes of an underlying insulating state are already found in LDA+SO, the correct gap magnitude can only be reproduced by LDA+SO+U, with eV. This establishes Na2IrO3 as a novel type of Mott-like correlated insulator in which Coulomb and relativistic effects have to be treated on an equal footing.
pacs:
71.20.Be, 74.25.Jb, 74.25.Gz, 71.15.MbThe proposal of an effective Mott-Hubbard state in Sr2IrO4 Kim et al. (2008) came as a surprise since this case departs from the established phenomenology of Mott-insulating behavior in the canonical early 3 transition-metal oxides. There, the localized nature of the 3 valence electrons is responsible for the small bandwidth , large Coulomb repulsion , and suppression of charge fluctuations Mott (1949); Zaanen et al. (1985). In particular, Sr2IrO4 appears to violate the Mott criterion, which for the very delocalized 5 Ir electrons is not fulfilled. It was proposed that the strong spin-orbit (SO) interaction in 5 systems ( meV for Ir Montalti et al. (2006)) might lead to instability against weak electron-electron correlation effects, and to the subsequent emergence of a many-body insulating ground state Kim et al. (2008). However, the strong-SO limit ground-state scenario has recently been put into question Haskel et al. (2012), and theoretical Arita et al. (2012) and time-resolved optical studies Hsieh et al. (2012) suggest that the insulating state of Sr2IrO4 might be closer to a Slater than a Mott type: a band-like insulating state induced by the onset of antiferromagnetic (AF) ordering and consequent band folding at K (Slater), as opposed to be driven by electron-correlations with an insulating gap already open at temperatures well above (Mott).
Despite intense experimental and theoretical effort, the nature of the insulating state in the 5 iridates remains highly controversial. This is reminiscent of the situation in 3 oxides, for which the Mott versus band-insulator debate has lasted over four decades Mott (1949); Terakura et al. (1984); Fujimori et al. (1984); Fujimori and Minami (1984). For instance, in the case of the prototypical AF insulator NiO, this debate was conclusively resolved only after the correlated nature of the insulating state was established based on: (i ) the magnitude of the gap as measured by direct and inverse photoelectron spectroscopy (PES/IPES) Sawatzky and Allen (1984), much larger than expected from density functional theory (DFT) Terakura et al. (1984); (ii ) its persistence well above the Néel temperature Tjernberg et al. (1996); and (iii ) the detailed comparison between DMFT results Kuneš et al. (2007) and momentum-resolved electronic structure as measured by angle-resolved photoelectron spectroscopy (ARPES) Tjernberg et al. (1996); Shen et al. (1990).
To address the nature of the insulating state in iridates, including the role of many-body electron correlations for their extended 5 orbitals and the delicate interplay between , and SO energy scales, a particularly interesting system is the newly discovered AF insulator Na2IrO3 Singh and Gegenwart (2010). Starting from a model in analogy with Sr2IrO4, this system was predicted to exhibit quantum spin Hall behavior, and was considered a potential candidate for a topologically insulating state Shitade et al. (2009). Further theoretical Jin et al. (2009); Bhattacharjee et al. (2012) and experimental Ye et al. (2012) work emphasized the relevance of structural distortions, which lower the local symmetry at the Ir site from octahedral () to trigonal (). Together with the structure comprised of edge-sharing IrO6 octahedra, this leads to an effective bandwidth for the Ir 5- manifold of eV. This potentially puts Na2IrO3 closer than other iridates to the Mott criterion borderline – and thus to a Mott insulating phase Jin et al. (2009). Most importantly, its lower K provides the opportunity of studying the electronic structure well above the long-range AF ordering temperature and – with the aid of novel DFT calculations – establishing the nature of its insulating behavior.
In this Letter we present a study of the low-energy electronic structure of Na2IrO3 by ARPES, angle-integrated PES with in-situ potassium doping, optics, and DFT calculations in the local-density approximation (LDA). The narrow bandwidth of the Ir-5 manifold observed in ARPES highlights the importance of SO coupling and structural distortions in driving the system towards a Mott transition. In addition, at variance with a Slater-type description, the gap is already open at 300 K and does not show significant temperature dependence even across K. From the potassium-induced chemical potential shift and complementary optical conductivity measurements, we estimate the insulating gap to be meV.
While LDA+SO already returns a depletion of density of states (DOS) at , this only corresponds to a ‘zero-gap’. The observed meV gap value can be reproduced only in LDA+SO+U calculations, i.e. with the inclusion of both SO and U (with eV), establishing Na2IrO3 as a novel relativistic Mott insulator.
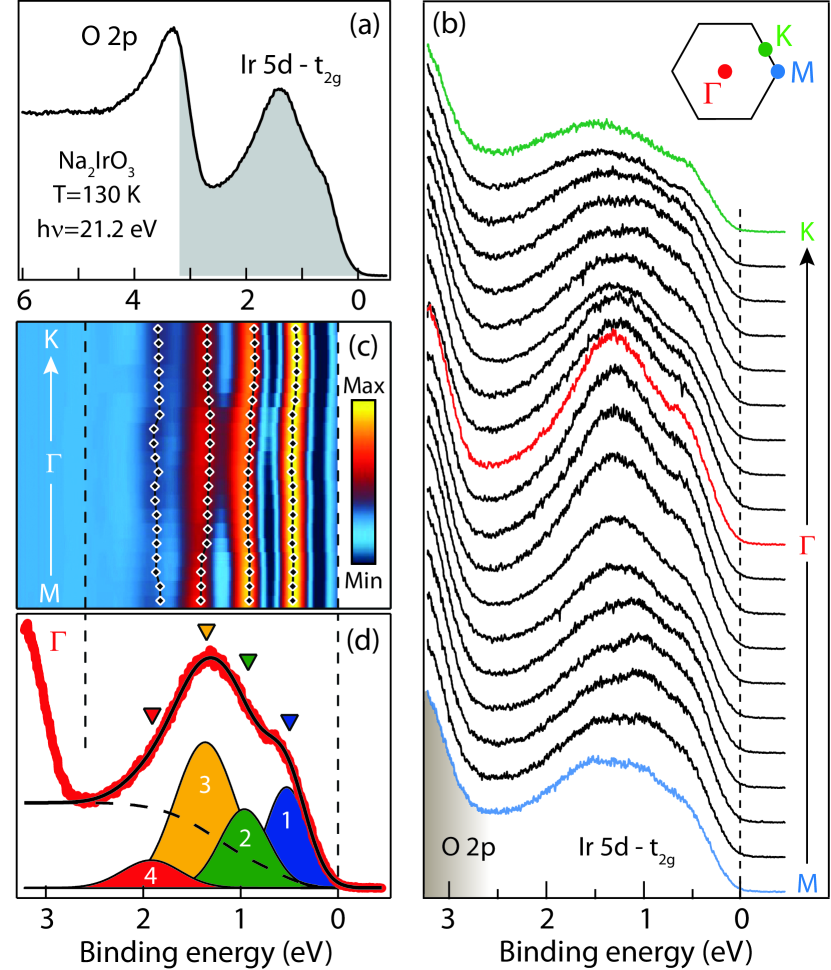
The 130 K angle-integrated PES spectrum met in Fig. 1(a) shows two broad spectral features belonging to the Ir 5- bands (0-3 eV binding energy), and to the O 2 manifold (beyond 3 eV). The insulating character is evidenced by the lack of spectral weight at the chemical potential, which appears to be pinned to the top of the valence band (no temperature dependence is observed in the 130-250 K range met ; sup ). Energy distribution curves (EDCs) measured by ARPES met along for the Ir 5- bands are shown in Fig. 1(b). The detected features are only weakly dispersing in energy, with the most obvious momentum-dependence being limited to their relative intensity. The electronic dispersion can be estimated from the negative second derivative map in Fig. 1(c), calculated as , and more quantitatively from the fit of EDCs as in Fig. 1(d) (see caption for details). The direct comparison of fit (black diamonds) and second derivative results in Fig. 1(c) yields a good overall agreement in the dispersion of the 4 features (small deviations stem from the peaks’ relative intensity variation, which is differently captured by the two methods). We find that the Ir 5- valence band (VB) dispersions do not exceed meV in bandwidth – at variance with the generally expected larger hopping amplitude for 5- states. Another remarkable aspect of the Ir bands is their linewidth, with values meV. A possible origin might be many-body electron correlation effects as discussed for NiO Kuneš et al. (2007), and strong electron-phonon coupling leading to polaronic behavior in the spectral function Shen et al. (2004).
The results in Fig. 1 already provide one very important clue: the gap is open well above K, which directly excludes a Slater-type, magnetic-order-driven nature for the insulating state. As for the size of the gap, this cannot be readily identified by ARPES since photoemission can locate the valence band, as the first electron-removal state, but not the conduction band which belongs to the electron-addition part of the spectral function Damascelli (2004). Alternatively, one can measure the gap in an optical experiment; however, one needs to discriminate between in-gap states of bosonic character (e.g., phonons, magnons, excitons) and those particle-hole excitations which instead determine the real charge gap. This complication can often hinder the precise identification of the gap edge Basov et al. (2011). Such complexity underlies the past controversy on NiO: while the 0.3 eV gap obtained by DFT (Terakura et al., 1984) was deemed consistent with optical experiments (Newman and Chrenko, 1959), the combination of direct and inverse PES revealed the actual gap value to be 4.3 eV (Sawatzky and Allen, 1984). This is well beyond the DFT estimate and establishes NiO as a correlated insulator.
Here, for the most conclusive determination of the insulating gap magnitude, we use angle-integrated PES with in-situ doping by potassium deposition, as well as optics. A quantitative agreement between the two probes would provide validation against possible artefacts art .
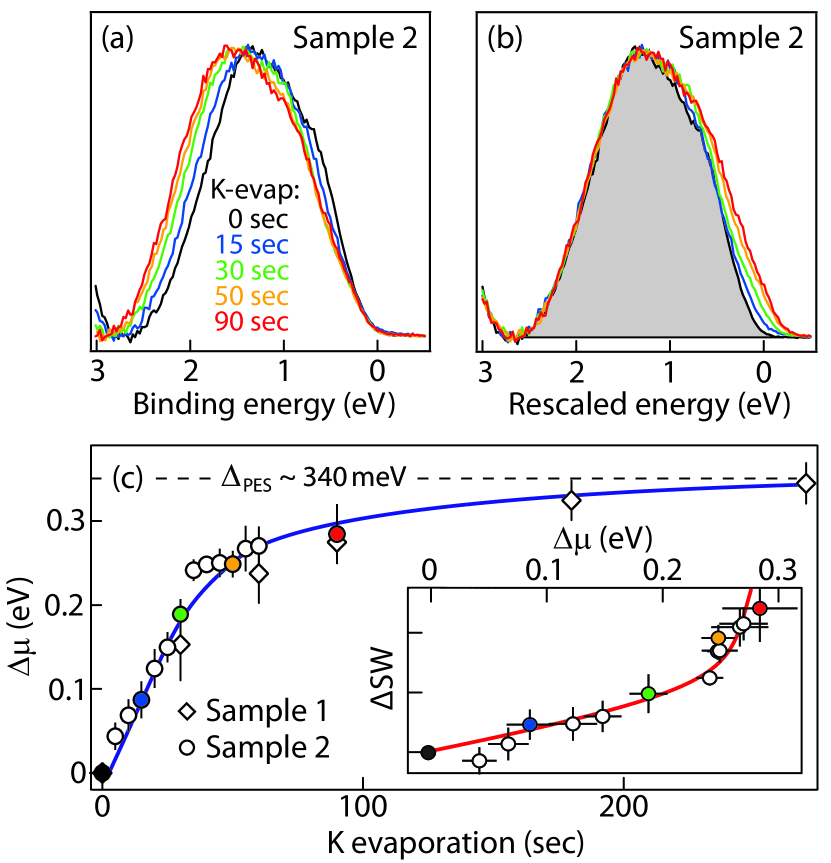
To estimate the energy of the first electron-addition states and the DOS gap between valence and conduction bands, we start by doping carriers (i.e., electrons) across the gap by in situ potassium deposition on the cleaved surfaces, and then follow the shift in chemical potential by angle-integrated PES. The results are summarized in Fig. 2 for K-evaporation performed at 130 K on two different freshly cleaved surfaces sup . The most evident effect is the shift towards higher binding energy of both Ir and O valence bands, as shown in Fig. 2(a) for the Ir 5- manifold sup .
This arises from the (equal and opposite) shift of the chemical potential when electrons donated by potassium are doped into the system; after an initial rapid increase, saturates at meV [Fig. 2(c)]. When the K-deposited spectra are shifted in energy by the corresponding so that their high binding-energy trailing edges match the one of the fresh surface [Fig. 2(b)], one can observe the emergence of additional spectral weight () in the region close to and above . This low-energy K-induced spectral weight, , can be computed as:
| (1) |
where is the PES intensity, represents the K-induced surface doping, and is the Fermi energy of the K-doped surface, which moves progressively beyond the undoped-surface . The evolution of plotted versus in the inset of Fig. 2(c) evidences an approximately linear SW increase up to meV, followed by a steeper rise once the saturation value meV is being approached. This behavior can be understood as due to the initial filling in of in-gap defect states – either pre-existing or induced by K deposition – which makes the jump of the chemical potential not as sudden as for a clean insulating DOS. Only when electronic states belonging to the Ir 5- conduction band are reached one observes the saturation of and the more pronounced increase in . This combined evolution of chemical potential shift and spectral weight increase points to a DOS insulating gap meV.
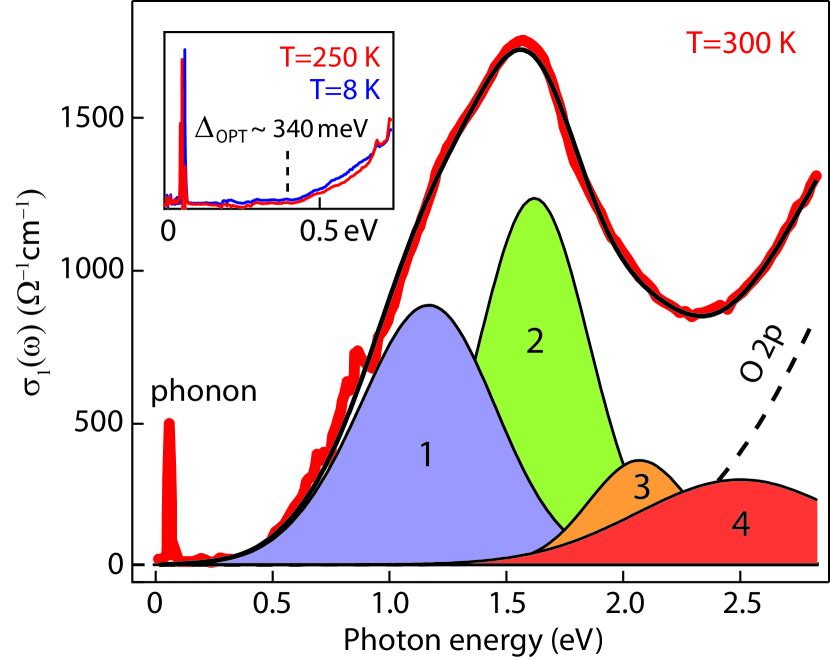
Turning now to the optical conductivity data met , in Fig. 3 we observe an insulating behavior with an absorption edge starting at 300-400 meV at 300 K, with negligible temperature dependence down to 8 K and thus also across K (see inset). We can fit the results using a joint DOS with Gaussian peaks for the conduction band (CB) and each of the 4 VBs (see caption of Fig. 1):
| (2) |
Here the prefactors represent the optical transition strengths, with the band index i running over the 4 VB features extracted from the ARPES data in Fig. 1, and are left free. provides an excellent fit to the optical data in Fig. 3, and a least-squares analysis returns meV for the location of the conduction band above , with a width meV (a value in agreement with DFT, as shown later). The consistency of the combined PES-optical conductivity analysis is confirmed by the optical gap obtained from the onset of the simulated conduction band, . Following Ref. Shen et al., 2004, the latter is estimated as , leading to meV. This matches from the K-induced saturation in PES, providing a definitive estimate for the insulating gap, meV.
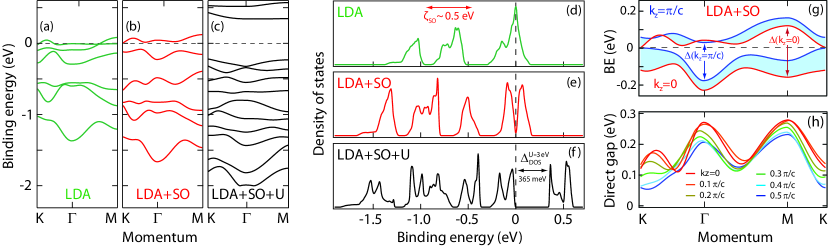
With a gap much smaller than in typical Mott insulators, discriminating between correlated and band-like insulating behavior in Na2IrO3 requires a detailed comparative DFT analysis (LDA, ). Unlike the case of Sr2IrO4, the degeneracy and bandwidth in Na2IrO3 are affected by structural distortions and the presence of Na in the Ir plane. This is revealed by calculations we have performed for a distortion- and Na-free hypothetical IrO2 parent compound: while in IrO2 the individual -dispersions are as wide as eV, the Na-induced band folding in Na2IrO3 opens large band gaps, leading to much narrower -subbands ( meV). Even though this accounts well for the narrow bandwidth observed in ARPES, the material is still metallic in LDA with a high DOS at the Fermi level [Fig. 4(a,d)], at variance with the experimental findings. Remarkably, when SO is switched on in LDA+SO a clear gap opens up at in the band dispersion [Fig. 4(b)], although not in the DOS where only a zero-gap can be observed [Fig. 4(e)]. A closer inspection of the LDA+SO dispersion for first occupied and unoccupied bands – versus both and in Fig. 4(g) – reveals that the lack of a DOS gap stems from the overlap of VB and CB at and points for different values. In other words, while the direct gap () is non-zero and ranges from a minimum of 54 meV to a maximum of 220 meV over the full Brillouin zone [Fig. 4(h)], the indirect DOS gap () is vanishing. This is still in contrast with the experimentally determined band-gap magnitude meV gap .
The disconnection between insulating behavior and onset of AF ordering, together with the quantitative disagreement between observed and calculated gap even in LDA+SO, reveal that Na2IrO3 cannot be regarded as either a Slater or a band insulator. Also, given the narrow bandwidths ( meV), one might expect the system to be even more unstable against local correlations than anticipated. Indeed, a good overall agreement with the data is found in LDA+SO+U, for eV and eV Ueff : this returns a gap value meV [Fig. 4(f)] close to the experimental , and a 2 eV energy range for the Ir 5d- manifold [Fig. 4(c)] matching the spectral weight distribution in Fig. 1 (note that a doubling of bands is seen in LDA+SO+U due to the imposed AF ordering, but is of no relevance here LDA ). At a first glance, eV might seem a large value for 5 orbitals; however, in the solid, the effective reduction of the atomic value of U strongly depends on the polarizability of the surrounding medium, which is the result of many factors, in primis the anion-cation bond length Meinders et al. (1995). In this perspective, the value we found is not unreasonable, and is also consistent with the existence of local moments above revealed by the Curie-Weiss magnetic susceptibility behavior with K Singh and Gegenwart (2010).
Our findings point to a Mott-like insulating state driven by the delicate interplay between , , and SO energy scales, in which co-participating structural distortions also play a crucial role. This establishes Na2IrO3, and possibly other members of the iridate family, as a novel type of correlated insulator in which Coulomb (many-body) and relativistic (spin-orbit) effects cannot be decoupled, but must be treated on an equal footing.
We acknowledge S. Bhattacharjee and G.A. Sawatzky for discussions, D. Wong and P. Dosanjh, for technical assistance. This work was supported by the Max Planck – UBC Centre for Quantum Materials, the Killam, Sloan, CRC, and NSERC’ s Steacie Fellowship Programs (A.D.), NSERC, CFI, and CIFAR Quantum Materials.
References
- Kim et al. (2008) B. J. Kim, H. Jin, S. J. Moon, J.-Y. Kim, B.-G. Park, C. S. Leem, J. Yu, T. W. Noh, C. Kim, S.-J. Oh, J.-H. Park, V. Durairaj, G. Cao, and E. Rotenberg, Phys. Rev. Lett. 101, 076402 (2008).
- Mott (1949) N. F. Mott, Proc. Phys. Soc. A 62, 416 (1949).
- Zaanen et al. (1985) J. Zaanen, G. A. Sawatzky, and J. W. Allen, Phys. Rev. Lett. 55, 418 (1985).
- Montalti et al. (2006) M. Montalti, A. Credi, L. Prodi, and M. T. Gandolfi, Handbook of photochemistry - third edition (CRC Press Taylor and Francis Group, 6000 Broken Sound Parkway NW, Suite 300 Boca Raton, FL 33487-2742, 2006).
- Haskel et al. (2012) D. Haskel, G. Fabbris, M. Zhernenkov, P. P. Kong, C. Jin, G. Cao, and M. van Veenendaal, Phys. Rev. Lett. 109, 027204 (2012).
- Arita et al. (2012) R. Arita, J. Kuneš, A. V. Kozhevnikov, A. G. Eguiluz, and M. Imada, Phys. Rev. Lett. 108, 086403 (2012).
- Hsieh et al. (2012) D. Hsieh, F. Mahmood, D. H. Torchinsky, G. Cao, and N. Gedik, Phys. Rev. B 86, 035128 (2012).
- Terakura et al. (1984) K. Terakura, A. R. Williams, T. Oguchi, and J. Kübler, Phys. Rev. Lett. 52, 1830 (1984).
- Fujimori et al. (1984) A. Fujimori, F. Minami, and S. Sugano, Phys. Rev. B 29, 5225 (1984).
- Fujimori and Minami (1984) A. Fujimori and F. Minami, Phys. Rev. B 30, 957 (1984).
- Sawatzky and Allen (1984) G. A. Sawatzky and J. W. Allen, Phys. Rev. Lett. 53, 2339 (1984).
- Tjernberg et al. (1996) O. Tjernberg, S. Söderholm, G. Chiaia, R. Girard, U. O. Karlsson, H. Nylén, and I. Lindau, Phys. Rev. B 54, 10245 (1996).
- Kuneš et al. (2007) J. Kuneš, V. I. Anisimov, S. L. Skornyakov, A. V. Lukoyanov, and D. Vollhardt, Phys. Rev. Lett. 99, 156404 (2007).
- Shen et al. (1990) Z.-X. Shen, C. K. Shih, O. Jepsen, W. E. Spicer, I. Lindau, and J. W. Allen, Phys. Rev. Lett. 64, 2442 (1990).
- Singh and Gegenwart (2010) Y. Singh and P. Gegenwart, Phys. Rev. B 82, 064412 (2010).
- Shitade et al. (2009) A. Shitade, H. Katsura, J. Kuneš, X.-L. Qi, S.-C. Zhang, and N. Nagaosa, Phys. Rev. Lett. 102, 256403 (2009).
- Jin et al. (2009) H. Jin, H. Kim, H. Jeong, C. H. Kim, and J. Yu, arXiv:0907.0743v1 (2009).
- Bhattacharjee et al. (2012) S. Bhattacharjee, S.-S. Lee, and Y. B. Kim, New J. Phys. 14, 073015 (2012).
- Ye et al. (2012) F. Ye, S. Chi, H. Cao, B. C. Chakoumakos, J. A. Fernandez-Baca, R. Custelcean, T. F. Qi, O. B. Korneta, and G. Cao, Phys. Rev. B 85, 180403 (2012).
- Damascelli (2004) A. Damascelli, Physica Scripta T109, 61 (2004).
- (21) ARPES measurements were performed at UBC with 21.2 eV linearly polarized photons (He-I line from a SPECS UVS300 monochromatized lamp) and a SPECS Phoibos 150 hemispherical analyzer. Energy and angular resolutions were set to 30 meV and 0.2∘. Na2IrO3 single crystals were grown by a self flux method Singh and Gegenwart (2010) and pre-oriented by Laue diffraction; then cleaved in situ at a base pressure of mbar, exposing the (001) surface (parallel to the Ir layers). During all measurements the temperature was kept at 130 K to guarantee stable conditions for as-cleaved and K-deposited surfaces (lower temperatures were prevented by the onset of charging sup ) .
- (22) For more details, see also supplemental material .
- Shen et al. (2004) K. M. Shen, F. Ronning, D. H. Lu, W. S. Lee, N. J. C. Ingle, W. Meevasana, F. Baumberger, A. Damascelli, N. P. Armitage, L. L. Miller, Y. Kohsaka, M. Azuma, M. Takano, H. Takagi, and Z.-X. Shen, Phys. Rev. Lett. 93, 267002 (2004).
- Basov et al. (2011) D. N. Basov, R. D. Averitt, D. van der Marel, M. Dressel, and K. Haule, Rev. Mod. Phys. 83, 471 (2011).
- Newman and Chrenko (1959) R. Newman and R. M. Chrenko, Phys. Rev. 114, 1507 (1959).
- (26) Stemming from excitonic contamination in optics and/or surface sensitivity in PES, including effects specific to the substrate-adsorbate system in PES with in-situ doping .
- (27) The complex optical conductivity was obtained in the 8-300 K temperature range using combined reflectivity and ellipsometry measurements on the (001) surface of a freshly-cleaved crystalline platelet .
- (28) We have performed band-structure calculations using the linearized augmented plane wave method in WIEN2K Blaha et al. (2001), and the most recently refined monoclinic crystal structure with 2 formula units per unit cell Choi et al. (2012). Exchange and correlation effects were treated within the generalized gradient approximation Perdew et al. (1996); SO coupling was included as a second variational step using eigenfunctions from scalar relativistic calculation MacDonald et al. (1980). The LDA+U method was applied to the Ir 5 states by varying from 1 to 5 eV Anisimov et al. (1993) with eV (van der Marel and Sawatzky, 1988), and adopting the zigzag antiferromagnetic spin arrangement with moments along the a axis (zigzag-a) Liu et al. (2011) .
- (29) PES with K-doping provides a measure of the indirect DOS gap, while optics probes the direct optical gap averaged over the whole 3-dimensional Brillouin zone .
- (30) This choice corresponds to eV, consistent with the value eV used in Ref. Jin et al., 2009 .
- Meinders et al. (1995) M. B. J. Meinders, J. van den Brink, J. Lorenzana, and G. A. Sawatzky, Phys. Rev. B 52, 2484 (1995).
- Blaha et al. (2001) P. Blaha, K. Schwarz, G. Madsen, D. Kvasnicka, and J. Luitz, in An augmented plane wave plus local orbitals program for calculating crystal properties, edited by K. Schwarz (Tech. University of Wien, Vienna, 2001).
- Choi et al. (2012) S. K. Choi, R. Coldea, A. N. Kolmogorov, T. Lancaster, I. I. Mazin, S. J. Blundell, P. G. Radaelli, Y. Singh, P. Gegenwart, K. R. Choi, S.-W. Cheong, P. J. Baker, C. Stock, and J. Taylor, Phys. Rev. Lett. 108, 127204 (2012).
- Perdew et al. (1996) J. P. Perdew, K. Burke, and M. Ernzerhof, Phys. Rev. Lett. 77, 3865 (1996).
- MacDonald et al. (1980) A. H. MacDonald, W. E. Picket, and D. D. Koelling, J. Phys. C Solid State Phys. 13, 2675 (1980).
- Anisimov et al. (1993) V. I. Anisimov, I. V. Solovyev, M. A. Korotin, M. T. Czyżyk, and G. A. Sawatzky, Phys. Rev. B 48, 16929 (1993).
- van der Marel and Sawatzky (1988) D. van der Marel and G. A. Sawatzky, Phys. Rev. B 37, 10674 (1988).
- Liu et al. (2011) X. Liu, T. Berlijn, W.-G. Yin, W. Ku, A. Tsvelik, Y.-J. Kim, H. Gretarsson, Y. Singh, P. Gegenwart, and J. P. Hill, Phys. Rev. B 83, 220403 (2011).