Investigating the reflection contribution to the X-ray emission of Ton S180
Abstract
There is now growing evidence that the soft X-ray excess is almost ubiquitous among unobscured active galaxies. In spite of the various interpretations that have been considered in the last years, the nature of this foremost spectral feature is not firmly established yet. In this context, we review from a reflection perspective the three highest-quality X-ray observations of the narrow-line Seyfert 1 galaxy Tonantzintla S180, obtained by XMM-Newton and Suzaku. The X-ray spectrum of Ton S180 shows only moderate variations over a time span of several years, suggesting that the same physical process accounts for the bulk of the broad-band X-ray emission at the different epochs, and that the properties of the X-ray source are fairly stable. We have successfully applied in our spectral analysis a dual-reflector model, consisting of two separate components: one arises from the surface of the accretion disc, is highly ionized and blurred by relativistic effects; the other is cold, quite faint, and can be associated with a distant reprocessor. Due to the strength and the nearly power-law shape of its soft excess emission, Ton S180 is one of the most challenging sources to test the X-ray reflection scenario. In this work we provide a clear illustration of the great potential and spectral flexibility of blurred reflection models, while discussing some of their current limitations and possible shortcomings.
keywords:
galaxies: active – galaxies: individual: Ton S180 – X-rays: galaxies.1 Introduction
It is now widely accepted that the central engine of active galactic nuclei (AGN) consists of an accreting supermassive
black hole (Lynden-Bell 1969; Rees 1984). In this framework, the primary X-ray emission of AGN is produced through
the Comptonization of disc photons in a corona of relativistic electrons (Haardt & Maraschi 1993), and can be usually
described by means of a simple power law. With the increasing quality of the available X-ray spectra, the presence
of other components has been progressively revealed. For instance, in sources not affected by intrinsic absorption,
the soft X-ray emission is not invariably accounted for by just extrapolating the main power-law trend to lower energies.
The additional component observed below 2 keV is known as soft excess (after Arnaud et al. 1985), and characterizes
a significant fraction (possibly major; Scott et al. 2011) of X-ray unobscured AGN. The physical origin of this feature has
to be linked to the properties of the accretion flow, but still represents a controversial issue in spite of the various models
proposed in the recent years.
In terms of spectral shape, the smoothness of the soft excess is consistent with several interpretations. Direct thermal
emission from a standard geometrically thin, optically thick accretion disc (Shakura & Sunyaev 1973) is usually ruled
out through a basic temperature argument, as most AGN discs should be too cool to contribute to the X-rays; yet, given
that , it might become important for high accretion rates () and relatively low black
hole masses (). This is the case for narrow-line Seyfert 1 galaxies (NLS1s; Osterbrock & Pogge 1985), i.e. the
sources within the type 1 population that show the lower full width at half-maximum in their optical permitted lines (FWHM
H km s-1). As the line width distribution is continuous, the exact boundary is somewhat arbitrary;
none the less, NLS1s represent a well-defined subclass with respect to their broad-line counterparts (BLS1s) due to
many distinctive features (e.g. Grupe et al. 2004). In particular, the steep X-ray continuum and the prominent soft excess
reveal a close similarity with the high/soft spectral states of black-hole binaries (Remillard & McClintock 2006), and
further support the speculation of nearly Eddington accretion rates in NLS1s (Pounds, Done & Osborne 1995). On
the other hand, the usual detection of a soft excess also in BLS1s (e.g. Porquet et al. 2004) implies that the underlying
phenomenon is really widespread.
An increase of the disc effective temperature, following the Comptonization of the seed photons in a cold
( keV), optically thick plasma, may give rise to the observed excess (e.g. Done et al. 2012). This up-scattering
is associated with the disc photosphere itself; a tail of high-energy, non-thermal particles (Coppi 1999) can account for
the hard power-law component as well. However, the temperature of the putative soft corona turns out to be
virtually constant over several orders of magnitude in black hole mass (Gierliński & Done 2004). The same problem
affects the blackbody component in the purely thermal scenario (Crummy et al. 2006). Such a universal energy hints at
some kind of atomic process. Reflection off the surface of the accretion disc is one of the viable explanations (Fabian et
al. 2002). In this picture, the primary X-rays go through substantial reprocessing in the photoionized upper layers of the
disc, and emerge as a smooth continuum due to relativistic blurring in the strong gravity regime. Alternatively, it was
suggested that the soft excess is a fake emission feature, mimicked by a broad absorption trough at 2–5
keV ascribed to partially ionized gas along the line of sight (e.g. Middleton, Done & Gierliński 2007). The detailed
simulations of line-driven accretion disc winds are not fully consistent with the observational evidence, though (Schurch,
Done & Proga 2009).
This notwithstanding, warm absorption is very common among type 1 objects, and can hinder the characterization of
the soft excess. Therefore, the ideal targets to investigate the nature of this component are the brightest Seyferts with
negligible intrinsic obscuration across their entire spectrum. In this respect, the NLS1 galaxy Tonantzintla S180
(, FWHM H km s-1) is one of the most suitable sources. Owing to a very
low Galactic column density ( cm-2; Kalberla et al. 2005), Ton S180
was the brightest AGN detected by the EUVE satellite (Wisotzki et al. 1995; Vennes et al. 1995). This flux
measurement, together with the steep soft X-ray spectra obtained with ROSAT pointed observations (Fink et
al. 1997), implied a huge emission peak in the extreme ultraviolet (UV) regime. Based on an extensive multiwavelength
campaign, Turner et al. (2002) derived the broad-band spectral energy distribution of Ton S180, and confirmed that the
bulk of its energy output is released in the 10–100 eV range. If present, any X-ray warm absorber is either very
weak or highly ionized (Turner et. al 2001; Różańska et al. 2004), and is not expected to modify significantly
the shape of the soft excess.
Consequently, Ton S180 belongs to the limited sample of sources for which it is possible to probe the physical conditions
in the very inner regions, through a comprehensive study of the intrinsic X-ray emission. Disc reflection has been shown
to represent a basic ingredient in many of them, e.g. Mrk 335 (Larsson et al. 2008), Mrk 478 (Zoghbi, Fabian & Gallo
2008), Fairall 9 (Schmoll et al. 2009; Emmanoulopoulos et al. 2011), Ark 120 (Nardini et al. 2011). Indeed, the application
of a self-consistent, dual-reflector model over the whole 0.5–40 keV energy range proved to be highly effective in our
recent analysis of the prototypical bare BLS1 galaxy Ark 120. Due to its striking properties and its NLS1 nature,
hence Ton S180 is a perfect target to further test a similar scenario. With this aim, here we review its three highest-quality
X-ray spectra taken by XMM-Newton and Suzaku between 2000 and 2006. This paper is arranged as
follows. In the next Section we summarize the observation log and data reduction. The spectral analysis is presented
in Section 3, while Section 4 concerns the discussion of our results and their main implications. Conclusions and final
remarks are drawn in Section 5.
2 Observations and data reduction
Ton S180 was targeted by XMM-Newton twice, on 2000 December 14 and 2002 June 30. No significant
background flaring occurred during the two observations, resulting in a good integration time for the EPIC pn camera
(operated in the small-window mode) of 20.6 and 12.6 ks, respectively. A deeper monitoring by Suzaku took
place on 2006 December 9–12, with the source at the X-ray imaging spectrometer (XIS) nominal position; the net
exposure was 120 ks for the XIS and 102 ks for the hard X-ray detector (HXD/PIN). The reduction of event
files and the generation of response matrices were carried out following the standard procedures, by using the latest
versions of the sas and heasoft packages for the XMM-Newton and Suzaku data
sets. The source spectra were extracted from circular regions centred on the target, with radii of 35 arcsec for
XMM-Newton images and 4 arcmin for Suzaku, while the background was evaluated over adjacent
regions free of significant contamination. The source and background spectra from the two front-illuminated (FI) XIS
detectors (XIS0 and XIS3) were eventually merged together.
Ton S180 was marginally detected also by the HXD/PIN above 10 keV. The source count rate actually amounts
to less than 5 per cent of the total collected events at 15–40 keV. This implies that the reproducibility of the
instrumental non X-ray background (NXB), due to charged particles and simulated by the HXD science team with
a nominal uncertainty of 3 per cent, may have a substantial impact on the scaling factor between the PIN
and XIS spectra, and consequently on the spectral modelling. We have tested the NXB accuracy by extracting the
PIN spectrum during the Earth occultation of the source. We will discuss the selection of the most appropriate NXB
file and the implications of this choice in the following (Section 4.3).
The results presented in this work concern the 0.5–10 keV energy range of the EPIC pn and XIS FI spectra (from
which the 1.75–1.95 keV interval was excluded due to calibration uncertainties), while only the 18–30 keV band has
been conservatively taken into account for the marginal HXD/PIN detection. The MOS2 and the back-illuminated (BI)
XIS1 spectra have been checked throughout for consistency.111In both XMM-Newton observations the
MOS1 detector was operated in timing mode, and it is not included in our study. The xspec v12.7 fitting
package has been employed in the spectral analysis. In order to allow the use of minimization, and
considering that the X-ray steepness of Ton S180 leads to non negligible noise at the higher energies, we have
re-binned the background-subtracted spectra to a 5 significance in each energy channel. A minimum of
50 counts per bin was instead adopted for the PIN data. All the uncertainties quoted below correspond to the 90
per cent confidence range () for the single parameter of interest; fluxes and related quantities
(reflection strengths, equivalent widths) are given at the 1 level.
3 Spectral analysis
With the exception of the shorter XMM-Newton exposure, the X-ray observations of Ton S180 under review
have already been analysed in great detail in previous dedicated works (Vaughan et al. 2002; Takahashi et al. 2010).
These studies explored a wide range of different models to understand the nature of the broad-band X-ray emission of
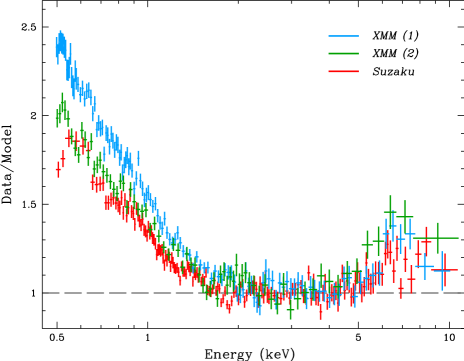
Ton S180, and specifically of its soft excess. The strength and shape of this feature is visually indicated by the
data/model ratio plotted in Fig. 1, obtained by fitting a power law over the 2–5 keV spectral range. The outcome
is clearly model-dependent, but the low-energy upturn as well as complex iron signatures are evident. With no loss of
accuracy, we have chosen a common hard photon index to assess the magnitude of the soft excess; its luminosity of
2.5– erg s-1 represents at least 20–25 per cent of the observed 0.5–10 keV
emission. To achieve a straightforward, quantitative comparison among the three spectra of Ton S180 and their general
properties, we have first adopted a phenomenological model consisting of a broken power law modified by neutral
absorption, whose column density has been frozen to the Galactic value throughout this work (tbabs cross
sections and solar abundances from Wilms, Allen & McCray 2000 were assumed). The results are summarized in
Table 1, and show that this baseline model provides an acceptable description of the data. Both the hard X-ray
slope and the energy of the break are very similar in the three cases, and formally consistent within the error bars.
A larger difference is found for the soft photon index, which follows the changes in the strength of the soft excess.
In spite of a cumulative , clear structures in the residuals remain all across the spectra, and
mainly in the region of iron K-shell emission and below 1.5 keV.
| Obs. | XMM (1) | XMM (2) | Suzaku |
|---|---|---|---|
| 723/665 | 512/514 | 1113/1032 |
Switching to a physical perspective, any of the thermal, Comptonization and reflection interpretations are plausible
in principle for a source like Ton S180, where absorption effects are not significant and the accretion rate is fairly
large.222No measure of the black hole mass through reverberation mapping has been performed for Ton S180.
Depending on the exact value, estimated in the order of 10 (Turner et al. 2002; Satyapal et
al. 2005) the central source radiates very close to the Eddington limit, and possibly above. On the other hand, by
proving that the soft excess can be fairly reproduced by nearly featureless continuum with constant slope, the
broken power-law exercise above has two clear implications: (a) no blackbody component with standard
temperature333Incidentally, the best fit of the soft excess by means of a single blackbody with
–0.13 keV yields a value of . would give a satisfactory description
of the 0.5–2 keV spectral shape; (b) any detailed Comptonization model would likely display the same
residuals as its phenomenological counterpart, despite the useful constraints on the physical properties of the
scattering gas. In their analysis of the first XMM-Newton observation, Vaughan et al. (2002) included
three blackbody components besides the power law to obtain a reasonable fit. However, the corresponding
temperatures and luminosities dictate a linear size of the emitting region (much) lower than the innermost stable
orbit for a Schwarzschild black hole of 10. In addition, the rapid changes of flux amplitude in the
soft band are not compatible with any viscous process inside the disc. The same authors also explored the
Comptonization paradigm in some depth, and it is worth reporting their findings. Any purely thermal interpretation
requires two detached zones of different plasma temperature and optical depth to explain both the soft excess
and the power-law continuum; this is difficult to reconcile with the observed variability pattern, which is almost
independent of energy on short time-scales (see also Edelson et al. 2002). Allowing instead for a single Comptonizing
region with mixed thermal/non-thermal electron distribution delivers excellent results, yet the complexity of the model is
largely increased; no firm constraints on the nature and physical properties of this hybrid X-ray corona can be
derived, due to the lack of high-energy coverage.
Disc reflection is known to be present in Ton S180. A broad, possibly asymmetric iron K-shell emission line has been
detected in this source since its early observations with BeppoSAX (Comastri et al. 1998) and ASCA
(Turner, George & Nandra al. 1998). Both the skewed profile and the peak energy at 7 keV indicate an origin
from highly ionized material close to the central source. The recent analysis of Suzaku data suggests that the
reflection contribution to the X-ray spectrum of Ton S180 is presumably larger than previously thought (Takahashi et
al. 2010). While reflection naturally accounts for the faint iron feature in the 6–7 keV range, an additional component
was introduced in the latter study to fully model the observed emission down to 0.3 keV. In the wake of all this
evidence, our aim is to test whether the soft excess can be interpreted as a signature of hard X-ray reprocessing as
well. Indeed, iron fluorescence at 6.4–7 keV is just one component of the reflected spectrum. Emission lines
from lighter elements are expected at lower energies, depending on the ionization state of the gas irradiated by the
primary X-rays. Also, the interplay between photoelectric absorption and Compton scattering within the reflector gives
rise to a flat, inverted continuum, which may dominate at 20–40 keV in the shape of a characteristic hump
(e.g. George & Fabian 1991, and references therein). All these features require a self-consistent treatment, and were
included in our spectral analysis through the reflionx grid models computed by Ross & Fabian (2005). As in
Ark 120, we consider two different reflection components,444In the following, the reflection strength refers to
the observed contribution to the total 0.5–10 keV emission, while the reflection fraction is computed as the intrinsic
ratio to the power-law luminosity over the 0.1–100 keV range. one of which is associated with the accretion disc, while
the other is attributed to more distant matter. The former has been convolved with the kdblur kernel to account for
gravitational effects close to the central black hole (according to a laor profile; Laor 1991). The amount of relativistic
blurring is regulated by some key physical and geometrical properties of the disc: inner radius, inclination with respect
to the line of sight, radial emissivity profile (), ionization parameter (proportional to the ratio
between incident flux and gas density, ). The shape of the illuminating spectrum has been
assumed to mirror the direct power-law continuum, and iron abundance is the same for both reflectors.
Our previous applications of blurred reflection models to other sources revealed the existence of considerable
degeneracies among the critical disc parameters listed above. This holds for even relatively high-quality spectra,
like in the case of Ark 120. In comparison, by compiling all the available XMM-Newton and Suzaku
observations, the total number of counts collected from Ton S180 is lower by roughly an order of magnitude. As a
consequence, we expect the degeneracy issue to affect the present analysis as well, unless a model with the least
number of variables is assumed. A recurrent argument of concern with a reflection origin of the soft excess is the high
degree of blurring required to reproduce the remarkable smoothness of this spectral component. This may deliver a set
of extreme parameters for the accretion disc (see the discussion below). In particular, a large inclination enhances the
Doppler shifts along the line of sight, resulting in broader line shapes. This is actually a questionable point, as almost
edge-on configurations are not fully conceivable for bare Seyfert galaxies, showing negligible intrinsic absorption all over
the spectral bands. A misalignment between the plane of the disc and the large-scale absorber is possible, but in such
a case the accretion flow itself could represent a significant source of obscuration (Lawrence & Elvis 2010). In the light
of these considerations, in our final model we keep the disc inclination fixed to . Any assumption on the
values of the other key quantities is not well justified in advance. In order to restrict the parameter space further and
control the degeneracy problem, iron abundances in the three spectra are obviously tied together, as well as disc
emissivity indices and inner radii. The outer border is located at 400 gravitational radii (), the
maximum distance within kdblur, while the ionization state of the far-off reflector is frozen to
erg cm s-1. Despite these demanding constraints,555We note that probability of viewing the disc with an
inclination of or less is 30 per cent, as . we obtained an excellent fit to each
data set, with a joint (see Table 2). Even if the conditions on
and are relaxed, the individual values remain fully consistent; the improvement is absolutely negligible, and does
not compensate for the loss of degrees of freedom. In the following Section we analyse these results in the context of
the X-ray emission of Ton S180, and discuss their implications on the nature of the soft excess in active galaxies.
| Obs. | XMM (1) | XMM (2) | Suzaku |
|---|---|---|---|
| (c) | (c) | (c) | |
| (c) | (c) | (c) | |
| (f) | (f) | (f) | |
| (c) | (c) | (c) | |
| (f) | (f) | (f) | |
4 Discussion
It is usually very difficult to discriminate among different physical models of the soft excess on sheer statistical
grounds, based on spectral analysis only. At the same time, any interpretation can be subject to dispute and
eventually discarded because of some physical limitation. It is therefore important to check the reliability of a model
in several independent ways, including its consistency with the time variability properties. Also, any fine tuning of
the key spectral parameters (e.g. the constant disc temperature in the purely thermal scenario) should be empirically
ruled out. Our interest in Ton S180 is mainly driven by the fact that this NLS1 galaxy is one of the most challenging
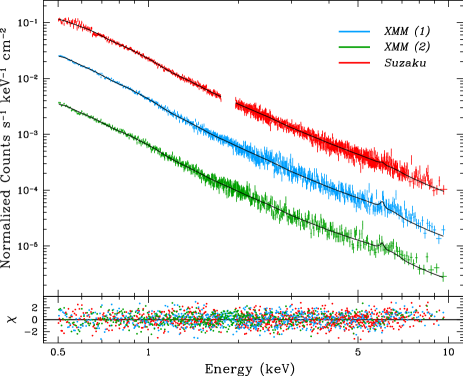
sources to test the blurred reflection hypothesis. The three 0.5–10 keV spectra are shown in Fig. 2 with their
best-fitting models. We have selected a lower limit of 0.5 keV in our analysis to avoid possible uncertainties in the
calibration of the detectors near the bottom edge of their operational range. Irrespectively of the model adopted, in
fact, the structures in the residuals become quite different below 0.7 keV, for both the XMM-Newton
MOS2/pn spectra and the Suzaku BI/FI ones. This is clearly a sensitive point, as the presence of any
calibration systematics forces the reflection components to reproduce spurious features in the soft excess. In any
case, we have checked for completeness the spectral trend down to 0.3 keV. The extrapolation of our best-fitting
model fails to account for the entire observed emission, since the excess further extends at low energies with some
hints of flattening but no apparent turnover. An adjustment of the current parameters or a larger reflection complexity
can be invoked, but a low-temperature thermal contribution is also likely. A blackbody with eV was
needed in some of the soft X-ray spectral states during the ROSAT campaign, and could represent the tail
of the extreme UV emission, as the doubling time of amplitude variations is very similar in the two bands (Fink et al.
1997; Hwang & Bowyer 1997). For the sake of discussion, in the following we consider our model as a genuine
upper limit to X-ray reflection in Ton S180.
In general, the broad-band values of the blurring parameters are quite unusual if compared with the application of
the same relativistic smearing to broad iron lines alone. In the latter case, both the disc inner radius and the emissivity
index are indicative of a mild gravitational regime, with no requirement of or (e.g.
Nandra et al. 2007). With respect to these standards, blurred reflection models do indeed deliver extreme
parameters (Walton, Reis & Fabian 2010). This is a major matter of debate, since inner radii significantly smaller
than the innermost stable orbit in a Schwarzschild metric hint at nearly maximally rotating black holes. We also note
that is the classical limit at large distance for a point-like, on-axis illuminating source; a flatter response is then
expected for either a great lamppost height () or an extended/patchy corona (possibly as a result of several
hotspots or magnetic flares). On the contrary, steep emissivity profiles imply that most of the energy is released in the
very inner regions, within a few gravitational radii from the central engine. In addition, the reflection fraction ()
can be high, and occasionally the direct power-law continuum is completely suppressed (Fabian et al. 2012). Most of
these puzzling aspects are actually self-consistent, and have a reasonable physical explanation in the context of
strong light bending (Miniutti & Fabian 2004; Wilkins & Fabian 2011). In fact, the illuminating radiation can be diverted
towards the inner disc below more or less effectively, depending on the vertical height of the primary source. Any
correlation among these quantities (, , ) would represent a substantial confirmation of
this light bending/blurred reflection scenario. The extensive variability studies conducted on Ton S180 suggest that
the bulk of X-ray emission occurs within the inner 20–30 (Romano et al. 2002; Edelson et al. 2002),
and strongly support the picture of a very compact source.
It is important, however, to keep in mind that the computation of the reflection grids is based itself on several
assumptions, which necessarily oversimplify the physical and geometrical properties of the accretion flow (see
Ross & Fabian 2005 for details). A plane-parallel slab with constant density cm-3
is a good approximation for the outer surface of an accretion disc, yet different values of and
inhomogeneities are possible in sources accreting at nearly Eddington rates like Ton S180. The same properties
are less adequate for the cold, distant reflector, which has a minor but non negligible contribution, especially at the
lower energies (where it may account for small departures from a perfectly smooth shape). In this case, a clumpy
structure with lower density and optical depth would be definitely more reasonable. A further limitation that mainly
affects the soft band is the lack of leverage on atomic abundances, which are frozen to solar values for all the
elements other than iron. The overall shape of the reflection spectrum also depends on crucial ingredients that
remain basically unknown, such as the role of magnetic fields, the geometry of the illuminating source, the exact
nature of the interactions between the disc and the corona.
In this regard, once the goodness of the working approximations has been established, the spectral analysis can
provide valuable information to understand the mechanisms of energy production and the properties of the X-ray
emitting region. We have therefore explored more complex configurations, introducing in turn a broken power-law
emissivity profile for the disc, a radial dependence then local inhomogeneities of its ionization state, gradients of
iron abundance, but we did not obtain any stringent constraint. Finally, we have also attempted at thawing the
disc inclination. The resulting value is rather large, consistent with an edge-on geometry, while the overall statistical
improvement is formally significant but still limited. This is an obvious effect of the complex degeneracy among the
parameters, as the other key quantities change in an unpredictable manner. Specifically, the disc inner radius drops
to the innermost stable circular orbit of a Kerr black hole, and the emissivity profile is now quite flat (),
more suitable for an extended corona. Iron abundance becomes mildly subsolar (), in contrast
with both the typical values found among NLS1 galaxies and the intense Fe ii optical emission of Ton S180
itself (Comastri et al. 1998). Hence, a model with no geometrical constraint delivers a full set of unusual parameters,
and can be ultimately rejected on physical grounds. If the large inclination is real, instead, a possible explanation
involves the dragging of inertial frames, for which the reflected photons tend to escape preferentially along the plane
of the disc. In this view, all the other properties being equal, nearly edge-on sources should have a more prominent
soft excess. It is worth noting that the discrepancy is not related with the statistical goodness around the energy of
the broad iron line (see below). The model with free actually provides an inferior fit to the data up to 7.8
keV in the rest frame. A marginally better match is recovered only beyond, where the spectra are somewhat flatter,
but the noise is fairly large and the background contamination is likely significant.
Summarizing, the moderate spectral variations suggest that a single (or at least dominant) physical process is at
work in the centre of Ton S180; our basic dual-reflector model gives an effective description of its X-ray emission over
different epochs, without requiring any extreme condition in spite of the underlying assumptions and limitations.
The spectral evolution follows the changes of the primary photon index () and those of
the disc ionization, whose extent (30–40 per cent) is in perfect agreement with the range of fluctuations observed
for the average 0.5–10 keV flux. This kind of feedback may also account for the secular trend revealed in the softness
ratios (Romano et al. 2002). Below we focus on the most critical points of our analysis, which illustrate some possible
shortcomings of the blurred reflection picture.
4.1 Black hole spin and broad iron feature
By assuming that the disc extends down to the innermost stable circular orbit and that no emission comes from the
plunging region (e.g. Reynolds & Fabian 2008), an inner border of 2.4 is not consistent with a
Schwarzschild (non-rotating) black hole. This should not be surprising, even if there are still large uncertainties on the
theoretical spin distribution based on the models of formation and evolution of supermassive black holes through
mergers and/or accretion episodes (Berti & Volonteri 2008; King, Pringle & Hofmann 2008). Moreover, a putative
disc truncation farther away from the centre is only associated with very low Eddington rates, while evaporation is
ruled out by the small disc temperature. In order to assess the black hole spin directly, we switched to kerrconv
(Brenneman & Reynolds 2006), an alternative relativistic kernel that allows the dimensionless spin parameter
to vary ( and are the black hole angular momentum and mass). According to this choice,
we obtained that , but a maximally rotating black hole cannot be rejected at the 99
per cent confidence level (). This must be taken just as a coarse estimate: even without considering
any interpretation bias (Walton et al. 2012), the systematic errors on the present measurements of black hole spin,
related to the modelling of the accretion and reflection physics, are thought to exceed by far the statistical ones. Our
assumptions (e.g. ) and any residual degeneracy of the parameters represent a supplementary source
of uncertainty. It is therefore worth examining the response of our model to variations of the inner radius. We have
frozen , while dropping the previous constraint on the disc inclination. This test results in
a fully acceptable fit (), and the corresponding set of key variables is now ,
, –2.8 and . The steep emissivity is physically
inconsistent with the imposed truncation, but this is a further caveat against the face values reported in Table 2,
since the parameter space has many equivalent local minima and the strict application of the criterion can
be misleading.
| Obs. | XMM (1) | XMM (2) | Suzaku |
|---|---|---|---|
| (c) | (c) | (c) | |
| EWL | |||
Closely related to the measure of the black hole spin is the presence of a broad iron emission feature, which has
been regularly detected in all the X-ray observations of Ton S180. Within a pure reflection frame, both the soft
excess and the broad component in the iron K line profile arise from the innermost regions of the accretion
disc. In a broad-band spectral analysis, the best-fitting blurring and ionization parameters are mainly driven by the
much larger statistical weight of the soft excess. A general agreement is expected when the iron feature is fitted
separately, though. As mentioned above, this is not always the case, and could represent one of the most serious
issues with the reflection scenario. Some residual structure in the 6–7 keV region is apparent in Ton S180 as
well, especially in the two XMM-Newton observations (Fig. 2). We then focused on the 3–8 keV spectral
range, and applied a simple model consisting of a power law plus a laor profile. This allows us to put tighter,
independent constraints on the significance of the broad iron line, even if some of its properties have to be assumed.
The results are summarized in Table 3. By considering its equivalent width, the line is detected at the 1.7
confidence level at most. This is consistent with all the previous observational records, included those obtained by
ASCA and BeppoSAX. The profile is very broad but it is difficult to appreciate any asymmetry due
to the moderate prominence. In both the XMM-Newton spectra an equivalent fit can be recovered by replacing
the disc line with a Gaussian of width . In a Keplerian frame, this entails a FWHM broadening of
4 km s-1, corresponding to a distance of 50–60 from a black hole of
10. Interestingly, this is the location of the reflecting clouds that have been recently proposed as the
source of the UV emission peak in AGN (Lawrence 2011).
In conclusion, the broad iron line in Ton S180 is not sufficiently strong to prove its consistency with the soft excess,
probably because of the high ionization of the reflecting gas. The same argument is invoked to explain the lack/faintness
of narrow iron lines, whose detection would likely cancel out the observed residuals. This hints at a range of ionization
states across the different spatial scales much more complex than the one simulated in our analysis. None the less,
the tentative discrepancy between the two main disc features remains a pivotal issue of blurred reflection models, and
will be addressed in detail in a future work.
4.2 X-ray time variability
The analysis of time variability and its dependence with energy is a powerful, alternative tool either to confirm or
to discard any physical interpretation based on spectral modelling. In very favourable conditions, this complementary
approach can even be conclusive in distinguishing between reflection and Comptonization scenarios. This possible
discrimination relies upon the detection of time lags among the different X-ray energy bands. In particular, a delay
between the hard X-ray variations and the soft ones at a given time-scale is regarded as the typical reverberation
signature, corresponding to the light travel time from the illuminating source to the reflector and back. Evidence for
negative (soft) lags has rapidly grown in recent times (Fabian et al. 2009; Zoghbi et al. 2010; De Marco et al.
2012), but none was found in Ton S180 down to the limit of 500 s (Vaughan et al. 2002).
The timing properties of Ton S180 have already been explored in the dedicated studies mentioned above.
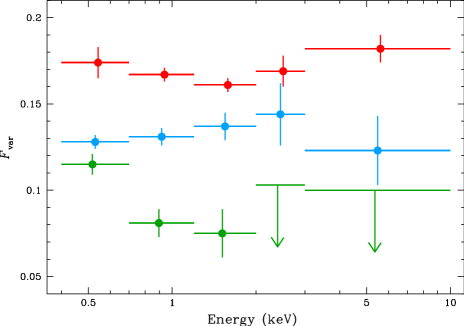
In Fig. 3 we reproduce the fractional rms variability amplitude () of the source: this is an
indicator of the intrinsic noise after the measurement uncertainties have been subtracted (e.g. Edelson
et al. 2002; Vaughan et al. 2003). For ease of comparison among the three observations here we have defined only
five energy bands, but our findings are in full agreement with previous works where a finer sampling was adopted.
Although the absolute values of are different, roughly scaling in proportion to the length of the single
observations,666The power spectral density decreases with frequency as , with
–2 (e.g. Lawrence & Papadakis 1993), hence the source variability is mostly sensitive to the longer
time-scales. the variability patterns are reasonably well matched. While there is no appreciable trend with energy for
the two deeper data sets, implying that the spectrum varies in first approximation as a whole, the shorter
XMM-Newton monitoring shows a provisional decline. Rather than physical, this is presumably a
statistical/systematic effect. Because of the spectral steepness, the count rate gets rapidly smaller and the weight
of Poisson noise in the hard bands is considerably larger. This might result in a decrease of , highly
accentuated by both the short exposure and the low flux state characterizing this observation, which lead to the
detection of only marginally positive excess variance above 2 keV. On the other hand, a genuine drop of
with energy would be apparently in contrast with a reflection context. In fact, if the soft emission is a form of
reprocessing of hard X-rays, the lower energies should reveal somewhat smoothed variations. Such behaviour is
expected whenever the emission in a definite band can be plainly associated with a dominant reflection component,
and also applies to the iron region (e.g. Vaughan & Fabian 2004) and the higher energies, especially in the presence
of a prominent Compton hump (which is actually not the case for Ton S180, see below).
In general, however, the dependence of with energy does not necessarily have any intuitive interpretation.
Both the direct emission and its blurred reflection counterpart yield a broad-band contribution, which gives rise to the
typical soft excess plus hard power law shape (see Fig. 4). Under extreme gravity conditions, their interplay may
have quite complicated manifestations in the time domain. This can be easily verified by rendering explicit the two
components within the definition of excess variance itself, and keeping in mind that the X-ray illumination experienced
by the disc is much more intense than the one received at infinity. As for Ton S180, where severe light bending does not
seem to be a decisive ingredient, the continuum irradiating the disc is almost identical to the observed, direct power law.
The absence of time delays is still consistent with a source height of several gravitational radii, tightly corresponding to
the values inferred from the spectral analysis for , and . The two perspectives are then
compatible with the transitional regime identified by Miniutti & Fabian (2004), hinting at a stationary source of varying
luminosity. A distance above the disc (with a nearly constant reflection opposed to a markedly
variable power law) would instead deliver clearer structures in as well as detectable spectral changes. This
minimal scatter in the variability pattern (see Ponti et al. 2011) has a couple of remarkable implications. First, it justifies a
time-averaged spectral analysis like the one performed in this work, as this is fairly representative of the physical state of
Ton S180 during each observation. Second, it involves a tight causal connection between the soft and hard X-ray emission,
which again fits into a reflection scenario, even if the details are partially obscure. Also some kind of complex, non-thermal Comptonization process may be able to account for these properties in a self-consistent way, so we argue that this other
option cannot be completely ruled out.
4.3 Suzaku HXD/PIN detection
As mentioned earlier, the detection of Ton S180 beyond 10 keV is quite critical. Since the HXD/PIN is a collimating
instrument with no imaging capabilities, the background level cannot be derived from the data records themselves.
While the cosmic contribution has been simulated according to standard spectral forms (e.g. Boldt 1987), a tuned
model of the particle non X-ray background (NXB) was provided by the HXD science team. Whenever the target is
very faint, as for Ton S180, the PIN count rate is dominated by the NXB. The accuracy of its reproducibility (typically
within 3–5 per cent; Kokubun et al. 2007) is therefore a major factor of uncertainty, which mainly affects the
absolute normalization of the high-energy emission of the source. In the present case, the PIN statistical weight is
virtually negligible, and the best fit is driven by the XIS spectrum regardless of the model. As a result, we found a
systematic PIN offset. By leaving it free to vary, we obtain a PIN/XIS cross calibration of 2.6(),
against a recommended value of 1.16. Such disparity can be actually explained once the NXB uncertainty is taken
into account. This point has been already addressed in great detail by Takahashi et al. (2010), who eventually
introduced a Compton-thick partial-covering absorber to retain the nominal NXB. The latter solution is not strictly
required, though. Moreover, it implies a considerable fine tuning in terms of both column density and covering
fraction to reproduce the high-energy emission without modifying the spectral shape below 10 keV. The presence
of this heavy absorption component is not envisaged in a bare Seyfert galaxy. Yet the putative hard excess
cannot be interpreted like a poorly modelled reflection hump, as suggested for NGC 1365 (Risaliti et al. 2009;
Walton et al. 2010).
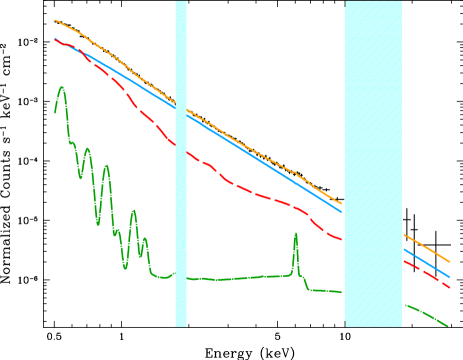
We did not pursue this issue further. Instead, we extracted the Earth-occulted PIN spectrum to test the NXB
accuracy. This is an observational measure of the instrumental background, and was employed throughout
our analysis. The outcome is shown in Fig. 4. There is still some discrepancy, but now the best scaling
factor would be 1.9(), broadly consistent with the usual values; the probability of chance
improvement following the loss of one d.o.f. is as high as 25 per cent. The existence of a hard excess in
Ton S180 remains somewhat controversial then, and can only be revealed by forthcoming X-ray missions
as NuSTAR and Astro-H.
5 Conclusions
We have presented the joint spectral analysis of the three highest-quality X-ray observations of the NLS1 galaxy
Ton S180, obtained by XMM-Newton and Suzaku. This is one of the brightest sources with negligible
intrinsic absorption, and represents an ideal target to investigate the nature of a striking X-ray spectral feature like the
soft excess. Even though the observations under review cover a period of several years, the 0.5–10 keV emission
of Ton S180 does not exhibit dramatic variations. In first approximation, the spectral shape can be described by a
broken power law. The hard photon index (–2.3) is almost constant, with an ordinary
value among NLS1s; the soft one is steeper () and more variable, following the strength
of the soft excess below 2 keV. A broad iron fluorescence line hints at reflection from highly ionized material
close to the central black hole. However, this feature is not very prominent, and falls in a noisy region owing to the
steepness of the primary X-ray continuum. Conversely, the soft excess emission is remarkable in both strength and
shape, challenging a possible origin from the inner disc as a blurred reflection signature. In order to probe the soundness
of this scenario, we have applied a self-consistent model that provides a successful description of all the different data
sets by allowing for a dual-reflector geometry. The high-ionization component (–2.8) is
associated with the disc, and accounts for most of the soft excess. Also involved is a much fainter, neutral component,
arising from the reprocessing of the primary radiation at much larger distance from the X-ray source. The accretion flow
extends down to , and this is a compelling evidence in favour of a rapidly rotating
black hole. The substantial degeneracy among the key parameters prevents an accurate determination of the spin
and a complete characterization of the central engine, none the less the overall picture is clearly established.
This work, together with our previous study of the BLS1 galaxy Ark 120, confirms that reflection models are
extremely effective in reproducing a wide range of X-ray spectral properties. A uniform analysis of a sizable
sample of similar objects is anyway mandatory to uncover the expected correlations (e.g. between soft excess
and broad iron feature, reflection fraction and black hole spin) and rule out any fine tuning (e.g. of the disc ionization
state and/or inclination). Even this kind of effort might not be conclusive if the soft excess is a complex, non-linear
combination of all the physical processes that take place in the central regions of active galaxies. In the absence
of a universal explanation, only the next-generation X-ray satellites would have the capabilities to disentangle the
different contributions from thermal emission, reflection, scattering and (possibly) absorption.
Acknowledgments
The authors would like to thank the anonymous referee for providing helpful comments. EN acknowledges the financial support from NASA grants NNX10AF50G and GO0-11017X. ACF thanks the Royal Society. DJW acknowledges the financial support provided by the STFC.
References
- [\citeauthoryearArnaud et al.1985] Arnaud K. A., et al., 1985, MNRAS, 217, 105
- [\citeauthoryearBerti & Volonteri2008] Berti E., Volonteri M., 2008, ApJ, 684, 822
- [\citeauthoryearBoldt1987] Boldt E., 1987, PhR, 146, 215
- [\citeauthoryearBrenneman & Reynolds2006] Brenneman L. W., Reynolds C. S., 2006, ApJ, 652, 1028
- [\citeauthoryearComastri et al.1998] Comastri A., et al., 1998, A&A, 333, 31
- [\citeauthoryearCoppi1999] Coppi P. S., 1999, in Poutanen J., Svensson R., eds, ASP Conf. Ser. Vol. 161, High Energy Processes in Accreting Black Holes. Astron. Soc. Pac., San Francisco, p. 375
- [\citeauthoryearCrummy et al.2006] Crummy J., Fabian A. C., Gallo L., Ross R. R., 2006, MNRAS, 365, 1067
- [\citeauthoryearDe Marco et al.2011] De Marco B., Ponti G., Cappi M., Dadina M., Uttley P., Cackett E. M., Fabian A. C., Miniutti G., 2011, arXiv, arXiv:1201.0196
- [\citeauthoryearDone et al.2012] Done C., Davis S. W., Jin C., Blaes O., Ward M., 2012, MNRAS, 420, 1848
- [\citeauthoryearEdelson et al.2002] Edelson R., Turner T. J., Pounds K., Vaughan S., Markowitz A., Marshall H., Dobbie P., Warwick R., 2002, ApJ, 568, 610
- [\citeauthoryearEmmanoulopoulos et al.2011] Emmanoulopoulos D., Papadakis I. E., McHardy I. M., Nicastro F., Bianchi S., Arévalo P., 2011, MNRAS, 415, 1895
- [\citeauthoryearFabian et al.2002] Fabian A. C., Ballantyne D. R., Merloni A., Vaughan S., Iwasawa K., Boller T., 2002, MNRAS, 331, L35
- [\citeauthoryearFabian et al.2009] Fabian A. C., et al., 2009, Natur, 459, 540
- [\citeauthoryearFabian et al.2012] Fabian A. C., et al., 2012, MNRAS, 419, 116
- [\citeauthoryearFink et al.1997] Fink H. H., Walter R., Schartel N., Engels D., 1997, A&A, 317, 25
- [\citeauthoryearGeorge & Fabian1991] George I. M., Fabian A. C., 1991, MNRAS, 249, 352
- [\citeauthoryearGierliński & Done2004] Gierliński M., Done C., 2004, MNRAS, 349, L7
- [\citeauthoryearGrupe et al.2004] Grupe D., Wills B. J., Leighly K. M., Meusinger H., 2004, AJ, 127, 156
- [\citeauthoryearHaardt & Maraschi1993] Haardt F., Maraschi L., 1993, ApJ, 413, 507
- [\citeauthoryearHwang & Bowyer1997] Hwang C.-Y., Bowyer S., 1997, ApJ, 475, 552
- [\citeauthoryearKalberla et al.2005] Kalberla P. M. W., Burton W. B., Hartmann D., Arnal E. M., Bajaja E., Morras R., Pöppel W. G. L., 2005, A&A, 440, 775
- [\citeauthoryearKing, Pringle, & Hofmann2008] King A. R., Pringle J. E., Hofmann J. A., 2008, MNRAS, 385, 1621
- [\citeauthoryearKokubun et al.2007] Kokubun M., et al., 2007, PASJ, 59, 53
- [\citeauthoryearLaor1991] Laor A., 1991, ApJ, 376, 90
- [\citeauthoryearLarsson et al.2008] Larsson J., Miniutti G., Fabian A. C., Miller J. M., Reynolds C. S., Ponti G., 2008, MNRAS, 384, 1316
- [\citeauthoryearLawrence2011] Lawrence A., 2011, arXiv, arXiv:1110.0854
- [\citeauthoryearLawrence & Papadakis1993] Lawrence A., Papadakis I., 1993, ApJ, 414, L85
- [\citeauthoryearLawrence & Elvis2010] Lawrence A., Elvis M., 2010, ApJ, 714, 561
- [\citeauthoryearLynden-Bell1969] Lynden-Bell D., 1969, Natur, 223, 690
- [\citeauthoryearMiddleton, Done, & Gierliński2007] Middleton M., Done C., Gierliński M., 2007, MNRAS, 381, 1426
- [\citeauthoryearMiniutti & Fabian2004] Miniutti G., Fabian A. C., 2004, MNRAS, 349, 1435
- [\citeauthoryearNandra et al.2007] Nandra K., O’Neill P. M., George I. M., Reeves J. N., 2007, MNRAS, 382, 194
- [\citeauthoryearNardini et al.2011] Nardini E., Fabian A. C., Reis R. C., Walton D. J., 2011, MNRAS, 410, 1251
- [\citeauthoryearOsterbrock & Pogge1985] Osterbrock D. E., Pogge R. W., 1985, ApJ, 297, 166
- [\citeauthoryearPonti et al.2011] Ponti G., Papadakis I., Bianchi S., Guainazzi M., Matt G., Uttley P., Bonilla F., Nuria, 2011, arXiv, arXiv:1112.2744
- [\citeauthoryearPorquet et al.2004] Porquet D., Reeves J. N., O’Brien P., Brinkmann W., 2004, A&A, 422, 85
- [\citeauthoryearPounds, Done, & Osborne1995] Pounds K. A., Done C., Osborne J. P., 1995, MNRAS, 277, L5
- [\citeauthoryearRees1984] Rees M. J., 1984, ARA&A, 22, 471
- [\citeauthoryearRemillard & McClintock2006] Remillard R. A., McClintock J. E., 2006, ARA&A, 44, 49
- [\citeauthoryearReynolds & Fabian2008] Reynolds C. S., Fabian A. C., 2008, ApJ, 675, 1048
- [\citeauthoryearRisaliti et al.2009] Risaliti G., et al., 2009, ApJ, 705, L1
- [\citeauthoryearRomano et al.2002] Romano P., Turner T. J., Mathur S., George I. M., 2002, ApJ, 564, 162
- [\citeauthoryearRoss & Fabian2005] Ross R. R., Fabian A. C., 2005, MNRAS, 358, 211
- [\citeauthoryearRóżańska et al.2004] Różańska A., Czerny B., Siemiginowska A., Dumont A.-M., Kawaguchi T., 2004, ApJ, 600, 96
- [\citeauthoryearSatyapal et al.2005] Satyapal S., Dudik R. P., O’Halloran B., Gliozzi M., 2005, ApJ, 633, 86
- [\citeauthoryearSchmoll et al.2009] Schmoll S., et al., 2009, ApJ, 703, 2171
- [\citeauthoryearSchurch, Done, & Proga2009] Schurch N. J., Done C., Proga D., 2009, ApJ, 694, 1
- [\citeauthoryearScott et al.2011] Scott A. E., Stewart G. C., Mateos S., Alexander D. M., Hutton S., Ward M. J., 2011, MNRAS, 417, 992
- [\citeauthoryearShakura & Sunyaev1973] Shakura N. I., Sunyaev R. A., 1973, A&A, 24, 337
- [\citeauthoryearTakahashi, Hayashida, & Anabuki2010] Takahashi H., Hayashida K., Anabuki N., 2010, PASJ, 62, 1483
- [\citeauthoryearTurner, George, & Nandra1998] Turner T. J., George I. M., Nandra K., 1998, ApJ, 508, 648
- [\citeauthoryearTurner et al.2001] Turner T. J., et al., 2001, ApJ, 548, L13
- [\citeauthoryearTurner et al.2002] Turner T. J., et al., 2002, ApJ, 568, 120
- [\citeauthoryearVaughan & Fabian2004] Vaughan S., Fabian A. C., 2004, MNRAS, 348, 1415
- [\citeauthoryearVaughan et al.2002] Vaughan S., Boller T., Fabian A. C., Ballantyne D. R., Brandt W. N., Trümper J., 2002, MNRAS, 337, 247
- [\citeauthoryearVaughan et al.2003] Vaughan S., Edelson R., Warwick R. S., Uttley P., 2003, MNRAS, 345, 1271
- [\citeauthoryearVennes et al.1995] Vennes S., Polomski E., Bowyer S., Thorstensen J. R., 1995, ApJ, 448, L9
- [\citeauthoryearWalton, Reis, & Fabian2010] Walton D. J., Reis R. C., Fabian A. C., 2010, MNRAS, 408, 601
- [\citeauthoryearWalton et al.2012] Walton D. J., Reis R. C., Cackett E. M., Fabian A. C., Miller J. M., 2012, arXiv, arXiv:1202.5193
- [\citeauthoryearWilms, Allen, & McCray2000] Wilms J., Allen A., McCray R., 2000, ApJ, 542, 914
- [\citeauthoryearWilkins & Fabian2011] Wilkins D. R., Fabian A. C., 2011, MNRAS, 414, 1269
- [\citeauthoryearWisotzki et al.1995] Wisotzki L., Dreizler S., Engels D., Fink H.-H., Heber U., 1995, A&A, 297, L55
- [\citeauthoryearZoghbi, Fabian, & Gallo2008] Zoghbi A., Fabian A. C., Gallo L. C., 2008, MNRAS, 391, 2003
- [\citeauthoryearZoghbi et al.2010] Zoghbi A., Fabian A. C., Uttley P., Miniutti G., Gallo L. C., Reynolds C. S., Miller J. M., Ponti G., 2010, MNRAS, 401, 2419