Onset of deformation at in Bi nuclei
Abstract
The high spin states in 195Bi has been studied by -ray spectroscopic method using the 181Ta(20Ne, 6n) fusion evaporation reaction at 130 MeV. The coincidence data were taken using an array of 8 clover HPGe detectors. The spin and parity assignments of the excited states have been made from the measured directional correlation from oriented states (DCO) ratios and integrated polarization asymmetry (IPDCO) ratios. The results show, for the first time, the evidence of a rotational like band based on a 13/2+ band head in this nucleus, indicating the onset of deformation at neutron number for the Bismuth isotopes. The results obtained were found to be consistent with the prediction of the total Routhian surface calculations using Woods Saxon potential. The same calculations also predict a change in shape from oblate to triaxial in 195Bi at high rotational frequency.
pacs:
21.10.-k; 23.20.Lv; 23.20.En; 27.80.+w; 21.60.CsI Introduction
The nuclei near A 190 in the Pb region are known for rich variety of structural phenomena and interesting shape properties. Experimental evidence of the coexistence of spherical, oblate and prolate shapes, observed in the lead nuclei and00 ; dra03 has opened up a renewed research interest in this region, both theoretically and experimentally. There were several spectroscopic investigations to study the shapes and single particle level structures in the nuclei below Z = 82 shell closure be_z82 . However, there were only a few above it pie85 ; lip04 ; nie04 ; mab05 ; har08 .
The Nilsson diagram corresponding to this region shows that both the [505]9/2- and the [606]13/2+ proton orbitals have strong shape driving effect towards oblate shape. The [541]1/2- and [660]1/2+ proton orbitals, on the other hand, have strong shape driving effect towards prolate shape. The competing nature of different Nilsson orbitals are reflected in the calculated shapes of different nuclei in this region which show the occurance of various shapes including shape coexistence hey83 . Two proton excitations across the shell gap are generally responsible for oblate deformed structure in this region whereas, multiparticle excitations having four or more protons induces prolate deformations woo92 .
In the Bismuth nuclei (Z = 83), a variety of structure is obtained from spherical lip04 to superdeformed shapes cla96 as one goes down in neutron number from the spherical shell closure at . The observation of rotational bands in 191,193Bi nie04 indicates a deformed shape in bismuth nuclei for neutron number 109 and 110. On the other hand, the absence of any regular band like structure for the low lying states in the heavier odd-A Bismuth isotopes suggests spherical shapes for these nuclei at low excitation energy. These low lying states in 197-201Bi could be interpreted in terms of shell model and weak coupling of the odd proton to the neutron-hole states in the neighboring Pb core pie85 ; cha86 . Recently, a shears band has been reported at high excitation ( 4 MeV) in 197Bi mab05 . The total Routhian surface (TRS) calculations indicate oblate deformation for this configuration. This suggests that deformation sets in for the multi-quasiparticle state at high excitation in 197Bi.
In even-even Po (Z = 84) isotopes the ratio of excitation energies of 4+ and 2+ remains close to the vibrational limit () until , below which it starts to increase towards the rotational limit ber95 . Similarly, the ratio also deviates from the limit of excitation energies predicted from the multi particle excitation involving orbital ((h9/2)2 limit) for the lighter isotopes with neutron number below . These indicate a clear evidence of structural change at neutron number .
The odd proton nucleus 195Bi, with neutron number , is an interesting transitional nucleus whose two immediate odd-A neighbors on either side have different shapes at low excitation energies. As mentioned above, the spherical shape dominates in heavier 197Bi and deformed shape dominates for 193Bi. The excitation energy of the 13/2+ state (corresponding to orbital), with respect to the 9/2- state (corresponding to orbital), in Bismuth isotopes decreases quite rapidly with the decrease in neutron number. This was believed to be due to the difference between the interactions of and pairs. At the 13/2+ state, originated from configuration, is expected to be below the 11/2- and 13/2- states, originated from the configuration. This is experimentally confirmed from the observation of 13/2+ as the first excited state in 195Bi lon86 . The oblate driving nature of the proton orbital is expected to induce oblate deformation in 195Bi.
Lönnroth et al. lon86 have studied the high spin states in 195Bi using 19F beam on 182W target and 30Si beam on 169Tm target. Six -rays were identified in their work. The highest state known was a 29/2-, 750 ns isomer, the excitation energy of which was not known. Superdeformed bands have also been identified in this region in Bi isotopes in a Gammasphere experiment cla96 showing the rich variety of shapes one can expect in this region. However, no rotational like band structure has been observed at lower excitation energy in 195Bi.
II Experimental procedures and data analysis
The -ray spectroscopy of 195Bi has been performed at Variable Energy Cyclotron Centre, Kolkata using the Indian National Gamma Array (INGA) with 8 clover HPGe detectors at the time of the experiment. The excited states in this nucleus were populated by fusion evaporation reaction 181Ta(20Ne,6n)195Bi. The 145 MeV 20Ne beam from the K130 cyclotron was degraded by about 15 MeV using a 3.6 mg/cm2 Al foil placed 30 cm upstream to the centre of the INGA detector array. A thick (14.5 mg/cm2) 181Ta target was used and the recoils were stopped inside the target. The clover detectors were arranged in three angles with respect to the beam direction. There were 2 clovers each at 40∘ and 125∘ angles while four clovers at 90∘. The master trigger was set as (and a small run with ) coincidence to collect list mode data. Integrated electronics modules fabricated at IUAC, New Delhi, specially for the clover detector pulse processing ven02 have been used in this experiment. Time and pulse height information of each -ray was stored using a CAMAC based data acquisition system. Time to Digital Converters (TDCs), used for individual -ray timing, were started by the master trigger pulse and stopped by the individual clover time pulse. The time difference between the -rays in an event ( TAC) was obtained, in the software, by subtracting each pair of TDCs recorded in that event. A hardware Time to Amplitude Converter (TAC) module was also used to record the time between the master trigger and the RF signal of the cyclotron (RF- TAC) to separately identify the “beam-on” and “beam-off” events. The clover detectors were calibrated for -ray energies and relative efficiencies by using 133Ba and 152Eu radioactive sources.
The coincidence and intensity relations were used to build the level scheme. The data were sorted and analyzed using the INGASORT code bho01 . A prompt Eγ - Eγ matrix (matrix-1) was constructed gated by the prompt peak in the RF- TAC and a delayed Eγ - Eγ matrix (matrix-2) was constructed gated by the delayed part (100 - 230 ns away from the prompt peak) in the same TAC. Both of these matrices were also gated by the prompt peak of the TAC constructed in the software.
The first excited state in 195Bi is an isomer with 32 ns halflife which decays by 887-keV ray. There are other high spin isomers in 195Bi which were identified with halflives of 80 ns and 750 ns by Lönnroth et al. lon86 . However, the time delay curves for the transitions decaying from these isomers were shown to contain significant amount of prompt components. The coincidence time window in our experiment was 400 ns wide. During the analysis, we have set a tighter coincidence gate of 100 ns, for constructing both the Eγ - Eγ matrices, which is sufficiently wide to allow coincidences with the 887 keV transition. Data were analyzed using both the matrices. Gates were put on the known -ray transitions in prompt matrix for obtaining the coincidence relation.
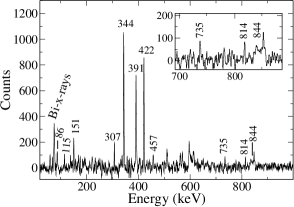
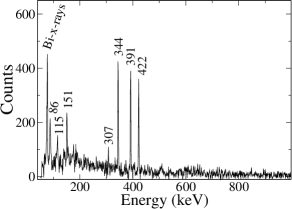
Figure 1 shows the ray spectrum gated by the known 887-keV transition in 195Bi projected from the matrix-1. A few new lines at 86-, 307-, 457-, 735-, 814- and 844-keV have been observed in this spectrum. On the basis of their coincidence relations, they are placed in the level scheme. The gated spectrum shown in Fig. 2 is projected from the matrix-2 using the same gating transition of 887-keV. Since the 151-keV ray is a direct decay from the 80 ns isomer, the relative intensity of this line has been found to be higher in Fig. 2 than in Fig. 1, as expected. While the ratio of the intensities of 151- and 391-keV rays is 0.17(4) in Fig. 1, the same ratio has been found to be 0.25(2) in Fig. 2. Interestingly, the ratio of intensities of the 391- and 422-keV rays has also been found to be different in the two spectra. This has been discussed in the next section.
The multipolarities of the -ray transitions have been determined from the angular correlation analysis using the method of directional correlation from oriented states (DCO) ratios, following the prescriptions of Krämer-Flecken et al. kram89 . For the DCO ratio analysis, the coincidence events were sorted into an asymmetry matrix with data from 90∘ detectors () on one axis and 40∘ detectors () on the other axis. The DCO ratios are obtained, from the -ray intensities (Iγ) at two angles and , as
| (1) |
By putting gates on the transitions with known multipolarity along the two axes of the above matrix, the DCO ratios are obtained for each ray. For stretched transitions, the value of RDCO would be close to unity for the same multipolarity of and . For different multipolarities of and , the value of RDCO depends on the mixing ratio of the transitions. The value of the DCO ratio of a pure dipole transition, gated by a pure quadrupole transition has been calculated as 1.84 in the above geometry. The procedure has been validated by the rays of known multipolarity which were produced in the present experiment. RDCO = 1.03(7) and 0.98(4) were obtained for the known quadrupole (E2) transitions in 194Pb and 196Pb nds , respectively, and RDCO = 1.54(23) was obtained for a known mixed (M1+E2) transition cha86 when gated by known quadrupole transitions. To obtain the DCO ratios for the rays in 195Bi, the 887-keV was taken as the gating transition which was known to be of type. The measured K- conversion coefficient () of this transition and the half-life of 32 ns measured for the 13/2+ state lon86 indicate that the 887-keV ray is, most likely, an M2 transition. So, the DCO values obtained for the rays in 195Bi, in the present work, may be compared with the values calculated using a quadrupole gate.
The advantage of the clover geometry of the detectors is that these detectors can be used as a ray polarimeter, using the Compton scattered events detected in the germanium crystals parallel and perpendicular to the directions of the reaction plane. In these measurements, one can determine the type of a ray () and thereby, the parity of a state can be unambiguously determined. We have measured the integrated polarization asymmetry (IPDCO) ratios, as described in Ref. dro96 and following the procedure adopted in Ref. kst99 . The IPDCO asymmetry parameters have been deduced using the relation,
| (2) |
where and are the counts for the actual Compton scattered rays in the planes parallel and perpendicular to the reaction plane. To obtain these, two matrices were constructed with X-axis contained the events in which one of the rays was scattered in the parallel (or perpendicular) direction inside the Clover detector while Y-axis contained a coincident ray detected in any of the clover detectors. The counts were obtained from a sum gated spectrum with gates on all low lying intense transitions. A correction factor due to the asymmetry in the array and response of the clover segments was incorporated which is defined by ) = . The value of this asymmetry parameter, for an ideal array, should be close to unity. In the present experiment this was obtained for different ray energies using 152Eu source and an average value was found to be 1.07(5). This value compares well with the value 1.00(3) measured earlier for a similar array rp00 . By using the value of ), of the rays in 195Bi have been determined. Positive and negative values of indicate electric and magnetic type of transitions, respectively. The IPDCO ratios could not be obtained for the rays having low energy (E keV) and low intensity.
| 111Relative ray intensities are estimated from prompt spectra and normalized to 100 for the total intensity of 886.7 keV rays. | Deduced | |||||
| (in keV) | (in keV) | (Err) | (Err) | Multipolarity | ||
| 86.3(2) | 2395.8 | 9.3(15) | 1.04(20)222From 886.7 keV (M2) DCO gate; | - | E2 | |
| 114.9(3) | 2309.5 | 9.7(11) | 1.41(29)222From 886.7 keV (M2) DCO gate; | - | E1 | |
| 150.7(2) | 2194.6 | 10.8(9) | 1.08(20)222From 886.7 keV (M2) DCO gate; | - | E2 | |
| 307.4(3) | 1537.8 | 9.6(11) | 1.59(33)222From 886.7 keV (M2) DCO gate; | - | (M1+E2) | |
| 343.7(1) | 1230.6 | 48.4(37) | 1.24(7)222From 886.7 keV (M2) DCO gate; | -0.09(3) | M1+E2 | |
| 391.3(2) | 1621.6 | 38.0(30) | 1.46(12)222From 886.7 keV (M2) DCO gate; | -0.08(3) | M1+E2 | |
| 421.6(1) | 2465.6 | 6.1(80) | 1.33(18)222From 886.7 keV (M2) DCO gate; | - | (M1+E2) | |
| 421.7(1) | 2043.9 | 37.0(80) | 1.35(19)444From 150.7 keV (E2) DCO gate; | -0.13(4) | M1+E2 | |
| 457.4(6) | 2923.0 | 8.5(15) | 1.56(40)222From 886.7 keV (M2) DCO gate; | - | M1+E2 | |
| 734.7(6) | 1621.6 | 6.7(13) | - | - | (E2) | |
| 813.6(3) | 2043.9 | 5.7(10) | - | - | (E2) | |
| 843.6(4) | 2465.6 | 4.4(13) | - | - | (E2) | |
| 886.7(1) | 886.7 | 100(6) | 0.61(7)333From 391.3 keV (M1+E2) DCO gate; | -0.08(3) | M2 |
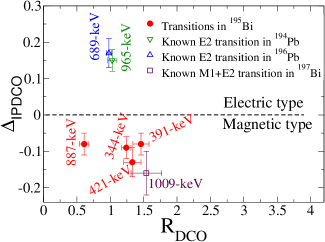
The spin and parity of the excited states in 195Bi has been assigned from the above two measurements. In Fig. 3, the DCO and the IPDCO ratios are plotted for the rays in 195Bi along with those for some of the transitions in other nuclei, produced in the same experiment and with known multipolarities. The DCO ratios, for all the transitions shown in Fig. 3, were obtained by gating on a known quadrupole transition except for the 887-keV ray in 195Bi. The DCO ratio for this ray was obtained from a dipole gate of 391-keV. As mentioned earlier, to compare our results with the known transitions, the DCO and IPDCO ratios obtained for the 689-, 965- and 1009-keV rays, belonging to 196Pb, 194Pb and 197Bi, respectively, are also shown in Fig. 3 and the results are found to be consistent with the known type and multipolarities of the transitions nds ; cha86 .
III Results
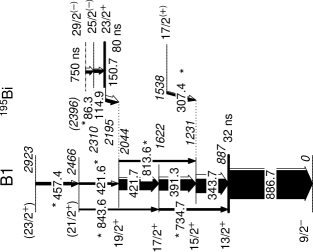
The results obtained in the present work for the excited states in 195Bi are summarized in Table 1. The level scheme of 195Bi, as obtained in the present work, is shown in Fig. 4. This level scheme includes 7 new transitions over and above the ones reported earlier lon86 . These new lines have been placed in the level scheme and are marked by * in Fig. 4. The 344- and 391- keV -rays were assigned as dipole in character from the angular distribution measurements by Lönnroth et al. lon86 . The conversion coefficient measurements, performed in the same study, were not clean enough to determine their electric or magnetic character. In the present work, these transitions were found to be of mixed in character from their RDCO and values (see Fig. 3). It may be noted that the possibility of a mixed transition was not ruled out in Ref. lon86 for the 344 keV ray. Similarly, multipolarity was tentatively assigned by Lönnroth et al. for the 422 keV transition decaying from the 2044 keV state. In the present work, however, this ray has been found to be a transition based on the DCO and the IPDCO values. Moreover, the weak cross-over transitions (735- and 814-keV) were also observed in the present work and are shown in Fig. 1.
It can be seen that the intensity of 422-keV is more than the 391-keV transition in Fig. 1 whereas, it is less than the 391-keV transition in the delayed gate in Fig. 2. This clearly indicates the presence of another 422-keV prompt transition. This transition has been placed above the 2044-keV state in the level scheme. The presence of the cross-over 844-keV line supports this placement. The intensity of the 422-keV line has been suitably divided among the two transitions by measuring the branching ratio of the 2044-keV state from the spectrum gated by 151-keV. A 457-keV line is also observed in this work and was found to be in coincidence with 887-, 344-, 391-, and 422-keV rays. This line was not found to be in coincidence with the 151- or 115-keV lines and was not observed in the delayed gate. A spectrum gated by this 457-keV has low statistics but shows the indication of 844-keV line along with the other low lying transitions in the level scheme. Therefore, this transition is placed above the 2466 keV state. A 307-keV line, observed in this work, has been found to be in coincidence with the 887- and 344-keV rays only and has been placed accordingly.
In Ref. lon86 , no decay ray was reported from the 750 ns, 29/2- isomer and hence, the excitation energy of this isomer was uncertain. In the present work, there are indications of a 86-keV transition decaying from this isomer. It may be noted that this line could as well be observed in the spectra showed in Ref. lon86 but it is difficult to assign this ray as the Kβ1 X-ray of Bi has the similar energy (87.3 keV) toi . From the delayed spectrum gated by 887-keV, we have obtained the ratio of intensities of the 77-keV ( of Bi) and the 86-keV as 2.66(36) whereas, the ratio of and X-rays (from the table in Ref. toi ) is 4.32. This suggests that there is additional contribution in the intensity around 86 keV. The same ratio obtained from a spectrum gated by 86-keV, in which the contribution of the 86-keV will be absent but the contribution from the X-ray will be present, yields a value of 4.04(80). This is in agreement with the tabulated value in Ref. toi . The ratio of intensities of and was also obtained, from our data, as 1.77(12) which again agrees well with the value of 1.67 obtained from the table and shows that our data gives good estimate of the relative intensities for the pure X-rays.
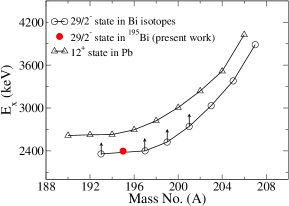
In the present work, the spin and parity of the 2310-keV state has been found to be 25/2-. A 25/2- state has also been observed at similar excitation energy in the neighboring isotope of 193Bi nie04 . It is suggested that the 29/2- isomer in 195Bi decays to the 25/2- state by a 86 keV transition. The measured halflife of the isomer is also consistent with the Weisskopf estimate for a 86 keV transition. Therefore, the excitation energy of the 29/2- isomer is proposed to be 2396 keV. The systematic of the excitation energies of the 29/2- isomer in Bismuth isotopes, which arises due to the coupling, is shown in Fig. 5. The same for the 12+ state in the Pb nuclei are also shown in the same Figure. It can be seen that the excitation energy of the 29/2- isomer in 195Bi is consistent with the systematic.
IV Discussion
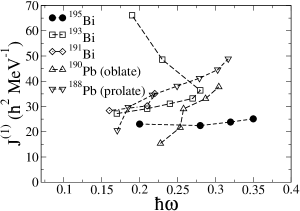
The band B1 in 195Bi closely resembles the rotational bands based on 13/2+ band head in 193Bi and 191Bi nie04 . This band has the configuration of coupled to the 2p-2h 0+ intruder state of the Pb core with oblate deformation. Although, the state has been observed through out the isotopic chain of Bi nuclei, the rotational bands based on the above configuration were observed only in the isotopes lighter than , prior to the present work. Therefore, the neutron number was considered to be the border for the observation of deformed shape in odd-A Bi isotopes. With the observation of rotational band structure based on the 13/2+ band in 195Bi, the border has been extended to in the present work. The kinematic moments of inertia, J(1), have been plotted in Fig. 6 for the above band in Bi isotopes along with those for the prolate and oblate structures in the Pb nuclei dra98 ; hee93 as in Ref. nie04 to get qualitative information about the systematic trend of the above band structure in this region. This figure indicates that while the moment of inertia values in 191Bi are closer to the prolate band in 188Pb, the initial values in 195Bi are closer to the oblate band in 190Pb. For 193Bi, the values are in between these two. This indicates a gradual change in the structure of the i13/2 band in odd-A Bi isotopes as the neutron number increases.
It may also be noticed in Fig. 6 that there is a band crossing in 193Bi around rotational frequency of MeV and there is only an indication of a band crossing in 191Bi at MeV. In the present work, however, no indication of a band crossing is observed in 195Bi up to the highest spin observed. It indicates that there might be a delayed crossing in 195Bi which is reasonable from the fact that the crossing frequency increases with the neutron number as the deformation decreases. If one extrapolates the difference in the crossing frequencies in the two lighter isotopes, the crossing in 195Bi is expected at or beyond MeV.
The high spin single particle states in 193Bi were interpreted as due to the coupling of h9/2 proton with the states in the neighboring even-even 192Pb core. As mentioned earlier, the 29/2- isomer is the result of the coupling of with the 12+ in the Pb core. The 25/2- state in 195Bi could be interpreted as due to the coupling of the proton in the same orbital with the 8+ in the Pb core in accordance with the interpretation for the same state in 193Bi nie04 . The isomer at 2195 keV was assigned to be a 25/2+ state in 195Bi by Lönnroth et al. lon86 . But this state was not observed in 193Bi. The same state has been assigned to be a 23/2+ state in the present work which may be interpreted as the coupling of the proton with the 7- state in the Pb core. In 193Bi, the excitation energy of an isomer (t), observed above the 2127 keV state, suggest that this state may have the same configuration. The 17/2(+) state, observed at an excitation energy of 1538 keV in this work may be interpreted as the state which agrees well with the calculations shown in Ref. lon86 .
V TRS calculations
The onset of deformation in 195Bi has been discussed in the cranking formalism. In this formalism, the total Routhian surface (TRS) calculations are performed using the Strutinsky shell correction method naz85 ; naz90 . Deformed Woods-Saxon potential with BCS pairing was used to calculate the single particle shell energies. The universal parameter set was used for the calculations. The Routhian energies were calculated in () deformation mesh points with minimization on . The procedure of such calculations have been outlined in Ref. muk09 . The Routhian surfaces are plotted in the conventional plane. The TRSs are calculated for the different values of the rotational frequencies and for different configurations labelled by parity () and signature () quantum numbers. At each frequency, the spin can be projected. The TRSs, calculated for the positive parity and configuration, are shown in Fig. 7 for the spin value of 13/2+. A minimum in the TRS is obtained at an oblate deformation with . This shows that the deformation driving [606]13/2+ orbital, originated from the level, induces oblate deformation in 195Bi. This is in qualitative agreement with the fact that the moment of inertia of 195Bi is closer to the oblate deformed band in 190Pb as shown in Fig. 6. Therefore, the observed onset of deformation in 195Bi agrees with the cranking model predictions.
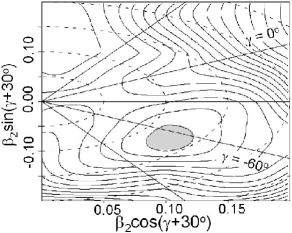
The TRSs have been calculated at different rotational frequencies for the same configuration () in 195Bi and the values of the deformation parameters ( and ) corresponding to the minimum at each frequency is plotted in Fig. 8. In this plot, the and lines correspond to oblate and to prolate deformations, respectively. It can be seen that the calculated shape remains oblate below keV after which it starts to deviate from oblate towards triaxial deformation.

VI Conclusion
The ray spectroscopy of the high spin states in 195Bi has been studied using the fusion evaporation reaction with 20Ne beam on a 181Ta target and using INGA array with 8 clover HPGe detectors. A new level scheme with 7 new transitions has been proposed for 195Bi. A rotational band based on a 13/2+ band head has been proposed in 195Bi, similar to those observed in the lighter isotopes 191,193Bi. This indicates that onset of deformation takes place in the isotopic chain of Bi nuclei at . The excitation energy of 2396 keV proposed for the 29/2- isomer has been found to be consistent with the systematic of the energy of this isomer in the neighboring odd-A Bi isotopes. The TRS calculations using Woods-Saxon potential show oblate deformation for the 13/2+ configurations in 195Bi. The same calculations at higher angular frequencies predict a change in shape from oblate to triaxial deformation around the rotational frequency of MeV. More experimental work are needed to test this prediction.
VII Acknowledgement
The untiring effort of cyclotron operators at VECC are acknowledged for providing a very good beam of 20Ne.
Acknowledgement is due to Mr. P. Mukherjee, S. Mukherjee, A. Chowdhury and late R.S. Hela for their help during
the experiment. The help of Mr. P.K. Das is acknowledged for target and degrader foil preparation. Acknowledgements
are also due to the electronics group of IUAC, New Delhi and Dr. A. Chatterjee and his colleagues of BARC, Mumbai
for INGA electronics modules and multicrate data acquisition operation respectively. Fruitful discussion with Prof.
P.M. Walker is greatefully acknowledged.
References
- (1) A.N. Andreyev et al., Nature 405, 430 (2000).
- (2) G.D.Dracoulis et al., Phys. Rev. C 67, 051301(R) (2003).
- (3) R.M. Lieder et al., Nucl. Phys. A 299, 255 (1978); I.G. Bearden et al., ibid A 576, 441 (1994); H. Hübel et al., ibid A 453, 316 (1986); A.J. Kreiner et al., ibid A 308, 147 (1978); A.J. Kreiner et al., ibid A 282, 243 (1977); E.A. Lawrie et al., Phys. Rev. C 78, 021305(R) (2008); A.J. Kreiner et al., ibid C 23, 748 (1981); A.J. Kreiner et al., ibid C 20, 2205 (1979); A.J. Kreiner et al., ibid C 21, 933 (1980); C.Y. Xie et al., ibid C 72, 044302 (2005); M.G. Porquet et al., ibid C 44, 2445 (1991); A.J. Kreiner et al., ibid C 38, 2674 (1988); W.Reviol et al., Phys. Scr. T 56, 167 (1995).
- (4) W.F. Piel et al., Phys. Rev. C 31, 2087 (1985).
- (5) M. Lipoglavsek, et al., Phys. Lett. B 593, 61 (2004).
- (6) P. Nieminen et al., Phys. Rev. C 69, 064326 (2004).
- (7) D.J. Hartley et al., Phys. Rev. C 78, 054319 (2008).
- (8) G.K. Mabala et al., Euro. Phys. J. A 25, 49 (2005).
- (9) K. Heyde, P. Van Isacker, M. Waroquier, J. L. Wood and R.A. Meyer, Phys. Rep. 102, 291 (1983).
- (10) J. L. Wood, K. Heyde, W. Nazarewicz, M. Huyse, and P. Van Duppen, Phys. Rep. 215, 101 (1992).
- (11) R.M Clark et al., Phys. Rev. C 53, 117 (1996).
- (12) T. Chapuran et al., Phys. Rev. C 33, 130 (1986).
- (13) L.A. Bernstein et al. Phys. Rev. C 52, 621 (1995).
- (14) T. Lönnroth et al. , Phys. Rev. C 33, 1641 (1986).
- (15) S. Venkataramanan et al., DAE Symp. on Nucl. Phys. 45B 424 (2002).
- (16) R.K. Bhowmik, S. Muralithar, R.P. Singh, DAE Symp. on Nucl. Phys. 44B 422 (2001).
- (17) A. Krämer-Flecken et al., Nucl. Instrum. Methods Phys. Res. A 275, 333 (1989).
- (18) B. Singh, Nucl. Data Sheets 107, 1531 (2006); H. Xiaolong, ibid 108 1093 (2007).
- (19) Ch. Droste, S.G. Rohozinski, K. Starosta, T. Morek, J. Srebrny, P. Magierski, Nucl. Instr. and Meth. A 378 518 (1996).
- (20) K. Starosta et al., Nucl. Instrum. Methods Phys. Res. A 423, 16 (1999).
- (21) R. Palit et al., PRAMANA - Jour. Phys. 54, 347 (2000).
- (22) Table of Isotopes V 1.0, March 1996, Eds. R.B. Firestone, V.S. Shirley, Wiley-Interscience.
- (23) G. D. Dracoulis, A. P. Byrne, and A. M. Baxter, Phys. Lett. B 432, 37 (1998).
- (24) J. Heese, et al., Phys. Lett. B 302, 390 (1993).
- (25) W. Nazarewicz et al., Nucl. Phys. A 435, 397 (1985).
- (26) W. Nazarewicz et al., Nucl. Phys. A 512, 61 (1990).
- (27) G. Mukherjee et al., Nucl. Phys. A 829, 137 (2009).