On the Link Between Central Black Holes, Bar Dynamics, and Dark Matter Halos in Spiral Galaxies
Abstract
The discovery of a relationship between supermassive black hole (SMBH) mass and spiral arm pitch angle () is evidence that SMBHs are tied to the overall secular evolution of a galaxy. The discovery of SMBHs in late-type galaxies with little or no bulge suggests that an underlying correlation between the dark matter halo concentration and SMBH mass () exists, rather than between the bulge mass and . In this paper we measure using a two-dimensional fast fourier transform and estimate the bar pattern speeds of 40 barred spiral galaxies from the Carnegie-Irvine Galaxy Survey. The pattern speeds were derived by estimating the gravitational potentials of our galaxies from -band images and using them to produce dynamical simulation models. The pattern speeds allow us to identify those galaxies with low central dark halo densities, or fast rotating bars, while provides an estimate of . We find that a wide range of exists in galaxies with low central dark matter halo densities, which appears to support other theoretical results. We also find that galaxies with low central dark halo densities appear to follow more predictable trends in versus de Vaucouleurs morphological type () and bar strength versus than barred galaxies in general. The empirical relationship between and total gravitational mass of a galaxy () allows us to predict the minimum that will be observationally measured of our fast bar galaxies. These predictions will be investigated in a subsequent paper.
keywords:
galaxies: kinematics and dynamics; galaxies: haloes; galaxies: spiral; galaxies: structure; galaxies: fundamental parameters (pattern speed)1 Introduction
The connection between the overall morphology and dynamics of galaxies and the centrally located supermassive black holes (SMBHs) they harbor provides a fundamental constraint in the study of galaxy formation and evolution. One well-known example of this link is seen in the correlation between SMBH mass () and the large-scale stellar velocity dispersion () of the bulge/spheroid encompassing it (Gebhardt et al. 2000; Ferrarese & Merritt 2000). Likewise, the discovery of a relationship between and spiral arm pitch angle (; Seigar et al. 2008) suggests that SMBHs are tied to the overall secular evolution of a galaxy. Seigar et al. (2005, 2006) have already shown that there is a strong correlation between and rotation curve shear rate (), where small values of correspond to large (see their Figure 3) and a large central mass concentration. More recent studies have further indicated that SMBHs are linked to secular processes (e.g. Cisternas et al. 2011, Orban de Xivry et al. 2011).
The stellar velocity dispersion of the bulge/spheroid is commonly linked to (Gebhardt et al. 2000; Ferrarese & Merritt 2000). For example, M33 is a bulgeless late-type galaxy with the lowest nuclear BH mass ever measured with an upper mass limit of 1500 (Gebhardt et al. 2001). The discovery of SMBHs in the centers of late-type galaxies with little or no bulge (Satyapal et al. 2007, 2008) suggests that the size, or mass, of SMBHs may be tied to the dark matter halo virial mass, or concentration (see, e.g., van den Bosch et al. 2007 for a relation). This hints at the cause of the connection and the reason why M33 fits in this relation. Comparisons of the corrected central velocity dispersion with the maximum rotation velocity of disk galaxies also reveal a good correlation between and the mass of the dark matter halo (Ferrarese 2002). Additionally, bulge size and dark halo mass show a direct correlation in general, but the relationship exhibits a lot of scatter (see, e.g., Ho 2007). Recently, Booth & Schaye (2010) have shown through simulations that appears to be linked to halo binding energy rather than the halo mass, with the central halo concentration playing a role in the relationship’s scatter. Other recent papers have also argued both for (Seigar 2011; Volonteri et al. 2011) and against (Kormendy & Bender 2011) a coupling of SMBH masses and the properties of the dark matter halo.
The secular evolution of a barred spiral galaxy is chiefly influenced by the rotation rate of the non-axisymmetric component (e.g., Lynden-Bell & Kalnajs 1972; Kalnajs 1991; Kormendy & Kennicutt 2004). Simulation models have shown that after a bar initially forms, the pattern speed () remains fast when embedded in a dark matter halo with a low central density (Debattista & Sellwood 2000). This is due to reduced dynamical friction between the two components that would otherwise cause a rapid decrease in . also determines the locations of important resonance regions in galaxies with a single perturbation mode, such as a bar or grand design spiral. This allows the rotation of a bar to be described by the ratio , where is the corotation, or 1:1, resonance (CR) radius and is the bar semimajor axis length. When a bar is deemed to be a fast rotator, while implies a slow rotating bar. Theoretical arguments by Contopoulos (1980) state that self-consistent bars must have .
About 50% of all spiral galaxies display either a full, broken, or partial ring shaped pattern in their light distribution (Buta & Combes 1996). Although rings are observed in some non-barred galaxies, they are typically associated with barred galaxies due to the ease at which they form through bar-driven gravity torques (see Grouchy et al. 2010 and references therein). Theoretical arguments suggest that inner rings in barred spiral galaxies are features of the inner ultraharmonic, or 4:1, resonance (IUHR; Schwarz 1984; Byrd et al. 1998). Athanassoula et al. (1982) have discussed that for a flat rotation curve, where , the ratio of the outer Lindblad, or 2:1, resonance (OLR) to IUHR radius is
| (1) |
while the ratio of the OLR to CR radius is
| (2) |
This implies that the ratio of the CR to IUHR radius is
| (3) |
Since bars are encircled by inner rings, if present, must be similar to the inner ring radius. This suggests that or that bars are slow rotators in general. Statistics of observational data show that the median ratio of outer to inner ring diameter is 2.2 (Buta 1995) or the approximate mean of the theoretical OLR:IUHR and OLR:CR values. If outer rings in general can be linked to the OLR, this suggests a nearly even distribution of galaxies with fast or slow bars. Recent evidence suggests that outer rings may not always be linked to the OLR as expected though (Treuthardt et al. 2008).
, or , can be estimated using a number of methods (e.g., Canzian 1993; Buta & Combes 1996; Puerari & Dottori 1997; Salo et al. 1999; Weiner et al. 2001; Egusa et al. 2004; Zhang & Buta 2007) with the most direct being that of Tremaine & Weinberg (1984; TW). Much emphasis has been placed on this method recently but it has been suggested that morphological matching through dynamical simulations yield similar estimates while lacking the limited applicabilty of the TW method (Treuthardt et al. 2009).
The goal of our study is to estimate the bar pattern speeds and measure the spiral arm pitch angles of 40 barred spiral galaxies. This will indicate which of these galaxies have low central dark halo densities and provide an estimate of the central SMBH mass, respectively. Based on the simulation results of Booth & Schaye (2010), we expect to find that for a given halo mass, SMBHs in galaxies with fast bars will have a less-than-average mass due to anemic growth within the low central density dark halo. This means that the total luminous and dark mass of these galaxies () predicted from the relationship (Bandara et al. 2009) would be the minimum expected observationally measured value. We will investigate this claim with measurements of in a forthcoming paper.
2 Analysis
2.1 Pitch Angle Measurements
-band images from the Carnegie-Irvine Galaxy Survey (CGS; Ho et al. 2011) were used to determine for our sample of barred spiral galaxies, since has been shown to be independent of the wavelength at which it is measured (Seigar et al. 2006). These deep, high resolution images highlight the young stellar component of the spiral arms and offer a larger field of view than the -band images, thereby revealing more of the outer spiral structure of each galaxy. The orientation and ellipticity values of the outer -band isophotes were determined with ELLIPSE in IRAF and used to derive an inclination (Hubble 1926; see Table 1). The images were then deprojected to face-on by assuming that spiral galaxy disks are intrinsically circular. Additionally, the output from ELLIPSE was used to estimate in each galaxy. The radius, near the visible ends of the bar, where the ellipticity reaches a maximum was selected as .
| Galaxy | |||||||||
|---|---|---|---|---|---|---|---|---|---|
| (1) | (2) | (3) | (4) | (5) | (6) | (7) | (8) | (9) | (10) |
| ESO 121-026 | 49.8 | 20.2 (3.13) | 22.3 | 1.38 0.05 | 10.5 1.2a | 343 119 | 38.3 8.0 | 3.9 0.4 | 0.258 |
| ESO 380-001 | 60.7 | 65.5 (1.29) | 25.3 | 1.48 0.06 | 32.3 2.0 | 12.6 2.8 | 4.55 1.39 | 2.8 0.7 | 0.318 |
| ESO 506-004 | 62.9 | 15.0 (4.28) | 37.4 | 1.74 0.08 | 14.0 1.0 | 148 31 | 22.3 0.3 | 2.5 1.0 | 0.131 |
| IC 1953 | 48.2 | 29.3 (3.37) | 15.8 | 1.83 0.06 | 33.0 1.6 | 11.7 2.2 | 4.33 1.46 | 6.1 0.9 | 0.380 |
| IC 2367 | 40.9 | 15.5 (2.77) | 26.4 | 2.24 0.06 | 15.8 0.7 | 104 14 | 17.8 1.8 | 3.1 0.7 | 0.265 |
| IC 2560 | 61.7 | 39.9 (8.50) | 45.3 | 1.47 0.06 | 28.4 4.2 | 18.7 8.9 | 5.88 0.54 | 3.4 0.6 | 0.112 |
| IC 5240 | 48.3 | 39.6 (4.04) | 19.4 | 1.50 0.06 | 24.4 0.9 | 29.2 3.2 | 7.83 2.15 | 1.0 0.3 | 0.193 |
| IC 5273 | 48.3 | 23.3 (1.58) | 12.6 | 1.59 0.07 | 33.5 2.8 | 11.0 4.1 | 4.17 0.91 | 5.7 0.9 | 0.258 |
| NGC 0151 | 63.7 | 18.1 (4.05) | 49.9 | 1.40 0.06 | 36.1 1.5a | 6.98 2.71 | 3.11 0.81 | 4.0 0.5 | 0.105 |
| NGC 0337 | 41.2 | 14.8 (1.30) | 15.6 | 1.27 0.07 | 32.9 1.4 | 11.8 1.9 | 4.36 1.54∗ | 6.7 0.8 | 0.800 |
| NGC 0782 | 30.6 | 22.8 (8.87) | 57.3 | 1.36 0.06 | 23.7 1.9 | 31.8 7.6 | 8.27 1.49 | 3.0 0.3 | 0.126 |
| NGC 0945 | 41.0 | 17.6 (4.89) | 34.1 | 1.66 0.06 | 15.5 1.3 | 110 28 | 18.4 0.4 | 5.0 0.5 | 0.301 |
| NGC 1022 | 20.5 | 18.4 (1.49) | 12.5 | 1.87 0.06 | 13.7 3.9 | 158 172 | 23.2 17.9 | 1.1 0.3 | 0.122 |
| NGC 1317 | 28.3 | 6.5 (0.787) | 22.4 | 1.84 0.06 | 10.0 0.6 | 395 70 | 42.0 4.6 | 0.8 0.5 | 0.040 |
| NGC 1723 | 39.4 | 18.9 (4.61) | 44.2 | 1.87 0.06 | 21.3 3.4 | 43.4 22.0 | 10.1 0.8 | 1.2 0.6 | 0.115 |
| NGC 1832 | 41.0 | 12.7 (1.64) | 19.0 | 1.61 0.08 | 25.3 6.1 | 26.3 22.5 | 7.31 2.10 | 4.0 0.1 | 0.226 |
| NGC 2223 | 24.2 | 18.6 (3.48) | 31.6 | 1.58 0.06 | 22.8 3.5 | 35.6 17.2 | 8.90 0.73 | 3.8 0.9 | 0.095 |
| NGC 2525 | 44.0 | 14.2 (1.72) | 22.4 | 1.78 0.06 | 22.9 1.9 | 35.1 8.7 | 8.82 1.43 | 5.2 0.5 | 0.231 |
| NGC 2763 | 36.5 | 4.1 (0.595) | 21.4 | 1.67 0.08 | 20.5 2.5 | 48.6 18.1 | 10.9 0.6 | 5.7 0.7 | 0.235 |
| NGC 3124 | 35.5 | 15.0 (3.84) | 41.3 | 1.33 0.05 | 20.5 1.9 | 48.6 13.5 | 10.9 1.1∗ | 3.9 0.5 | 0.209 |
| NGC 3275 | 28.2 | 18.6 (4.24) | 38.6 | 1.43 0.06 | 30.0b | 15.9 | 5.29 2.21 | 1.9 0.5 | 0.108 |
| NGC 3347 | 33.7 | 13.0 (2.83) | 53.3 | 1.73 0.05 | 37.8 4.1 | 3.63 5.35 | 2.04 1.06 | 3.5 0.8 | 0.116 |
| NGC 3450 | 20.2 | 25.1 (7.18) | 45.1 | 1.65 0.06 | 11.8 0.4a | 244 24 | 30.8 0.3 | 3.1 0.4 | 0.152 |
| NGC 3513 | 40.5 | 24.1 (2.46) | 17.2 | 1.24 0.07 | 26.7 3.6a | 22.4 9.4 | 6.61 0.66∗ | 5.1 0.4 | 0.540 |
| NGC 3660 | 42.4 | 16.3 (4.32) | 40.9 | 1.75 0.10 | 20.4 2.3 | 49.3 16.9 | 11.0 0.6 | 3.9 0.5 | 0.145 |
| NGC 3887 | 49.1 | 16.8 (1.75) | 20.2 | 1.89 0.08 | 24.7 3.7a | 28.2 13.3 | 7.65 0.64 | 3.9 0.5 | 0.143 |
| NGC 4050 | 50.0 | 30.0 (4.20) | 28.5 | 1.65 0.06 | 8.9 1.2a | 555 232 | 52.4 17.2 | 2.1 0.6 | 0.203 |
| NGC 4593 | 45.3 | 57.0 (11.4) | 28.8 | 1.23 0.06 | 22.9 3.8 | 35.1 18.6 | 8.82 0.82∗ | 3.0 0.4 | 0.181 |
| NGC 5135 | 28.4 | 33.2 (9.53) | 41.3 | 1.27 0.06 | 15.8 1.5 | 104 30 | 17.8 0.5∗ | 2.4 0.6 | 0.099 |
| NGC 5156 | 17.1 | 9.3 (1.96) | 31.8 | 1.61 0.11 | 20.9 1.6 | 45.9 10.5 | 10.5 1.5 | 3.5 0.9 | 0.239 |
| NGC 5339 | 40.0 | 26.9 (5.33) | 21.6 | 1.75 0.08 | 16.2 2.0 | 96.6 36.6 | 16.9 0.9 | 1.0 0.5 | 0.255 |
| NGC 5728 | 53.3 | 43.8 (8.72) | 37.8 | 1.56 0.06 | 10.3 2.3 | 362 278 | 39.8 21.4 | 1.2 0.7 | 0.232 |
| NGC 5938 | 28.3 | 23.1 (5.47) | 32.6 | 1.64 0.06 | 36.1 9.3 | 7.0 11.1 | 3.11 1.73 | 4.3 0.6 | 0.151 |
| NGC 6782 | 23.1 | 26.7 (6.76) | 37.3 | 1.20 0.06 | 13.4 1.2 | 168 45 | 24.2 1.3∗ | 1.0 0.9 | 0.060 |
| NGC 6923 | 50.8 | 11.7 (2.00) | 25.8 | 1.31 0.06 | 23.4 3.7 | 33.0 16.5 | 8.47 0.74∗ | 3.1 0.6 | 0.076 |
| NGC 7059 | 71.1 | 41.7 (4.42) | 23.6 | 1.72 0.08 | 17.5 1.3 | 77.1 17.0 | 14.6 1.2 | 5.7 1.0 | 0.210 |
| NGC 7070 | 35.4 | 10.4 (1.49) | 21.6 | 1.67 0.16 | 30.2 5.0 | 15.6 9.0 | 5.22 0.67 | 6.0 0.3 | 0.183 |
| NGC 7218 | 66.5 | 8.8 (0.774) | 13.6 | 1.52 0.06 | 34.3 10.4 | 9.9 15.5 | 3.89 2.27 | 5.6 1.2 | 0.254 |
| NGC 7392 | 55.7 | 19.2 (3.61) | 25.3 | 1.44 0.06 | 24.6 2.0a | 28.5 6.9 | 7.71 1.47 | 3.8 0.7 | 0.177 |
| NGC 7723 | 48.5 | 18.9 (1.91) | 25.2 | 1.44 0.06 | 15.7 2.3a | 106 49 | 18.0 2.2 | 3.1 0.5 | 0.243 |
Explanation of columns: (1) Galaxy designation; (2) inclination in degrees derived from fitting ellipses to -band isophotes; (3) bar semimajor axis length in the sky plane, estimated from ellipse fitting, and measured in arcseconds and converted to kpc (paranthetical values) using the default (i.e. , , and ) cosmology-corrected scaling factors from NED; (4) average isophotal diameters at 25 mag/arcsec2 in the -band taken from HyperLeda (Paturel et al. 2003) and converted to kpc as in (3); (5) estimated value and 1 error of ; (6) spiral arm pitch angle measured by the authors of this paper, aSeigar et al. 2006, or by bBlock et al. 1999; (7) SMBH mass and mean error in solar masses derived from using equation 2 of Seigar et al. 2008; (8) total mass of the galaxy and mean error in solar masses derived from using equation 8 of Bandara et al. 2009 (∗indicates an estimated minimum halo mass due to according to Booth & Schaye 2010); (9) de Vaucouleur morphological type index from HyperLeda (Paturel et al. 2003); (10) the maximum of in the bar region estimated from mass models derived from -band images.
was measured using two-dimensional fast Fourier decompositions of the deprojected -band images and assuming logarithmic spirals (Schröder et al. 1994; see Table 1). The Fourier fits were applied to visually selected annulus regions that range from just beyond the ends of the bars to the outer limits of the visible arms. is then determined from peaks in the Fourier spectra as this is the most powerful method for finding periodicity in a distribution (Considère & Athanassoula 1988; Garcia-Gomez & Athanassoula 1993). The largest source of error in measuring presumably comes from this selection of radial range (Seigar et al. 2005, 2008), but galaxies with large inclinations ( 60∘) also have variances in of 10% (Block et al. 1999). For details on how accurate our method is for measuring , see Davis et al. (2012).
2.2 Determining the Potential
Attempting to recreate the observed morphologies of our sample of galaxies through simulation modeling requires us to first derive gravitiatonal potentials. Assuming that the near-IR light distribution follows the mass distribution, we applied a mass-to-light ratio () correction to the CGS near-IR -band images of our galaxies to obtain surface mass densities. The correction was estimated from the azimuthally averaged CGS color index of each galaxy and applying the -band correction given by Bell et al. (2003).
Next, a two-dimensional iterative bulge-bar-disk decomposition program (see Laurikainen et al. 2004 for a description) was applied in order to more accurately model the bulge component of the galaxies. The bulge component was then removed, each galaxy was deprojected to a face-on orientation, and the bulge was then added back in. We assume the bulges to be spherical, so this process eliminates any bulge stretching from the deprojection process.
The deprojected image was then approximated by the Fourier decomposition method described by Laurikainen & Salo (2002) and the disk gravity was derived from the even to components. The empirically derived ratio of vertical to radial scalelength corresponding to morphological type (de Grijs 1998) was used to apply a constant scaleheight throughout the disk. Our mass models also include a dark halo component based on the universal rotation curve of Persic et al. (1996). The halo profile was calculated using derived from HyperLeda (Paturel et al. 2003) data and the average distances calculated from NED (NASA/IPAC Extragalactic Database) data.
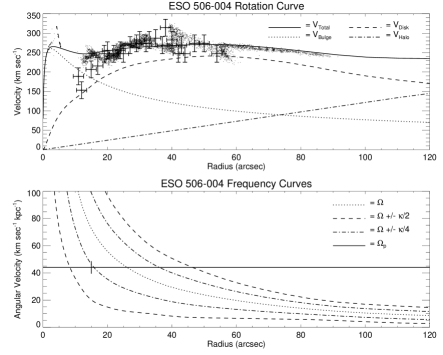
A limited amount of kinematic data exists for our sample of galaxies (Mathewson et al. 1992; Márquez et al. 2004; Catinella et al. 2005). What data we have are chiefly in the form of H rotation curves which only extend to about 80% of the visible galaxy disk (Mathewson et al. 1992) and do not extend into the dark matter dominated regions of our mass models. The available data, therefore, does little to constrain the outer mass-modeled circular speed curves. The upper plot of Figure 1 shows an example of azimuthally averaged circular speed curve derived from the mass model of ESO 506-004. The mass model was scaled so that the circular speed curve would more accurately fit the rotation curve data derived from Figure 3 of Mathewson et al. (1992). The lower plot in Figure 1 shows the Lindblad precession frequency curves derived from the circular speed curve. Our estimate of , average error, and bar semimajor axis radius for this galaxy are overlayed. The radial regions where specific resonances in the linear (epicyclic) approximation are located are indicated where the horizontal line corresponding to intersects each frequency curve. For this galaxy, we estimate that the bar extends to the IUHR and not to the CR.
Once gravitational potentials were determined for our sample, we were also able to estimate the strength of the bar in each galaxy. This was done by calculating two dimensional maps of the radial () and tangential () forces. The tangential forces induced by the bar were calculated using a Polar method discussed by Laurikainen & Salo (2002) and Laurikainen et al. (2004). The Polar method was applied to an azimuthal Fourier decomposition of the intensity and the even components, up to m = 20, were then converted to the corresponding potential components (Salo et al. 1999). The ratio of the maximum of to the azimuthally averaged at each radius produces a radial profile of the distance dependent maximum tangential force. The maximum of the this profile gives a single measure of the bar strength, . , however, can be affected by spiral arm torques, making it a convolution of the bar () and spiral strength (; Buta et al. 2005). Therefore, can be thought of, at worst, as an upper limit to the true bar strength, .
2.3 Simulations
Our sample of galaxies was modeled by simulating the behaviour of a two-dimensional disk of inelastically colliding (or “sticky”), non-self-gravitating gas particles in our predetermined potentials. The details of the simulation code we used can be found in Salo et al. (1999) and Salo (1991). The advantage of using a sticky particle code over a smoothed particle hydrodynamic (SPH) code, for example, is that it better approximates the cold gas component of a galaxy (Merlin & Chiosi 2007). In SPH, gas particles are subject to nongravitational forces, such as pressure gradients, making it better suited for modeling the warm gas phase. Therefore, it is appropriate to use sticky particle models for matching observed morphological components containing star formation, such as resonance rings and spiral arms. The overall modeling process closely followed that of Treuthardt et al. (2009). For example, we produced snapshots of 100,000 gas particles at the bar rotation period of interest by simulating the behaviour of a two-dimensional disk of 20,000 gas particles and aligning and coadding individual snapshots within 0.2 bar rotation periods in 0.1 period increments. We also assumed that each galaxy has only one pattern speed, that of the bar, and was the main parameter that was varied. With an estimate of and using the Lindblad precession frequency curves derived from our potentials, we are able to link to via . In doing so, we varied by allowing to increase from 1.0 by increments of 0.1. Treuthardt et al. (2008) investigated the morphological effects of differing the gravitational potential used in the simulations of NGC 1433. They found that the different M/L models of Bell & de Jong (2001) had little effect on the modeled morphology of the galaxy. The amplitude of the bar potential was also incrementally altered in order to account for possible uncertainties in the bar height or halo contribution. The morphology of the resultant models were markedly different from each other in terms of inner ring shape and outer spiral morphology (see Figure 9 of Treuthardt et al. 2008). This implies that the use of grossly inaccurate gravitational potentials will not produce models with morphologies that can be easily matched to observations. Further examples of morphological variation within sticky particle models of a galaxy can be found in Treuthardt et al. (2008).
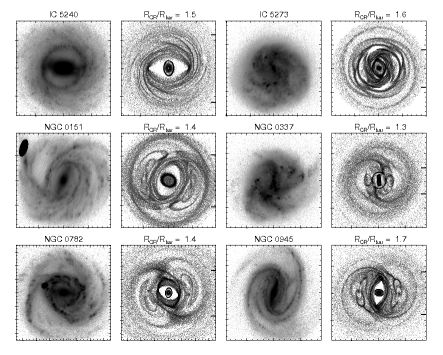
The best fitting of each galaxy was determined by visually comparing the observed -band morphology to that produced in a series of models. Deep -band images with good resolution are ideal for comparing observed low velocity dispersion, young stellar components, such as resonance rings, to our models. In our simulations, the viscosity within various regions of the gas particle system may not be comparable to real systems, meaning features seen in the simulation snapshots can correspond to different physical timescales in different regions. With that in mind, we primarily compared the morphology in the region near the ends of the bar (such as the size and shape of any inner rings) but also considered the outer spiral structure, especially any outer ring features. Since we are dealing with gas particle simulations of barred spiral galaxies, areas within the bar region of our models tend to be void of gas particles and are not considered in matching with the observed images. Four independent estimates of the model morphology that best matches the observed morphology were used to determine the weighted average value and 1 error of given in Table 1. In some cases a slower provided a better fit to the outer spiral structure while a faster provided a better fit to the inner structure. This is not unexpected since N-body simulations have shown that the spiral component may have a slower pattern speed then that of the bar (e.g. Rautiainen & Salo 1999). This may be the reason why we tend to find few galaxies in our sample with convincingly fast bars. Figure 2 shows the deprojected -band and best model images corresponding to our estimated . Subsection provides brief discussions on the individual galaxies and the corresponding models.
A number of our sample galaxies appear to have dust lanes along the bar major axis when examined in the high resolution -band images from CGS. We make a note of these dust lanes below in the comments on individual galaxies. Athanassoula (1992) has experimented with two-dimensional time-dependent hydrodynamical simulations that produce dust lanes in barred spiral galaxies. The gravitational potentials used in the simulations consist of two axisymmetric components, which approximate the bulge and disk potential, and a Ferrers ellipsoid, which approximates the bar potential. A dark halo component was not included in the models. Based on the dust lane morphology observed in her models, Athanassoula concludes that bars containing dust lanes must be in the fast domain (). She claims the convex curvature of dust lanes shown in her slow bar models are not observed in real galaxies and concludes that slow bars do not exist. The diffuse nature of the few dust lanes seen in our sample of galaxies generally makes the morphology of the dust lanes difficult to determine visually.
![[Uncaptioned image]](/html/1204.4210/assets/x2.png)
![[Uncaptioned image]](/html/1204.4210/assets/x4.png)
![[Uncaptioned image]](/html/1204.4210/assets/x5.png)
![[Uncaptioned image]](/html/1204.4210/assets/x6.png)
![[Uncaptioned image]](/html/1204.4210/assets/x7.png)
![[Uncaptioned image]](/html/1204.4210/assets/x8.png)
2.3.1 Comments on Individual Galaxies
ESO 121-026: Our best models were not able to reproduce the outer flocculent arms of this SB(rs)bc galaxy (de Vaucouleurs et al. 1991). The inner ring, however, is well matched by the model shown in Figure 2. The model also displays a pointy ring elongated perpendicularly to the major axis and encircling the inner ring. This pointy ring is also seen in the observed image. The -band image displays a possible diffuse dust lane extending along only the bottom half of the bar’s major axis.
ESO 380-001: The inner pseudoring and faint outer ring of this galaxy, seen in the -band image, is reflected in the (R′)SB(s)b classification by de Vaucouleurs et al. (1991). In the observed image, the spiral arms can be traced from their origin at the ends of the bar, through their clockwise winding around the bar, and finally transitioning into the outer ring. Our models display a similar morphology but also include an obvious inner ring. This may be hinted at in the -band near the bar end closest to the bottom of the image. Symmetric dust lanes are also seen extending along the major axis of the bar in the -band image.
ESO 506-004: The model shown for this SAB(r)ab galaxy (de Vaucouleurs et al. 1991) displays a good match to the observed inner ring and the strong spiral arm originating at the left end of the inner ring major axis.
IC 1953: Our models of this SB(rs)d galaxy (de Vaucouleurs et al. 1991) produce a series of nested rings surrounded by outer flocculent arms. The outermost modeled ring is a hexagonal structure whose major axis appears rotated slightly counter-clockwise to the bar major axis. Hints of this outer most ring structure along the major axis is seen in the -band image. Within this elongated hexagonal ring is a nearly circular ring surrounding a ring elongated along the bar major axis. Hints of this nearly circular ring, but not the inner elongated ring, are also present in the observed image.
IC 2367: The size and extent of the inner ring of this SB(r)b galaxy (de Vaucouleurs et al. 1991) is well matched by the model shown.
IC 2560: The inner ring of this (R′)SB(r)b galaxy (de Vaucouleurs et al. 1991) is well reproduced by our best estimate model. Also, there appear to be dust lanes running along the major axis of the bar when viewed in the -band.
IC 5240: Buta et al. (2007) classify this galaxy as SB(r)a with a clear inner ring and flocculent exterior spiral structure. Upon closer inspection, the upper half of the inner ring appears to consist of three straight arm segments. Our simulations fail to produce models that directly recreate the strong, nearly circular inner ring seen in the deprojected -band image. Our best model does approximate the inner ring morphology from a series of disjointed spiral arms. There appears to be a dust lane along only the right half of the bar’s major axis which extends into dust in the inner ring.
IC 5273: The -band image of this SB(rs)cd galaxy (de Vaucouleurs et al. 1991) does not display any obvious resonance features such as rings. We attempted to match the inner spiral arms, near the bar semimajor axis length, of our models to that in the observed image. For example, the observed spiral arm originating near the bottom end of the bar major axis is matched in our given model.
NGC 0151: Our models are not able to recreate the asymmetry observed in the outer spiral structure of this SB(rs)bc galaxy (Buta et al. 2007) since only the even Fourier values were used to calculate the disk gravity. This causes our models to be bisymmetric. Our estimate of came from matching the the observed and modeled inner ring morphology.
NGC 0337: This SB(s)d galaxy (de Vaucouleurs et al. 1991) has the strongest bar of our sample (). Our models produce a small inner ring not visible in the -band image. Our estimates of were based on comparing the modeled and Lagrangian regions and the morphology of the spiral arms extending from the inner ring to that in the observed image.
NGC 0782: This SB(r)b galaxy (de Vaucouleurs et al. 1991) appears to be a three armed system when observed in the -band. As was discussed regarding NGC 0151, our models are necessarily bisymmetric and will not produce three armed systems. Our best estimate of came from attempting to match the inner rings and the arm structure originating at the bottom of the inner ring in both the observed and modeled image.
NGC 0945: de Vaucouleurs et al. (1991) classify this galaxy as SB(rs)c. Our models are able to reproduce the shape and size of the observed inner ring but the outer spiral structure is more open than seen in the observed image. This may be the result of NGC 0948 which is visually nearby and classified as having an uncertain SB(s)c morphology (de Vaucouleurs et al. 1991). NGC 0945 also appears to have asymmetrical dust lanes running along the length of the bar major axis.
NGC 1022: Buta et al. (2007) classify this galaxy as a peculiar (R)SB(rs)a. Our model, corresponding to our best estimate of , provides a good match to both the inner and outer ring morphology.
NGC 1317: Buta et al. (2007) describe this galaxy as having a double-barred morphology and classify it as (R′)SAB(rl)a. We attempted to recreate the observed morphology by varying of the nuclear bar, which is the weakest in our sample (), rather than the less prominent broad oval, or primary bar. Our models produced a tight spiral structure around the nuclear bar with a higher density of gas particles on the leading edge of the spiral and a lower density on the trailing edge. We matched the lower density trailing edge of our models to the gaps seen in the -band emission surrounding the nuclear bar region. Sticky-particle modeling of this galaxy by Rautiainen et al. (2008) led to an estimate of , nearly half of our estimate. Although Rautiainen et al. (2008) do not comment on this specific galaxy, it is apparent from Figure 4 of their paper that their models were produced by varying of the broad oval rather than the nuclear bar. The nuclear bar does not display any apparent dust lanes, but a nearly symmetrical dust spiral is seen in the broad oval region.
NGC 1723: This peculiar SB(r)a galaxy (de Vaucouleurs et al. 1991) may be the product of an interaction with a nearby galaxy. The fact that one of the outer spiral arms extends and curves toward a smaller field galaxy in our raw -band image is apparent evidence for this. Our simulations were not able to recreate the observed outer spiral structure or the slightly oblong nature of the inner ring seen in our deprojected image. The model corresponding to our weighted mean value of contains an inner ring of similar size to the observed inner ring. Larger or smaller values of result in models with larger or smaller inner rings, respectively.
NGC 1832: de Vaucouleurs et al. (1991) classify this galaxy as SB(r)bc. Our model, corresponding to our weighted mean estimate of , produces an inner ring of similar extent to that seen in the observed image. The inner ring in the -band image may be the result of gas circulating along so called “banana” orbits around the and Lagrangian points. This is also seen in our model, but the density of gas particles is not very large in the portions of these orbits that bring them close to the bar. Rautiainen et al. (2008) estimate to be from their sticky-particle simulations using the same code as the current simulations. Within the errors, this coincides with our estimate of .
NGC 2223: Our model of this SAB(r)b galaxy (de Vaucouleurs et al. 1991) produces a strong inner ring of the same size and extent as the one that is hinted at in -band image. Our model also recreates the inner spiral arm structure observed just beyond the ends of the inner ring major axis.
NGC 2525: This SB(s)c galaxy (de Vaucouleurs et al. 1991) is well matched by our model. The size and position of the modeled and Lagrange regions duplicate that seen in the -band image. The modeled spiral structure also closely matches the observations, although the gas particle density is not high.
NGC 2763: de Vaucouleurs et al. (1991) classify this galaxy as a peculiar SB(r)cd. The simulation model of this galaxy, shown in Figure 2, is the weighted mean of individually estimated values ranging from to .
NGC 3124: Buta et al. (2007) classify this galaxy as SB(r)bc. This galaxy does not host a traditional bar but rather a bar-spiral hybrid winding in the opposite sense as the outer spiral arms. This is especially apparent in the -band image. Our models do not reproduce the nearly circular looking inner ring seen in the -band but rather approximate it as a pair of disjointed spiral arms. A one-armed dust spiral is seen in the -band winding in the same sense as the stellar spiral arms. This one-armed dust spiral is seen crossing the left semi-major axis of the bar.
NGC 3275: The apparent inner ring seen in the -band image of this SB(r)ab galaxy (Buta et al. 2007) is recreated by our best estimate model in the form of spiral arm segments outside of a true inner ring. A faint hint of a thin “true” inner ring is seen in the observed image near the left end of the bar, inside the apparent inner ring. A morphological match is also seen when comparing the outer spiral arm that originates from near the right end of the bar. Models produced by Rautiainen et al. (2008) estimate which coincides with our estimated value within the errors. The -band image of this galaxy shows diffuse, nearly symmetrical dust lanes and spirals in the bar region. The dust lanes are originate near the ends of the bar and transition into spirals at the bar ends.
NGC 3347: Our assumption of intrinsically circular galaxy disks does not appear to be valid for this galaxy which leads to a somewhat unrealistic deprojected image. NGC 3347 is a member of a group (Garcia 1993) and appears, in the CGS images, to be interacting with a nearby peculiar spiral galaxy of uncertain morphology (NGC 3354; de Vaucouleurs et al. 1991). Our simulation models were not able to recreate the tightly wrapped outer spiral arms of this SB(rs)b galaxy (de Vaucouleurs et al. 1991). The shape and extent of the modeled inner ring closely matches that surrounding the observed bar.
NGC 3450: The observed morphology of this SB(rs)b galaxy (Buta et al. 2007) is well matched by our model. The inner ring, as well as the outer spiral structure, appear to agree in both the observed and modeled image. A dust lane elongated nearly perpendicular to the semi-major axis of the lower left end of the bar is seen in the -band image.
NGC 3513: This galaxy is classified as SB(s)c by Buta et al. (2007) and contains one of the strongest bars of our sample (; see Table 1). Our simulations were unable to easily reproduce the main spiral arms alone. Instead, most of our gas particle models show diffuse arms emanating perpendicularly to the bar from an apparent nuclear ring. In the model associated with our weighted average estimate of , a smaller number of gas particles also appear to emanate from this ring, run parallel to the bar, curve around the bar ends, and finally reconnect to the stronger, more diffuse arms on the opposite side of the ring. This less prominant gas particle distribution more closely resembles the observed morphology than the more obvious gas particle distribution. Sticky-particle modeling by Rautiainen et al. (2008) produces an estimate of . Our estimate of falls within the error of Rautiainen et al.’s estimate.
NGC 3660: Recreating the outer spiral arm morphology of this SB(r)bc galaxy (Buta et al. 2007) proved to be difficult. Our weighted mean estimate of , or , provides a good morphological match of the inner ring between both the observation and the model. The -band image shows faint, symmetrical, and diffuse dust lanes running along the major axis of the bar.
NGC 3887: Our models of this SB(rs)bc galaxy (Buta et al. 2007) produce an inner ring that is not visible in the -band image. The extent the inner ring shown in our model does correspond to the extent of the straight portion of the symmetrical dust lanes seen along the major axis of the bar. The turn-over radius of these dust lanes is similar to the inner ring semimajor axis length. The outer spiral structure also approximates the observed spiral structure near the bar.
NGC 4050: The morphology of this SB(r)ab galaxy (de Vaucouleurs et al. 1991) is well matched by our model. Both the inner ring and the outer spiral structure appear to agree. A single diffuse dust lane is seen in the -band running from the nucleus along the right bar semi-major axis.
NGC 4593: Buta et al. (2007) classify this galaxy as (R′)SB(rs)ab. Our model does well to approximate the shape and extent of the inner and outer ring. The outer ring appears to be due to gas trapped in “banana” orbits and circulating around the and Lagrangian regions, as was seen in the simulation models of NGC 1433 (Treuthardt et al. 2008). The observed image of NGC 4593 also shows an apparent “plume”, similar to those seen in NGC 1433, near the leading edge of the bar and in the upper left quadrant of the -band image. Our model also produces a linear component to the “banana” orbits, close to the outer boundary of the inner ring. This feature is also seen in lower half of the observed image. A strong dust lane is seen along the upper left semi-major axis of the bar, while a fainter, more diffuse dust lane is seen along the opposite semi-major axis.
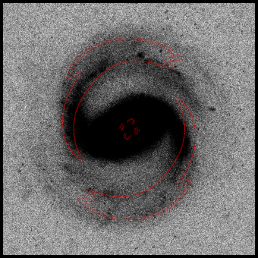
NGC 5135: This SB(s)ab galaxy (de Vaucouleurs et al. 1991) was well matched by our model. Both the inner ring and outer spiral morphology are reproduced. The inner regions of this galaxy display a lot of dust in the -band, but no dust lanes are apparent.
NGC 5156: We were not able to reproduce the overall outer spiral structure observed in this SB(r)b galaxy (de Vaucouleurs et al. 1991). Determining a good morphological match to the inner ring also proved to be difficult as our estimates of ranged from to . The model we show, corresponding to the weighted mean of our values, does approximate the two observed spiral arms closest to the bar, in the lower half of the image.
NGC 5339: This peculiar SB(rs)a galaxy (de Vaucouleurs et al. 1991) is well matched by our model. The outer spiral arm morphology is recreated by a series of arms that form a slight hexagonal pattern. The extent and shape of the inner ring is also approximated. Nearly symmetrical dust lanes are seen in the -band along the major axis of the bar.
NGC 5728: The inner ring of this (R1)SAB(r)a galaxy (Buta et al. 2007) is reproduced by our model. An outer ring is also created by our simulation, but the observed ring is much more circular in the deprojected image. Symmetrical dust lanes are also seen along the bar major axis when viewed in the -band.
NGC 5938: A large number of foreground stars are in the field of this SB(rs)bc galaxy (de Vaucouleurs et al. 1991). Those stars that could not be blended to the background where masked, leaving obvious artifacts in the image. The spiral structure far from the bar is not well matched by our model. The left side of the observed apparent inner ring is matched by our modeled inner ring. The right side of the observed apparent inner ring is better matched by the modeled spiral arm originating just outside the inner ring.
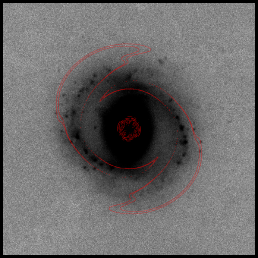
NGC 6782: This galaxy is classified as (R1R)SB(r)a by Buta et al. (2007). The outer ring features are best fit by while the inner ring is best fit by . In either case, the bar is still classified as fast. For this galaxy, Rautiainen et al. (2008) estimate but they were not able to recreate the outer pseudo-ring in their models. Our models display this outer pseudo-ring with a very similar value of . Lin et al. (2008) produced two-dimensional hydrodynamical simulations of this galaxy and were able to recreate the symmetric dust lanes observed in the -band. They, however, found to be 1.5.
NGC 6923: Our model morphology matches the observed inner ring and lower spiral arm of this SB(rs)b galaxy (de Vaucouleurs et al. 1991).
NGC 7059: This highly inclined (; see Table 1) SAB(rs)c (de Vaucouleurs et al. 1991) galaxy displays little structure in its deprojected -band morphology that could be thought of as an unambiguous, organized product of . All of our simulations produce models with a clear inner ring which is not evident in the -band. Many of our models also display four low particle density spiral arms extending from near the ends of the major axis of the inner ring. This spiral structure may, debatably, be hinted at in the deprojected -band image. Consequently, the weighted mean of our best morphological matching estimates () was determined from individual estimates ranging from to .
NGC 7070: de Vaucouleurs et al. (1991) classifies this galaxy as a non-barred SA(s)cd. Both the and -band images show a clear, highly elliptical structure at the galaxy’s center. We attempted to match the observed spiral arm morphology, but this galaxy’s flocculent structure and lack of any obvious resonance features induced a large amount of error in our estimates. The errors of our individual estimates ranged from .
NGC 7218: The morphology of the pair of spiral arms originating from the left end of the observed bar of this SB(rs)cd galaxy (de Vaucouleurs et al. 1991) is approximated by our model. The more tightly wound of these arms appears to connect to a Lagrange region, and continue on to form a wider, more diffuse, and more open spiral arm in our model. The origin point of this wider arm may be seen near the upper right end of the bar in the -band image.
NGC 7392: A central oval component of this SA(s)bc galaxy (de Vaucouleurs et al. 1991) is more apparent in the -band image than in the -band. Our model does well to match the inner pseudo ring, as well as the outer spiral structure. Particularly, our model provides a morphological match to a looping ring seen in the upper half of the galaxy image. Faint, asymmetrical dust lanes are seen in the -band along the major axis of the central oval.
NGC 7723: Buta et al. (2007) classify this galaxy as SB(rs)b. Our model is able to recreate the inner ring and outer spiral structure from a series of complete and segmented spiral arms. Modeling by Rautiainen et al. (2008) produce an estimate of which coincides with our model-based estimate within the errors. Dust lanes are seen in the -band image of this galaxy. The dust lane that runs along the leading edge of the right semi-major bar axis is quite apparent and linear. The dust lane running along the opposite end of the bar appears to originate from the trailing side of the bar and cross to the leading side.
3 Results and Discussion
Booth & Schaye (2010) have developed models of black hole growth in galaxies that appear to reproduce the empirical relationship found between black hole mass and halo mass (Bandara et al. 2009; see figure 3 of Booth & Schaye 2010). The implication from their models is that galaxies with low dark halo concentrations will host SMBHs with a range of masses, but they will be less massive than average for a given halo mass (see Figure 3).

A simple, easily applicable tool for determining the SMBH mass of nearby spiral galaxies is through the relationship between and found by Seigar et al. (2008). The relationship is fit by Seigar et al. (2008) using a double-power-law model given as
| (4) |
where is the slope of the power law for large pitch angles, is the slope of the power law for small pitch angles, is the transition from small to large pitch angles, governs the sharpness of the transition, and is the black hole mass for a pitch angle . The values of the parameters that provide this best fit model are , , , , and (see equation 2 of Seigar et al. 2008). Other model fits have also been suggested such as a linear (Seigar et al. 2008) or cotangent relation (Ringermacher & Mead 2009).
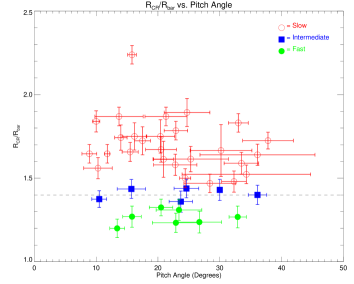
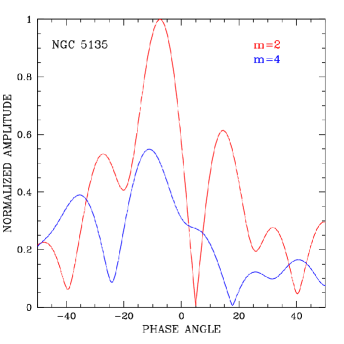
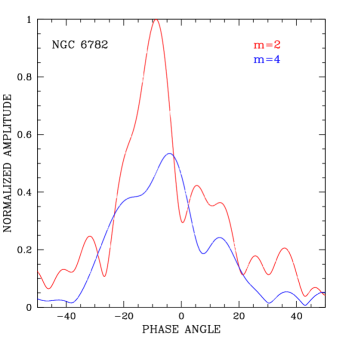
In Figure 4 (left) we plot our estimated values of versus our measurements of pitch angle. There does not appear to be any correlation between either fast, intermediate, or slow bar pattern speed and pitch angle. Those galaxies with clearly fast bars span a range in from 13.4∘ for NGC 6782 to 32.9∘ for NGC 0337. The two galaxies with the smallest pitch angles of those with fast bars are NGC 5135 and NGC 6782. The outer spiral arms of these galaxies are not logarithmic as we assume and appear to be the result of gas trapped in resonance regions associated with (see Figure 5). The relative amplitudes of the and Fourier components indicate that a single spiral pattern is dominate (see Figure 6) meaning that is not constant with radius in our measurements of these two galaxies. When pitch angle is translated to SMBH mass via equation 2 in Seigar et al. (2008) we can see that also does not correlate with bar pattern speed (Figure 4, right). That is, galaxies with fast bars, and low central density dark matter halos (Debattista & Sellwood 2000), have SMBH masses similar to other barred spiral galaxies.
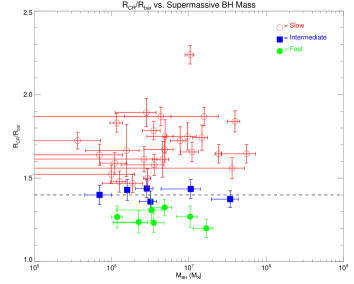
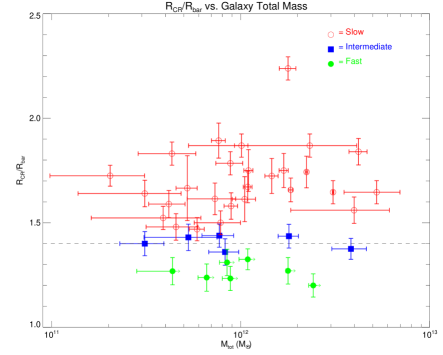
If the assertion is true that galaxies with low dark halo concentrations host black holes less massive than average for a given halo mass and the relationship holds, then we can make a prediction of the minimum mass of our fast-bar galaxies. Figure 7 shows our estimates versus the total galaxy mass implied from the (Seigar et al. 2008) and (Bandara et al. 2009) relationships. Here is the total gravitational mass of the galaxy within the radius where the density profile of the galaxy exceeds the critical density of the universe by a factor of 200. The predicted total mass of those galaxies with convincingly fast bars is expected to be a minimum (see Table 1). Follow-up rotation curve measurements will test this prediction.
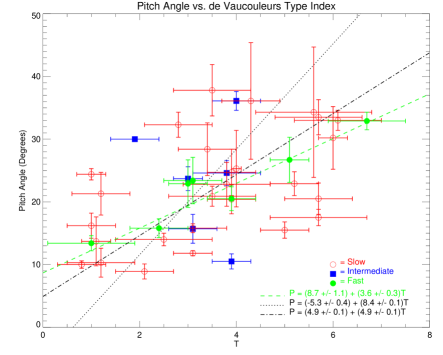
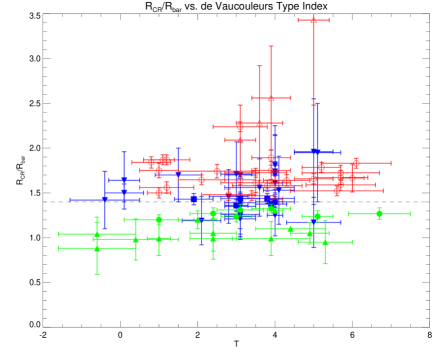
A plot of versus the de Vaucouleurs morphological type index (; see Figure 8) shows a trend in agreement with Kennicutt (1981) and Seigar & James (1998b). Galaxies identified as early-type have correspondingly small values of while late-types have larger values of . The trend becomes a tighter correlation when the focus is shifted from the overall sample to only those galaxies with clearly fast bars. A linear fit to the data of Roberts et al. (1975) concerning theoretical pitch angle versus Hubble type is also overlayed (dot-dashed line). The y-intercept of this fit was systematically lower than our data points, so it was multiplied by an ad hoc factor of -0.46. The slope of this theoretical fit is more similar to the slope of the linear fit of the galaxies with fast bars (dashed green line) than to the slope of the linear fit of the entire sample (dotted line).
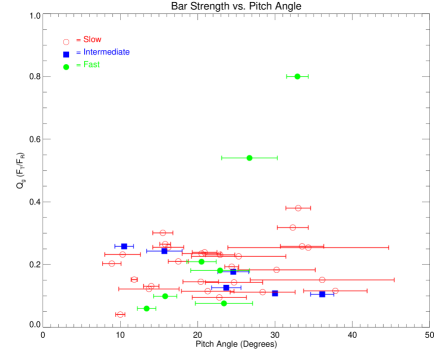
Das et al. (2008) have shown that a trend exists where bar strength () is anticorrelated with the central velocity dispersion () of the bulge. This result suggests that the growth of a central mass may be closely linked to the evolution of the bar. Additionally, Seigar et al. (2008) show that a good anticorrelation exists between and . This is a result of also being an indicator of (Gebhardt et al. 2000; Ferrarese & Merritt 2000). These results imply that a correlation between bar strength and should be expected. In Figure 9 we plot as a function of and do not see this correlation in the overall sample. However, when focusing only on the small sample of galaxies with clearly fast bars, appears to increase with increasing .
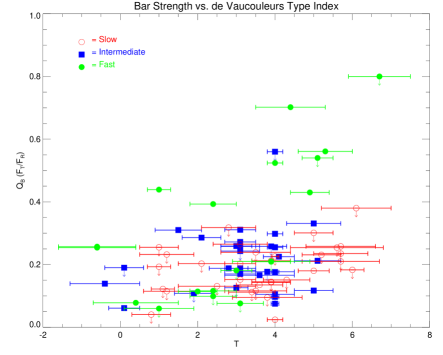
An overall trend becomes more apparent when we plot as a function of for a larger sample of galaxies (see Figure 10). We have already shown that there is a loose correlation between and in general and perhaps a tighter correlation when only considering galaxies with fast bars. Also, if is small, then approaches , effectively making an upper limit of . The larger overall sample displays a very weak correlation which agrees with the results of Laurikainen et al. (2007) and Seigar & James (1998a), although the latter authors determined the bar strength through an alternate method and plotted it as a function of bulge-to-disk ratio. When focusing once again on galaxies with clearly fast bars, it becomes more evident that a trend between bar strength and , or , exists for those galaxies. This seems to suggest that galaxies with a smaller dark matter halo contribution in the central regions follow a more predictable trend in bar strength and spiral arm morphology than those with more dominant dark matter contributions.
Finally, Figure 11 displays versus for our data as well as that of Rautiainen et al. (2008). The general trend of increasing with an increasing , seen in Figure 6 of Rautiainen et al. (2008), is not as clear with the addition of our data. Instead, the few values greater than 2.0, seen from , appear to be anomalous rather than part of a general trend. The large range in , or , seen for slow, intermediate, and fast bar galaxies in this larger overall sample is indicative of the scatter around the empirical SMBH and halo mass relation of Bandara et al. (2009) predicted by Booth & Schaye (2010).
4 Conclusions
We set out to estimate the SMBH mass of a sample of 40 barred spiral galaxies and determine which of these galaxies have low central dark halo densities. We did this by using a 2D FFT to measure and estimated via the best model fit of the relationship (Seigar et al. 2008). We also created simulation models of these galaxies with morphologies resembling that seen in the CGS -band images by primarily varying , a key dynamical component, or similarly . The results of these morphological matches allowed us to discern those galaxies with convincingly fast rotating bars and correspondingly low central density dark matter halos.
Our results indicate that a wide range of exists in both fast and slow bar galaxies. This appears to support the theoretical work of Booth & Schaye (2010) where the authors claim that the scatter in the empirical relationship between SMBH and halo mass (Bandara et al. 2009) is due to the dark matter halo concentration. Additionally, we find that galaxies with low central dark halo densities appear to follow more predictable trends in versus and versus than barred galaxies in general. The empirical relationship (Bandara et al. 2009) also provided us with an estimate of for our galaxies. For a given halo mass, we expect the SMBHs in galaxies with fast bars to have a less-than-average mass due to the low central dark halo density and the resulting anemic growth predicted by Booth & Schaye (2010). This means that the total luminous and dark mass of these galaxies is expected to be the minimum of what would be measured observationally. This claim can easily be tested by obtaining detailed kinematic data and this will be done in a forthcoming paper.
It should be noted that the argument by Debattista and Sellwood (2000) correlating galaxies harboring fast bars with low central density dark matter halos is theoretical and has not yet been tested observationally due to the inherent difficulty in doing so. Additionally, while dynamical friction from higher central density dark matter halos may not yet have slowed recently formed fast bars, it is unlikely that any bars in our sample are newly formed. We presume this because observational evidence suggests that bars are long-lived structures (Jogee et al. 2004; Sheth et al. 2003) and the galaxies in our sample are local and therefore old. We also acknowledge that bars may not slow due to dynamical friction alone. Models have shown that massive bulges can exchange angular momentum with the bar and cause them to slow down (Athanassoula 2003). If we assume that massive bulges reside in dark matter halos of high central concentration (e.g. Ho 2007), then angular momentum exchange with both the bulge and halo would act to slow the bar. In this study, we are only interested in those galaxies with clearly fast bars where any contribution to bar slow down by dynamical friction via a dark matter halo is minimal.
The authors wish to thank B. Catinella and I. Márquez for providing kinematical data for NGC 4050, NGC 3660, and NGC 5728. This work was supported by a grant through the Arkansas NASA EPSCoR program and in part by the National Science Foundation under Grant CRI CNS-0855248, Grant EPS-0701890, Grant MRI CNS-0619069, and OISE-0729792. H. Salo acknowledges the support of the Academy of Finland. We also acknowledge the use of the HyperLeda database (http://leda.univ-lyon1.fr) and the NASA/IPAC Extragalactic Database (NED) which is operated by the Jet Propulsion Laboratory, California Institute of Technology, under contract with the National Aeronautics and Space Administration. The observational data presented in this paper were collected as part of the Carnegie-Irvine Galaxy Survey (CGS; http://cgs.obs.carnegiescience.edu), using facilities at Las Campanas Observatory, Carnegie Institution for Science. The data were reduced independently from those presented in Ho et al. (2011)
References
- Athanassoula (2003) Athanassoula, E. 2003, MNRAS, 341, 1179
- Athanassoula et al. (1982) Athanassoula, E., Bosma, A., Crézé, M., & Schwarz, M. P. 1982, A&A, 107, 101
- Bandara et al. (2009) Bandara, K., Crampton, D., & Simard, L. 2009, ApJ, 704, 1135
- Bell et al. (2003) Bell, E. F., McIntosh, D. H., Katz, N., & Weinberg, M. D. 2003, ApJS, 149, 289
- Block et al. (1999) Block, D. L., Puerari, I., Frogel, J. A., Eskridge, P. B., Stockton, A., & Fuchs, B. 1999, Ap&SS, 269/270, 5
- Booth & Schaye (2010) Booth, C. M. & Schaye, J. 2010, MNRAS, 405, L1
- Buta (1995) Buta, R. 1995, ApJS, 96, 39
- Buta & Combes (1996) Buta, R. J. & Combes, F. 1996, Fundam. Cosm. Phys., 17, 95
- Buta, Corwin, & Odewahn (2007) Buta, R. J., Corwin, H. G., & Odewahn, S. C. 2007, The de Vaucouleurs Atlas of Galaxies, Cambridge: Cambridge U. Press
- Buta et al. (2005) Buta, R., Vasylyev, S., Salo, H., & Laurikainen, E. 2005, AJ, 130, 506
- Byrd, Ousley, & Dalla Piazza (1998) Byrd, G. G., Ousley, D., & Dalla Piazza, C. 1998, MNRAS, 298, 78
- Canzian (1993) Canzian, B. 1993, ApJ, 414, 487
- Catinella, Haynes, & Giovanelli (2005) Catinella, B., Haynes, M. P., & Giovanelli, R. 2005, AJ, 130, 1037
- Cisternas, Jahnke, Inskip, et al. (2011) Cisternas, M., Jahnke, K.; Inskip, K. J., et al. 2011, ApJ, 726, 57
- Contopoulos (1980) Contopoulos, G. 1980, A&A, 81, 198
- Considère & Athanassoula (1988) Considère, S. & Athanassoula, E. 1988, A&AS, 76, 365
- Das et al. (2008) Das, M., Laurikainen, E., Salo, H., & Buta, R. 2008, Ap&SS, 317, 163
- Davis et al. (2012) Davis, B. L., Berrier, J. C., Shields, D. W., Kennefick, J., Kennefick, D., Seigar, M. S., Lacy, C. H. S., & Puerari, I. 2012, ApJS, in press (arXiv:1202.4780)
- de Grijs (1998) de Grijs, R. 1998, MNRAS, 299, 595
- de Vaucouleurs et al. (1991) de Vaucouleurs, G., de Vaucouleurs, A., Corwin, H. G., Buta, R. J., Paturel, G., & Fouque, P. 1991, Third Reference Catalogue of Bright Galaxies (RC3), New York: Springer-Verlag
- Debattista & Sellwood (2000) Debattista, V. P. & Sellwood, J. A. 2000, ApJ, 543, 704
- Egusa, Sofue, & Nakanishi (2004) Egusa, F., Sofue, Y., & Nakanishi, H. 2004, PASJ, 56, L45
- Ferrarese (2002) Ferrarese, L. 2002, ApJ, 578, 90
- Ferrarese & Merritt (2000) Ferrarese, L. & Merritt, D. 2000, ApJ, 539, L9
- Garcia (1993) Garcia, A. M. 1993, A&AS, 100, 47
- Garcia-Gomez & Athanassoula (1993) Garcia-Gomez, C. & Athanassoula, E. 1993, A&AS, 100, 431
- Gebhardt (2000) Gebhardt, K. et al. 2000, ApJ, 539, L13
- Gebhardt (2001) Gebhardt, K., Lauer, T. R., Kormendy, J., et al. 2001, AJ, 122, 2469
- Grouchy et al. (2010) Grouchy, R. D., Buta, R. J., Salo, H., & Laurikainen, E. 2010, AJ, 139, 2465
- Ho (2007) Ho, L. C. 2007, ApJ, 668, 94
- Ho (2007) Ho, L. C., Li, Z.-Y., Barth, A. J., Seigar, M. S., & Peng, C. Y. 2011, ApJS, 197, 21
- Hubble (1926) Hubble, E. P. 1926, ApJ, 64, 321
- Jogee et al. (2004) Jogee, S., Barazza, F. D., Rix, H-W, et al. 2004, ApJ, 615, L105
- Kalnajs (1991) Kalnajs, A. 1991, in Dynamics of Disk Galaxies, ed. B. Sundelius (Göteborg: Göteborg Univ.), 323
- Kennicutt (1981) Kennicutt, R. C. 1981, AJ, 86, 1847
- Kormendy & Bender (2011) Kormendy, J. & Bender, R. 2011, Nature, 469, 377
- Kormendy & Kennicutt (2004) Kormendy, J. & Kennicutt, R. C., Jr. 2004, ARA&A, 42, 603
- Laurikainen & Salo (2002) Laurikainen, E. & Salo, H. 2002, MNRAS, 337, 1118
- Laurikainen, Salo, & Buta (2004) Laurikainen, E., Salo, H., & Buta, R. 2004, ApJ, 607, 103
- Laurikainen et al. (2007) Laurikainen, E., Salo, H., Buta, R., & Knapen, J. H. 2007, MNRAS, 381, 401
- Laurikainen et al. (2004) Laurikainen, E., Salo, H., Buta, R., & Vasylyev, S. 2004, MNRAS, 355, 1251
- Lin et al. (2008) Lin, L.-H., Yuan, C., & Buta, R. 2008, ApJ, 684, 1048
- Lindblad & Kristen (1996) Lindblad, P. A. B. & Kristen, H. 1996, A&A, 313, 733
- Lynden-Bell & Kalnajs (1972) Lynden-Bell, D. & Kalnajs, A. J. 1972, MNRAS, 157, 1
- Márquez et al. (2004) Márquez, I., Durret, F., Masegosa, J., Moles, M., Varela, J., González Delgado, R. M., Maza, J., Pérez, E., & Roth, M. 2004, A&A, 416, 475
- Mathewson, Ford, & Buchhorn (1992) Mathewson, D. S., Ford, V. L., & Buchhorn, M. 1992, ApJS, 81, 413
- Merlin & Chiosi (2007) Merlin, E. & Chiosi, C. 2007, A&A, 473, 733
- Mundell et al. (1999) Mundell, C. G., Pedlar, A., Shone, D. L., & Robinson, A. 1999, MNRAS, 304, 481
- Orban de Xivry et al. (2011) Orban de Xivry, G., Davies, R., Schartmann, M., Komossa, S., Marconi, A., Hicks, E., Engel, H., & Tacconi, L. 2011, MNRAS, 417, 2721
- Paturel et al. (2003) Paturel G., Petit C., Prugniel P., Theureau G., Rousseau J., Brouty M., Dubois P., Cambrésy L., 2003, A&A, 412, 45
- Persic, Salucci, & Stel (1996) Persic, M., Salucci, P., & Stel, F. 1996, MNRAS, 281, 27
- Puerari & Dottori (1997) Puerari, I. & Dottori, H. 1997, ApJ, 476, L73
- Rautiainen & Salo (1999) Rautiainen, P. & Salo, H. 1999, A&A, 348, 737
- Rautiainen, Salo, & Laurikainen (2008) Rautiainen, P., Salo, H., & Laurikainen, E. 2008, MNRAS, 388, 1803
- Ringermacher & Mead (2009) Ringermacher, H. I. & Mead, L. R. 2009, AJ, 137, 4716
- Roberts, Roberts, & Shu (1975) Roberts W. W., Roberts M. S., & Shu F. H., 1975, ApJ, 196, 381
- Salo (1991) Salo, H. 1991, A&A, 243, 118
- Salo et al. (1999) Salo, H., Rautiainen, P., Buta, R., Purcell, G. B., Cobb, M. L., Crocker, D. A., & Laurikainen, E. 1999, AJ, 117, 792
- Satyapal et al. (2008) Satyapal, S., Vega, D., Dudek, R. P., Abel, N. P., & Heckman, T. 2008, ApJ, 677, 926
- Satyapal et al. (2007) Satyapal, S., Vega, D., Heckman, T., O’Halloran, B., & Dudek, R. 2007, ApJ, 663, L9
- Schröder et al. (1994) Schröder, M. F. S., Pastoriza, M. G., Kepler, S. O., & Puerari, I. 1994, A&AS, 108, 41
- Schwarz (1984) Schwarz, M. P. 1984, Proc. Astron. Soc. Austr., 5, 464
- Seigar (2011) Seigar, M. S. 2011, ISRN Astronomy & Astrophysics, vol. 2011, ID# 725697
- Seigar et al. (2005) Seigar, M. S., Block, D. L., Puerari, I., Chorney, N. E., & James, P. A. 2005, MNRAS, 359, 1065
- Seigar et al. (2006) Seigar, M. S., Bullock, J. S., Barth, A. J., & Ho, L. C. 2006a, ApJ, 645, 1012
- Seigar & James (1998a) Seigar, M. S., & James, P. A. 1998a, MNRAS, 299, 672
- Seigar & James (1998b) Seigar, M. S., & James, P. A. 1998b, MNRAS, 299, 685
- Seigar et al. (2008) Seigar, M. S., Kennefick, D., Kennefick, J., & Lacy, C. H. S. 2008, ApJL, 678, 93
- Sempere & Rozas (1997) Sempere, M. J. & Rozas, M. 1997, A&A, 317, 405
- Sheth et al. (2003) Sheth, K., Regan, M. W., Scoville, N. Z., & Strubbe, L. E. 2003, ApJ, 592, L13
- Taylor (1997) Taylor, J. R. 1997, An Introduction to Error Analysis, 2nd edition. Sausalito: University Science Books
- Tremaine & Weinberg (1984) Tremaine, S. & Weinberg, M. D. 1984, ApJ, 282, L5, (TW)
- Treuthardt, Salo, & Buta (2009) Treuthardt, P., Salo, H., & Buta, R. 2009, 137, 19
- Treuthardt et al. (2008) Treuthardt, P., Salo, H., Rautiainen, P., & Buta, R. 2008, AJ, 136, 300
- van den Bosch et al. (2007) van den Bosch, F. C., et al. 2007, MNRAS, 376, 841
- Vega Beltran et al. (1998) Vega Beltran, J. C., Zeilinger, W. W., Amico, P., Schultheis, M., Corsini, E. M., Funes, J. G., Beckman, J., & Bertola, F. 1998, A&AS, 131, 105
- Volonteri, Natarajan, & Gultekin (2011) Volonteri, M., Natarajan, P., & Gültekin, K. 2011, ApJL, 737, 50
- Weiner, Sellwood, & Williams (2001) Weiner, B. J., Sellwood, J. A., & Williams, T. B. 2001, ApJ, 546, 931
- Wilke, Möllenhoff, & Matthias (2000) Wilke, K., Möllenhoff, C., & Matthias, M. 2000, A&A, 361, 507
- Zhang & Buta (2007) Zhang, X. & Buta, R. 2007, AJ, 133, 2584