11email: val@deneb1.odessa.ua 22institutetext: Isaac Newton Institute of Chile, Odessa Branch, Ukraine 33institutetext: Institute of Astronomy, Celestijnenlaan 200D, 3001, Leuven, Belgium
1 Introduction
F–G supergiants are among the most luminous stars in the Galaxy in the visual spectral region. Potentially, they can be used as standard candles for the extragalactic distance scale, for the studies of the spiral structure of our Galaxy and the evolution of massive stars (e.g. to establish the location of the blue loops on the Hertzsprung–Russell (HR) diagram). In practice, all these applications require knowledge of the accurate stellar luminosities.
The oxygen Oi 7771-4 Å triplet has been known as a luminosity indicator in supergiants for a long time (see Merrill (1925); Keenan & Hynek (1950)). Using the photoelectric technique on the sample of 10 F0–F8 supergiants with known luminosities (which in 8 cases were obtained from the distances to the parent clusters), Osmer (1972) and Baker (1974) derived the first quantitative relations between the strength of the triplet and the absolute magnitude (). Following that pioneering work, more extended studies have been carried out, both spectroscopically and photometrically (Sorvari 1974; Kameswara Rao & Mallik 1978; Arellano Ferro et al. 1989, 1991; Mendoza & Arellano Ferro 1993; Arellano Ferro et al. 1993; Slowik & Peterson 1993, 1995). Most recently, Arellano Ferro et al. (2003) presented calibrations based on the Hipparcos and Tycho data, that cover a wide range of with precision of 0.38 mag. Drout et al. (2009, 2012) and Neugent et al. (2010, 2012) successfully used the oxygen triplet to distinguish F–G supergiants in M31, M33, the SMC and LMC, respectively, from the foreground Galactic dwarfs, with the goal to test the evolutionary tracks at a range of metallicities.
The correlation of the triplet strength with luminosity is considered to be a result of the non-local-thermodynamical-equilibrium (non-LTE) effects, exacerbated by sphericity, that become stronger with higher luminosity (Przybilla et al 2000). However, as with any spectral feature, the strength of the triplet may also be a function of the effective temperature , microturbulent velocity , gravity and metallicity [Fe/H]. For example, the sensitivity to in the spectral range F5–G3 was already noted by Keenan & Hynek (1950) and Faraggiana et al. (1988). In the previous studies the number of supergiants with known luminosities was limited, which made impossible to take all these parameters into account. As a result, the precision of the early calibrations was rather low. The aim of the current work is to increase the accuracy of the luminosity determination based on a larger and better-characterized calibrating sample.
In our first paper on the spectroscopic determination of the supergiant luminosities (Kovtyukh et al. (2010), hereinafter Paper 1), we developed a method of the luminosity determination based on the ratios of the selected Fei and Feii lines with different excitation potentials. We analyzed high-resolution spectra of 98 non-variable supergiants and 53 classical Cepheids and derived 80 luminosity relations corresponding to different line pairs. Inclusion of Cepheids (in the specific pulsation phases) was a key factor to increase the number of objects with known luminosities, thanks to the period-luminosity relationship. The enlarged sample, in turn, resulted in a high precision of the line-ratio calibrations: ()=0.26 mag. For the present study, we selected only non-variable objects with the best quality data from that sample, and complemented them with the spectra of 12 new supergiants.
In the era of the CCDs, the red spectral region containing the oxygen triplet is easily accessible, which is also assisted by the reddening of these population I stars. As a result, equally high S/N can be achieved for the oxygen 7771 triplet, as for the more traditional 5000–6800 Å region used to measure the iron lines in Paper I. Then, the usage of the oxygen triplet as a luminosity calibrator may have several advantages over the iron lines. The triplet is usually stronger and hence can be measured in the lower spectra, as well as over the larger range of . While Feii lines become unavailable at 4900 K, the triplet is measurable down to 4500 K. It is certainly faster to measure the three close lines than 60 iron lines that are spread over the whole visual spectral region. In the current study, we use the absolute magnitudes from the literature, including Paper I, to calibrate the strength of the oxygen triplet. In addition, while calibrations in Paper I considered only one other photospheric parameter – , in the current study, we also consider the dependence on the other three most important parameters – , and [Fe/H], in attempt to increase the precision of the determination.
We describe our observational material and the atmospheric parameters determination in Section 2. In Section 3, we present the calibration stars, derive new luminosity relations, and use them to evaluate for the entire sample of 74 supergiants. Section 4 summarizes our findings and provides suggestions for their application.
2 The Sample
2.1 The spectral material
The spectra taken for the current study from Paper I mostly originate from the publicly available archive of the Ultraviolet-Visual Echelle-type Spectrograph (UVES), mounted on the Very Large Telescope (VLT) (Bagnulo et al. 2003). All supergiants were observed in two instrumental modes, and , in order to provide almost complete coverage of the wavelength interval 3000-10 000 Å. The spectral resolution was about 80 000, and the typical S/N ratio was 150–200 for the most of the spectra. The spectra were retrieved in the reduced form that was produced by the UVES pipe-line.
Ten spectra were obtained using a coude-echelle spectrometer (Musaev et al. 1999) mounted on the 2-m “Zeiss” telescope at the Peak Terskol Observatory located near Mt. Elbrus (Northern Caucasus, Russia). The resolution was set at R=52 000. The observed wavelength range, 3610–10 270 Å was covered by 86 echelle orders. The S/N reached 250 and more in the red part of the spectrum. The spectral extraction was performed by the authors using the dedicated software DECH95.
We also included additional spectra for 27 supergiants. They were obtained with the fiber echelle-type spectrograph HERMES, mounted on the 1.2 m Belgian telescope on La Palma. A high-resolution configuration with R= 85 000 and the wavelength coverage 3800–9000 Å was used. The spectra were reduced using the Python-based pipe-line that includes the order extraction, wavelength calibration with the Thr-Ne-Ar arcs, division by the flat field, cosmic-ray clipping, and the order merging. For more details on the spectrograph and the pipe-line, see Raskin et al (2011).
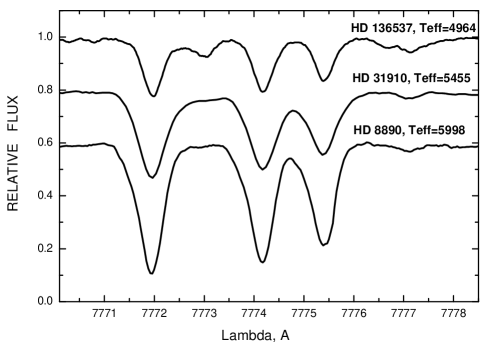
In all spectra, with a few exceptions, we measured two Oi indices: the equivalent width (EW) of the 7771 Å line alone (EW71), which is the least blended member of the triplet, and the combined EW of all three components (EW74), see Fig. 1. It should be noted, that in the GK-type supergiants, the additional features of Fei at 7772.59 Å and CN at 7772.9 Å become visible between the first (7771.95 Å) and the second (7774.17 Å) components of the triplet, contributing to the measured EW74 index. As will be shown in Sect. 3, it does not pose a problem for our calibrations. The EW71 index is blend-free in our spectra, which have resolution 50 000. Whenever the red wing of the 7771.95 Å component was affected, the blue wing was used for the Gaussian fitting and the EW determination. Therefore, the fact that the absolute magnitudes obtained from EW71 and EW74 turned out to agree very well, tells that the blends in the latter index are automatically calibrated together with the oxygen feature. Hence, our calibration of the EW74 index can be safely used in the low-resolution studies and the broad-line cases, at least above .
Our final sample of non-variable F–G supergiants with the Oi 7771-4 Å triplet measured from the high-S/N, high resolution spectra, consists of 74 objects (Table 1), of which 60 have the luminosity estimates from the literature. To be able to use these stars as the spectroscopic luminosity calibrators, it is needed to obtain the accurate values of their atmospheric parameters. In the following sub-section, we describe how we derived them consistently for the whole sample.
2.2 The atmospheric parameters
The atmospheric parameters were determined following procedures outlined in the previous papers from this series (Kovtyukh & Andrievsky 1999; Kovtyukh et al. 2008, 2010). In short, the effective temperatures have been determined using the line-ratio calibrations from Kovtyukh (2007). The internal accuracy of the method is particularly high in the temperature range 4500–7800 K where the standard deviation is of order 150 K or less, translating to 10–50 K in the standard error. One of the advantages of the line ratio method (or any other spectroscopic method) is its independence of the reddening, which is especially relevant for our supergiant stars that typically reside in the Galactic plane.
The microturbulent velocities and the surface gravities were derived using the modified approach, as described in Kovtyukh & Andrievsky (1999). Namely, the microturbulence was determined from the requirement of no dependence on the EW of the iron abundance obtained from the individual Feii, rather than Fei, lines. The surface gravity was established by forcing the iron abundance obtained from the Feii lines, to be the same as the abundance derived from the extrapolated to (i.e., weak) Fei lines. The reason why strong Fei lines should be avoided is their sensitivity to the non-LTE effects (Lyubimkov & Boyarchuk 1983; Thévenin & Idiart 1999; Mashonkina et al. 2011).
To obtain the elemental abundances, we used the WIDTH9 code by R. Kurucz and his atmospheric models, interpolated when needed (Kurucz 1992). Those models have been calculated with one value of the microturbulent velocity of 4 km s-1. To test what effect it can have on the abundances, we performed test calculations on the Cepheids, where the microturbulent velocity varies as a function of the pulsation phase. We found that the variation of several km s-1 still has a negligible impact on the resulting abundances. We use the same oscillator strengths as in the previous papers from this series, in particular, by Kovtyukh & Andrievsky (1999). They are based on the inverted analyses of the solar spectrum by adopting the solar abundances of Grevesse et al. (1996). With this approach, the abundances derived for our program stars have typical uncertainty of in [Fe/H] and in [O/H].
The Oxygen abundances reported in Table 1 were derived using the forbidden [Oi] 6300, 6363 Å lines and the weak Oi 6156-8 Å lines. The former lines are free, while the latter are almost free, from the non-LTE effects, unlike the 7771-4 Å triplet (Asplund et al. 2004; Fabbian et al. 2009; Przybilla et al 2000). One can still ask how the effects specific to the extended atmospheres of supergiants, such as sphericity, may affect our abundance determination procedure in general. On one hand, Hauschildt et al. (1999) found a significant impact of sphericity on line strengths in the yellow supergiants, though the effect was considerably less than for the red supergiants, whose spectra are dominated by the molecular bands. On the other hand, Przybilla et al (2000) based on the study of B-A supergiants, and Lobel & Dupree (2000) based on the M supergiant Ori, drew attention to the strong macro-turbulent broadening that can smear the difference between the line profiles calculated in the spherical and plane-parallel cases. The issue clearly needs to be further investigated. Until then, we simply rely on the weak lines for the abundance determination ( 170 mÅ), based on the calculations that on average, they form deeper and over the smaller extent of the atmosphere, thus being the least susceptible to the non-LTE effects. The existence of the empirical correlation of the strong 7771-4 Å triplet with luminosity must be a manifestation of the fact, that one or several of these poorly studied non-LTE effects become systematically stronger at higher luminosities.
The luminosities for the calibrating stars in this work are taken from Paper I, namely, the original values from the literature (based on the Hipparcos parallaxes and cluster distances) and the values we derived from the iron line ratios. Whenever more than one estimate was available, they were averaged with the equal weights. Table 1 lists our complete sample with the adopted atmospheric parameters, the oxygen EWs (in Å), and the newly derived absolute magnitudes (see Sect. 3). Whenever more than one spectrum (up to five) was available for a given object, the atmospheric parameters and the widths of the triplet, inferred from the individual spectra, have been averaged. For objects with additional, more recent spectra, this resulted in the improved values, that can be slightly different from those in Paper I. Unlike Paper I, the current study concerns only non-variable supergiants. Cepheids were omitted because of the complicated behavior of and within the pulsation cycle, and because of the possible influence of the dynamical processes on the non-LTE effects, which may affect the derived luminosities.

| Star | (literature) | [Fe/H] | [O/H] | EW71 | EW74 | (1) | (2) | Comments | |||
|---|---|---|---|---|---|---|---|---|---|---|---|
| HD 000571 | –3.05(1) | 6561 | 2.5 | 3.3 | –0.09 | … | … | 1.138 | … | –3.51 | |
| HD 000611 | –2.50(3) | 5453 | 1.9 | 3.2 | 0.11 | … | 0.257 | … | –2.55 | … | double |
| HD 000725 | –4.97(3) | 6793 | 1.8 | 4.8 | –0.16 | –0.23 | 0.470 | 1.375 | –5.19 | –5.28 | |
| HD 001457 | 7636 | 2.3 | 4.8 | –0.04 | –0.34 | 0.482 | 1.350 | –5.59 | –5.70 | ||
| HD 003421 | –1.62(1), –1.38(3) | 5310 | 2.3 | 2.6 | –0.13 | –0.17 | 0.148 | 0.472 | –1.45 | –1.45 | |
| HD 004362 | –3.07(3) | 5301 | 1.6 | 4.4 | –0.15 | … | 0.229 | 0.683 | –3.59 | –3.63 | |
| HD 006130 | 7458 | 2.9 | 5.0 | 0.09 | –0.28 | 0.399 | 1.102 | –4.97 | –4.93 | ||
| HD 007927 | –8.76(2) | 7341 | 1.0 | 8.7 | –0.24 | –0.32 | 0.930 | 2.453 | –9.16 | –8.93 | |
| HD 008890 | –3.10(3) | 5998 | 2.1 | 4.7 | 0.10 | 0.11 | 0.316 | 0.832 | –2.93 | –2.88 | var |
| HD 008906 | –4.68(3) | 6710 | 2.2 | 4.8 | –0.07 | –0.42 | 0.470 | 1.304 | –4.79 | –4.71 | |
| HD 008992 | –3.44(3) | 6234 | 2.4 | 5.0 | –0.02 | –0.23 | 0.376 | 1.016 | –3.30 | –3.24 | |
| HD 009167 | 7632 | 1.9 | 6.0 | –0.15 | … | 0.568 | 1.574 | –6.27 | –6.41 | ||
| HD 009900 | 4529 | 1.7 | 2.7 | 0.10 | –0.05 | 0.043 | 0.274 | –2.51 | –3.23 | ||
| HD 009973 | –5.08(3) | 6654 | 2.0 | 5.7 | –0.05 | –0.28 | 0.541 | 1.399 | –5.35 | –5.09 | Em |
| HD 010494 | –7.34(2) | 6672 | 1.2 | 7.5 | –0.20 | –0.32 | 0.640 | 1.778 | –6.77 | –6.76 | NGC 654 |
| HD 011544 | –3.28(3) | 5124 | 1.4 | 3.5 | 0.01 | 0.01 | 0.169 | 0.504 | –3.46 | –3.46 | |
| HD 012533 | 4319 | 1.5 | 3.0 | 0.04 | … | 0.070 | 0.146 | –3.58 | –3.24 | SB | |
| HD 012545 | 4359 | 1.5 | 2.0 | –0.22 | … | 0.148 | 0.345 | –4.64 | –3.82 | RSCVn | |
| HD 014662 | –3.52(3) | 6111 | 2.2 | 5.0 | –0.10 | –0.21 | 0.352 | 0.950 | –3.24 | –3.23 | var |
| HD 016088 | 7476 | 2.9 | 3.3 | 0.03 | –0.37 | 0.408 | 1.147 | –4.94 | –4.96 | ||
| HD 016901 | –3.25(2), –3.05(3) | 5568 | 1.6 | 4.2 | 0.02 | –0.12 | 0.262 | 0.731 | –3.27 | –3.25 | NGC 1039(?) |
| HD 017971 | –6.58(2), –6.56(3) | 6822 | 1.3 | 8.7 | –0.20 | –0.41 | 0.562 | 1.582 | –6.69 | –6.82 | IC 1848 |
| HD 018391 | –7.76(2) | 5762 | 1.2 | 11.5 | –0.02 | –0.15 | 0.638 | 1.647 | –7.71 | –7.83 | anon cluster |
| HD 020123 | –2.06(1), –1.64(2), –1.84(3) | 5160 | 2.0 | 3.3 | –0.05 | 0.20 | 0.130 | 0.314 | –2.25 | –2.19 | Melotte 20, SB |
| HD 020902 | –4.13(1), –4.31(3), –4.36(4) | 6541 | 2.0 | 4.8 | –0.01 | –0.20 | 0.430 | 1.218 | –4.38 | –4.34 | Per cluster |
| HD 023230 | –2.63(1) | 6560 | 2.4 | 3.5 | 0.04 | –0.09 | … | 0.937 | … | –3.25 | var, vsini=44 |
| HD 025291 | –4.64(1) | 7400 | 2.6 | 4.1 | 0.00 | –0.31 | 0.398 | 1.110 | –4.96 | –4.97 | |
| HD 026630 | –3.20(1), –3.17(3) | 5309 | 1.8 | 3.7 | 0.02 | … | 0.200 | 0.533 | –2.85 | –2.78 | SB |
| HD 031910 | –3.29(1), –3.09(3) | 5455 | 1.7 | 4.5 | –0.06 | –0.17 | 0.233 | 0.671 | –3.28 | –3.33 | double |
| HD 036673 | 7500 | 2.3 | 4.4 | 0.07 | –0.27 | 0.435 | 1.210 | –5.29 | –5.28 | ||
| HD 036891 | –2.79(3) | 5089 | 1.7 | 3.3 | –0.06 | –0.29 | 0.130 | 0.415 | –2.77 | –2.86 | |
| HD 045348 | –5.37(1) | 7557 | 2.2 | 2.7 | –0.10 | –0.24 | 0.442 | 1.231 | –5.29 | –5.37 | Canopus |
| HD 048329 | –4.09(3), –4.01(1) | 4583 | 1.2 | 3.7 | 0.16 | … | 0.091 | 0.205 | –4.00 | –3.82 | var |
| HD 054605 | –7.97(2) | 6564 | 1.5 | 10.2 | –0.03 | –0.47 | 0.725 | 1.936 | –7.43 | –7.32 | SB Coll121 var |
| HD 057118 | 7427 | 1.5 | 7.5 | –0.15 | –0.45 | 0.671 | 1.823 | –7.22 | –7.22 | ||
| HD 065228 | –1.87(1), –2.34(3) | 5740 | 2.0 | 3.9 | 0.01 | –0.12 | 0.226 | 0.616 | –2.43 | –2.44 | |
| HD 067594 | –3.12(1), –2.74(3) | 5190 | 1.7 | 3.7 | -0.06 | –0.03 | 0.172 | 0.488 | –3.04 | –3.03 | |
| HD 070761 | 7460 | 1.9 | 6.4 | –0.04 | –0.31 | 0.609 | 1.670 | –6.63 | –6.62 | ||
| HD 074395 | –2.27(1), –2.77(3) | 5247 | 1.8 | 3.0 | –0.01 | –0.07 | 0.185 | 0.495 | –2.58 | –2.45 | |
| HD 075276 | 6934 | 1.4 | 3.9 | –0.33 | –0.20 | 0.508 | 1.388 | –5.71 | –5.67 | ||
| HD 077912 | –2.51(1), –1.92(3) | 4951 | 2.0 | 2.4 | 0.01 | –0.02 | 0.090 | 0.299 | –1.92 | –2.00 | peculiar |
| HD 079698 | –0.15(1), –0.71(3) | 5227 | 2.5 | 1.7 | 0.06 | –0.09 | 0.106 | 0.281 | –0.67 | –0.54 | |
| HD 084441 | –1.28(1), –1.64(3) | 5284 | 2.0 | 2.2 | 0.01 | –0.13 | 0.127 | 0.382 | –1.54 | –1.50 | var |
| HD 092125 | –1.52(1), –1.62(3) | 5336 | 2.4 | 2.7 | 0.05 | 0.10 | … | 0.463 | … | –1.31 | |
| HD 101947 | –7.90(2) | 6578 | 1.3 | 11.3 | –0.08 | –0.27 | 0.811 | 2.075 | –8.26 | –8.01 | Stock 14, var |
| HD 109379 | –0.44(1), –1.00(3) | 5144 | 2.3 | 1.7 | 0.01 | –0.09 | 0.079 | 0.245 | –0.87 | –0.86 | var |
| HD 117440 | 4741 | 1.9 | 2.7 | –0.01 | 0.04 | 0.060 | 0.250 | –2.20 | –2.50 | var | |
| HD 119605 | –1.69(1), –1.27(3) | 5441 | 2.1 | 2.5 | –0.28 | –0.07 | 0.170 | 0.487 | –1.66 | –1.61 | |
| HD 125809 | –3.13(3) | 4845 | 2.1 | 3.8 | 0.00 | 0.02 | 0.096 | 0.327 | –2.59 | –2.80 | |
| HD 135153 | –4.55(1) | 7488 | 3.1 | 3.8 | 0.01 | –0.22 | 0.405 | 1.133 | –4.92 | –4.94 | |
| HD 136537 | –3.05(3) | 4964 | 1.3 | 2.9 | –0.06 | –0.24 | 0.114 | 0.365 | –3.20 | –3.29 | |
| HD 146143 | –3.64(1), –3.62(3) | 6068 | 2.0 | 5.0 | –0.13 | –0.29 | 0.406 | 1.126 | –3.59 | –3.55 | |
| HD 159181 | –2.49(3), –2.71(1) | 5180 | 2.1 | 3.4 | 0.03 | 0.03 | 0.162 | 0.497 | –2.33 | –2.34 | |
| HD 164136 | –2.85(1), –2.32(3) | 6483 | 3.1 | 4.5 | –0.37 | 0.05 | 0.299 | 0.849 | –2.80 | –2.93 | |
| HD 171635 | –3.58(3), –4.28(1) | 6151 | 2.1 | 5.2 | –0.04 | –0.15 | 0.378 | 1.026 | –3.49 | –3.46 | |
| HD 172594 | –5.95(3) | 6849 | 1.5 | 4.5 | –0.15 | –0.29 | 0.539 | 1.538 | –5.77 | –5.77 | |
| HD 173638 | –5.28(3) | 7444 | 2.4 | 4.7 | 0.11 | –0.31 | … | 1.309 | … | –5.46 | |
| HD 174464 | –3.83(3) | 6821 | 2.4 | 4.8 | –0.22 | –0.34 | 0.377 | 1.040 | –4.40 | –4.43 | |
| HD 180028 | –3.23(3) | 6307 | 1.9 | 4.0 | 0.10 | –0.08 | 0.340 | 0.917 | –3.44 | –3.33 | |
| HD 182835 | –5.58(3) | 6969 | 1.6 | 4.9 | 0.00 | –0.23 | 0.421 | 1.353 | –5.21 | –5.53 | |
| HD 185758 | –1.21(3), –1.19(1) | 5367 | 2.4 | 2.1 | –0.03 | –0.10 | … | 0.452 | … | –0.96 | |
| HD 187203 | –3.16(3) | 5710 | 2.2 | 5.1 | 0.05 | … | … | 0.772 | … | –2.86 | post-AGB? |
Table 1. Continued
Star
(literature)
[Fe/H]
[O/H]
EW71
EW74
(1)
(2)
Comments
HD 193370
–3.80(3)
6369
2.4
6.1
0.02
–0.33
…
1.149
…
–3.99
SB
HD 194093
–4.35(3)
6188
1.7
6.1
0.05
–0.09
0.479
1.300
–4.62
–4.54
var
HD 195295
–2.76(1), –3.22(3)
6572
2.4
3.5
0.01
–0.14
0.386
1.065
–3.65
–3.51
var
HD 202240
7515
3.1
3.7
0.10
0.23
0.336
1.112
–4.46
–4.84
HD 204075
–2.05(1), –1.73(3)
5262
2.0
2.6
–0.08
–0.14
0.128
0.416
–1.81
–1.86
SB
HD 204867
–3.09(1), –3.42(3)
5431
1.6
4.1
–0.04
–0.27
0.227
0.652
–3.25
–3.26
HD 206859
–2.98(1), –2.71(3)
4912
1.2
2.5
0.04
…
0.078
0.281
–2.93
–3.11
var
HD 209750
–2.98(1), –3.18(3)
5182
1.4
3.5
0.01
–0.21
0.180
0.527
–3.42
–3.41
HD 231195
7032
1.0
8.0
–0.09
–0.19
0.780
2.089
–8.12
–7.89
HD 236433
–3.98(2), –3.91(3)
6541
2.2
5.5
–0.15
–0.46
0.408
1.144
–4.32
–4.35
NGC 129, SB
BD +37 3827
–5.47(3)
6830
1.9
6.0
–0.15
–0.23
0.488
1.360
–5.49
–5.51
BD +60 2532
–4.10(2), –3.42(3)
6268
1.8
5.2
–0.01
–0.15
0.356
0.964
–3.91
–3.90
NGC 7654, double
1 – from the Hipparcos parallax (Paper1);
2 – from the cluster distance (Paper1);
3 – from the spectroscopic calibration of Paper1;
4 – Makarov (2006)
3 New luminosity calibrations
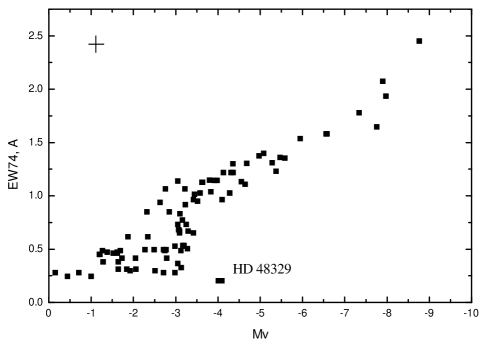
Figure 2 clearly shows that there is a correlation between the strength of the Oi triplet and the absolute magnitude. In the more luminous stars the triplet is significantly stronger. Nevertheless, there is a real scatter in this relation. To understand the source of the scatter, we plot the triplet strength versus the effective temperature in Fig. 3. Two different symbols (and two lines approximating their locii) represent two groups of supergiants according to the absolute magnitude: –3.5–2.5 and –5.0–4.0. It can be seen, that besides luminosity, the triplet also shows a strong dependence on , particularly in the range 4500–6000 K, where it rapidly weakens towards the cooler side. However, at higher temperatures, the scatter is observed again, which implies dependence on even more parameters. For example, Faraggiana et al. (1988) demonstrated the sensitivity of the triplet to the micro-turbulence.
Using accurate photospheric parameters from Table 1 for the 60 calibration stars with the known , we derive the analytical expressions (1) and (2) that relate the absolute magnitude to the triplet strength (EW71, EW74), , , , and the iron abundance [Fe/H].
| (1) | |||||
| (2) | |||||
where
| (3) |
and
| (4) |
Each expression consists of a linear combination of the products of the triplet EW and three photospheric parameters (, , [Fe/H]), with two functions of ( and ). This form is the result of the trial and error analysis, carried out with the goal to obtain precise, and at the same time clear and relatively compact expressions. The numerical coefficients have been obtained by using the generalized stepwise technique, and only significant terms have been retained in the final expressions.
As has been mentioned earlier, the luminosity dependence of the triplet is the result of the non-LTE effects that depend on the physical parameters of the photosphere. Metallicity is one of such parameters, and for our stars without chemical anomalies, it can be represented simply by the iron abundance [Fe/H]. Inclusion of the term with the oxygen abundance itself did not improve the precision of the calibrations. One reason is that with the EW exceeding 200 mÅ , the triplet falls past the linear regime on the curve of growth, being only weakly dependent on the abundance. The second reason is the lack of the strong deviation of [O/Fe] from the solar value in supergiants, of order 0.3 dex, which is comparable with the precision of the oxygen determination. Hence, it makes little difference (less than 0.2 mag in ) whether to include the [Fe/H] or the [O/H] term in the equations.
Using expressions (1) and (2), we obtained luminosities for all 74 F–G supergiants ((1) and (2)). The results are summarized in Table 1. Each entry includes: the name of the star, our photospheric model parameters, the strengths of the OI 7771.9 Å line and of the 7774 Å blend comprising all three components, the previously published and the new oxygen-based estimates of . As can be seen, the values obtained from the two oxygen indices are very close. For the stars with significantly broadened lines, the luminosity could only be determined from the second index, that relies on the EW of the whole feature.
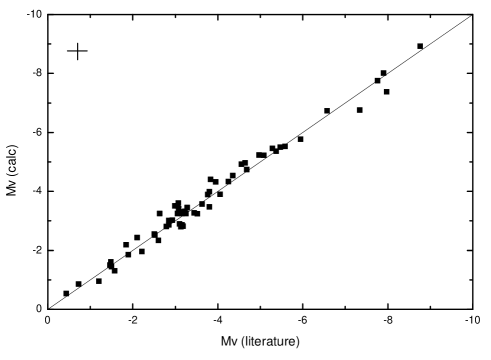
The absolute magnitudes recovered for the calibration stars are in excellent agreement with the original values from the literature, as shown in Fig. 4. The standard deviation is 0.26 mag with the correlation coefficient of 0.98. This is a significant improvement over the RMS0.9 mag of the simple oxygen EW– relationship that ignores dependence on other parameters (Fig. 1). The accuracy of 0.26 mag achieved here, is primarily limited by the accuracy of the external methods of the luminosity determination, which will certainly be improved in the future. Based on the corresponding values in our sample, the applicable ranges of our calibrations are the following: 8000 to 4500 K (F0 to K0), –1 to –10 mag (luminosity classes I, II), and –0.5 to 0.5.
4 Summary
The location of a star (or a family of stars) in the HR diagram is a fundamental property required for the understanding of the structure and evolution of stars, since it enables a comparison with the evolutionary tracks and isochrones. Knowing the chemical composition, in addition, allows to obtain a deeper insight into the evolutionary processes that the star have undergone to achieve the present stage (e.g. Lyubimkov et al. (2011)). The nature of the F–G supergiants studied here dictates that they are situated on average at much larger distances than dwarfs, and therefore, lack the parallax information for the direct estimate of the luminosity. In this study we present an alternative method for the luminosity determination – the accurate quantitative method based on the high-resolution spectra.
We have refined the long-known method of the luminosity determination from the OI 7771–4 Å triplet by incorporating the dependence on four other photospheric parameters: , , , and [Fe/H] (or [O/H]). We derived two expressions that predict the absolute magnitudes of the F–G supergiants with precision of 0.26 mag. We note that these calibrations are only suitable for supergiants without any anomalies, such as binarity, chemical peculiarities, or the presence of the circumstellar matter (a possible indication of a low-mass star in the post-AGB stage).
In the future, we plan to extend these calibrations on the classical Cepheids, which are the pulsating type of supergiants. This may help to disentangle the pulsation modes for the certain classes of Cepheids, particularly, for the short period ones like Polaris. At the same time, we plan to continue enlarging the number of supergiants with reliably and independently determined luminosities, which will enable to increase both the precision of the present calibrations and their application range.
Acknowledgements
The spectra were collected with the ESO Telescopes at the Paranal Observatory under programme ID266.D-5655, and the Mercator Telescope, operated on the island of La Palma by the Flemish Community, at the Spanish Observatorio del Roque de los Muchachos of the Instituto de Astrofisica de Canarias. Much of the information about the supergiants was gathered with the help of SIMBAD. We thank the anonymous referee for the useful suggestions.
References
- Arellano Ferro et al. (1989) Arellano Ferro A., Giridhar S., Chavez M., Parrao L. 1989, A&A, 214, 123
- Arellano Ferro et al. (1991) Arellano Ferro A., Giridhar S., Goswami A. 1991, MNRAS, 1, 250
- Arellano Ferro et al. (1993) Arellano Ferro A., Mendoza V., Eugenio E., 1993, AJ, 106, 2516
- Arellano Ferro et al. (2003) Arellano Ferro A., Giridhar S., Rojo Arellano E., 2003, RMxAA, 39, 3
- Asplund et al. (2004) Asplund M., Grevesse N., Sauval A.J., Allende Prieto C., Kiselman D., 2004 A&A, 417, 751 768
- Bagnulo et al. (2003) Bagnulo S., Jehin E., Ledoux C., et al., 2003, ESO Messenger, 114, 10
- Baker (1974) Baker P.W. 1974, PASP, 86, 33
- Drout et al. (2009) Drout M. R., Massey P., Meynet G., Tokarz S., Caldwell N., 2009 ApJ, 703, 441
- Drout et al. (2012) Drout M. R., Massey P., Meynet G., 2012, ApJ, in press (arXiv:1203.0247)
- Fabbian et al. (2009) Fabbian, D., Asplund, M., Barklem, P. S., Carlsson, M., and Kiselman, D. 2009, A&A, 500, 1221
- Faraggiana et al. (1988) Faraggiana R., Gerbaldi M., van’t Veer C., Floquet M. 1988, A&A, 201, 259
- Hauschildt et al. (1999) Hauschildt P. H., Allard F., Ferguson J., Baron E., Alexander D. R. 1999, ApJ, 525, 871
- Grevesse et al. (1996) Grevesse N., Noels A., Sauval J., 1996, ASP Conf. Ser. 99, 117
- Kameswara Rao & Mallik (1978) Kameswara Rao N., Mallik S.G.V. 1978, MNRAS, 183, 147
- Keenan & Hynek (1950) Keenan P. C., Hynek J. A. 1950, ApJ, 111, 1
- Kovtyukh (2007) Kovtyukh V. V., 2007, MNRAS, 378, 617
- Kovtyukh & Andrievsky (1999) Kovtyukh V.V., Andrievsky S.M., 1999, A&A 351, 597
- Kovtyukh et al. (2008) Kovtyukh V. V., Soubiran C., Luck R. E., Turner D. G., Belik S. I., Andrievsky S. M., Chekhonadskikh F. A., 2008, MNRAS 389, 1336
- Kovtyukh et al. (2010) Kovtyukh V. V., Chekhonadskikh F. A., Luck R. E., Soubiran C., Yasinskaya M. P., Belik S. I. 2010, MNRAS, 408, 1568 (Paper I)
- Kurucz (1992) Kurucz R. L. 1992, in The Stellar Populations of Galaxies, ed. B. Barbuy, & A. Renzini, IAU Symp. 149, 225.
- Lobel & Dupree (2000) Lobel A. & Dupree, A. K. 2000, ApJ, 545, 454
- Lyubimkov & Boyarchuk (1983) Lyubimkov L. S., Boyarchuk A. A., 1983, Ap, 19, 385
- Lyubimkov et al. (2011) Lyubimkov L. S., Lambert D. L., Rostopchin S. I., Rachkovskaya T.M., Poklad D. B., 2010, MNRAS, 402, 1369
- Makarov (2006) Makarov V. V. 2006, AJ 131, 2967
- Mashonkina et al. (2011) Mashonkina L., Gehren T., Shi J.-R., Korn A. J., Grupp, F. 2011, A&A, 528, 87
- Mendoza & Arellano Ferro (1993) Mendoza E. E., Arellano Ferro A. 1993, AJ, 106, 2524
- Merrill (1925) Merrill P. 1925, PASP, 37, 272
- Musaev et al. (1999) Musaev F., Galazutdinov G., Sergeev A., Karpov N., & Pod’yuachev Y. 1999, Kinematics and Physics of Selectial Bodies, 15, 282
- Neugent et al. (2010) Neugent K F., Massey P., Skiff B., Drout M. R., Meynet G., Olsen K. A. G., 2010, ApJ, 719, 1784
- Neugent et al. (2012) Neugent K. F., Massey P., Skiff B., Meynet G., 2012, ApJ, in press (arXiv:1202.4225)
- Osmer (1972) Osmer P. S. 1972, ApJS, 24, 247
- Przybilla et al (2000) Przybilla N., Butler K., Becker S. R., Kudritzki R. P., & Venn K. A. 2000, A&A, 359, 1085
- Raskin et al (2011) Raskin G., van Winckel H., Hensberge H. et al. 2011, A&A 526, 69
- Slowik & Peterson (1993) Slowik D.J., Peterson D. M., 1993, AJ, 105, 1997
- Slowik & Peterson (1995) Slowik D.J., Peterson D. M., 1995, AJ, 109, 2193
- Sorvari (1974) Sorvari J.M. 1974, AJ, 79, 1416
- Thévenin & Idiart (1999) Thévenin F., Idiart T. P., 1999, ApJ, 521, 753