Cosmic Origins Spectrograph Observations of
Warm Intervening Gas at Towards 3C 11affiliation: Based on observations with the NASA/ESA Hubble Space Telescope, obtained at the Space Telescope Science Institute, which is operated by the Association of Universities for Research in Astronomy, Inc., under NASA contract NAS 05-26555, and the NASA-CNES/ESA Far Ultraviolet Spectroscopic Explorer mission, operated by the Johns Hopkins University, supported by NASA contract NAS 05-32985.
Abstract
We present /COS high observations of the multi-phase absorber towards 3C 263. The COS data shows absorption from H i (Ly- to Ly-), Ovi, C iii, Niii, Si iii and C ii. The Ne viii in this absorber is detected in the spectrum along with O iii, O iv, and N iv. The low and intermediate ions are kinematically aligned with each other and H i and display narrow line widths of km s-1. The Ovi Å lines are kinematically offset by km s-1 from the low ions and are a factor of broader. All metal ions except Ovi and Ne viii are consistent with an origin in gas photoionized by the extragalactic background radation. The bulk of the observed H i is also traced by this photoionized medium. The metallicity in this gas phase is Z Z⊙ with carbon having near-solar abundances. The Ovi and Ne viii favor an origin in collisionally ionized gas at K. The H i absorption associated with this warm absorber is a BLA marginally detected in the COS spectrum. This warm gas phase has a metallicity of [X/H] dex, and a total hydrogen column density of cm-2 which is dex higher than what is traced by the photoionized gas. Simultaneous detection of Ovi, Ne viii and BLAs in an absorber can be a strong diagnostic of gas with K corresponding to the warm phase of the WHIM or shock-heated gas in the extended halos of galaxies.
Subject headings:
galaxies: halos, intergalactic medium, quasars: absorption lines, quasars: individual: 3C 263, ultraviolet: general1. Introduction
Throughout cosmic history, the intergalactic medium (IGM) and the gaseous envelopes surrounding galaxies have retained more baryons compared to the gas settled into galaxies. In the universe, % of the baryons are predicted to be in the form of low density ( cm-3) intergalactic gas at temperatures of K and moderate overdensities of . These baryons, which were once part of the cool ( K) photoionized IGM probed by the Ly forest at , were heated through gravitational shocks during the formation of large scale structures (Cen & Ostriker, 1999; Davé et al., 2001; Valageas et al., 2002). The temperatures imply that this warm-hot intergalactic medium (WHIM) gas has a high degree of ionization. Physical conditions similar to the WHIM can also exist in gas in the extended halos of galaxies. Cosmological simulations predict that massive halos ( M⊙) acquire most of their gas through the hot-mode of accretion, where the infalling intergalactic gas is shock-heated to the virial temperatures of K (Kereš et al., 2005; van de Voort et al., 2011). This infalling gas may circulate within the halo for a long time before it can radiatively cool and flow into the disc. Other galactic-scale processes such as supernova driven flows and tidal interactions/mergers can also increase the temperature and ionization levels of gas in regions close to galaxies.
Observations of warm gas with K in the low- universe has been accomplished primarily through quasar absorption line spectroscopy in the far-UV of highly ionized metals, particularly Ovi Å lines (Tripp & Savage, 2000; Richter et al., 2004; Danforth & Shull, 2005; Stocke et al., 2006; Danforth & Shull, 2008; Tripp et al., 2008) and more recently Ne viii Å (Savage et al., 2005; Narayanan et al., 2009, 2011; Meiring et al., 2012). The fractional abundances of these ions peak in the interval K when ionizations are controlled by ion-electron collisions. Limitations in accessing the FUV wavelengths of the Ne viii resonant transitions and the relatively lower cosmic abundance of neon compared to oxygen has resulted in fewer Ne viii findings compared to Ovi. On the other hand, the detection of Ne viii has the advantage that it requires the presence of collisionaly ionized warm gas. In the case of Ovi it is not straightforward to distinguish a photoionization origin from collisional ionization in warm gas.
A strong correlation between the incidence of Ovi absorption and galaxies has been emerging from recent absorber-galaxy surveys. The Ovi absorption at low- seems to be preferentially selecting circumgalactic environments of typical star forming galaxies (Savage et al., 2002; Fox et al., 2004; Stocke et al., 2006; Wakker & Savage, 2009; Tumlinson et al., 2011b; Meiring et al., 2012). The covering fraction of Ovi absorbing gas is estimated to be % around emission line galaxies (Chen & Mulchaey, 2009), comparable to the covering fraction of high-velocity Ovi around the Milky Way (Sembach et al., 2003). In the case of the Milky Way, the halo Ovi absorption is known to be from multi-phase high velocity clouds where the Ovi is produced in K transition temperature plasma at the interface layers between the K neutral interstellar gas in HVCs and the K coronal halo of the Galaxy (Sembach et al., 2003; Fox et al., 2006). As analogs of Galactic HVCs, some fraction of the population of extragalactic warm absorbers could be tracing halo gas associated with galactic-scale processes such as outflows from star formation (Heckman et al., 2001), accretion of WHIM gas from the nearby intergalactic filaments (Narayanan et al., 2010b; Tumlinson et al., 2011a) and/or tidal streams from interactions and mergers with companion galaxies similar to the Magellanic Stream around the Milky Way, with which Ovi absorption is clearly associated (Sembach et al., 2003).
In the few known Ne viii absorbers, associated Ovi has always been detected, and both ions are found to be tracing warm gas with K (Savage et al., 2005; Narayanan et al., 2011). Simultaneous detection of Ne viii and Ovi can be a strong diagnostic on the temperature of the gas. The warm temperature and high levels of collisional ionization would result in thermally broadened ( km s-1) and often shallow Ly features (Richter et al., 2006; Danforth et al., 2010; Narayanan et al., 2010b). Detection of absorption from highly ionized species and broad-Ly absorbers (BLAs) in the low- universe can be used as probes of the WHIM or halo gas transiting between galaxies and the surrounding IGM.
This paper adds important FUV /Cosmic Origins Spectrograph (COS) data on the Ne viii absorber previously detected with data (Narayanan et al., 2009). The detection of Ne viii indicated the presence of K collisionally ionized gas, but the relatively few lines covered in the spectrum (O iii, O iv and N iv) were inadequate to constrain the ionization conditions and metallicity in this absorber. The COS spectra are obtained at high and provide coverage of a large number of absorption lines, most importantly Ovi and H i. In Sec 2 and 3 we describe the COS observations and observations for this sight line. The line detections and the multiphase properties of the absorber are discussed in detail in Sec 4, followed by predictions from photoionization and collisional ionization models in Sec 5.
2. COS Observations of 3C 263
COS observations of 3C 263 were carried out as part of the Cycle 19 GTO Program ID 11541 (PI Green). The capabilities of COS are described in detail by Green et al. (2012), Froning & Green (2009) and the on-orbit performance of the instrument is discussed by Osterman et al. (2011). The 3C 263 observations consisted of FUV spectra obtained at intermediate resolutions (FWHM km s-1) using the G130M and G160M COS gratings with total exposure times of 15.4 ks and 18.0 ks respectively. The details on the individual exposures are given in Table 1. Different grating central wavelength settings were used for the separate exposures. For different grating central wavelength settings the dispersed light for a particular wavelength falls on a different region of the detector. This helps to reduce the amplitude of detector fixed pattern noise in the final coadded spectrum. The setup also allows for the coverage of the Å wavelength gap introduced by the separation between the two segments of the COS detector. The data were extracted using the STScI CalCOS v2011.1a pipeline. The separate one dimensional spectra were coadded in flux units weighted by their respective exposure time using the routine developed by Charles Danforth and the COS GTO team111http://casa.colorado.edu/danforth/science/cos/costools.html. The final coadded spectrum has a wavelength coverage of Å with a S/N per 17 km s-1 resolution element. The pipeline reduced data are however sampled at 6 detector pixels per resolution element and throughout we display the COS spectra with this sampling. The COS wavelength calibration is accurate to km s-1 but has been improved to km s-1 through cross referencing of prominent IGM and ISM absorption lines.
3. Observations of 3C 263
The 3C 263 was observed by (Moos et al., 2000; Sahnow et al., 2000) for a total of 260 ks under various observing programs. The spectra were processed using the CALFUSE (ver 2.4) data reduction pipeline software. covers the wavelength range from Å to Å sampling the spectrum at a resolution of km s-1 (FWHM). The of the spectrum at Å is per 17 km s-1 bin size. The procedures adopted in the coaddition of the spectrum and for correcting the zero-point velocity offset errors are similar to the detailed description given in Wakker et al. (2003). More details can be found in Narayanan et al. (2009).
4. Multi-Phase Nature of Absorber
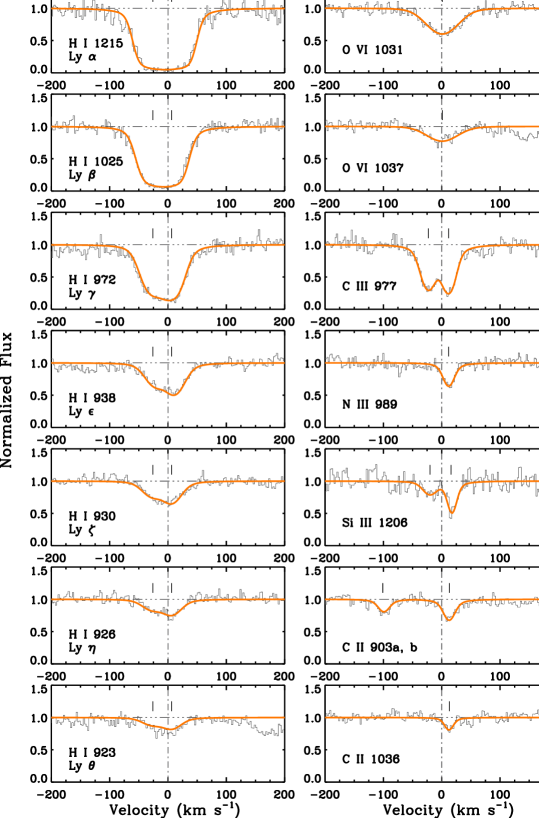
In Figures 1a - 1b, we display the centered system plot with prominent metal lines and H i detected by both COS and . To be consistent with the previous analysis of this absorber, we adopt the same system redshift as given in Narayanan et al. (2009). The continuum normalization was done by fitting low-order polynomials to the region around each absorption feature. The metal lines with detection by COS for this absorber are C ii Å, C ii Å, C ii Å, C iii Å, Niii Å, Si iii Å and Ovi Å. In the system plot we also show non-detections of lines corresponding to Nii and Si ii. In , O iii Å, O iv Å, N iv Å and Ne viii Å are seen along with a non-detection of O ii Å.
Measurements on all the lines were carried out using the apparent optical depth (AOD) technique of Savage & Sembach (1991). The AOD measurements on the COS data are listed in Table 2. The column density , Doppler parameter and velocity of the line components were also determined through Voigt profile modeling of the lines using the Fitzpatrick & Spitzer (1997) routine. While performing the fits, the model profiles were convolved with the emperically determined line spread functions of Kriss (2011) for the redshifted wavelength of each line. The fitting results are given in Table 3.
The COS spectrum shows strong absorption from C iii Å with at least two components at velocities of -23 km s-1 and +12 km s-1. Coincident with the positive velocity component are also seen absorption from Niii, Si iii, C ii and H i. For the negative velocity component, these metal ions are non-detections in the COS spectrum down to the 3 significance level. The difference in the corresponding line strengths between the two components is indicative of ionization or metallicity gradients within the absorber. The C iii Å being a strong line () is susceptible to saturation unresolved at the FWHM km s-1 of the COS data. Strong saturation will result in the AOD measurements underestimating the column densities in the line cores. We find a difference of dex in the column densities between the two measurements. The profile fit to C iii yields a km s-1 for the positive velocity component. The narrower -values for C ii and Si iii indicate that the true dispersion in the low ionization gas could be smaller than what we measure for C iii. Instrumental broadening of narrow spectral lines would result in the column density getting underestimated so as to preserve the equivalent width. Lowering the from its measured value of km s-1 to km s-1 (the lower limit) yields a column density which is 0.7 dex higher than the free-fit value of 13.67 dex. This shows that the degree of unresolved saturation is significant if the is narrower than what we measure. To account for this possibility, we increase the uncertainty to 0.7 dex in the profile fit -value for the positive velocity component of the C iii Å line.
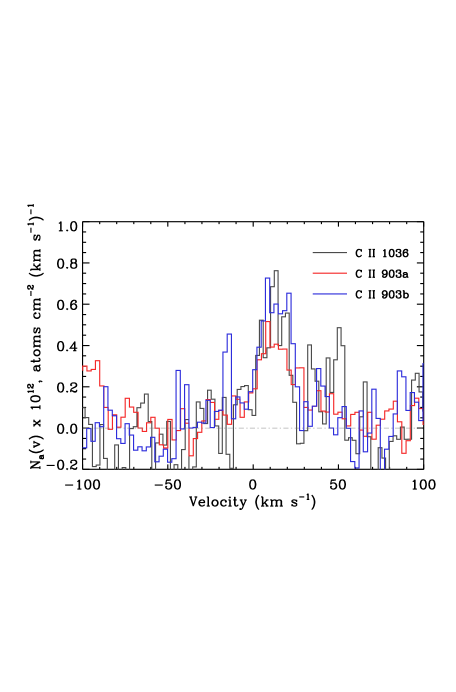
The Si iii 1207 Å line is covered by the G160M grating of the COS spectrum. The positive velocity component is very narrow with a measured km s-1. The profile fit column density is dex larger than the apparent column density, but within the combined errors associated with the measurements. At km s-1, weak absorption is detected at significance which is consistent with being Si iii corresponding to the negative component seen in C iii and H i. The C ii multiplet transitions at Å (), Å () and () are detected with significance. In the comparsion in Figure 3, we find the apparent column density profile of the stronger C ii line is lower than the weaker lines. The C ii line is possibly stronger and narrower than the observed profile but has been blurred by the instrumental spread function. The integrated column density obtained is therefore only a lower limit. The difference in values between the weaker (C ii Å) and the stronger (C ii Å) transitions is dex. This difference can be used to compensate for the instrumental broadening, as described in Savage & Sembach (1991). The corrected apparent column density measurement of dex is consistent with the column density obtained from simultaneous profile fitting of the three lines. The comparison in Figure 3 also shows small excess absorption in the C ii Å line between km s-1 possibly due to line contamination. The separate profile fit on this line yields a larger value compared to the two weaker C ii transitions. We obtain dex and km s-1 from simultanesouly fitting the three C ii lines. A lower km s-1 would result in km s-1 which is within the statistical uncertainty in the measurement.
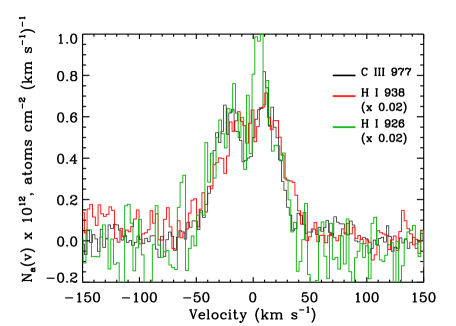
The COS spectrum shows absorption in H i from Ly- to Ly-. The Ly- (H i 949 Å) line suffers contamination from Galactic Si ii 1260 Å and possibly also from Sii 1260 Å. The Ly and Ly lines have saturated profiles. The column density and the component structure of H i are best constrained in the higher order Lyman lines with kinematic sub-structure evident in the H i Å and H i Å profiles. Due to the effect of random noise, the corresponding component structures are not conspicuous in all higher order Lyman lines. We simultaneously fitted the Lyman series lines (except Ly which is affected by contamination) by keeping , and as free parameters. The best-fit model gave two components of roughly equal strength contributing to the core H i absorption (see Table 3). The km s-1 for either component is consistent with temperature for photoionized gas. A comparison of the profiles of H i 938 and H i Å lines with C iii 977 Å show similar two component velocity structure (see Figure 3). This kinematic coincidence indicates that the bulk of the H i is contributed by the same gas phase as C iii.
The wings of the Ly profile show the possible presence of a very broad component superimposed on the saturated H i core and spread over the velocity interval [] = [] km s-1. This excess absorption could also be due to the presence of additional narrow kinematic sub-structures. The resolution of COS is not adequate to rule out this additional complexity in H i kinematics. The total column density of H i obtained from the free-fit to the Lyman transitions however does not account for this extra absorption in the far wings of the Ly profile. We discuss more about this possible broad-Ly feautre in Sec 7.
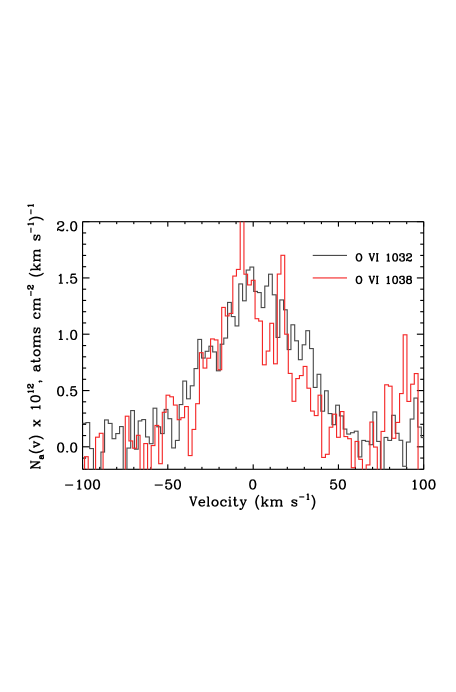
The Ovi is a strong absorption seen in both members of the doublet. The profiles for the Ovi Å lines, shown in Figure 3, are in good agreement with each other suggesting little contamination or unresolved saturation. The doublet lines were simultaneously fitted with a single component. The profiles do not shown evidence for any kinematic substructure. The parameters of the profile fit are given in Table 3. The central velocity of the Ovi absorption is distinct from the velocities of either component seen in C iii or the core absorption in H i. Also, the best-fit parameter for the Ovi line is a factor of broader than the C iii or H i line widths, which suggests that the two ions are tracing separate gas phases.
In Table 4, we report the equivalent widths and the total apparent column densities for the transitions seen in the spectrum. The spectrum has a factor of lower compared to COS. At the low , the component structure is not evident in the O iii Å, O iv Å, N iv Å or Ne viii 770 Å lines. The integration range of the profiles for the intermediate ion transitions were therefore broken into two regions of [] km s-1 and [] km s-1 to match with the component structure seen in C iii, Niii, Si iii, C ii and H i in the COS spectrum. To compensate for our lack of independent information on the component structure in the low data, we double the logarithmic errors in the measurements.
5. Ionization Modeling of the Multiphase Absorber
5.1. Photoionization of the Low & Intermediate Ions
The large difference in the -parameter and the kinematic offset of km s-1 between Ovi and the low/intermediate metal ions and the H i core points to the presence of multiple ionization phases in the absorber. For modeling the physical conditions in the absorber, we consider the two possible scenarios of ionization by EUV radiation and ionization from ion-electron collisions. The H i and C iii lines show absorption in two kinematically distinct components. The column density ratios of the various ions in these two components suggests different ionization conditions in the two clouds. However constraints are adequate only for the positive velocity component, and hence we only model that component. Using the photoionization code Cloudy (version C08.00; Ferland et al. (1998)) we solve for the models that best reproduce the observed column density ratios. We have assumed an ionizing background radiation field with contributions from both AGNs and star forming galaxies as modeled by Haardt & Madau (2001).
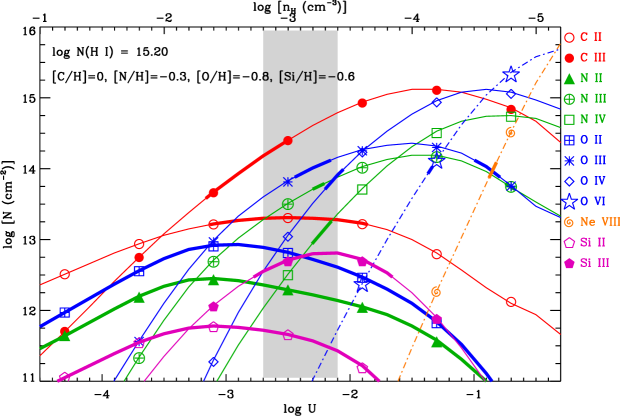
In the positive velocity cloud, the constraint on density comes from the column density ratios of C, N and O in their adjacent ionization levels, , and , along with upper limits of , , and . By fixing the H i column density in this component to the measured value of dex, we ran a series of Cloudy models for a range of ionization parameters. The ionic column densities predicted by the photoionization models are shown in Figure 4. The models are consistent with the observed column density ratios within the narrow interval of . This corresponds to a density range of cm-3. The single phase photoionization model which best fits the low and intermediate ions at predicts cm-3, total hydrogen column density of cm-2, K, pressure of K cm-3, and a path length of kpc through the absorber.
For the given value, and are simultaneously predicted at when the oxygen abundance is [O/H] dex. The uncertainty comes from the errors in the column density measurements. To reproduce the other low and intermediate ionic column densities from the same phase, the abundances have to be [C/H] dex, [N/H] , and [Si/H] dex. The higher abundance of carbon is required to explain the observed . The model prediction for has its peak at and does not vary much in the interval , which sets a robust constrain on the carbon abundance. The estimated abundances are subjected to larger systematic uncertainties at the level of dex because of ambiguities in the shape and intensity of the ionizing radiation field and assumptions inherent in the Cloudy models.
The most important result from this modeling analysis is that Ovi and Ne viii do not occur in the cool ( K) photoionized phase of the absorber. The photoionization model predictions for the Ovi column densities are dex lower than the observed column density. Photoionization of Ne viii requires extremely high ionization parameters of for even solar [Ne/H] abundances. The corresponding densities of cm-3 lead to very large path lengths ( Mpc). Absorption over such large path lengths is unlikely to result in the kinematically simple line profiles seen for these high ions. Furthermore, the broadening induced by the Hubble flow on the absorption over such large distances will be at least twice the measured km s-1. The photoionization predictions for Ovi and Ne viii are thus physically unrealistic. The offset in the velocity centroid of the Ovi line and its higher -value in comparision with the low and intermediate ionization species are clear indications of the multi-phase gas composition. It is more likely that the Ovi and the Ne viii are regulated by collisional ionzation in a warm plasma at temperatures between K. We discuss this possibility in the next section.
5.2. Collisional Ionization of Ovi and Ne viii in the Warm Gas
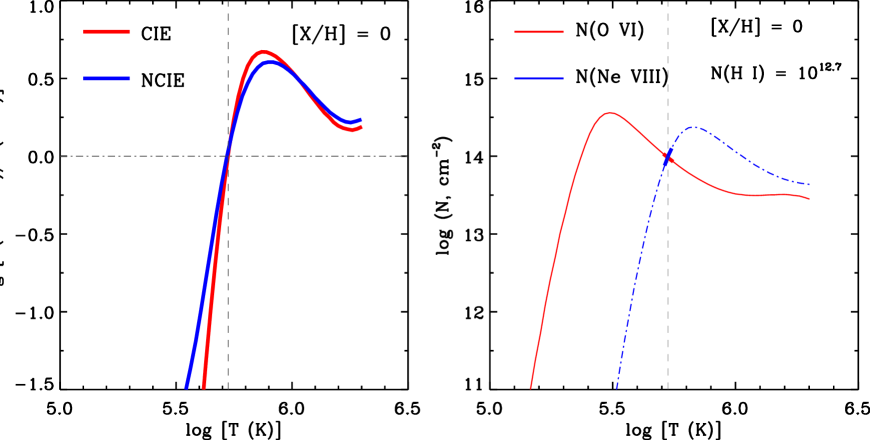
We can extract the temperature for the warm phase of the absorber from the measured value of . In the simple collisional ionization models of Gnat & Sternberg (2007) shown in Figure 5, we find that the is satisfied for gas temperatures of K. This temperature estimate is independent of the column density of H i in this phase, but assumes a solar ratio for (Ne/O) relative abundance. The temperature corresponds to a thermal line broadening of km s-1 which is consistent with the measured km s-1, and indicates roughly equal contributions from thermal and non-thermal line broadening. The K will be a lower limit if we account for the possibility that the Ovi can have some contribution from the photoionized gas as well. The intermediate ions like C iii, Niii, N iv, O iii, and O iv have very low ionization fractions () at such temperatures and will contribute negligibly to the total column density.
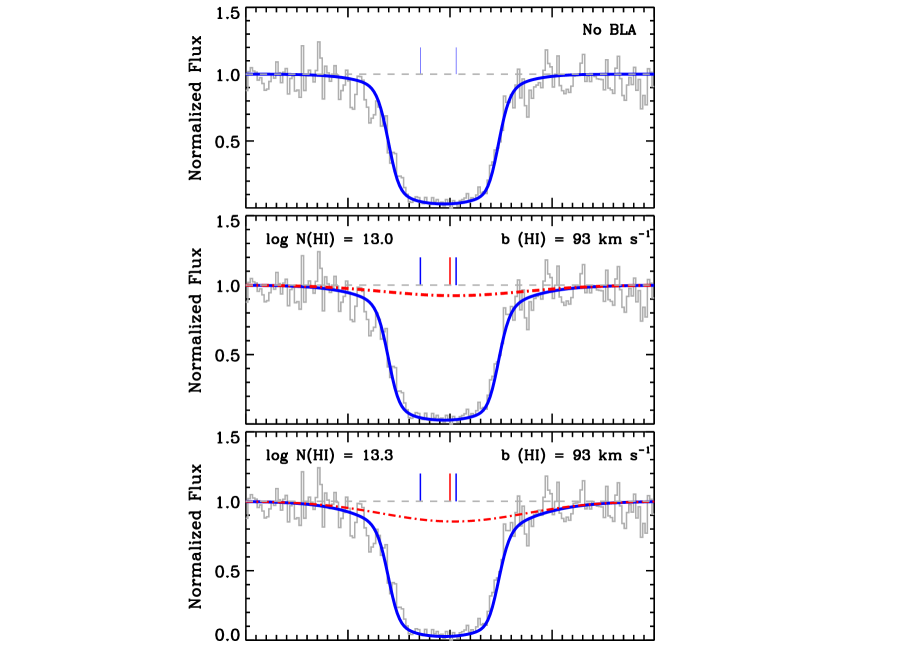
The H i associated with the warm phase will be broad, dominated by its thermal -value of km s-1. In other words, it will be a broad-Ly absorber (BLA). The very low ionization fraction of would result in the BLA absorption being shallow. This broad component would fall on top of the strong and narrow absorption from the photoionized gas. There is some hint for the presence of such a component in the wings of the Ly line between velocities of [-110, -75] km s-1 and [+75, +110] km s-1. The in this region is not adequate to clearly distinguish this feature. Nonetheless, as we show in figure 6, the observed Ly profile is consistent with the presence of a broad component with km s-1 and dex. This upper limit on the BLA column density corresponds to a lower limit of [X/H] on the true metallicity (see figure 5). The limiting BLA column density implies a total hydrogen column density of dex, a orders of magnitude higher baryon column density compared to the cool photoionized gas. From this analysis, we conclude a with O and Ne abundances of [X/H] in the warm collisionally ionized phase of the absorber.
5.3. A Constraint on the Broad-Ly Absorption Tracing the Warm Gas
The metallicity in this warm phase of the absorber is not well constrained since we do not have a direct measure on the associated H i. If the warm gas is spatially coupled with the cooler photoionized gas, we can accept near-solar abundances for O and Ne as well. At solar metallicities and at K the metal cooling efficiencies can be high leading to recombination lags and shifts in ionization fractions of high ions from the collisional ionization equilibrium (CIE) predictions. However, as shown in Figure 5, the predictions from the non-equilibrium cooling models are similar to CIE. At solar metallicity, the single phase model would predict the measured and for dex. Alternatively, one can place an upper limit on the H i column density, and a corresponding lower limit on the metallicity using the Ly.
We applied a formal fit to the Ly by fixing the two narrow components of the H i core (given in Table 3) and the velocity of the BLA at km s-1 corresponding to the velocity centroid of the Ovi doublet lines. The fit yields a km s-1 and dex. Considering the low detection significance of the BLA, the fitting procedure has underestimated the errors. The derived fit parameters are sensitive to the choice of the continuum and the assumptions on the component structure made on the basis of profile fitting. Regardless of this, it is interesting to note that the from the best-fit model is comparable to the value expected for from gas at K.
6. Summary
We have added new insights into the gas phase properties of the Ne viii absorber with the help of /COS high spectroscopic observations of 3C 263. The detection of Ne viii was reported by Narayanan et al. (2009). The COS spectrum with coverage over the wavelength range of Å shows lines from H i (Ly to ), Ovi, C iii, Niii, Si iii, C ii at , in addition to useful upper limits from non-detections of Nii and Si ii. This is supplemented by archival observations of O iii, O iv, N iv and Ne viii. The main conclusion is that the Ne viii combined with Ovi and possible broad H i in this absorber are diagnostic of collisionally ionized gas with K. The other significant results are summarized as follows:
-
1.
The absorber is a multiphase mix of low ionization gas at K and warm high ionization gas at K. Absorption in the low ionization gas shows at least two components at km s-1 and km s-1 in the the higher order Lyman lines and in the C iii 977 Å line. The COS spectrum also shows Niii, Si iii, and C ii associated with the positive velocity component. The -values of these intermediate and low ions are km s-1 implying low temperatures. The Ovi Å lines are a factor of broader and are not kinematically aligned with the low, intermediate ions or the core of the H i profile.
-
2.
The low and intermediate ions are consistent with an origin in gas photoionized by the extragalactic background radation. The bulk of the observed H i is also traced by this photoionized medium. Simple photoionization models predict the measured low and intermediate ion column densities for a corresponding to a density of cm-3, and a total hydrogen column density of cm-2. The abundances in the photoionized phase are [C/H] dex, [N/H] , [O/H] dex, and [Si/H] dex.
-
3.
The Ovi and Ne viii favor an origin in collisionally ionized gas. The is predicted at K in CIE and non-equilibrium cooling models. The H i absorption associated with this warm absorber is a BLA with km s-1 and comes from the trace neutral fraction () of hydrogen. The BLA is only marginally detected in the COS spectrum. From the observed Ne viii, Ovi and the constraints set by the Ly profile, we estimate for the warm gas phase a metallicity of [X/H] , and a total hydrogen column density of cm-2. The warm absorber contains a factor of dex more baryons than what is traced by the photoionized gas.
The ionization properties of the warm gas in this absorber are consistent with those predicted for the warm component of the WHIM, although the near-solar chemical abundances for carbon are higher than what is expected for the IGM. The absorber could be kinematically associated with halo gas. Without deep galaxy redshift measurements for the field surrounding 3C 263, it will be difficult to draw firm conclusions about the actual physical site of the absorption. In Table 5, we have summarized the properties of the currently known population of Ovi - Ne viii absorbers. Except for the sight line discussed in this paper, imaging data exists for all the other fields. In four out of the six remaining instances, relatively bright galaxies () were found proximate ( kpc) to the absorbers. This is consistent with the correlation of Ovi absorbers with galaxies (e.g., Wakker & Savage, 2009), particularly their higher coveration fractions around galaxies that show evidence for star formation (Chen & Mulchaey, 2009; Tumlinson et al., 2011b).
We note that there have been few detections of Ne viii - Ovi absorbers tracing K gas. One would expect an occasional imprint of the hot component of the WHIM in quasar spectra by way of absorbers with (see Figure 6). The apparent dearth of K Ne viii systems is puzzling, although the current statistics are small. A straightforward interpretation is that the Ne viii absorbers in the current sample are having a physical origin different from the filamentary structures of the WHIM outside the virial boundaries of galaxies. The near-solar abundances are consistent with their origin in the extended regions around galaxies. Galaxy simulations find that the inclusion of feedback from star-formation and AGNs can heat circumgalactic gas to the warm temperatures of the WHIM (Cen & Ostriker, 2006; Tepper-García et al., 2012). In the simulations by Tepper-García et al. (2011), majority of halo Ovi absorbers are tracing such high-metallicity regions enriched by supernova driven outflows where the gas has started to radiatively cool from the post-shock temperatures of K.
The multiphase mix of cool and warm gas phases found in the Ne viii - Ovi absorbers are also analogus to the highly ionized Milky Way high velocity clouds. The Ne viii could have an origin similar to Ovi in the interface layers between the K high velocity gas and the K coronal ISM surrounding the galaxies (Sembach et al., 2003; Fox et al., 2004, 2006). The properties of several extragalactic Ovi absorbers are found to be consistent with ionization in such conductive interfaces or mixing layers (Narayanan et al., 2010a; Savage et al., 2010, 2011; Tumlinson et al., 2011a; Tripp et al., 2011). The transition temperatures at the layers between the cold and hot phases would explain the narrow range in temperature probed by the current sample of Ne viii absorbers (see Table 5).
The high sensitivity spectra afforded by COS will possibly reveal many more Ne viii - Ovi warm absorbers in the low redshift universe. Understanding where those absorbers reside with respect to galaxies along with a measurement on their chemical abundances will be important while predicting the origin of the warm gas. High metallicties and proximity to galaxies would favor an origin for the Ne viii and Ovi in virialized halos rather than the canonical WHIM distant from galaxies.
This research is supported by the NASA Cosmic Origins Spectrograph program through a sub-contract to the University of Wisconsin-Madison from the University of Colorado, Boulder and NNX08-AC14G to the University of Colorado, Boulder. B.P.W. acknowledges support from NASA grant NNX-07AH426. The authors thank Jim Green & team for delivering the Cosmic Origins Spectrograph and the STS-125 team for its installation on the HST. AN is indebted to Srianand Raghunathan and Sowgat Muzahid for valuable discussions. We are grateful to Gary Ferland and collaborators for developing the Cloudy photoionization code. We also thank Orly Gnat for making the computational data on radiatively cooling models public. This research has made use of the NASA/IPAC Extragalactic Database (NED) which is operated by the Jet Propulsion Laboratory, California Institute of Technology, under contract with the National Aeronautics and Space Administration.
References
- Cen & Ostriker (1999) Cen, R., & Ostriker, J. P. 1999, ApJ, 514, 1
- Cen & Ostriker (2006) Cen, R., & Ostriker, J. P. 2006, ApJ, 650, 560
- Chen & Mulchaey (2009) Chen, H.-W., & Mulchaey, J. S. 2009, ApJ, 701, 1219
- Danforth & Shull (2005) Danforth, C. W., & Shull, J. M. 2005, ApJ, 624, 555
- Danforth & Shull (2008) Danforth, C. W., & Shull, J. M. 2008, ApJ, 679, 194
- Danforth et al. (2010) Danforth, C. W., Stocke, J. T., & Shull, J. M. 2010, ApJ, 710, 613
- Davé et al. (2001) Davé, R., et al. 2001, ApJ, 552, 473
- Ding et al. (2003) Ding, J., Charlton, J. C., Churchill, C. W., & Palma, C. 2003, ApJ, 590, 746
- Ferland et al. (1998) Ferland, G. J., Korista, K. T., Verner, D. A., Ferguson, J. W., Kingdon, J. B., & Verner, E. M. 1998, PASP, 110, 761
- Fitzpatrick & Spitzer (1997) Fitzpatrick, E. L., & Spitzer, L., Jr. 1997, ApJ, 475, 623
- Fox et al. (2004) Fox, A. J., Savage, B. D., Wakker, B. P., Richter, P., Sembach, K. R., & Tripp, T. M. 2004, ApJ, 602, 738
- Fox et al. (2006) Fox, A. J., Savage, B. D., & Wakker, B. P. 2006, ApJS, 165, 229
- Froning & Green (2009) Froning, C. S., & Green, J. C. 2009, Ap&SS, 320, 181
- Green et al. (2012) Green, J. C., Froning, C. S., Osterman, S., et al. 2012, ApJ, 744, 60
- Gnat & Sternberg (2007) Gnat, O., & Sternberg, A. 2007, ApJS, 168, 213
- Haardt & Madau (2001) Haardt, F., & Madau, P. 2001, Clusters of Galaxies and the High Redshift Universe Observed in X-rays.
- Heckman et al. (2001) Heckman, T. M., Sembach, K. R., Meurer, G. R., et al. 2001, ApJ, 554, 1021
- Kereš et al. (2005) Kereš, D., Katz, N., Weinberg, D. H., & Davé, R. 2005, MNRAS, 363, 2
-
Kriss (2011)
Kriss, G. A. 2011, COS Instrument Science Report 2011-01(v1), 17 pages, 1,
http://www.stsci.edu/hst/cos/documents/isrs/ - Meiring et al. (2012) Meiring, J. D., Tripp, T. M., Werk, J. K., et al. 2012, arXiv:1201.0939
- Moos et al. (2000) Moos, H. W., Cash, W. C., Cowie, L. L., et al. 2000, ApJ, 538, L1
- Narayanan et al. (2009) Narayanan, A., Wakker, B. P., & Savage, B. D. 2009, ApJ, 703, 74
- Narayanan et al. (2010b) Narayanan, A., Wakker, B. P., Savage, B. D., et al. 2010b, ApJ, 721, 960
- Narayanan et al. (2010a) Narayanan, A., Savage, B. D., & Wakker, B. P. 2010a, ApJ, 712, 1443
- Narayanan et al. (2011) Narayanan, A., Savage, B. D., Wakker, B. P., et al. 2011, ApJ, 730, 15
- Osterman et al. (2011) Osterman, S., Green, J., Froning, C., et al. 2011, Ap&SS, 335, 257
- Richter et al. (2004) Richter, P., Savage, B. D., Tripp, T. M., & Sembach, K. R. 2004, ApJS, 153, 165
- Richter et al. (2006) Richter, P., Savage, B. D., Sembach, K. R., & Tripp, T. M. 2006, A&A, 445, 827
- Sahnow et al. (2000) Sahnow, D. J., Moos, H. W., Ake, T. B., et al. 2000, ApJ, 538, L7
- Savage & Sembach (1991) Savage, B. D., & Sembach, K. R. 1991, ApJ, 379, 245
- Savage et al. (2002) Savage, B. D., Sembach, K. R., Tripp, T. M., & Richter, P. 2002, ApJ, 564, 631
- Savage et al. (2005) Savage, B. D., Lehner, N., Wakker, B. P., Sembach, K. R., & Tripp, T. M. 2005, ApJ, 626, 776
- Savage et al. (2010) Savage, B. D., Narayanan, A., Wakker, B. P., et al. 2010, ApJ, 719, 1526
- Savage et al. (2011) Savage, B. D., Lehner, N., & Narayanan, A. 2011, ApJ, 743, 180
- Sembach et al. (2003) Sembach, K. R., Wakker, B. P., Savage, B. D., et al. 2003, ApJS, 146, 165
- Stocke et al. (2006) Stocke, J. T., Penton, S. V., Danforth, C. W., Shull, J. M., Tumlinson, J., & McLin, K. M. 2006, ApJ, 641, 217
- Tepper-García et al. (2011) Tepper-García, T., Richter, P., Schaye, J., et al. 2011, MNRAS, 413, 190
- Tepper-García et al. (2012) Tepper-García, T., Richter, P., Schaye, J., et al. 2012, arXiv:1201.5641
- Tripp & Savage (2000) Tripp, T. M., & Savage, B. D. 2000, ApJ, 542, 42
- Tripp et al. (2008) Tripp, T. M., Sembach, K. R., Bowen, D. V., Savage, B. D., Jenkins, E. B., Lehner, N., & Richter, P. 2008, ApJS, 177, 39
- Tripp et al. (2011) Tripp, T. M., Meiring, J. D., Prochaska, J. X., et al. 2011, Science, 334, 952
- Tumlinson et al. (2011a) Tumlinson, J., Werk, J. K., Thom, C., et al. 2011, ApJ, 733, 111
- Tumlinson et al. (2011b) Tumlinson, J., Thom, C., Werk, J. K., et al. 2011, Science, 334, 948
- Valageas et al. (2002) Valageas, P., Schaeffer, R., & Silk, J. 2002, A&A, 388, 741
- van de Voort et al. (2011) van de Voort, F., Schaye, J., Booth, C. M., Haas, M. R., & Dalla Vecchia, C. 2011, MNRAS, 414, 2458
- Wakker et al. (2003) Wakker, B. P., et al. 2003, ApJS, 146, 1
- Wakker & Savage (2009) Wakker, B. P., & Savage, B. D. 2009, ApJS, 182, 378
| HST ID | Obs.Date | Grating | FP-POS | |||
|---|---|---|---|---|---|---|
| (yyyy:mm:dd) | (Å) | (Å) | (sec) | |||
| LB6810010 | 2010-01-01 | G130M | 3 | 1291 | 3840 | |
| LB6810020 | 2010-01-01 | G130M | 3 | 1300 | 3840 | |
| LB6810030 | 2010-01-01 | G130M | 3 | 1309 | 3840 | |
| LB6810040 | 2010-01-01 | G130M | 3 | 1318 | 3840 | |
| LB6811020 | 2010-02-22 | G160M | 3 | 1589 | 4500 | |
| LB6811030 | 2010-02-22 | G160M | 3 | 1600 | 4500 | |
| LB6811040 | 2010-02-22 | G160M | 3 | 1611 | 4500 | |
| LB6811050 | 2010-02-22 | G160M | 3 | 1623 | 4500 |
Note. — Column (1) is the HST ID for the data set, column (2) gives the date of observation, column (3) lists the choice of grating, columns (4) and (5) are the the FP position and central wavelength of the grating, column (6) gives the wavelength range sampled under each setting and column (7) lists the duration of the exposure. All observations were done as part of the COS-GTO program ID 11541 (PI Green).
| Line | log | |||
|---|---|---|---|---|
| (mÅ) | (km s-1) | dex | (km s-1) | |
| H i 1215 | [-150,150] | |||
| H i 1025 | [-150,100] | |||
| H i 972 | [-150,100] | |||
| H i 938 | [-75,75] | |||
| H i 930 | [-75,75] | |||
| Ovi 1031 | [-75,75] | |||
| Ovi 1037 | [-75,75] | |||
| C iii 977 | [-75,75] | |||
| C iii 977 | [-75,-10] | |||
| C iii 977 | [-10,75] | |||
| Niii 989 | [-10,75] | |||
| Niii 989 | [-75,-10] | |||
| Si iii 1206 | [-40, 40] | |||
| Si iii 1206 | [-10,40] | |||
| Si iii 1206 | [-40,-10] | |||
| C ii 903a | [-15,30] | |||
| C ii 903b | [-15,30] | |||
| C ii 1036 | [-15,30] | |||
| C ii 1036 | [-75,-10] | |||
| Nii 1083 | [-75,75] | |||
| Si ii 1193 | [-75,75] |
Note. — The AOD integrations were performed over the velocity range over which absorption is seen. The Ly, Ly and Ly have saturated line cores and the measurements are therefore lower limits. The C iii 977 Å and Si iii 1206 Å lines have a two component profile. The AOD measurements were done over the full absorption as well as the positive and negative velocity components. Niii, and C ii show absorption only in the positive velocity component. We have listed upper limits for the negative velocity component. The C ii Å () transition is labelled as C ii 903a and the Å () transition as C ii 903b. Nii and Si ii are not detected at the level.
| Line | log | |||
|---|---|---|---|---|
| (km s-1) | dex | (km s-1) | ||
| 1.14 | ||||
| 1.17 | ||||
| C iii 977 | 0.56 | |||
| C ii 903a | 0.40 | |||
| C ii 903b | 0.30 | |||
| C ii 1036 | 0.63 | |||
| C ii 903a,903b,1036 | 0.53 | |||
| Niii 989 | 0.52 | |||
| Ovi 1032/1038 | 0.53 | |||
| Si iii 1206 | 0.99 | |||
Note. — The velocity uncertainty includes the statistical errors computed by the fitting routine and a km s-1 velocity calibration error in the COS spectrum. The H i parameters were obtained from a simultaneous free-fit to the various uncontaminated Lyman series lines. The reduced- of the fit is affected by the wavelength calibrations errors in the spectrum. A simultaneous fit on H i was also done by locking the velocity centroids of the components to the velocities in the C iii 977 Å absorption. The fit parameters from this and the free-fit are within of each other. The C ii Å () transition is labelled as C ii 903a and the Å () as C ii 903b. Simultaneous fits were done for the C ii multiplet lines and the Ovi Å doublet lines.
| Line | log | |||
|---|---|---|---|---|
| (mÅ) | (km s-1) | dex | (km s-1) | |
| O ii 834 | [-75,75] | |||
| O iii 833 | [-75,-10] | |||
| O iii 833 | [-10,75] | |||
| O iv 788 | [-75,-10] | |||
| O iv 788 | [-10,75] | |||
| N iv 765 | [-75,-10] | |||
| N iv 765 | [-10,75] | |||
| Ne viii 770 | [-75,-10] | |||
| Ne viii 770 | [-10,75] | |||
| Ne viii 770 | [-75,75] |
Note. — The data has lower compared to COS and therefore the component sub-structure seen in the COS absorption lines for this system are not evident. For the purpose of modeling we have split the integration range of into two regions corresponding to the velocities of the two components in H i and C iii seen in the COS spectrum.
| QSO | [X/H] | Assoc. Galaxy | Note | |||||
|---|---|---|---|---|---|---|---|---|
| HE 0226-4110 | 0.2070 | 5.70 | 109 kpc, 0.25 | 1 | ||||
| PKS 0405-123 | 0.4951 | 5.72 | 110 kpc, | 2 | ||||
| PG 1148+549 | 0.6838 | 5.68 | … | 3 | ||||
| 0.7015 | 5.69 | … | 3 | |||||
| 0.7248 | 5.72 | 217 kpc, | 3 | |||||
| 3C 263 | 0.3257 | 5.72 | … | 4 | ||||
| PG 1206+459 | 68 kpc, | 5 |
Note. — (1) From Savage et al. (2011); the abundance listed is for oxygen. (2) From Narayanan et al. (2011); the abundance listed is for neon; the total hydrogen column density was found to be in the range dex. (3) The and absorbers in Meiring et al. (2012) have no associated galaxies detected down to . (4) This paper; there is no galaxy information available for this sightline. (5) The absorption has several components kinematically spread over km s-1. The Ne viii column density listed is the total column density from all the components as given in Tripp et al. (2011). The temperature, metallicity and information on the galaxy are based on Tripp et al. (2011). The Ovi lines are covered only in the lower resolution (FWHM km s-1) /FOS spectrum and reported in Ding et al. (2003). The absorption is very strong [ Å], but there are no column density measurements because of various line contamination issues.
![[Uncaptioned image]](/html/1204.3951/assets/x1.png)
Fig. 1a – Continuum normalized COS and spectra of where km s-1 corresponds to . Features which are not part of the absorption system are marked ”x” in the corresponding panels. The AOD and profile fit line measurements are listed in Tables 2 & 3. The Ly- (H i ) line is contaminated by Galactic Si ii 1260 and possibly also by Sii 1260. The C ii lines at Å and Å are labelled as C ii 903a and C ii 903b respectively.The Nii 1084 and Si ii 1193 transitions covered by COS and O ii 834 transition covered by are not detected at significance.
![[Uncaptioned image]](/html/1204.3951/assets/x2.png)
Fig. 1b – Continuation of Figure 1a.