Herschel††thanks: Herschel is an ESA space observatory with science instruments provided by European-led Principal Investigator consortia and with important participation from NASA.-ATLAS: Planck sources in the Phase 1 fields
We present the results of a cross-correlation of the Planck Early Release Compact Source Catalog (ERCSC) with the catalog of Herschel-ATLAS sources detected in the Phase 1 fields, covering . There are 28 ERCSC sources detected by Planck at 857 GHz in this area. As many as 16 of them are probably high Galactic latitude cirrus; 10 additional sources can be clearly identified as bright, low- galaxies; one further source is resolved by Herschel as two relatively bright sources; and the last is resolved into an unusual condensation of low-flux, probably high-redshift point sources, around a strongly lensed Herschel-ATLAS source at . Our results demonstrate that the higher sensitivity and higher angular resolution H-ATLAS maps provide essential information for the interpretation of candidate sources extracted from Planck sub-mm maps.
Key Words.:
Infrared: galaxies – Submillimetre: galaxies – ISM1 Introduction
During the past year, the simultaneous operation of ESA’s Herschel (Pilbratt et al. 2010) and Planck (Tauber et al. 2010; Planck Collaboration et al. 2011a) missions has given us an unprecedented opportunity to cover one of the last few observational gaps in the far-infrared and sub-millimeter regions of the electromagnetic spectrum. Herschel is an observatory facility that covers the m spectral range, with angular resolution ranging between 6 and 35 arcseconds (Pilbratt et al. 2010). Planck is a surveyor that is observing the whole sky in nine spectral bands between 350 m and 1 cm and with angular resolution ranging from to arcmin. Planck has two frequency channels close to Herschel bands: the 545 and 857 GHz (550 and m) channels of the High Frequency Instrument (HFI). In this paper we will study the cross-correlation of the Planck Early Release Compact Source Catalog (ERCSC) with the Phase 1 of the catalogue of the Herschel Astrophysical Terahertz Large Area Survey (H-ATLAS, Eales et al. 2010).
The overlap in time and frequency between Herschel and Planck is not accidental: the two missions have been planned while keeping in mind the added scientific value of a synergy between them (Planck Collaboration 2006). In addition to providing a broader spectral coverage of common sources, the combination of Planck and Herschel data will be beneficial in other respects. In particular, the much higher resolution and sensitivity of Herschel makes it well suited for follow-up of Planck sources111For comparison, the resolution at the SPIRE 350 m band is FWHM=29.4 arcsec, whereas the ERCSC nominal beam at 857 GHz is 4.23 arcmin., allowing us to assess the effects of source confusion in Planck channels. In some cases it will be possible to resolve individual detections by Planck into separated sources. More generally, Herschel will make it possible to quantify the boosting of Planck fluxes by the many faint sources within its beam. Moreover, Herschel data can be used to improve the foreground characterization, thus helping to distinguish between genuine, possibly extragalactic, point sources and compact Galactic cirrus, and to provide more precise positions, essential for source identification at other wavelengths. This knowledge will be important for the interpretation of the all-sky Planck survey data. Note however that although Herschel’s resolution is much better than Planck’s, it is still highly likely that many of the Herschel 350 and 500 m sources are also blends. H-ATLAS maps are in general not affected by source confusion, except in regions with important cirrus, but Herschel sources resolve to multiple MIPS (Multiband Imaging Photometer for Spitzer Rieke et al. 2004) sources in many cases.
In turn, Herschel will benefit from the absolute calibration of Planck fluxes which should be better than 2% up to 353 GHz, where it is based on the CMB dipole, and in the two highest frequency channels (545 and 857 GHz), where it is based on a comparison with COBE/FIRAS (Planck HFI Core Team et al. 2011; Zacchei et al. 2011)222This refers to the absolute calibration of the instrument. For individual sources, however, the uncertainty in the photometry is affected by other factors such as the uncertainty on the beam shape and the possibly extended nature of the source, leading to errors that can be as large as 30%, as cited by the Explanatory Supplement to the Planck ERCSC.. For comparison, the overall photometric accuracy of the Herschel-SPIRE instrument is conservatively estimated as (SPIRE Observers’ Manual v2.2 2010)333The SPIRE Observers’ Manual is available from the Herschel
Science Centre:
http://herschel.esac.esa.int/Docs/SPIRE/pdf/spire_om.pdf..
A comparison between catalogues of galaxies observed with Herschel and Planck can be used as a check on the calibration of the two observatories, which are done in different ways.
Due to their different angular resolution and sensitivity, Planck and Herschel have almost complementary selection functions: Planck is most sensitive to either local galaxies or extreme high redshift objects whereas most H-ATLAS sources lie around (Eales et al. 2010). Moreover, Planck covers a broader spectral range (nine frequencies from 30 to 857 GHz), which is useful in order to improve the characterization and removal of foregrounds and to follow the SEDs of interesting objects, such as blazars, down to radio frequencies. With its all-sky coverage, Planck is ideal for detecting the rarest, most extreme (sub-)mm sources. In particular, it may detect the most luminous proto-clusters of dusty galaxies, whose luminosities, integrated over the Planck beam, may be, at , more than an order of magnitude higher than the mean luminosity of individual dusty galaxies at the same redshift (Negrello et al. 2005). The far superior Herschel resolution and point source detection capabilities will then allow us to establish the nature of candidate high- proto-clusters and to characterize the physical properties of those that are confirmed.
This latter point deserves some more attention. The discovery of distant far-IR luminous galaxies by sub-mm imagers (e.g. Smail et al. 1997; Hughes et al. 1998) and the discovery of the Cosmic Infrared Background (Puget et al. 1996; Fixsen et al. 1998) have demonstrated the importance of the far-IR/sub-mm bands in determining a complete picture of the history of galaxy formation and evolution. The high redshift (2–3) sources detected in these sub-mm surveys are expected to be the progenitors of the giant elliptical galaxies that we see today (e.g. Blain et al. 2002). In the framework of hierarchical clustering models of large scale structure and galaxy formation we would expect that the most massive elliptical galaxies form in the cores of what will become today’s richest galaxy clusters. Granato et al. (2004) and others predict that multiple galaxies in such regions will undergo dust obscured starbursts at about the same time, producing clumps of dusty proto-spheroidal galaxies. Moreover, the ages of elliptical galaxies in low- clusters are all similar, which implies that they all probably formed in large and rapid starburst events at high- (de Propris et al. 1999), probably associated with clumps of forming galaxies.
Hints of such objects may already have been found by clustering studies with Spitzer (e.g. Magliocchetti et al. 2007), or using high- quasars as signposts for possible proto-clusters (Ivison et al. 2000; Stevens et al. 2003; Priddey et al. 2008; Stevens et al. 2010). The latter study finds far more sub-mm bright companions to quasars than expected from the blank-field number counts, suggesting the presence of dusty proto-clusters. Meanwhile, the highest redshift proto-cluster currently known, at , includes at least one sub-mm luminous object (Capak et al. 2011). While this object is extreme, such sources may need to be quite common if the recent discovery of a mature galaxy cluster at (Gobat et al. 2011), with a fully formed red-sequence of galaxies with ages Gyr, is representative of a significant population.
The dusty star-forming phase of a proto-cluster is likely to be quite short, so the objects should be rare on the sky. Fortunately, Herschel and Planck are up to this challenge. Herschel allows relatively large areas of the sky to be covered to sensitive flux levels at wavelengths corresponding to the peak of the dust spectral energy distribution (SED) of high redshift starbursts (e.g. Lapi et al. 2011). Meanwhile, Planck provides all-sky coverage at wavelengths matching the longest Herschel bands and stretching into the mm. Therefore, Planck can find cold compact structures and Herschel can then confirm that these are associated with clumps of galaxies, potentially at high redshift.
The Early Release Compact Source Catalogue (ERCSC, Planck Collaboration et al. 2011b) provides an all-sky list of compact Galactic and extragalactic objects including stars with dust shells, prestellar cores, radio galaxies, blazars, infrared luminous galaxies, Galactic interstellar medium features, cold molecular cloud core candidates and galaxy cluster candidates. The list contains more than 15,000 distinct objects, of which are visible in the Planck highest frequency (545 and 857 GHz) channels that virtually overlap with the Herschel/SPIRE bands. A sufficiently wide-area survey made with Herschel is bound to contain at least some of these sources.
The Herschel Astrophysical Terahertz Large Area Survey H-ATLAS (Eales et al. 2010) is the largest area survey carried out by the Herschel Space Observatory (Pilbratt et al. 2010). It will cover with PACS (Poglitsch et al. 2010) and SPIRE (Griffin et al. 2010) in five bands, from to m. The Phase 1 observations have surveyed enough area () to allow a preliminary, yet meaningful comparison with Planck ERCSC data.
In this paper we present the results of a cross-correlation of the Planck ERCSC catalog with the catalog of H-ATLAS sources detected in the Phase 1 fields (Dunne et al., in preparation). The common sources are described in § 2. In § 3 we compare the flux density estimates of both experiments. In § 4 we study the contamination of the ERCSC subsample by looking for extended diffuse emission as a tracer of high-latitude cirrus. In § 5 we discuss a very unusual source that may be a combination of a (maybe random) condensation of low redshift low-flux galaxies and a strongly lensed galaxy. Finally, in § 6 we summarize our conclusions.
2 Planck sources in the H-ATLAS phase 1 fields


The two highest frequency channels of the Planck HFI practically overlap with the two lower frequency bands of Herschel SPIRE. The 350 m band almost coincides in central wavelength and bandwidth with the Planck HFI 857 GHz channel. The 500 m band and the Planck HFI 545 GHz channel do not coincide exactly, but are close enough to consider a cross-check. The H-ATLAS Phase 1 covers divided into three regions (GAMA-09, GAMA-12 and GAMA-15).
2.1 H-ATLAS m counterparts of ERCSC 857 GHz sources
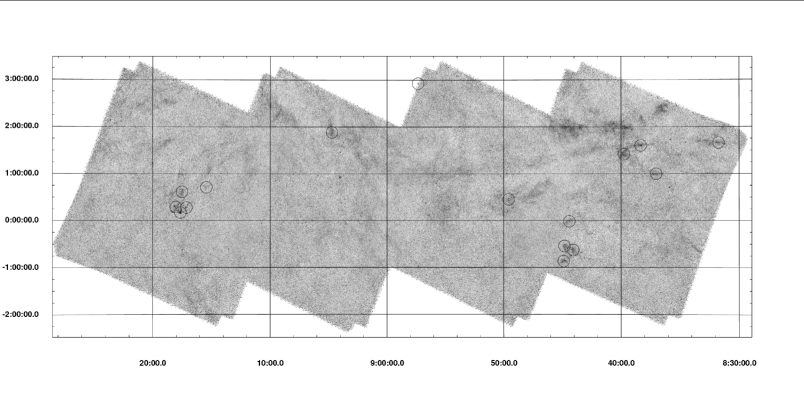
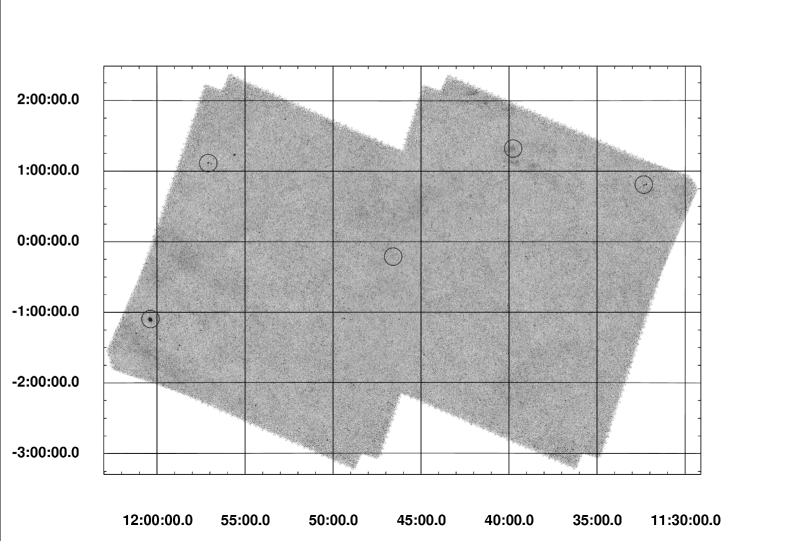
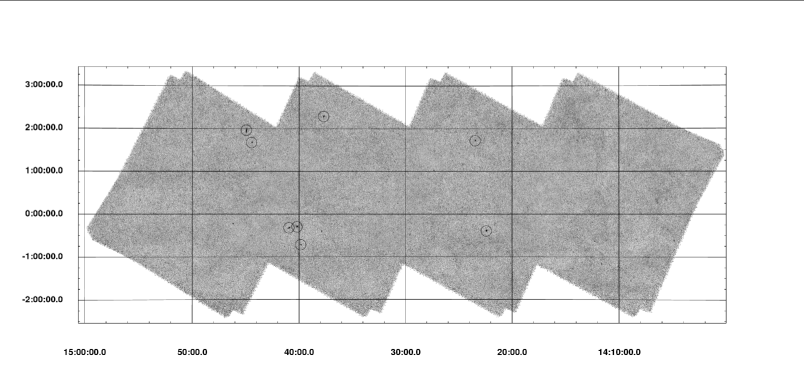
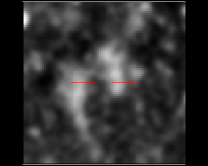
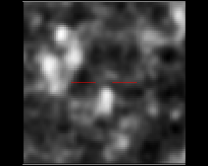
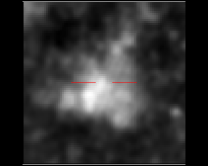
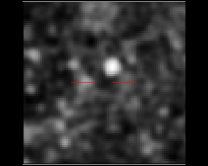
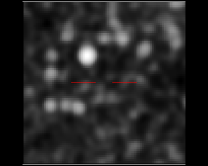
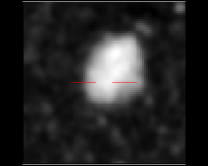
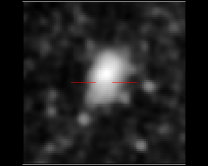
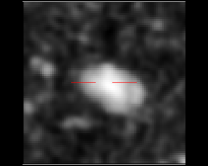
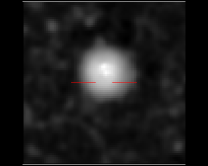
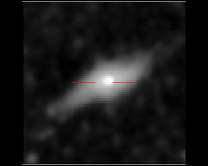
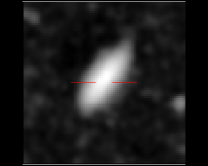
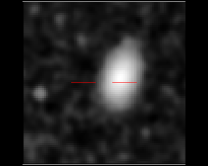
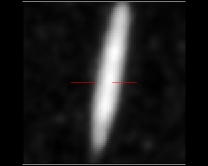
Within the H-ATLAS Phase 1 fields there are 28 ERCSC sources detected by Planck at 857 GHz. Among these, there are no clusters of galaxies (detected through the Sunyaev-Zel’dovich effect) or cold cores. Figures 5, 6 and 7 show postage stamp images of these 28 sources as viewed by Herschel at 350 m in the GAMA-09, GAMA-12 and GAMA-15 fields, respectively. By inspecting the SPIRE images around the positions of the sources we find several different situations.
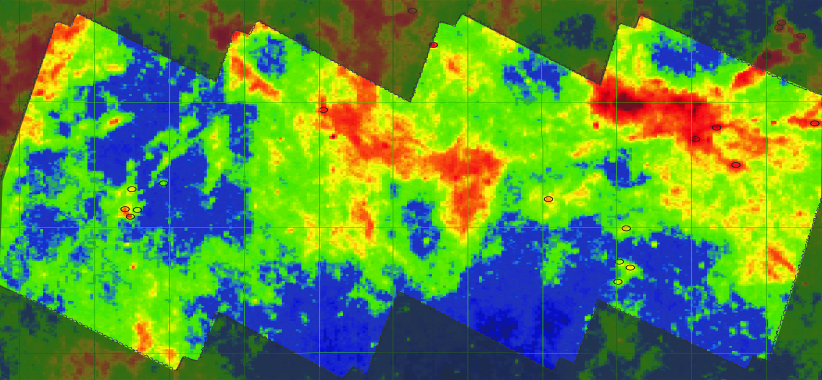
As many as 16 out of the 28 ERCSC objects do not have a consistent H-ATLAS counterpart, because H-ATLAS sources within the Planck beam are too faint to explain the flux density measured by Planck. Almost all (15) of them are flagged as extended and/or have a relatively high () cirrus flag in the ERCSC (11 have both properties). All but G266.26+58.99 (object (b) in Figure 6 which, incidentally, is not flagged as extended and has a relatively low cirrus flag) are in the GAMA-09 field, which is more contaminated by Galactic emission than the other two GAMA fields. Fig. 4 shows the positions of the ERCSC sources around the GAMA-09 field superimposed to the IRIS 100 micron map (Miville-Deschênes & Lagache 2005). The high correlation between ERCSC sources and the IRIS map reinforces the idea that the GAMA-09 ERCSC sources are likely to be mostly related to Galactic cirrus.
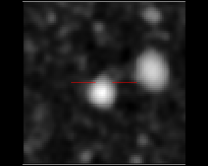
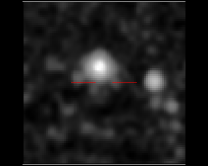
As for the other 12 sources, one (G263.84+57.55, the object (a) in Figure 6) is clearly resolved by Herschel into two relatively bright sources, the galaxy pair KPG289 (Karachentsev et al. 1976) formed by the galaxies NGC3719 and NGC3720, each with flux density mJy at 350 m, while another object (G270.59+58.52, shown in panel (c) of Figure 6) is resolved into an unusual condensation of low flux, probably high-redshift point sources. We will discuss this source in more detail in § 5. Finally, 10 ERCSC sources can be clearly identified with single bright H-ATLAS sources at low redshift, including the edge-on spiral NGC5746 (object (h) in Figure 7) the spirals NGC5690, NGC5705 and NGC4030, the peculiar asymmetric galaxy NGC5713 (Dale et al. 2012), in addition to the the above mentioned pair NGC3719 and NGC3720.
Table 1 lists the 28 sources with their 857 GHz flux densities taken from the ERCSC (Planck Collaboration 2011). The table gives the ERCSC source name, the RA and Dec coordinates, the flux densities and associated errors, and the EXTENDED and CIRRUS flags. Column 9 gives the m flux densities of the brightest H-ATLAS sources found inside the Planck beam444Unless otherwise stated, the beam is a circle whose radius is ., provided that they have mJy. For these sources we give, in column 11, the spectroscopic or photometric redshifts taken from the H-ATLAS catalog (Dunne et al., in preparation). The positions of the 28 sources in the ATLAS GAMA09, GAMA-12 and GAMA-15 fields are shown in Figures 1, 2 and 3 respectively.
2.2 H-ATLAS m counterparts of ERCSC 545 GHz sources
Turning now to longer wavelengths, all but one (PLCKERC545 G230.17+32.05) of the 14 ERCSC sources detected by Planck at 545 GHz that lie in the H-ATLAS Phase 1 fields are among the 28 objects described in § 2.1. The object not detected by Planck at 857 GHz is in the GAMA09 region and has a high CIRRUS flag. Like at 857 GHz, more than half of the sources (8 out of 14, 7 of them being in the GAMA09 field) do not have a plausible H-ATLAS counterpart. Table 2 lists the 14 sources, giving the H-ATLAS ID and redshifts for the six sources which have a 500 m counterpart with mJy.
3 Photometry
The comparison of the flux density estimations of the ERCSC and the SPIRE Phase 1 catalogues is not straightforward. In order to correctly compare ERCSC and SPIRE photometric estimations it is necessary to take into account that:
-
•
Herschel has better angular resolution than Planck. It is possible that an ERCSC source can be resolved into several sources by Herschel.
-
•
The wavelengths of the Planck bands do not correspond exactly to the wavelenghts of their Herschel counterparts.
-
•
Both catalogues have been obtained by using different detection and photometry extraction algorithms.
The effect of the different angular resolutions can be corrected, at least to first order, by integrating the SPIRE flux densities over the larger Planck beam area and weighting by the Planck beam response. The effect of the different central wavelenghts can be taken into account by means of SED colour correction, as will be described in § 3.2. A review of the technical details of the ERCSC and SPIRE flux density estimates used in the catalogues is beyond the scope of this work. ERCSC photometry is described in Planck Collaboration et al. (2011b); Aatrokoski et al. (2011); SPIRE photometry is described in Rigby et al. (2011); both catalogues have passed strict internal and external validation. For pointlike sources, we assume that the flux density estimates that are given in both catalogues are accurate, within the calibration uncertainties of their experiments. However, it must be noted that the different ways in which the photometry of extended sources is done in the ERCSC and in the ATLAS Phase 1 catalogues can affect the comparison. The ATLAS catalogues use aperture photometry scaled to the optical size of the sources (Rigby et al. 2011). The Planck ERCSC contains several types of photometric measurements for each source; the default aperture photometry information is listed in the ERCSC ‘FLUX’ column, but other photometric measurements may be more appropriate in certain circumstances. As described in the Planck Explanatory Supplement to the ERCSC (Aatrokoski et al. 2011), for extended sources it may be better to use the Gaussian-fit photometry listed in the ERCSC ‘GAUFLUX’ column instead of a fixed aperture photometry. Since a significant fraction of the sources in our sample at 857 GHz are flagged as extended in the ERCSC, we have compared the H-ATLAS flux densities to both the fixed aperture photometry (‘FLUX’) and the Gaussian-fit (‘GAUFLUX’) ERCSC flux densities. We find that at the lowest fluxes FLUX and GAUFLUX work similarly well, while at bright fluxes GAUFLUX is more consistent with Herschel photometry (may be because many bright ERCSC sources are extended). Therefore, in the rest of this paper, we will use GAUFLUX when referring to Planck photometry.
3.1 ERCSC-857 GHz and H-ATLAS flux densities
According to the technical specifications of their respective instruments, the Planck/HFI 857 GHz and the Herschel/SPIRE 350 m channels have almost exactly the same central wavelength and roughly the same bandwidth. This makes it easy to directly compare the flux density estimations of the ERCSC sources present in the H-ATLAS fields. In order to take into account the different angular resolutions of Herschel and Planck, we have calculated an effective Herschel 350 m flux density by summing up the flux densities, corrected for the effect of the Planck beam, of the sources listed in the H-ATLAS Phase 1 catalogue around the ERCSC positions. We have assumed a circular, Gaussian beam of arcmin (Planck Collaboration et al. 2011b).
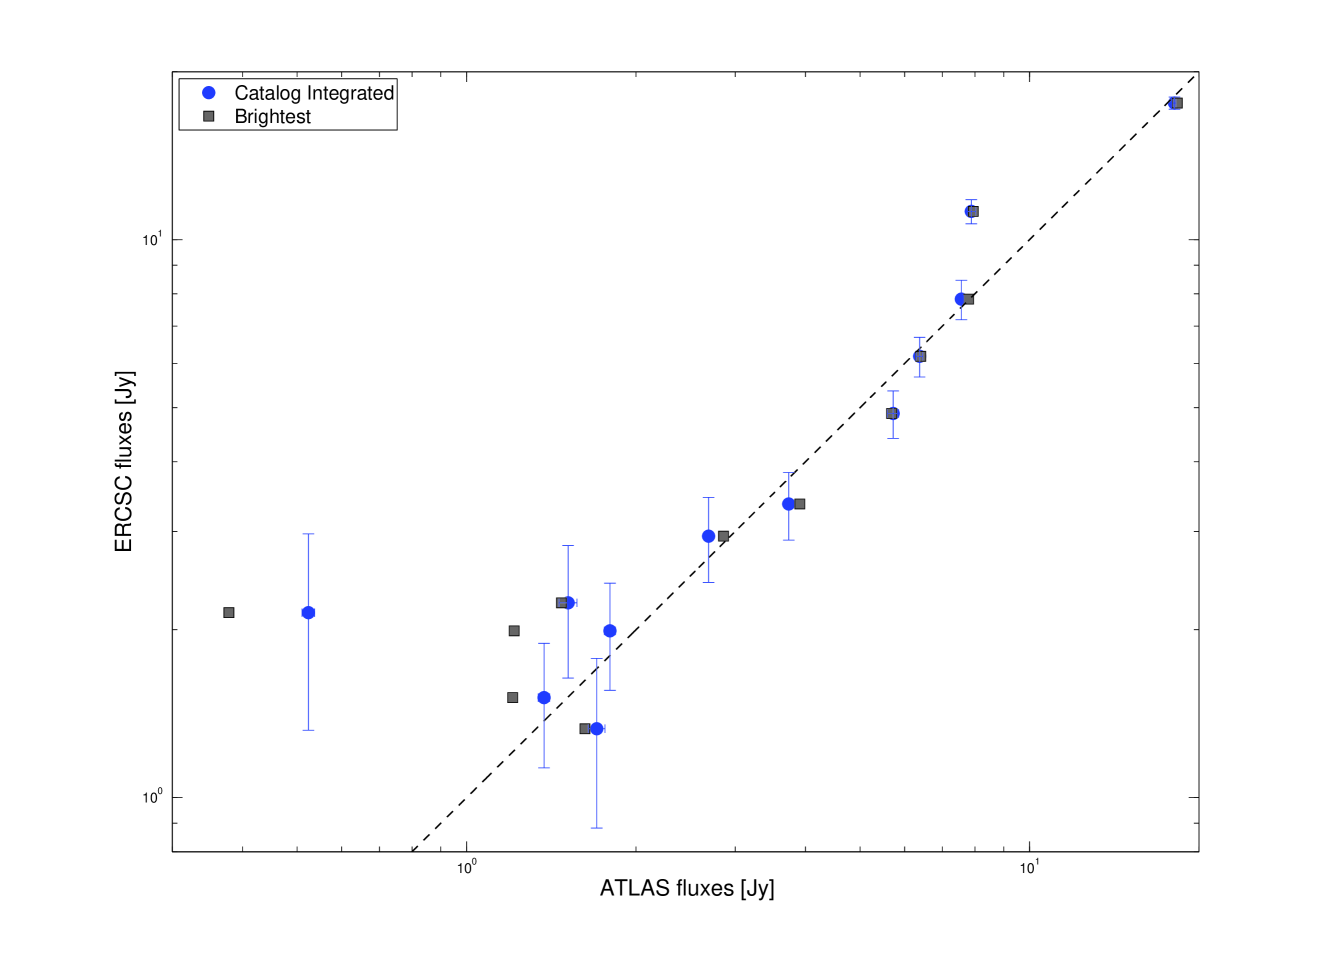
Fig. 8 shows the Planck 857 GHz flux densities compared to Herschel flux densities for those ERCSC sources that have at least one mJy. All these sources lie in the GAMA-12 or GAMA-15 fields. According to Aatrokoski et al. (2011), the ERCSC flux densities below Jy are boosted by the well known selection bias (sources sitting on top of positive noise plus confusion plus Galactic emission fluctuations that dominate the contribution to the measured flux densities are more likely to be detected). Leaving aside the large edge-on spiral NGC5746, which will be discussed below, for sources with H-ATLAS m flux densities Jy we see a good agreement between Herschel and Planck flux densities. We find Jy. The relative flux density difference for the same sources, defined as
| (1) |
is , smaller than the calibration uncertainty of both Herschel and Planck. However, the relative difference of the individual sources shows a large () scatter, probably due to the small size of the sample. The mean difference between ERCSC and H-ATLAS positions for sources brighter than 1.5 Jy is 0.42 arcmin, with a dispersion of 0.17 arcmin. For the assumed beam shape, this may account for a underestimate of ERCSC flux densities.
The two remarkable outliers in Figure 8 are the sources and in Table 1. The source , G270.59+58.52 (object (c) in Figure 6), flagged as extended in the ERCSC and with mJy will be discussed in § 5. The source (object (h) in Figure 7) is identified as NGC5746, a large edge-on spiral that is clearly resolved as a very extended source by SPIRE but is not flagged as extended by the ERCSC. We believe that the discrepancy between the flux densities for this object reported by H-ATLAS and the ERCSC is due to the very different angular resolution of Herschel and Planck and by the different way in which background subtraction has been performed by the catalog making pipelines of the two experiments. In particular, if aperture photometry is applied to the raw (non background subtracted) SPIRE 350 micron map, a flux density of Jy is obtained for this object, which is more consistent with the 857 GHz value.
3.2 ERCSC-545 GHz and H-ATLAS flux densities
The comparison between the Planck 545 GHz and the SPIRE 500 m flux densities is less straightforward. The central frequency of the 500 m channel is GHz, significantly higher than that of the nearest Planck channel (545 GHz). A colour correction is thus necessary. From the mean SED of IRAS PSC galaxies determined by Serjeant & Harrison (2005), we find . For the comparison with Planck we scale down the H-ATLAS flux densities by this factor, except for the rich clump of low-flux galaxies, for which we adopted a correction factor of 1.1 for the strongly lensed galaxy at and of 1.3 for the surrounding H-ATLAS sources, assumed to be at . These factors have been calculated using the SED of H-ATLAS J142413.9+022304, a strongly lensed sub-mm galaxy at (Cox et al. 2011), for the strongly lensed galaxy and the SED of SMM J2135-0102 (‘The Cosmic Eyelash’; Ivison et al. 2010; Swinbank et al. 2010), that Lapi et al. (2011) found to work well for many high- H-ATLAS galaxies. We will denote the colour corrected flux by the symbol .
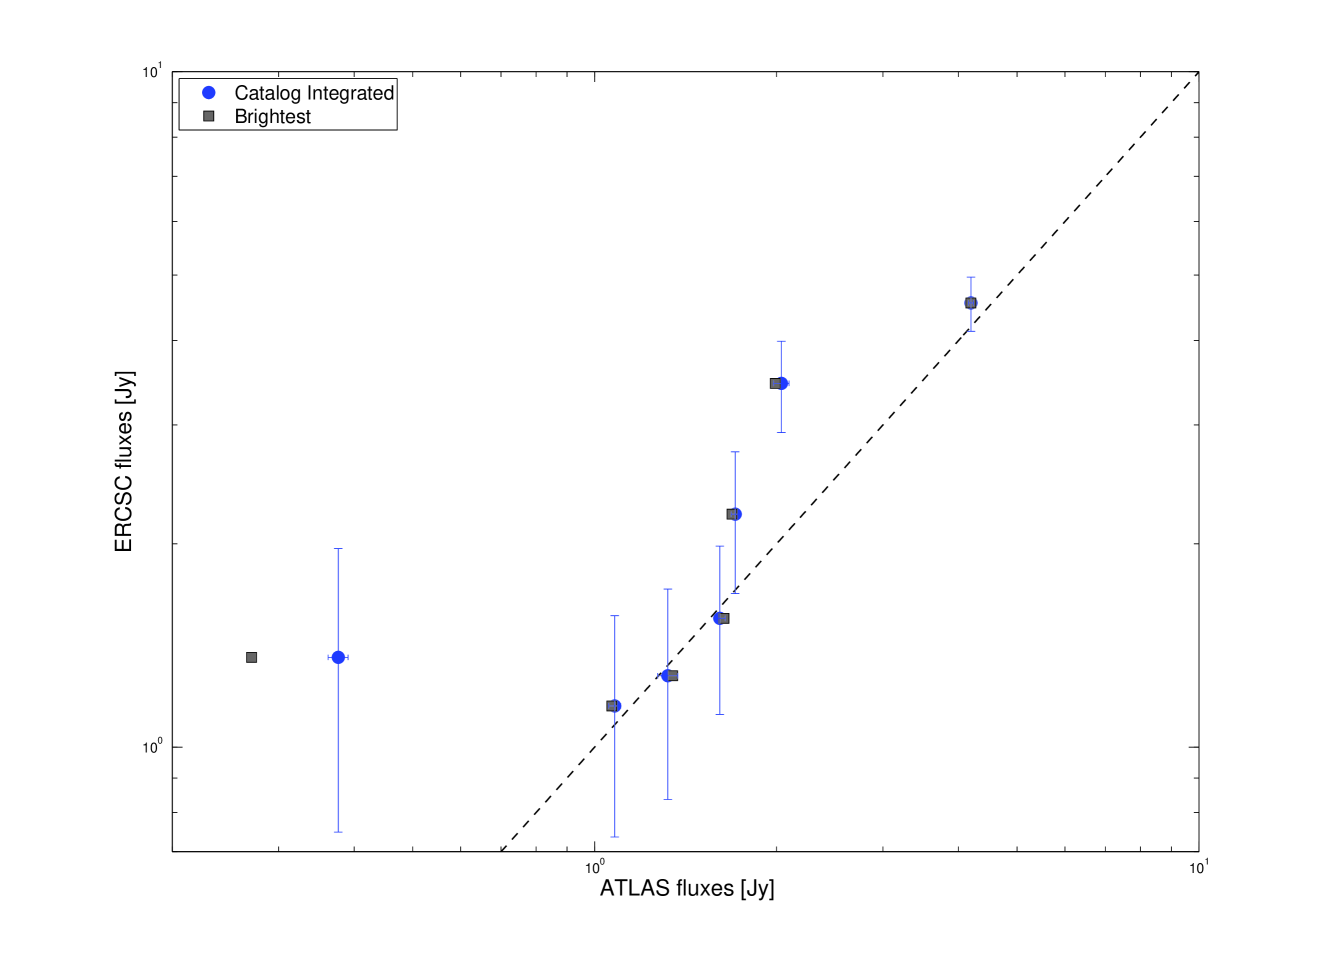
Figure 9 compares the Planck 545 GHz flux density with that of the brightest source inside the Planck beam (filled squares) and with that obtained summing the flux densities of H-ATLAS sources within the Planck beam, corrected for the effect of the beam response ( arcmin) function and the colour correction (filled circles). Only the Planck ERCSC 545 GHz sources that have at least one H-ATLAS counterpart with (non colour corrected) mJy are shown in the plot. Again NGC5746 and the clump around G270.59+58.52 stand out for their high ERCSC to H-ATLAS flux density ratios. Leaving these aside, we find, after the colour correction, Jy, with a dispersion of Jy for sources with Jy. The corresponding relative difference is with dispersion . This result, however, has been obtained from a very small sample of five sources and cannot be considered statistically meaningful.
4 Contamination by Galactic cirrus
The GAMA-09 field is more contaminated by Galactic emission than the other two GAMA fields (Bracco et al. 2011). None of the 15 ERCSC 857 GHz sources, in this field with in the range 1.2–3.5 Jy, have a plausible Herschel counterpart. The summed flux densities of the faint Herschel sources within the Planck beam fall well short of accounting for the ERCSC flux densities. A visual inspection of Figure 5 clearly reinforces the idea that the ERCSC sources in this region of the sky are not associated with bright Herschel galaxies. All but two of the ERCSC sources in the GAMA-09 have a cirrus flag and all but two (different from the previous two objects) are labeled as extended in the ERCSC. It is thus likely that most of the flux density within the Planck beam comes from Galactic cirrus. The situation is much better in the GAMA-12 and GAMA-15 fields. In the former, only one (out of five) 857 GHz ERCSC source does not have an H-ATLAS counterpart with mJy. Somewhat surprisingly, this source is not labeled as extended in the ERCSC and has a relatively low cirrus flag (0.0625). One of the two ERCSC 545 GHz sources in the same field behaves in a similar way: no H-ATLAS counterpart with mJy, not labeled as extended, low cirrus flag (0.03125). Fortunately, all the eight 857 GHz and the five 545 GHz ERCSC sources in the GAMA-15 field do have a consistent H-ATLAS counterpart.
Although the statistics are poor, these findings may indicate that all ERCSC sources with a cirrus flag are cirrus dominated, even if they are not labeled as extended, as is the case for two 857 GHz and three 545 GHz GAMA09 sources. Of the three 857 GHz sources labeled as extended but with a cirrus flag , two are probably cirrus dominated, while the third is the composite high- lensed galaxy plus low- clump (see § 5). All 545 GHz sources labeled as extended are probably cirrus dominated, even if the cirrus flag is .
We can then tentatively conclude that a cirrus flag or the ‘extended’ label are good indicators of cirrus dominance, although their presence (or absence) does not always guarantee that a source is (or is not) dominated by cirrus.
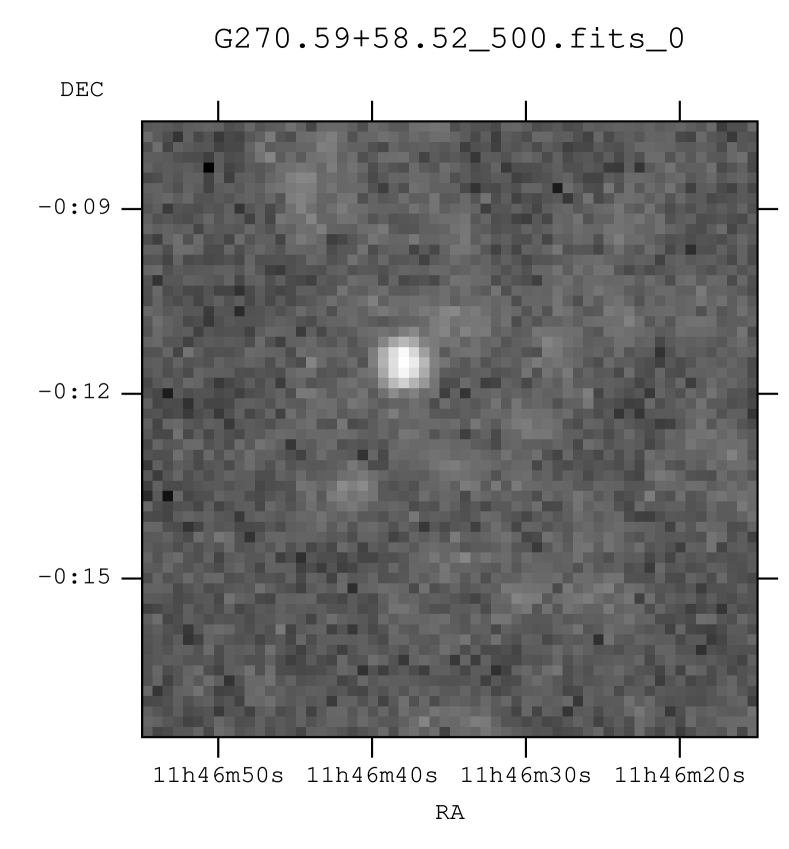
5 The strongly lensed Herschel/Planck source H-ATLAS J114637.9-001132 at
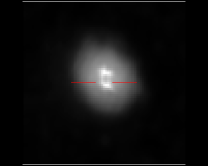
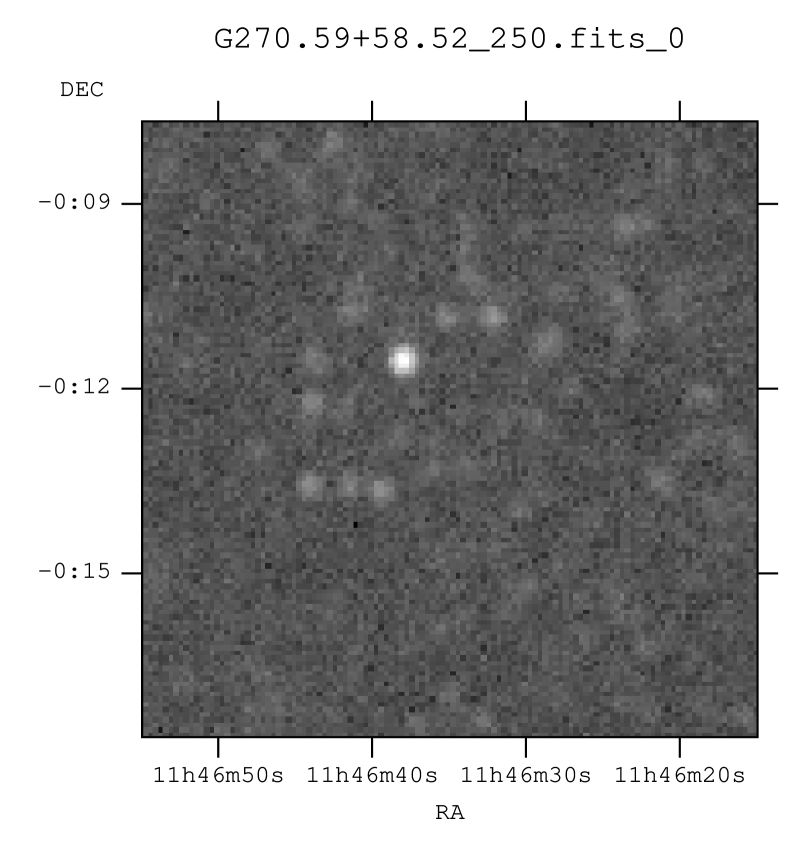
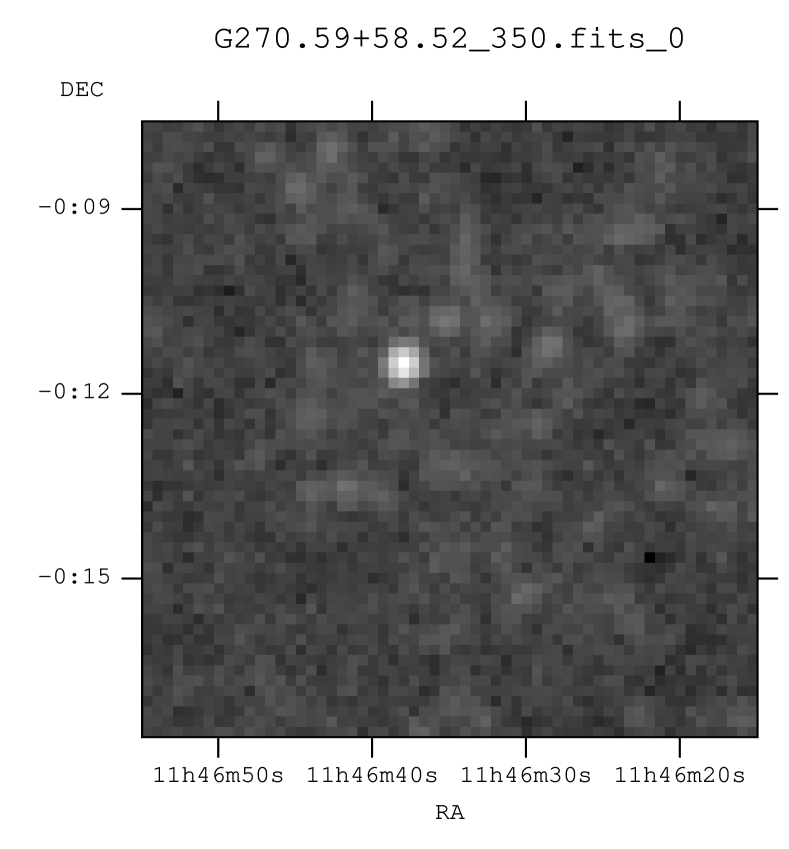
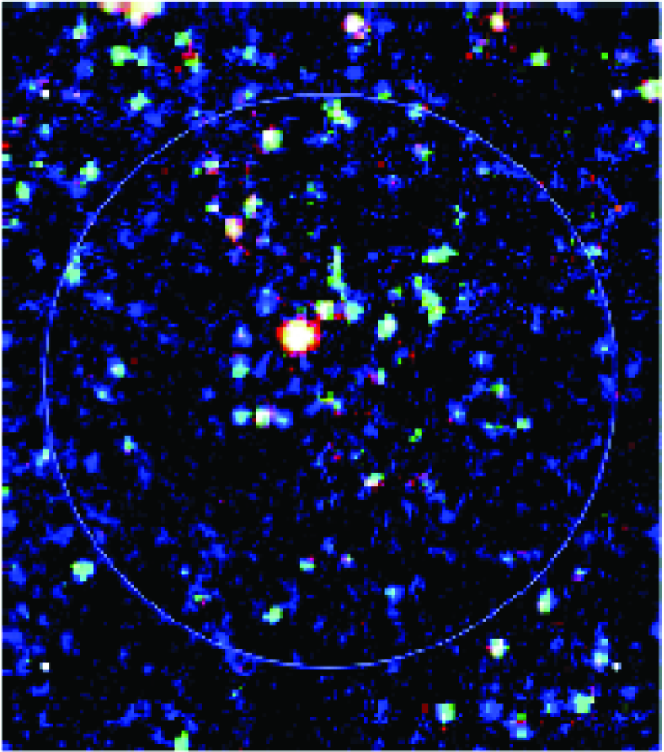
The ERCSC object PLCKERC857 G270.59+58.52, shown as observed by Herschel in panel (c) of Figure 6 and in Figure 10, has some unusual characteristics that make it interesting and worthy of further study. Eleven out of the 12 matches between ERCSC sources found at 857 GHz and H-ATLAS sources with mJy are associated with nearby quiescent galaxies detected in the optical. One source, however, has no bright optical counterpart. Instead, it is associated with a clump of sources with low Herschel flux densities (as can be better appreciated in Fig. 11) grouped around a bright Herschel source, HATLAS J114637.9-001132, alias G12H29, whose flux peaks at 350 m. Its Planck colour is also unusual, as can be seen in Fig. 12 where G12H29 is indicated by a red dot. This source was already a target for spectroscopic sub-mm follow up of candidate lensed galaxies (see e.g. Negrello et al. 2010). A CO spectroscopic redshift of has been obtained for this source (Harris et al. 2012, in preparation, Van der Werf et al. 2012, in preparation). Recent LABOCA data does suggest the presence of other sources in the same clump with SPIRE-to-870 flux ratios that match those of the source, providing indirect evidence for other sources associated with it at the same redshift (Clements et al. in preparation)
The SDSS DR7 (Abazajian et al. (2009)) shows a dense clump just on top of G12H29. Fu et al. (2012) have studied G12H29 and the SDSS clump in detail and determined the lensing nature of HATLAS J114637.9-001132 during a Keck laser guide star adaptive optics imaging ( and -band) program of bright Herschel m sources from H-ATLAS. The -band image shows complex filamentary structures that do not appear at -band. Observations with the SubMillimeter Array (SMA) reveal two m sources with flux densities of 31 mJy and 27 mJy, separated by . In their work, Fu et al. (2012) show that the observations can be nicely explained by a lens model in which the lens is a rather complex system located at . The photometric redshifts of the optical sources around the lensed object have been determined using SDSS + UKIDSS photometry using the publicly available photo- code EAZY (Brammer et al. 2008). The Keck -band data were not used for the photo- calculation. For the two central lensing galaxies, their blended photometry indicates a photo- of 1.076 (the 68% confidence interval is 0.982 to 1.305), which is substantially higher than the SDSS DR8 photo- (0.71). For a more detailed discussion on the lens, the reader is referred to Fu et al. (2012).
Apart from the SDSS clump already described, there is an unusually rich condensation of other low flux H-ATLAS objects within the Planck beam centered on G12H29. Several of these sources have red Herschel colours. We have determined photometric redshifts for these objects using the SMM J2135-0102 SED, that was shown to work quite well for (Lapi et al. 2011, González-Nuevo et al. 2011, in preparation). We find that four out of the six H-ATLAS sources that are located inside a circle of radius arcmin (Planck Collaboration et al. 2011b) centered on G12H29 have . We have checked that other photo- methods (eg. Clements et al. b) in preparation) produce answers that are broadly consistent with those from the Lapi et al. (2011) method. However, these photo- are calculated using only the three SPIRE bands and are therefore uncertain. For those H-ATLAS objects that can be matched to SDSS galaxies, we have recalculated the photo- using the optical data. Our results seem to indicate that most of these clump sources have lower redshifts than estimated using SPIRE data alone.
In order to test if the over-density we observe around HATLAS J114637.9-001132 is statistically significant, we have chosen randomly 1000 Herschel sources and counted the number of galaxies in circles with the same radius . The median number of neighbours is 1, with a standard deviation of 1.2. None of the sources in the control sample has a number of neighbours equal to or larger than HATLAS J114637.9-001132.
Following a bootstrap-type argument and realizing that we can divide the survey area into 30257 independent cells of size around H-ATLAS sources (ordered downwards in flux density at 350 microns), we have counted the number of H-ATLAS sources inside each one of these cells. We find that the fraction of cells as populated (or more) as the G12H29 clump is (30 cells). Using a Bayesian approach and the binomial distribution (Wall & Jenkins 2003), we find that the 99.99% confidence interval for that fraction is (narrowest interval that includes the mode and encompasses 99.99% of the probability, S. Andreon, private communication). We conclude that the over-density observed around G12H29 is statistically significant, but given our limited knowledge about the redshift distribution of the clump objects it is not clear whether the clump is a real association of objects at the same redshift or a random alignment of galaxies at very different distances. Our current data seem to favour this last interpretation (a low redshift clump at plus the lens SDSS clump at plus the lensed galaxy at ), but the large uncertainties of photo- estimates make it impossible to rule out other possibilities at this point.
The large Planck beam means that there is considerable potential for source confusion to affect the colours. The H-ATLAS survey has detected at in the Herschel 350 m band (equivalent to the Planck 857GHz channel), sources with a total flux density of Jy (taking into account the effect of a Gaussian beam with arcmin centered on the Planck position) to be compared with the ERCSC flux density Jy. Again allowing for the effect of the Planck beam (with arcmin in this case), the summed contributions of H-ATLAS sources at m is Jy. Applying a colour correction of a factor of 1.1 for G12H29 and 1.3 for the other sources (assumed to be at redshift ) we get Jy, compared with Jy. This suggests that Planck measurements are boosted by a positive background fluctuation, which may also account for the fact that only one (out of 9) H-ATLAS sources with flux densities at 350 m mJy and , over the entire H-ATLAS Phase 1 area, is associated with a Planck detection. In fact, background fluctuations of the order of sigma are needed in order to make those sources detectable by Planck. The probability of such an event is so extremely low (just a few per cent for Gaussian fluctuations) that even a single occurrence can be considered a stroke of luck. Since the fluctuations are dominated by confusion and have a strong super-Gaussian tail, the frequency of these fluctuations is substantially higher than expected from Gaussian statistics. However, the probability that this fluctuation happens to be by chance on top of a strongly lensed galaxy is tiny (but hard to quantify without knowing the statistics of fluctuations). Therefore the most likely scenario is the one in which H-ATLAS J114637.9-001132 is associated with a clump of sources, most of which fall below the H-ATLAS detection limit but their total integrated flux is seen as a positive fluctuation by Planck, due to its relatively large beam.
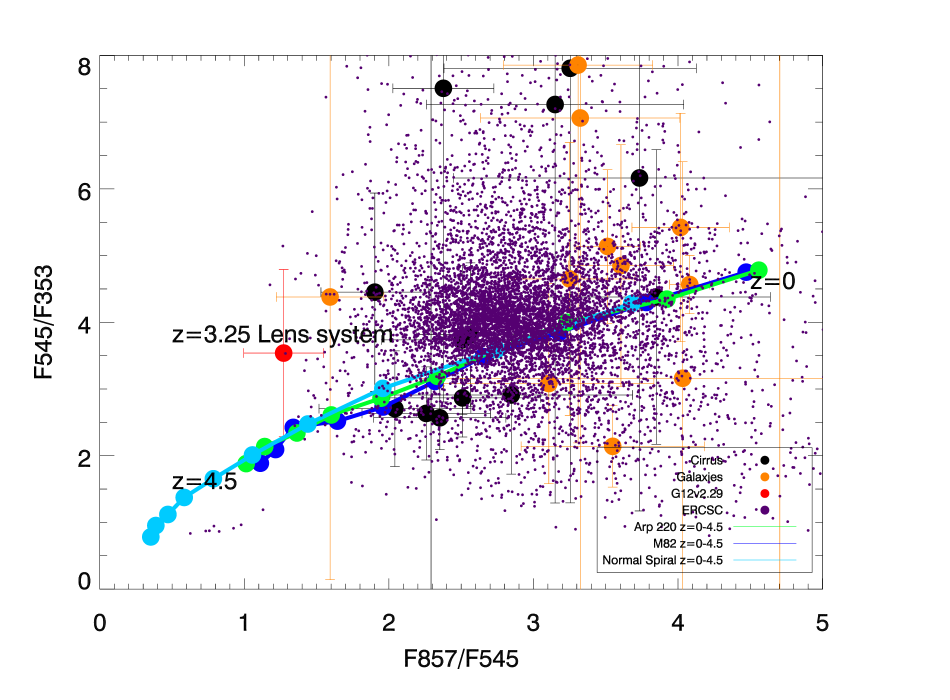
Figure 12 shows the distribution of vs. colours for the ERCSC sources in the H-ATLAS fields (black, orange and big red dots) and in the rest of the sample (small purple dots), compared to model SED colour tracks for two star-forming and one normal spiral galaxy templates going from to with a interval. The black dots correspond to the sources we have classified as Galactic cirrus, whereas orange dots are thought to be truly extragalactic. The red dot corresponds to G12H29. Its isolated position in the diagram suggests that there will be very few other objects like this in the ERCSC555Another interesting feature of this diagram, somewhat apart from the focus of this paper, are the eight isolated purple dots that appear in the lower left part of the plot: seven of them correspond to blazars identified in the ERCSC (López-Caniego et al. 2012)..
6 Conclusions
A cross-correlation of the Planck Early Release Compact Source Catalog (ERCSC) with the catalogue of Herschel-ATLAS sources detected in the Phase 1 fields, covering , has highlighted several issues that need to be dealt with to correctly interpret the data from the Planck sub-mm surveys.
-
•
Contamination by diffuse Galactic emission is a serious problem, as demonstrated by the fact that even in a region of moderate Galactic emission (GAMA09) all the 857 GHz ERCSC sources seem to be associated with cirrus. Therefore, to estimate e.g. the number counts of extragalactic sources, it is crucial to carefully select regions of low Galactic emission. A cirrus flag and the ‘extended’ flag, as defined in Planck Collaboration et al. (2011b), are remarkably effective in picking up probable cirrus, but are not 100% reliable.
-
•
We find a good, essentially linear, correlation between ERCSC flux densities at 857 GHz and SPIRE flux densities at 350 m above Jy. We also find a good correlation between ERCSC flux densities at 545 GHz for sources Jy and SPIRE flux densities at 500 m, after a colour correction has been applied to SPIRE flux densities in order to take into account the different central wavelenghts of the bands. Excluding the large edge-on disk galaxy NGC5746, whose H-ATLAS flux density is different form the ERCSC values probably due to resolution and background subtraction systematic effects, we find Jy at 857 GHz and Jy at 545 GHz. ERCSC flux densities are affected by flux boosting and have uncertainties below Jy. The relative difference between Herschel and Planck flux densities is compatible with these error levels and the calibration uncertainties of both experiments. The mean difference between ERCSC and H-ATLAS positions for 857 GHz sources brighter than 1.5 Jy is 0.42 arcmin, with a dispersion of 0.17 arcmin, confirming the accuracy of ERCSC positions.
-
•
Apart from the contamination from Galactic thermal dust emission, the Planck sub-mm surveys are limited by confusion due to faint sources within the beam, as expected (e.g. Negrello et al. 2004; Fernandez-Conde et al. 2008). An important contribution to confusion fluctuations is clustering (Planck Collaboration et al. 2011c). Occasionally the confusion fluctuations may be dominated by a single proto-cluster of star-forming galaxies (Negrello et al. 2005). Even less frequently the confusion fluctuations may be due to apparent clustering due to a random alignment of galaxies at different redshifts. We have presented evidence suggesting that at least one object with an anomalous contamination from confusion fluctuations has been detected within the H-ATLAS Phase 1 fields. This source is a mixture of a strongly lensed galaxy at surrounded by a statistically significant overdensity of faint galaxies detected by SPIRE. This unusual overdensity of faint galaxies plus an excess of confusion fluctuations at the same position has made it possible for the ERCSC to detect a high redshift lensed galaxy that would otherwise be below the Planck detection limit. The available information is insufficient to reliably estimate the redshift of the galaxies in this clump, although there are some indications that at least the lensing galaxies are at . Upcoming PACS photometry and near-IR follow-up of the galaxies in this clump will allow us to better constrain the photometric redshifts of its galaxies. If the rest of the galaxies of the clump could be shown to be at the same redshift, then it would represent an example showing the power of combining Planck and Herschel data. Such a combination may open a new window for the study of cluster evolution, since the main searches carried out so far at similar redshifts have selection functions that are different to that of sub-mm surveys. X-ray and SZ surveys preferentially find massive and evolved structures, dominated by passive early type galaxies. Optical/nearIR cluster finding algorithms, depending on what detection technique is used, can be biased to red evolved galaxies (e.g. Red Sequence fitting) but this is not always the case (van Breukelen et al. 2006). The sub-mm selection could find clusters with a high level of star-formation activity, thus shedding light on this poorly known phase of their evolution (Michałowski et al. 2010).
-
•
Although our statistics are too poor to come to definite conclusions, simple source blending seems to be a less frequent problem: in only one case has an ERCSC 857 GHz source been resolved by Herschel into two similarly bright objects, and in general, the contribution of lower luminosity H-ATLAS sources to the flux density measured by Planck was minor (see Fig. 8).
In conclusion, we find that the higher sensitivity and higher angular resolution H-ATLAS maps provide key information for the interpretation of candidate sources extracted from Planck sub-mm maps. The Phase 1 survey considered in this paper represents of the full H-ATLAS (). Therefore, the results presented here will be substantially improved upon when the H-ATLAS survey is completed.
Of special interest is the possibility that Planck may be able to sample the tail of the distribution of high- over-densities, providing unique information about both the the early evolution of large-scale structure and galaxy formation and evolution in high density environments.
Acknowledgements.
The Herschel-ATLAS is a project with Herschel, which is an ESA space observatory with science instruments provided by European-led Principal Investigator consortia and with important participation from NASA. The H-ATLAS website is http://www.h-atlas.org/. DH and MLC acknowledge partial financial support from the Spanish Ministerio de Ciencia e Innovación project AYA2010-21766-C03-01 and the Consolider Ingenio-2010 Programme project CSD2010-00064. DH also acknowledges the Spanish Ministerio de Educación for a José Castillejo’ mobility grant with reference JC2010-0096 and the Astronomy Department at the Cavendish Laboratory for their hospitality during the elaboration of this paper. The Italian group has been supported in part by ASI/INAF agreement n. I/009/10/0 and by INAF through the PRIN 2009 “New light on the early Universe with sub-mm spectroscopy”. FJC acknowledges partial financial support from the Spanish Ministerio de Ciencia e Innovación project AYA2010-21490-C02-01.References
- Aatrokoski et al. (2011) Aatrokoski, J., Ade, P. A. R., Aghanim, N., et al. 2011, Explanatory Supplement to the Planck Early Release Compact Source Catalogue, Tech. rep., ESA
- Abazajian et al. (2009) Abazajian, K. N., Adelman-McCarthy, J. K., Agüeros, M. A., et al. 2009, ApJS, 182, 543
- Blain et al. (2002) Blain, A. W., Smail, I., Ivison, R. J., Kneib, J.-P., & Frayer, D. T. 2002, Phys. Rep, 369, 111
- Bracco et al. (2011) Bracco, A., Cooray, A., Veneziani, M., et al. 2011, MNRAS, 412, 1151
- Brammer et al. (2008) Brammer, G. B., van Dokkum, P. G., & Coppi, P. 2008, ApJ, 686, 1503
- Capak et al. (2011) Capak, P. L., Riechers, D., Scoville, N. Z., et al. 2011, Nature, 470, 233
- Cox et al. (2011) Cox, P., Krips, M., Neri, R., et al. 2011, ApJ, 740, 63
- Dale et al. (2012) Dale, D. A., Aniano, G., Engelbracht, C. W., et al. 2012, ApJ, 745, 95
- de Propris et al. (1999) de Propris, R., Stanford, S. A., Eisenhardt, P. R., Dickinson, M., & Elston, R. 1999, AJ, 118, 719
- Eales et al. (2010) Eales, S., Dunne, L., Clements, D., et al. 2010, PASP, 122, 499
- Fernandez-Conde et al. (2008) Fernandez-Conde, N., Lagache, G., Puget, J.-L., & Dole, H. 2008, A&A, 481, 885
- Fixsen et al. (1998) Fixsen, D. J., Dwek, E., Mather, J. C., Bennett, C. L., & Shafer, R. A. 1998, ApJ, 508, 123
- Fu et al. (2012) Fu, H., Jullo, E., Cooray, A., et al. 2012, ArXiv e-prints
- Gobat et al. (2011) Gobat, R., Daddi, E., Onodera, M., et al. 2011, A&A, 526, A133+
- Granato et al. (2004) Granato, G. L., De Zotti, G., Silva, L., Bressan, A., & Danese, L. 2004, ApJ, 600, 580
- Griffin et al. (2010) Griffin, M. J., Abergel, A., Abreu, A., et al. 2010, A&A, 518, L3+
- Hughes et al. (1998) Hughes, D. H., Serjeant, S., Dunlop, J., et al. 1998, Nature, 394, 241
- Ivison et al. (2000) Ivison, R. J., Dunlop, J. S., Smail, I., et al. 2000, ApJ, 542, 27
- Ivison et al. (2010) Ivison, R. J., Swinbank, A. M., Swinyard, B., et al. 2010, A&A, 518, L35+
- Karachentsev et al. (1976) Karachentsev, I. D., Pronik, V. I., & Chuvaev, K. K. 1976, A&A, 51, 185
- Lapi et al. (2011) Lapi, A., Gonzalez-Nuevo, J., Fan, L., et al. 2011, ArXiv e-prints
- López-Caniego et al. (2012) López-Caniego, M., González-Nuevo, J., Massardi, M., et al. 2012, in preparation
- Magliocchetti et al. (2007) Magliocchetti, M., Silva, L., Lapi, A., et al. 2007, MNRAS, 375, 1121
- Michałowski et al. (2010) Michałowski, M., Hjorth, J., & Watson, D. 2010, A&A, 514, A67
- Miville-Deschênes & Lagache (2005) Miville-Deschênes, M.-A. & Lagache, G. 2005, ApJS, 157, 302
- Negrello et al. (2005) Negrello, M., González-Nuevo, J., Magliocchetti, M., et al. 2005, MNRAS, 358, 869
- Negrello et al. (2010) Negrello, M., Hopwood, R., De Zotti, G., et al. 2010, Science, 330, 800
- Negrello et al. (2004) Negrello, M., Magliocchetti, M., Moscardini, L., et al. 2004, MNRAS, 352, 493
- Pilbratt et al. (2010) Pilbratt, G. L., Riedinger, J. R., Passvogel, T., et al. 2010, A&A, 518, L1+
- Planck Collaboration (2011) Planck Collaboration. 2011, VizieR Online Data Catalog, 8088, 0
- Planck Collaboration et al. (2011a) Planck Collaboration, Ade, P. A. R., Aghanim, N., et al. 2011a, A&A, 536, A1
- Planck Collaboration et al. (2011b) Planck Collaboration, Ade, P. A. R., Aghanim, N., et al. 2011b, A&A, 536, A7
- Planck Collaboration et al. (2011c) Planck Collaboration, Ade, P. A. R., Aghanim, N., et al. 2011c, A&A, 536, A18
- Planck HFI Core Team et al. (2011) Planck HFI Core Team, Ade, P. A. R., Aghanim, N., et al. 2011, A&A, 536, A6
- Planck Collaboration (2006) Planck Collaboration. 2006, The Scientific Programme of Planck, arXiV:astro-ph/0604069
- Poglitsch et al. (2010) Poglitsch, A., Waelkens, C., Geis, N., et al. 2010, A&A, 518, L2+
- Priddey et al. (2008) Priddey, R. S., Ivison, R. J., & Isaak, K. G. 2008, MNRAS, 383, 289
- Puget et al. (1996) Puget, J.-L., Abergel, A., Bernard, J.-P., et al. 1996, A&A, 308, L5+
- Rieke et al. (2004) Rieke, G. H., Young, E. T., Engelbracht, C. W., et al. 2004, ApJS, 154, 25
- Rigby et al. (2011) Rigby, E. E., Maddox, S. J., Dunne, L., et al. 2011, MNRAS, 415, 2336
- Serjeant & Harrison (2005) Serjeant, S. & Harrison, D. 2005, MNRAS, 356, 192
- Smail et al. (1997) Smail, I., Ivison, R. J., & Blain, A. W. 1997, ApJ, 490, L5+
- SPIRE Observers’ Manual v2.2 (2010) SPIRE Observers’ Manual v2.2. 2010, Herschel Science Centre, HERSCHEL-DOC-0798
- Stevens et al. (2003) Stevens, J. A., Ivison, R. J., Dunlop, J. S., et al. 2003, Nature, 425, 264
- Stevens et al. (2010) Stevens, J. A., Jarvis, M. J., Coppin, K. E. K., et al. 2010, MNRAS, 405, 2623
- Swinbank et al. (2010) Swinbank, A. M., Smail, I., Longmore, S., et al. 2010, Nature, 464, 733
- Tauber et al. (2010) Tauber, J. A., Mandolesi, N., Puget, J., et al. 2010, A&A, 520, A1+
- van Breukelen et al. (2006) van Breukelen, C., Clewley, L., Bonfield, D. G., et al. 2006, MNRAS, 373, L26
- Wall & Jenkins (2003) Wall, J. & Jenkins, C. 2003, Practical Statistics for Astronomers, Cambridge Observing Handbooks for Research Astronomers (Cambridge University Press)
- Zacchei et al. (2011) Zacchei, A., Maino, D., Baccigalupi, C., et al. 2011, A&A, 536, A5
| ERCSC NAME | RA (deg) | DEC (deg) | (Jy) | (Jy) | EXT | Cirrus | H-ATLAS ID | Other ID | (Jy) | (Jy) | D (arcmin) | |
|---|---|---|---|---|---|---|---|---|---|---|---|---|
| G223.40+22.96 | 127.935 | 1.659 | 10.751 | 1.940 | 1 | 0.219 | ||||||
| G224.33+24.38 | 129.583 | 1.602 | 9.924 | 1.209 | 1 | 0.188 | ||||||
| G224.70+24.60 | 129.940 | 1.415 | 6.077 | 0.894 | 1 | 0.156 | ||||||
| G224.73+23.79 | 129.253 | 0.998 | 8.440 | 1.650 | 1 | 0.156 | ||||||
| G226.70+24.89 | 131.101 | -0.013 | 6.987 | 1.392 | 1 | 0.125 | ||||||
| G226.98+26.25 | 132.398 | 0.454 | 6.256 | 1.261 | 1 | 0.109 | ||||||
| G227.24+24.51 | 131.018 | -0.629 | 7.291 | 0.895 | 1 | 0.125 | ||||||
| G227.26+24.72 | 131.206 | -0.540 | 3.234 | 0.917 | 1 | 0.125 | ||||||
| G227.58+24.57 | 131.222 | -0.863 | 8.093 | 1.194 | 1 | 0.125 | ||||||
| G227.75+30.24 | 136.180 | 1.886 | 13.259 | 2.118 | 1 | 0.078 | ||||||
| G230.55+31.91 | 138.859 | 0.711 | 1.535 | 0.406 | 0 | 0.125 | ||||||
| G230.97+32.31 | 139.381 | 0.614 | 0.872 | 1.232 | 1 | 0.125 | ||||||
| G231.25+32.05 | 139.284 | 0.279 | 3.429 | 0.769 | 1 | 0.125 | ||||||
| G231.38+32.24 | 139.511 | 0.291 | 2.863 | 2.249 | 1 | 0.125 | ||||||
| G231.43+32.10 | 139.413 | 0.173 | 4.038 | 0.539 | 0 | 0.125 | ||||||
| G263.84+57.55 | 173.088 | 0.810 | 1.990 | 0.434 | 0 | 0.047 | J113221.5+004814 | NGC3720 | 1.2149 | 0.0364 | 0.0198 | 0.405 |
| J113213.3+004907 | NGC3719 | 1.0098 | 0.0345 | 0.0195 | 1.998 | |||||||
| G266.26+58.99 | 174.940 | 1.323 | 2.056 | 0.667 | 0 | 0.062 | ||||||
| G270.59+58.52 | 176.646 | -0.211 | 2.145 | 0.824 | 1 | 0.031 | J114637.9-001132 | G12H29 | 0.3783 | 0.0074 | 3.259 | 1.359 |
| G274.04+60.90 | 179.271 | 1.115 | 1.511 | 0.380 | 0 | 0.109 | J115705.9+010730 | CGCG 013-010 | 1.2073 | 0.0304 | 0.0395 | 0.628 |
| G277.37+59.21 | 180.100 | -1.104 | 17.578 | 0.441 | 0 | 0.047 | J120023.2-010600 | NGC4030 | 18.3014 | 0.1060 | 0.0048 | 0.303 |
| G345.11+54.84 | 215.605 | -0.395 | 3.361 | 0.466 | 0 | 0.016 | J142223.4-002313 | NGC5584 | 3.9080 | 0.0565 | 0.0055 | 0.645 |
| G347.77+56.35 | 215.865 | 1.720 | 1.329 | 0.447 | 0 | 0.031 | J142327.2+014335 | UGC9215 | 1.6225 | 0.0584 | 0.0046 | 0.412 |
| G350.46+51.85 | 219.962 | -0.716 | 2.235 | 0.596 | 0 | 0.078 | J143949.5-004305 | NGC5705 | 1.4737 | 0.0565 | 0.0059 | 0.381 |
| G351.01+52.11 | 220.048 | -0.298 | 7.824 | 0.635 | 0 | 0.078 | J144011.1-001725 | NGC5713 | 7.7971 | 0.0739 | 0.0063 | 0.474 |
| G351.22+51.97 | 220.238 | -0.320 | 4.881 | 0.476 | 0 | 0.078 | J144056.2-001906 | NGC5719 | 5.6896 | 0.1303 | 0.0057 | 0.231 |
| G353.15+54.45 | 219.422 | 2.288 | 6.179 | 0.506 | 0 | 0.062 | J143740.9+021729 | NGC5690 | 6.4066 | 0.0855 | 0.005847 | 0.239 |
| G354.50+52.84 | 221.113 | 1.676 | 2.942 | 0.511 | 0 | 0.078 | J144424.3+014046 | NGC5740 | 2.8600 | 0.0474 | 0.0052 | 0.722 |
| G354.96+52.95 | 221.237 | 1.951 | 11.238 | 0.560 | 0 | 0.062 | J144455.9+015719 | NGC5746 | 7.9449 | 0.1451 | 0.0057 | 0.359 |
| NAME | RA (deg) | DEC (deg) | (Jy) | EXT | CIRRUS | H-ATLAS ID | Other ID | (Jy) | (Jy) | D (arcmin) | ||
|---|---|---|---|---|---|---|---|---|---|---|---|---|
| G224.70+24.61 | 129.951 | 1.422 | 1.543 | 0.517 | 0 | 0.156 | ||||||
| G226.97+26.25 | 132.394 | 0.458 | 2.185 | 0.647 | 1 | 0.109 | ||||||
| G227.27+24.71 | 131.198 | -0.550 | 3.718 | 1.536 | 1 | 0.125 | ||||||
| G227.57+24.56 | 131.215 | -0.863 | 4.234 | 1.194 | 1 | 0.125 | ||||||
| G227.77+30.23 | 136.181 | 1.869 | 4.554 | 1.168 | 1 | 0.078 | ||||||
| G230.17+32.05 | 138.809 | 1.055 | 1.191 | 0.463 | 0 | 0.141 | ||||||
| G231.44+32.10 | 139.420 | 0.174 | 1.410 | 0.389 | 0 | 0.125 | ||||||
| G270.59+58.54 | 176.648 | -0.199 | 1.358 | 0.610 | 0 | 0.031 | J114637.9-001132 | G12H29 | 0.298 | 0.008 | 3.259 | 0.746 |
| G277.36+59.21 | 180.094 | -1.097 | 4.546 | 0.419 | 0 | 0.047 | J120023.2-010600 | NGC4030 | 5.661 | 0.052 | 0.0048 | 0.229 |
| G345.12+54.85 | 215.603 | -0.381 | 1.151 | 0.415 | 0 | 0.016 | J142223.4-002313 | NGC5584 | 1.441 | 0.033 | 0.0055 | 0.460 |
| G351.01+52.12 | 220.047 | -0.292 | 2.213 | 0.524 | 0 | 0.078 | J144011.1-001725 | NGC5713 | 2.278 | 0.035 | 0.0063 | 0.141 |
| G351.21+51.96 | 220.242 | -0.327 | 1.275 | 0.439 | 0 | 0.078 | J144056.2-001906 | NGC5719 | 1.817 | 0.073 | 0.0057 | 0.729 |
| G353.14+54.45 | 219.414 | 2.290 | 1.551 | 0.433 | 0 | 0.062 | J143740.9+021729 | NGC5690 | 2.210 | 0.046 | 0.0855 | 0.409 |
| G354.97+52.95 | 221.236 | 1.956 | 3.456 | 0.534 | 0 | 0.062 | J144455.9+015719 | NGC5746 | 2.686 | 0.081 | 0.0058 | 0.204 |