11email: federico.bernardini@oa-roma.inaf.it
11email: demartino@oacn.inaf.it 22institutetext: International Space Science Institute (ISSI), Hallerstrasse 6, CH-3012 Bern, Switzerland
22email: mfalanga@issibern.ch 33institutetext: CRESST and X-Ray Astrophysics Laboratory, NASA Goddard Space Flight Center, Greenbelt, MD 20771, USA and Department of Physics, University of Maryland, Baltimore County, 1000 Hilltop Circle, Baltimore, MD 21250, USA
33email: koji.mukai@nasa.gov 44institutetext: Dipartimento di Fisica, Universitá Roma III, Via della Vasca Navale 84, I-00146, Roma, Italy
44email: matt@fis.uniroma3.it 55institutetext: CEA Saclay, DSM/Irfu/Service d’Astrophysique, F-91191 Gif-sur-Yvette, France
55email: bonnetbidaud@cea.fr 66institutetext: INAF Istituto di Astrofisica Spaziale e Fisica Cosmica di Bologna, Via Gobetti 101, I-40129, Bologna, Italy
66email: nicola.masetti@iasfbo.inaf.it 77institutetext: Laboratoire APC, Université Denis Diderot, 10 rue Alice Domon et Léonie Duquet, F-75005 Paris, France and LUTH, Observatoire de Paris, Section de Meudon, 5 place Jules Janssen, F-92195 Meudon, France
77email: martine.mouchet@obspm.fr
Characterization of new hard X-ray Cataclysmic Variables††thanks: Based on observations obtained with XMMNewton and INTEGRAL, ESA science missions with instruments and contributions directly funded by ESA Member States; and Swift, a NASA science mission with Italian participation.
Abstract
Aims. We aim at characterizing a sample of nine new hard X-ray selected Cataclysmic Variable (CVs), to unambiguously identify them as magnetic systems of the Intermediate Polar (IP) type.
Methods. We performed detailed timing and spectral analysis by using X-ray, and simultaneous UV and optical data collected by XMMNewton, complemented with hard X-ray data provided by INTEGRAL and Swift. The pulse arrival time were used to estimate the orbital periods. The broad band X-ray spectra were fitted using composite models consisting of different absorbing columns and emission components.
Results. Strong X-ray pulses at the White Dwarf (WD) spin period are detected and found to decrease with energy. Most sources are spin-dominated systems in the X-rays, though four are beat dominated at optical wavelengths. We estimated the orbital period in all system (except for IGR J16500-3307), providing the first estimate for IGR J08390-4833, IGR J18308-1232, and IGR J18173-2509. All X-ray spectra are multi-temperature. V2069 Cyg and RX J0636+3535 posses a soft X-ray optically thick component at kT80 eV. An intense Kα Fe line at 6.4 keV is detected in all sources. An absorption edge at 0.76 keV from OVII is detected in IGR J08390-4833. The WD masses and lower limits to the accretion rates are also estimated.
Conclusions. We found all sources to be IPs. IGR J08390-4833, V2069 Cyg, and IGR J16500-3307 are pure disc accretors, while IGR J18308-1232, IGR J1509-6649, IGR J17195-4100, and RX J0636+3535 display a disc-overflow accretion mode. All sources show a temperature gradient in the post-shock regions and a highly absorbed emission from material located in the pre-shock flow which is also responsible for the X-ray pulsations. Reflection at the WD surface is likely the origin of the fluorescent iron line. There is an increasing evidence for the presence of a warm absorber in IPs, a feature that needs future exploration. The addition of two systems to the subgroup of soft X-ray IPs confirms a relatively large () incidence.
Key Words.:
Stars: binaries: close - Stars: individual: IGR J08390-4833, IGR J18308-1232, IGR J16500-3307, IGR J18173-2509, IGR J17195-4100, V2069 Cyg (also known as RX J21237+4218), RX J0636+3535 (also known as V647 Aur), IGR J15094-6649, and XSS J0056+4548 (also known as V515 And) - X-rays: binaries - Accretion, accretion discs - stars:novae, cataclysmic variables1 Introduction
Magnetic Cataclysmic Variables (CVs) constitute a subgroup of the CV class, harboring accreting white dwarfs (WD) with magnetic field strengths . These systems are further subdivided in two groups, depending on the WD magnetic field intensity and degree of synchronism (). Those called Polars are synchronous mCVs. They show signatures of strong magnetic fields ( MG) through the presence of a conspicuous polarization at optical and near-IR wavelengths. The so-called Intermediate Polars (IPs) possess instead asynchronously rotating WDs () and except for a few cases (Piirola et al. 1993; Potter et al. 1997; Katajainen et al. 2007; Butters et al. 2009; Potter et al. 2012), they do not show polarization. These systems are believed to possess weakly magnetized WDs (10 MG). The Polars populates the orbital period distribution at short periods mainly below the 2–3 h orbital period ”gap” (Warner 1995; Wheatley 1995). On the other hand, IPs are generally found above the gap, with only a handful of systems below it.
The material lost from the Roche-lobe overflowing late-type secondary star (typically a Main Sequence or a sub-Giant) may flow toward the WD in different modes, depending on the magnetic field intensity: directly (stream), through a truncated disc or ring. The high field Polars are direct accretors, while IPs may accrete via a stream or a disc/ring depending on their magnetic moment and spin-to-orbital period ratio (Norton et al. 2004, 2008). A combination of these, called disc-overflow, may also occur (Hellier 1995; Norton et al. 1997) and is linked to the mass accretion rate. Close to the WD, the magnetically confined flow of matter is accreted through a column in stream-fed systems and through an arc-shaped curtain (Rosen et al. 1988) in disc/ring-fed systems. Approaching the WD surface, the velocities are supersonic and a stand-off shock is formed. In the post-shock region (PSR) the gas at a temperature of kT keV slows and cools via thermal bremsstrahlung and cyclotron radiations (Aizu 1973; Wu et al. 1994; Cropper et al. 1999). The efficiency of the two cooling mechanisms depends on the WD magnetic field strength (Woelk & Beuermann 1996; Fischer & Beuermann 2001). The post-shock emission is partially intercepted and thermalized by the WD surface, giving rise to an optically thick emission that emerges in the soft X-rays and EUV/UV regimes. An intense soft ( 20–50 eV) component is a characteristic signature of the X-ray spectra of the Polars, mostly balancing the cyclotron flux (Beuermann 2004). On the other hand IPs have typically stronger hard X-ray fluxes than the Polars and only recently a soft highly absorbed optically thick component has been detected (de Martino et al. 2004; Evans & Hellier 2007; Anzolin et al. 2008, 2009).
Though mCVs represent a relatively small () fraction of CVs, this number is rapidly increasing thanks to the recent hard X-ray surveys conducted by INTEGRAL and Swift above 20 keV. So far 64 CVs are identified in the latest catalogue releases (Bird et al. 2010; Cusumano et al. 2010), 43 of them are mCVs. The IPs represent of this hard X-ray sample (including both already known (Barlow et al. 2006) and recently discovered members (Bonnet-Bidaud et al. 2007; de Martino et al. 2008; Anzolin et al. 2009; Butters et al. 2008; Bonnet-Bidaud et al. 2009; Pretorius 2009; Scaringi et al. 2011), though one misidentification was found (de Martino et al. 2010). Hence, while in the pre-INTEGRAL and Swift times IPs amounted to only 20 members, this number has more than doubled nowadays.
Hard X-ray mCVs have the potential to be important contributors to the X-ray source population at low luminosities (). They were proposed to be the major constituent of galactic ridge (Sazonov et al. 2006; Revnivtsev et al. 2008, 2009) and galactic bulge (Revnivtsev et al. 2011; Hong et al. 2012) X-ray emission. Therefore, they are also believed to have an important role in the X-ray luminosity function of other galaxies.
In the framework of a program conducted with XMMNewton, with the main goal to identify new magnetic type CVs, we present here the analysis of simultaneous X-ray, UV and optical data of a sample of nine CVs that were detected as hard X-ray sources by INTEGRAL, RXTE or SWIFT: IGR J08390-4833, IGR J18308-1232, IGR J18173-2509, IGR J17195-4100, V2069 Cyg (also known as RX J21237+4218), V647 Aur (also known as RX J0636+3535), IGR J15094-6649, V515 And (also known as XSS J0056+4548), and IGR J16500-3307 (hereafter IGR J0839, IGR J1830, IGR J1817, IGR J1719, V2069 Cyg, RX J0636, IGR J1509, XSS J0056, and IGR J1650 respectively. We complement the X-ray analysis with a high-energy coverage from INTEGRAL/IBIS and Swift/BAT publicly available data. Five of these sources (IGR J0839, IGR J1817, XSS J0056, IGR J1509 and IGR J1719) have also , RXTE, or Swift/XRT coverage. All, except IGR J0839, IGR J1830 and IGR J1817, were also observed in optical photometry and spectroscopy from ground-based telescopes, from which orbital periods were determined and optical pulses detected, thus allowing a comparison with our results.
In Sect. 3.1 we present the X-ray, UV and optical timing analysis. In Sect. 3.2 we present the analysis of the X-ray broad-band spectra of each source. For the three brightest sources we also present the high resolution spectra provided by the XMMNewton RGS instrument. In Sect. 4 we discuss the origin of rotational pulses, the accretion mode and the emission properties of our sample.
2 Observations and data analysis
2.1 XMM-Newton observations
The XMMNewton Observatory includes three cm2 Xray telescopes with an EPIC instrument in each focus, a Reflecting Grating Spectrometer, RGS (den Herder et al. 2001) and an Optical Monitor, OM (Mason et al. 2001). Two of the EPIC imaging spectrometers use MOS CCDs (Turner et al. 2001) and one uses a PN CCD (Strüder et al. 2001). XMMNewton collected data of all nine CVs. The main observation parameters, together with that of all other observatory instruments are reported in table 1.
Data were processed with SAS version 10.0.0, using the updated calibration files (CCF) available in January 2011. All observations were performed with the EPIC-PN (PN hereafter) camera set in prime full window imaging mode (time resolution=0.0734 s) with a thin filter applied. Standard data screening criteria were applied in the extraction of scientific products. We accumulated a onedimensional image and fitted the 1D photon distribution with a Gaussian. Then, we extracted the source photons from a circular region of radius 40″ centered at the Gaussian centroid. The background was obtained (within the same CCD where the source lies) from a circular region of the same size. Single and double pixel events with a zero quality flag were selected for the PN data. For the spectral analysis we cleaned all observations from solar flares by collecting CCD light curves above 10 keV and applying an intensity threshold. Spectra were then produced only for those parts of observations under the threshold limit. On the other hand, for the timing analysis we used the epiclccor task, producing a background subtracted light curve in the range 0.3–15 keV (with a bin time of 11 s), consequently removing contamination from solar flares. The source event arrival time of each observation, in the 0.315 keV energy range, were converted into barycentric dynamical times (BDT) by means of the SAS tool barycen.
The PN spectra were rebinned before fitting, to have at least 30 counts per bin. We report the analyses obtained with the PN data only (consistence with the results of EPIC-MOS cameras was always verified). Phase–resolved spectra were also extracted at the pulse maximum and minimum. All spectra were analyzed using the version of (12.5.1n).
We also inspected the RGS spectra. We used the 1st order spectra and responses produced by the pipeline, which runs an automatic version of the RGS meta-task, rgsproc. While, in principle, the quality of data products can be improved somewhat by manually repeating the reduction, we found no obvious problems with the pipeline products. Also considering the limited statistical quality of the RGS data for our sample, we believe our choice to use the standard pipeline products is well justified. The RGS spectra of IGR J1719, IGR J1509, and XSS J0056 were of high enough statistical quality to merit further analysis; these are discussed below in sect. 3.2.3. The data for the other targets were of too low S/N to add useful information. We grouped the RGS spectra of the three sources such that each new bin had at least 25 counts.
Simultaneous coverage to the X-rays was ensured by the OM operated in fast window mode using sequentially the B (3815-4910 Å) or the U (3000–3800 Å) filter and UVM2 (2000–2800 Å) or UVW1 (2450–3200 Å) filter. Consequently, each target was observed for half of the time of the EPIC exposure in the B or U filter and the other half in a UV filter. Due to the OM fast window mode acquisition, the OM photometric data in each filter consist of sequential (four or five) segments of length 1300-2800 s each (according to the total EPIC exposures). Average net count rates and instrumental magnitudes are reported for those sources with usable data in table 1, where we also report whether no variability is detected. Background subtracted OM light curves were obtained using the standard SAS processing pipeline with a binning time of 10 s. Barycentric corrections were also applied to the OM light curves.
| Source | Telescope | OBSID | Instrument∗ | Date | UTstart | Texpo | Net count rate (mag)∗∗∗ |
|---|---|---|---|---|---|---|---|
| yyyy-mmm-dd | hh:mm | (ks)∗∗ | cts/s | ||||
| IGR J08390-4833 | XMM-Newton | 0651540101 | EPIC-pn | 2010 Dec 20 | 12:34 | 33.9 (27.3) | |
| OM-B | 12:20 | 15.0 | (17.8) | ||||
| OM-UVM2 | 16:57 | 15.2 | (17.3) | ||||
| INTEGRAL | IBIS/ISGRI | 2000 | |||||
| IGR J18308-1232 | XMM-Newton | 0601270501 | EPIC-pn | 2010 Mar 11 | 15:26 | 27.6 (15.7) | |
| INTEGRAL | IBIS/ISGRI | 2200 | |||||
| IGR J16500-3307 | XMM-Newton | 0601270401 | EPIC-pn | 2010 Feb 2 | 11:04 | 30.0 (18.0) | |
| OM-Ba | 10:50 | 6.2 | (16.7) | ||||
| OM-UVW1a | 13:00 | 8.0 | (16.3) | ||||
| INTEGRAL | IBIS/ISGRI | 2200 | |||||
| IGR J18173-2509 | XMM-Newton | 0601270301 | EPIC-pn | 2009 Sep 07 | 02:03 | 35.0 (30.0) | |
| OM-B | 01:49 | 15.7 | (18.1) | ||||
| INTEGRAL | IBIS/ISGRI | 4500 | |||||
| IGR J17195-4100 | XMM-Newton | 0601270201 | EPIC-pn | 2009 Sep 03 | 06:58 | 24.0a (27.0) | |
| OM-B | 06:44 | 11.4 | (15.4) | ||||
| OM-UVM2b | 06:44 | 11.4 | (14.9) | ||||
| RGS 1&2 | 06:35 | 33.9 | |||||
| INTEGRAL | IBIS/ISGRI | 2600 | |||||
| V2069 Cyg | XMM-Newton | 0601270101 | EPIC-pn | 2009 Apr 30 | 11:09 | 26.4 (12.4) | 1.050.01 |
| OM-B | 10:55 | 10.6 | 101.5 (16.8) | ||||
| OM-UVM2a | 14:18 | 10.6 | (17.6) | ||||
| INTEGRAL | IBIS/ISGRI | 1900 | |||||
| RX J0636+3535 | XMM-Newton | 0551430601 | EPIC-pn | 2009 Mar 18 | 17:01 | 29.2 (12.1) | |
| OM-Ba | 16:47 | 6.7 | (16.4) | ||||
| OM-UVM2a | 22:41 | 6.7 | (15.4) | ||||
| Swift | BAT | ||||||
| IGR J15094-6649 | XMM-Newton | 0551430301 | EPIC-pn | 2009 Feb 02 | 13:39 | 30.0 | 2.560.01 |
| OM-U | 13:25 | 14.2 | (14.3) | ||||
| OM-UVM2a | 17:49 | 12.4 | (14.7) | ||||
| RGS 1&2 | 13:16 | 31.9 | |||||
| INTEGRAL | IBIS/ISGRI | 1400 | |||||
| XSS J0056+4548 | XMM-Newton | 0501230301 | EPIC-pn | 2007 Dec 31 | 04:56 | 15.0 (7.4) | |
| OM-B | 04:42 | 6.7 | (14.6) | ||||
| OM-UVM2 | 07:01 | 6.7 | (13.2) | ||||
| RGS 1&2 | 04:33 | 16.9 | |||||
| INTEGRAL | IBIS/ISGRI | 240 |
∗ Optical Monitor band reported when data usable
∗∗ Net exposure times. In parenthesis is reported the solar flare removed exposure
∗∗∗ Instrumental magnitude reported in parenthesis.
a No variability detected.
b Time window filter applied: only first 2/3 of observation are used.
2.2 The INTEGRAL observations
The INTEGRAL IBIS/ISGRI instrument (Ubertini et al. 2003; Lebrun et al. 2003) observed all sources except RX J0636. Hard (20–100 keV) X-ray data were extracted from all pointings within 12° from the source positions.
To study the persistent X-ray emission, the time-averaged ISGRI spectra were obtained from mosaic images in five energy bands, logarithmically spaced between 20 and 100 keV. Data were reduced with the standard OSA software version 7.0 and then analyzed with the algorithms described by Goldwurm et al. (2003).
2.3 The Swift observations
The Swift Burst Alert Telescope, BAT (Barthelmy 2000), is a wide-field (1 steradian) coded aperture mask instrument sensitive in the 14–195 keV range. Thanks to the large field of view, BAT has built up a sensitive all-sky map of the hard X-ray sky. The BAT team provides the average 8-channel spectrum of each source detected over the first 58 month of the mission.
RX J0636 only recently appeared in the Swift/BAT 58 month survey catalogue. To obtain an high-energy coverage of this source we downloaded the BAT spectrum along with the response matrix (http://swift.gsfc.nasa.gov/docs/swift/results/bs58mon/).
3 Results
3.1 Timing analysis
All sources show periodic-like variability in their EPIC light curves and six of them also in their OM light curves. We then analyzed these light curves to identify periodic signals and to characterize them at different energies.
3.1.1 X-ray variability
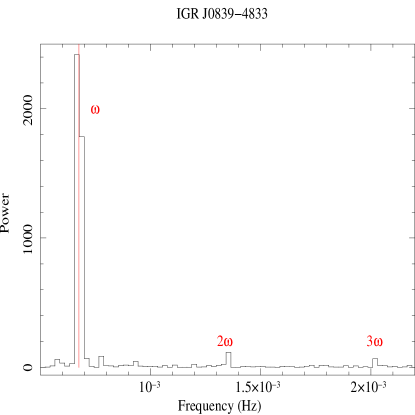
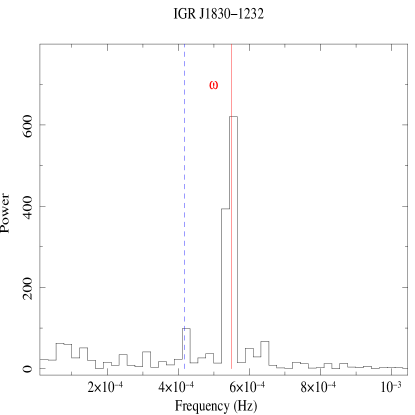
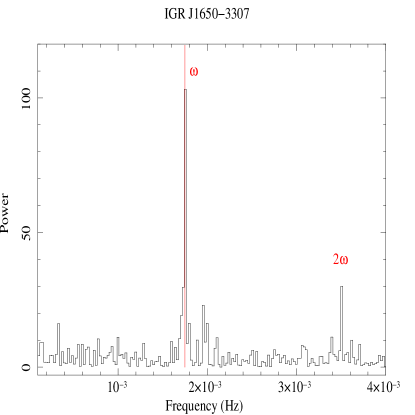
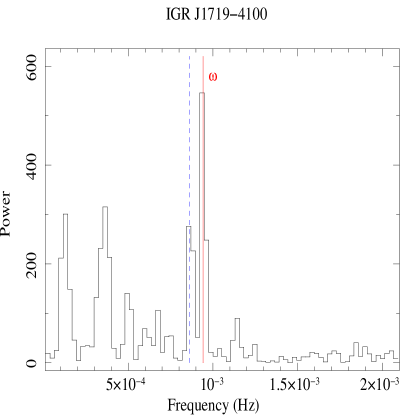
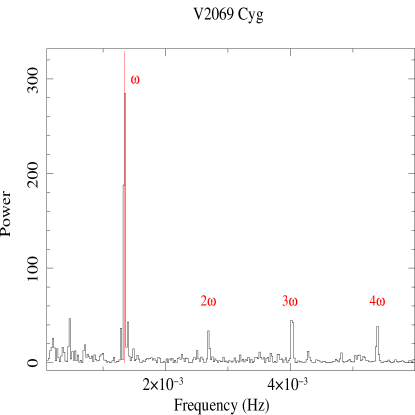
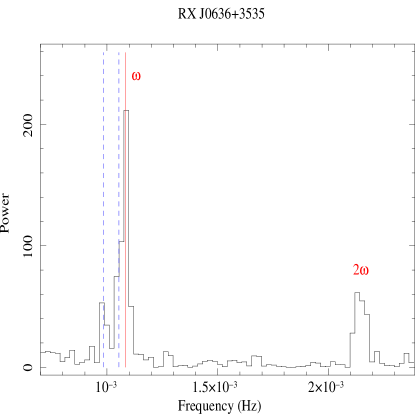
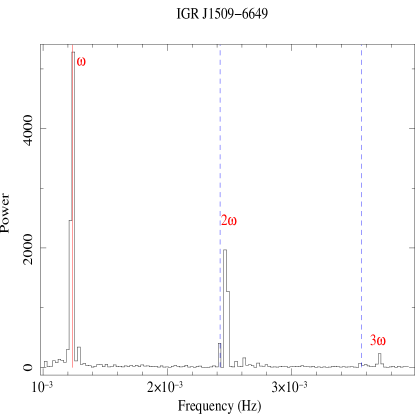
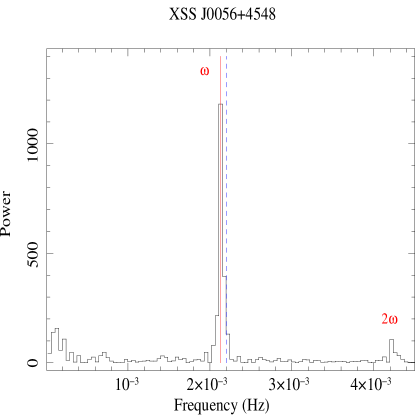
We computed the power spectra in the 0.3–15 keV range using the PN data. In all of them, strong peaks are found and in many cases also harmonics (see figure 1, 2, and 3). The periods of the main peaks were determined by means of a phase-fitting technique, see Dall’Osso et al. (2003) for details on the technique. The derived values are reported in table 2. All uncertainties are hereafter at confidence level (c.l.) if not otherwise specified. For IGR J1719 we did not detect significant periodic variability in the last third of the observation and therefore, the results refer to the first 2/3 only. This source also shows a variability on time scale of a few thousands of seconds occurring at about 1/3 of the total observation time. This variability is likely responsible for the low frequency peaks seen in the power spectrum. We are however unable to characterize it with the present data.
| Source | P | P | P | P | A/A | P | P | P | P |
|---|---|---|---|---|---|---|---|---|---|
| s | s | h | h | s | s | h | h | ||
| IGR J0839 | 1480.80.5 | - | - | - | 148013 | 15607 | 81.0a | 81 | |
| IGR J1830 | 18202 | 240019 () | 4.20.2 | - | 2.6 | - | - | - | 4.20.2 |
| IGR J16500b | 571.90.5 | - | - | - | - | - | - | 3.6170.003 [1] | 3.6170.003 |
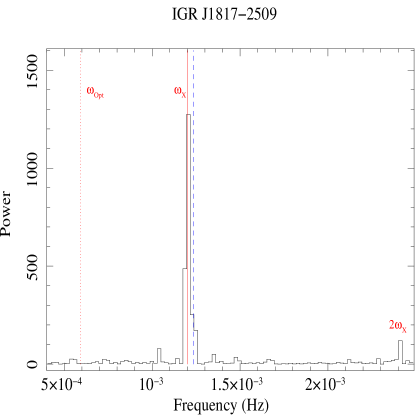
| IGR J1817 | 831.70.7 () | 8101.0 (2()) | 8.50.2 | 6.60.3 (3.41)c | 2.5 | 169018 | - | - | 6.3–8.7 |
| IGR J1719d | 10622 | 11634 () | 3.20.8 | - | 1.4 | - | 11024 | 4.0050.006 [1] | 4.0050.006 |
| V2069 Cyg | 743.10.6 | - | - | - | - | 7515 | - | 7.480390.00005 [2] | 7.480390.00005 |
| RX J0636e | 9201 | 9524 () | 7.60.9 | (3.00)c,f | 1.4 | - | - | [3] | 5 |
| 10165 () | 5.40.5 | 1.9 | |||||||
| IGR J1509g | 808.70.1 | 842.40.6 () | 5.660.08 | - | 1.4 | 8141 | - | 5.890.01 [1] | 5.890.01 |
| 412.70.5 (2) | 5.60.3 | - | 2.4 | - | - | ||||
| XSS J0056h | 470.10.2 | 454.20.7 () | 3.70.2 | 4.10.4 (4.21)c | 2.6 | 4742 | - | 2.6240.001 [4] | 2.6240.001 |
| 2.520.08i |
a Orbital period from OM photometric periods.
b Ground based photometric optical pulse at 597.920.04 s [1].
c Detection significance is reported in parenthesis in unity of .
d Ground based photometric optical pulse at 1139.550.04 s and
weaker signal at s [1].
e Ground based photometric optical pulse at 1008.3410.002 s and
weaker signal at
930.5830.004 s [3].
f Since the total exposure is 8 h, we here give the uncertainty at c.l.
g Beat period from 3().
Amplitude ratio refers to 3 and 3().
Ground based photometric optical pulse at 809.420.02 s [1]
h OM B band pulses derived from third and fifth segment.
Ground based photometric optical pulse at 470.400.03 s
[5].
i Orbital period from X-ray light curve.
References: [1] Pretorius 2009; [2] Thorstensen et al. 2001; [3] Gänsicke et al. 2005; [4] Bonnet-Bidaud et al. 2009; [5] de Martino et al. (priv.comm.)
 |
 |
 |
 |
 |
 |
 |
 |
 |
 |
 |
 |
 |
 |
 |
 |
 |
 |
For each source, the light curve in the 0.3–15 keV range was folded at the main () period reported in table 2, and then fitted with a series of sinusoids (one for each harmonic). The statistical significance of the inclusion of higher harmonics with respect to the fundamental one was evaluated by an F-test (see table 3). The first harmonic was always statistically significant (hereafter we consider significant a probability greater then c.l.), with the exception of IGR J1830 and IGR J1719 in which only the fundamental is significant. The second harmonic () was found to be significant in IGR J0839, V2069 Cyg and IGR J1509. V2069 Cyg is also the only source showing 4.
| Source | Pulsed Fraction | n | sign. | ||||
|---|---|---|---|---|---|---|---|
| 0.3–1 keV | 1–3 keV | 3–5 keV | 5–15 keV | 0.3–15 keV | |||
| % | % | % | % | % | |||
| IGR J0839 | 3 | 3.97 | |||||
| IGR J1830 | 1 | - | |||||
| IGR J1650 | 2 | 4.29 | |||||
| IGR J1817a | 2 | 5.94 | |||||
| IGR J1719b | 1 | - | |||||
| V2069 Cyg | 4 | 3.5 | |||||
| RX J0636 | 2 | 3.02 | |||||
| IGR J1509 | 3 | 3.52 | |||||
| XSS J0056 | 2 | 4.54 | |||||
a Pulsed fraction refers to .
b Derived from the first 2/3 of observation.
The power spectra of most sources either show an excess of power around the fundamental frequency or additional weaker peaks close-by. In some cases also the harmonics show similar excess or peaks. Therefore, to estimate their frequency we detrended the light curves from the main pulse by subtracting the composite sinusoidal function corresponding to the fundamental frequency plus their harmonics when detected. The residual power spectra of the detrended light curves makes clearly visible additional peaks. Consequently, we fitted the detrended light curves with one new sinusoid (or more sinusoids when harmonics are present). We reported the estimated period, when they resulted to be statistically significant, in table 2. These additional periodicities are identified as the orbital sidebands of the main pulse ().
IGR J1719, RX J0636 show the negative sideband (beat). In IGR J1509 we detected the harmonic of the beat 3, but not the fundamental, and the 2 sideband. In RX J0636 we also detected . For this source the presence of both negative sidebands is significant at 4 c.l.. For IGR J1830 the is detected at 4.1 c.l., but the is only at 1.5 c.l.. The positive sideband is detected in XSS J0056 (7.4 c.l.) and 2() in IGR J1817 (16 c.l.) since the main X-ray period is the first harmonic (see sect. 3.1.3).
We here note that Sazonov et al. (2008) using a short observation of IGR J0839 detected a periodicity of s consistent with our more constrained value.
Butters et al. (2008) failed to detect a periodicity in a RXTE observation of IGR J1719. On the other hand, they detected two periodic signals in XSS J0056 again using RXTE. One at 465.680.07 s and a weaker one at 489.00.7 s. The former is inconsistent with our determination (being out by more than 5 s), while the latter is not detected in our data.
For IGR J1817 Nichelli et al. (2009) using a Swift/XRT pointing report a period of 830.70.07 s consistent with our results and a period of 1660 s from a previous short exposure (see sect. 3.1.3 for its interpretation).
Butters et al. (2009) by using RXTE data of IGR J1509 found a signal at 809.70.6 s, consistent with our results.
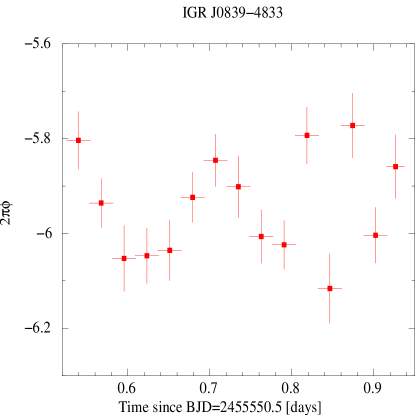
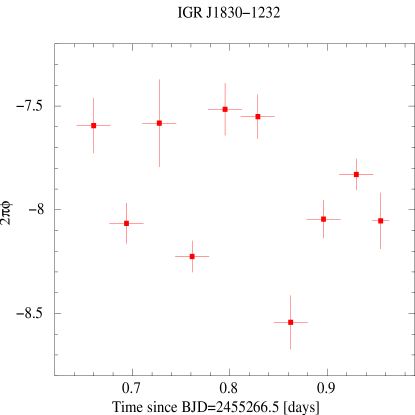
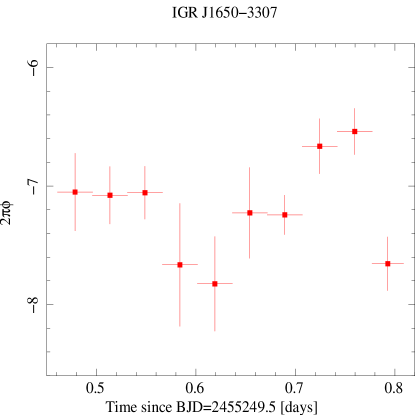
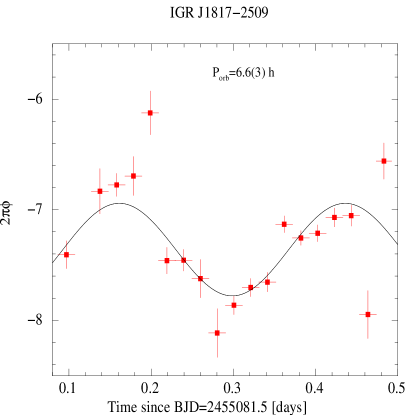
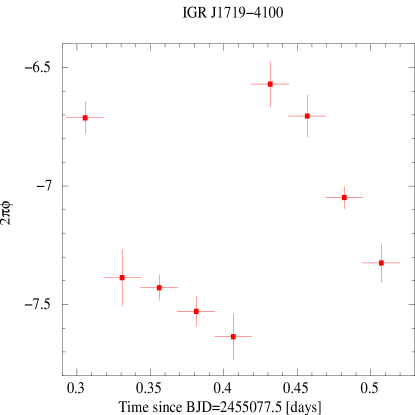
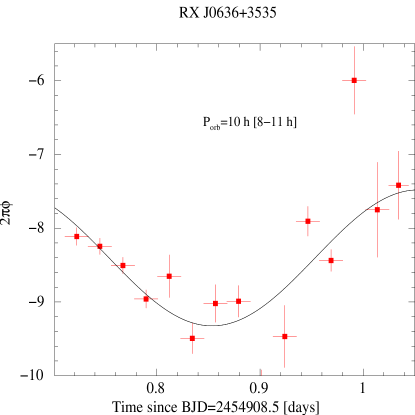
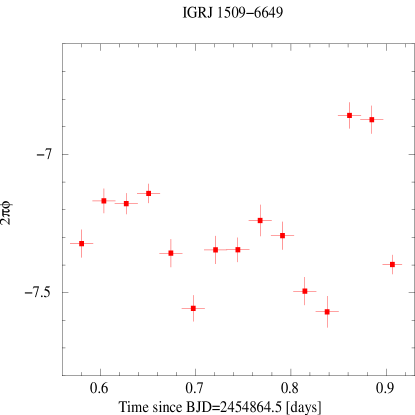
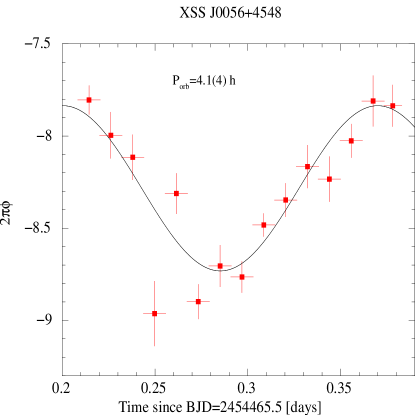
The phase-fitting procedure also allowed us to get an estimate of the orbital period. The light curve of each source was subdivided in intervals (10, 15 or 20), where depends on the source brightness and on the intensity of the signal. Then we folded each light curve at the period P reported in table 2 and then we fitted it with a Fourier sine series truncated at the highest significant harmonic. We consequently studied the variations with time of the phase (and amplitude) of the main pulsation, corresponding to the fundamental frequency. In most cases the phase variations, typically within 0.2, appear to be randomly distributed around the average value. Only in three sources, IGR J1817, RX J0636 and XSS J0056 the lag variations show a clear trend, allowing a sinusoidal fit. These are shown in figure 1, 2, and 3. The statistical significance of the inclusion of a sinusoid respect to a constant function is evaluated with an F-test, and was found to be 3.41, 3.00 and 4.21 respectively. The resulting periods are reported in column 5 of table 2.
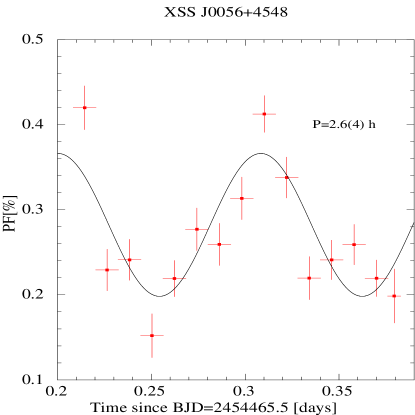
Most sources show also variations with time of the pulse amplitude (or PF, see sect. 3.1.2 for its definition), but these appear to be randomly distributed around an average value, without showing a clear trend. An exception is XSS J0056, where also the amplitude changes following a sinusoidal modulation. A sinusoidal fit is statistically significant at 3.52 (see figure 4), giving a period of h ( c.l.). Hence, while in RX J0636 and IGR J1817 the phase shifts could be due to time arrival delays, in XSS J0056 the variations seen in both amplitudes and phases are likely intrisic. This is also suggested by the presence of a peak around Hz in the power spectrum and a sinusoidal fit gives a period of 2.520.08 h, in agreement with the spectroscopic period found by Bonnet-Bidaud et al. (2009).
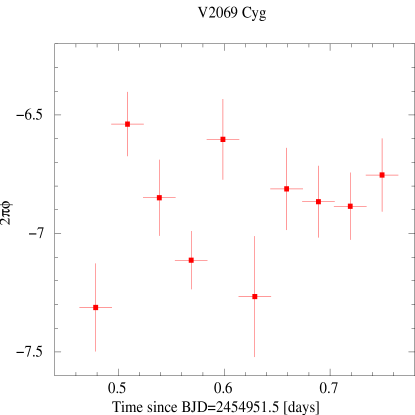
Interpreting the main pulsation as the WD spin period, the sidebands can be used to estimate the binary orbital periods, reported in column 4 of table 2. For IGR J1719 and IGR J1509 the periods are in agreement with those derived from spectroscopy, reported for comparison in column 9. The values found for IGR J1817 and XSS J0056 are consistent within errors with those derived from the phase-fitting method, but for XSS J0056 they are not compatible with the results from the PF vs time analysis and from the sinusoidal fit. For RX J0636 we found consistency between the period found from phase-fitting and that derived using the beat but not . However, all derived values are largely off from the tentative period of 3.4 h found from optical spectroscopy (Gänsicke et al. 2005). Furthermore, V2069 Cyg also shows in its power spectrum substantial power at low frequencies, but we are unable to constrain a period from the light curve. However, a sinusoidal fit with period fixed at 7.5 h, derived from spectroscopy by Thorstensen & Taylor (2001), provides a possible match with data and gives a 35 amplitude modulation. This variability is more pronounced at soft energies ( 3 keV), where we also detect a dip, lasting 1500 s, around the minimum of this long-term X-ray modulation (figure 5).
For the systems under study we hereafter adopt, when available, the more accurate orbital spectroscopic periods, except for RX J0636 for which the orbital period is likely larger, 5 h. For those sources without a spectroscopic determination we adopt the orbital periods as derived from the X-ray sidebands (for IGR J0839 from optical sideband). Exception is IGR J1817, for which we adopt the range 6.3–8.7 h, resulting from sidebands and phase-fitting method. The adopted values are reported in the last column of table 2.

3.1.2 Pulsed fraction
We also studied the energy dependence of pulses. We selected five energy bands, producing four background subtracted light curves binned at 66 s (0.3–1, 1–3, 3–5, 5–15 keV), plus the 0.3-15 keV light curve with a bin time of 11 s, and folded them at the value of reported in table 2. For all sources the X-ray pulse profiles have structured pulse shapes. Moreover, for all sources the pulse profiles resulted to be roughly phase aligned at all energies, within statistical uncertainties (see figure 6 and 7).
 |
 |
 |
 |
 |
 |
The folded light curves were then fitted with a Fourier sine series truncated at the highest significant harmonic. This allowed to study, for each energy interval, the pulsed fraction (PF), here defined as: , where and are respectively the maximum and minimum value of the sinusoid used to account for the fundamental harmonic. For all sources the PF was found to clearly decrease with energy (see table 3). In order to further inspect for possible spectral changes with the spin phase, we also construct the Hardness Ratios (HRs) using the three energy intervals 0.3–1 keV 1–3 and 3–5 keV. The HR is here defined as: , where is the number of photons detected by the PN camera in the inspected energy range (called a and b), and i is the phase interval. From we found for all sources a hardening at the pulse minimum, except for IGR J1830 and V2069 Cyg, where HR was found to be constant. For V2069 Cyg, due to its peculiar spectrum in the soft energy range (E keV; see sect. 3.2.1), we also inspected the , that indicate a softening at spin minimum, suggesting the contribution of a soft component.
 |
 |
 |
3.1.3 The Optical and UV variability
Optical and UV light curves were inspected for the presence of periodic signals by producing power spectra in each band, except for RX J0636, IGR J1830 and IGR J1650 that were too faint. The UV light curves are generally noisier and for most of them we are unable to find significant periodicities.
The light curves were also fitted with a sinusoidal function. The periods were always found to be consistent with one of those detected in the X-rays (see table 2). Worth noticing are the following cases:
IGR J0839: The UV light is modulated (PF=35) at a period ( s) consistent with that found in the X-rays, but the B band light curve shows a period of s (PF=22). The latter is likely the orbital sideband (beat) -, suggesting an orbital period of = h. Hence this source is spin-dominated in the X-rays and UV, but beat-dominated in the optical.
IGR J1817: From the light curve in the B filter we derived a period of s, twice the detected X-ray period. Moreover, no signal was found at the X-ray period. We conclude that the X-ray period corresponds to the first harmonic, while the optical period is the spin.
IGR J1719: The B band light curve, simultaneous with the X-rays, shows a period of s. This value falls in between the two periods detected in the X-rays ( s and s), suggesting that both periodicities are also present at optical wavelengths. This is also confirmed by ground-based optical photometry (Pretorius 2009) that showed a weaker s and a stronger s peak in the power spectra. Therefore, also this system is spin-dominated in the X-ray, while beat-dominated at optical wavelengths (see also sect. 4.2).
V2069 Cyg: we derived a pulse period of s, consistent, within errors, with that found in the X-rays. Interestingly, folding the light curve at the X-ray period, the optical pulse is anti-phased with the X-ray one. Moreover, it shows a broad maximum centered on the X-ray minimum, with a dip where an X-ray secondary maximum occurs (see Fig 6).
XSS J0056: it has peculiar UV and optical variabilities. The power spectra in these bands did not show significant peaks. However, inspection of the individual five segments (1.34ks each) in the two bands revealed the presence of non-stationary pulses. They are found to be phase aligned with the X-ray pulse during the first 2/5 of the OM B band exposure, for which a sinusoidal fit gives a period of 4744s (consistent with what found in X-rays), but antiphased in the third and fifth segment (see figure 7 and 8). The UVM2 filter data revealed a weak variability () during the third and possibly the fourth segment, but we are unable to determine the period.

3.2 Spectral analysis
3.2.1 0.3–100 keV spectrum
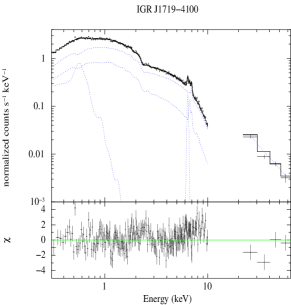
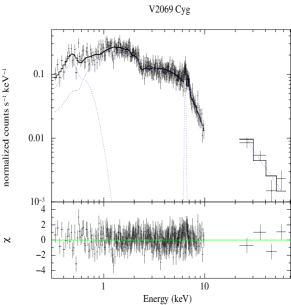
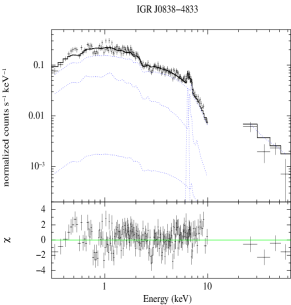
For all sources, a single-temperature model is inadequate to describe the broad band (0.3-100 keV) spectrum. We found the best match with composite models that consist of a combination of a number of optically thin plasma (mekal) components plus a Gaussian at 6.4 keV, including a total (Wabs) and a partial covering absorber (Pcfabs). The statistical significance of the inclusion of additional mekal components was always verified with a F-test. All best-fit spectral parameters are reported in table 4.
At least two characteristic temperatures were always present, three in the case of IGR J0839, IGR J1830, IGR J1650, IGR J1817 and IGR J1719. We broadly divided these optically thin components into a cold ( keV, exception is IGR J0839 with keV), a medium (4–10 keV) and an hot (30–60 keV) one. The presence of low temperature plasma is supported by the RGS spectral analysis of IGR J1719, IGR J1509, and XSS J0056 (see sect. 3.2.3).
However, in V2069 Cyg the cold mekal temperature was unconstrained, while for RX J0636, the abundance was unreliably low (0) A more physically-justified model is obtained by substituting the cold mekal with a blackbody (BB) component at a temperature of 70–80 eV (see also figure 9).
All metal abundances were found to be consistent with the solar value except IGR J1817, for which a highly sub-solar () value was found.
 |
 |
 |
For all sources we found significant presence of an emission feature at about 6.4 keV (see figure 9), with no significant shift in energy. Hence, we fixed the centroid energy of the Gaussian component at 6.4 keV. The equivalent widths (EW) of this emission feature were found 100-220 eV, consistent with fluorescent Fe line. This suggests the presence of a continuum reflected component, whose inclusion (reflect), however, provides meaningful fit only for IGR J1650, lowering the temperature of the hot mekal (see last line of table 4).
All sources are affected by strong complex absorption. The hydrogen column density () of the total absorber was found to be lower or consistent with the interstellar value in the direction of the sources. The partial absorber, with typical covering fraction , was found at much higher column densities (up to ) and hence is instead intrinsic to the sources. For IGR J1817 and XSS J0056, which were found with the highest value of intrinsic absorption ( and cm-2) we used the model (Done & Magdziarz 1998), that assumes a power-law distribution of neutral absorbers and is likely more appropriate in case of high density intervening absorbing columns. This provided a better fit in terms of . However, the column density resulted to be poorly constrained in XSS J0056.
IGR J0839 is the only source which, in addition to the two intervening absorbing columns, also displays an evident absorption feature found at 0.76 keV. We modeled it using an edge component, which statistical significance, evaluated with an F-Test, resulted to be . This feature is consistent with being an OVII K-shell absorption edge with an optical depth =0.6. It indicates an ionized absorber along the line of sight.
| source | model | N | N | cvf | kTc | kTm | kTh | nc | nm | nh | AZ | EW | F0.3-15 | F15-100 |
|---|---|---|---|---|---|---|---|---|---|---|---|---|---|---|
| cm-2 | cm-2 | % | keV | keV | keV | keV | ||||||||
| IGR J0839 | 3meka | 0.155(6) | 6.8(8) | 60(2) | 0.69(5) | 6(1) | 54(9) | 0.2(1) | 1.1(3) | 3.4(3) | 0.8(1) | 0.13(2) | 0.75(5) | 1.2(3) |
| /dof 1.13/550 | ||||||||||||||
| IGRJ 1830 | 3mek | 0.82(7) | 15(2) | 60(3) | 0.16(1) | 6(2) | 40(20) | 20(10) | 2.1(6) | 4.5(4) | 0.9(2) | 0.17(2) | 0.94(4) | 0.9(1) |
| /dof 0.96/359 | ||||||||||||||
| IGR J1650 | 3mek | 0.30(3) | 11(1) | 62(1) | 0.18(1) | 7(1) | 59(8) | 0.5(2) | 1.4(3) | 7(3) | 1.6(3) | 0.22(2) | 1.5(1) | 2.7(2) |
| /dof 1.09/630 | ||||||||||||||
| IGR J1817 | 3mekb | 0.04(2) | 50(10)c | -0.22(4)d | 0.26(2) | 4(1) | 35(5) | 9(4) | 10(2) | 9.2(6) | 0.20(7) | 0.10(1) | 1.50(1) | 2.4(2) |
| /dof 1.02/731 | ||||||||||||||
| IGR J1719 | 3mek | 0.105(3) | 6.3(3) | 43(1) | 0.159(5) | 8(1) | 30(2) | 1.5(2) | 7(1) | 18(1) | 0.62(4) | 0.13(1) | 4.7(2) | 3.8(2) |
| /dof 1.09/1563 | ||||||||||||||
| V2069 Cyg | bb+mek | 0.35(4) | 8(1) | 64(2) | 0.070(4)e | - | 32(4) | 7(4)f | - | 6.8(3) | 0.6(2) | 0.18(2) | 1.18(2) | 1.5(1) |
| /dof 1.06/379 | ||||||||||||||
| RX J0636 | bb+mek | 11(1) | 57(3) | 0.079(2)e | - | 36(5) | 0.8(3)f | - | 5.5(3) | 0.6(2) | 0.14(3) | 1.0(3) | 1.3(3) | |
| /dof 1.00/474 | ||||||||||||||
| IGR J1509 | 2mek | 0.05(1) | 6.6(6) | 54(1) | 0.12(1) | - | 34(3) | 3(1) | - | 10.8(3) | 0.4(1) | 0.17(2) | 2.04(2) | 2.3(2) |
| /dof 1.23/900 | ||||||||||||||
| XSS J0056 | 2mekb | 0.04(1) | 300(200)c | -0.60(1)d | 0.16(1) | 10.2(6) | - | 9.0(4) | 50(10) | 0.42(5) | 0.13(3) | 3.4(3) | 1.8(4) | |
| /dof 1.03/578 | ||||||||||||||
| IGR J1650 | R*3mekg | 0.28(2) | 9(1) | 60(1) | 0.18(2) | 7(1) | 41(4) | 0.4(2) | 1.1(2) | 6(3) | 1.6(fix) | 0.22(2) | 1.5(1) | 2.8(2) |
| /dof 1.08/630 |
a ,.
b Pwab model used. N is fixed at the minimum boundary level of 1015 cm-2.
c NHmax.
d .
e Blackbodyrad kT.
f Blackbodyrad normalization . It is defined as ,
where is the source distance in unit of 10 kpc.
g Reflection model used. R=0.980.02. Cosine of inclination is fixed at 0.45.
Since the hot temperature should be regarded as a lower limit to the maximum temperature of the PSR, we also used the model of Suleimanov et al. (2005), that takes into account the growth of pressure toward the WD surface and hence the change of gravity, to obtain a more reliable value for the maximum temperature and consequently an estimate of the WD mass. This model is computed for the continuum only. We included in the fit the same absorber components as in the multi-temperature fit, as well as a broad Gaussian that takes into account the iron line complex. We obtain in all cases an acceptable between 1.1–1.3. The resulting masses are found in the range 0.74–0.96 M⊙ (see table 5). We also note that the temperature of the hot component (and hence the masses) determined with the multi-temperature model are within consistent with those found with the PSR model, except for XSS J0056 whose temperature would give a unrealistic low WD mass. This could suggest that the hot component is close to that at the shock. All other best fit parameters are compatible, within uncertainty, with that reported in table 4. For IGR J1650, we also tried to include a reflection component without any fit improvement. This is likely due to the lack of coverage in the 10–20 keV range and the low statistics above 20 keV, that prevent us from drawing conclusions on the reflected continuum.
| Source | D∗ | ||
|---|---|---|---|
| pc | |||
| IGR J0839 | 0.950.08 | 3.2 | 1200 |
| IGR J1830 | 0.850.06 | 2.4 | 100 |
| IGR J1650 | 0.920.06 | 4.1 | 270 |
| IGR J1817 | 0.960.05 | 2.4 | 610 |
| IGR J1719 | 0.860.06 | 1.9 | 130 |
| V2069 Cyg | 0.820.08 | 5.3 | 930 |
| RX J0636 | 0.740.06 | 5.4 | 1100 |
| IRG J1509 | 0.890.08 | 2.5 | 600 |
| XSS J0056 | 0.790.07 | 2.5 | 320 |
∗ Lower limits to the distances are determined as follows: we used the lower uncertainty values of the adopted orbital periods and the 2MASS K band (reddening correction not applied) magnitudes of the optical counterparts. For the secondary stars we used the K band absolute magnitudes predicted for CV donors as a function of (Knigge 2006), assuming that these donors totally contribute to the K band flux.
3.2.2 Pulse Phase Spectroscopy
To understand the role of spectral parameters in producing the observed X-ray pulses, we carried out a phase resolved spectral analysis. For all sources we extracted the spectra at the maximum and minimum of the pulsation (see table 6 for details on the interval selection). We kept fixed the column density of the total absorber, the metal abundance, and the parameters of the hot mekal component to the values found from the phase averaged spectral fits. We also fixed the intermediate mekal temperature, since it was always consistent with that derived from average fit (except for IGR J1650). Furthermore, inspection of the fluorescent Fe line for phase-dependent velocity shifts gave no significant change and hence we fixed the Gaussian centroid at 6.4 keV. All other parameters were left free to vary (see table 4).
In all cases the spectrum at the minimum is more absorbed than that at the maximum (see table 6), due to higher values of the hydrogen column density and of the covering fraction (however for XSS J0056 we fixed the density of the absorber to the average spectrum values). No variation in the normalization of the cold mekal component is found except for IGR J1650 where it decreases at minimum. We then conclude that the pulses are mainly due to phase-dependent absorption.
Interesting is the case of V2069 Cyg that instead shows an increase in the normalization of the BB component at pulse minimum, in accordance with the behaviour of the energy dependent pulses (figure 6). This suggests that the secondary maximum at , best seen below 1 keV, is produced by an increase of the normalization of this optically thick component.
We found evidence for phase variation in the EWs of the Fe fluorescent line only in IGR J0839 and IGR J1509. In these sources the EWs change between and keV and and keV at maximum and minimum, respectively.
| source | N | cvf | kTc | nc | nm | nh | EW | F0.3-15 | /dof |
|---|---|---|---|---|---|---|---|---|---|
| 1022 cm-2 | % | keV | keV | ||||||
| IGR J0839a | |||||||||
| Max () | 6(1) | 40(3) | 0.69(fix) | 0.34(7) | 1.2(3) | 3.9(3) | 0.08(3) | 0.92(3) | 1.20/485 |
| Min () | 7(1) | 81(1) | 0.69(fix) | 0.7(3) | 3.1(2) | 0.16(3) | 0.60(3) | ||
| IGR J1830 | |||||||||
| Max () | 5(2) | 49(3) | 0.21(1) | 5(1) | 1.9(3) | 4.7(3) | 0.22(4) | 1.11(6) | 1.03/131 |
| Min () | 14(2) | 65(2) | 0.16(1) | 30(10) | 1.3(2) | 3.9(5) | 0.23(8) | 0.76(4) | |
| IGR J1650 | |||||||||
| Max () | 13(2) | 56(2) | 0.09(1) ; 0.7(1)b | 2.8(4) | 0.10(5) | 8.6(5) | 0.25(5) | 1.58(4) | 0.93/353 |
| Min () | 12(1) | 66(1) | 0.15(4) ; 8(2)b | 0.6(2) | 1.8(5) | 6.6(7) | 0.22(3) | 1.44(6) | |
| IGR J1817 | |||||||||
| Max () | 50(15)c | -0.25(8)d | 0.26(fix) | 9.6(3) | 15.2(6) | 10(4) | 0.15(4) | 1.7(1) | 1.06/356 |
| Min () | 80(20)c | -0.1(1)d | 0.26(fix) | 16(7) | 13(9) | 9(3) | 0.10(3) | 1.4(1) | |
| IGR J1719 | |||||||||
| Max () | 6.7(7) | 39(2) | 0.18(1) | 1.2(1) | 6(1) | 19(1) | 0.14(2) | 4.75(3) | 1.03/1768 |
| Min () | 7.9(6) | 47(1) | 0.15(1) | 1.7(4) | 5(1) | 20(1) | 0.13(2) | 4.64(3) | |
| V2069 Cyg | |||||||||
| Max () | 5.4(6) | 61(7) | 0.073(1)e | 5.8(6)f | - | 7.2(1) | 0.24(8) | 1.33(3) | 1.05/275 |
| Min () | 11(1) | 70(1) | 0.065(1)e | 13(1)f | - | 6.6(1) | 0.27(4) | 1.07(4) | |
| RX J0636 | |||||||||
| Max () | 9(2) | 49(3) | 0.08(3)e | 0.6(1)f | - | 5.2(4) | 0.08(3) | 1.04(3) | 1.08/441 |
| Min () | 8(2) | 64(3) | 0.08(1)e | 0.7(3)f | - | 4.7(3) | 0.07(6) | 0.87(5) | |
| IGR J1509 | |||||||||
| Max () | 5(1) | 27(2) | 0.11(1) | 3.2(6) | - | 11.6(3) | 0.09(3) | 2.50(4) | 1.11/824 |
| Min () | 9(1) | 67(1) | 0.12(1) | 2.8(6) | - | 10.7(3) | 0.23(4) | 1.82(2) | |
| XSS J0056 | |||||||||
| Max () | 300(fix)c | -0.64(1)d | 0.16(2) | 8(2) | 50.0(2) | - | 0.12(3) | 3.2(1) | 0.96/360 |
| Min () | 300(fix)c | -0.52(1)d | 0.12(4) | 20(10) | 48.6(2) | - | 0.15(3) | 2.6(1) |
a Max: E ; Min:
E .
b Medium mekal temperature.
c N.
d .
e Blackbodyrad temperature.
f Blackbodyrad Normalization . Blackbodyrad normalization is defined as ,
where is the source distance in unit of 10 kpc.
3.2.3 RGS spectrum
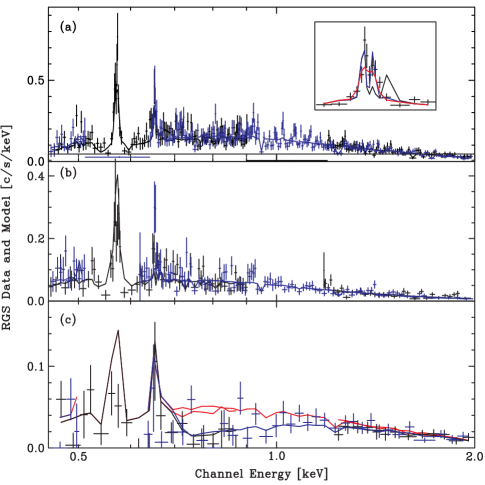
The RGS spectra of IGR J1719, IGR J1509 and XSS J0056 (see figure 9) were fitted in two ways. In one, we used continuum only models (absorbed BB plus bremsstrahlung) and fitted the strongest lines using Gaussians, to derive their centroid, width, and intensity in a manner that does not strongly depend on the choice of models. In IGR J1719, the lines of OVII, OVIII, NeIX and NeX were all strong enough for such a treatment; in IGR J1509, only the two oxygen lines; and for XSS J0056 only the OVII line (see table 7). In addition to the line fluxes, which are consistent with the prediction of the EPIC model, we found, for IGR J1719 and IGR J1509, that the lines are mildly broadened with Gaussian of order 1000 km s (or FWHM 2500 km s-1) and that the centroids of the He-like triplets (OVII and NeIX for the former and OVII only for the latter) are between the expected energies of the resonant and intercombination components, when fitted with a single Gaussian.
We also explored global fits, based on the best-fit model for the EPIC spectra. For XSS J0056, there is a marginal indication that an addition of a OVII edge would improve the fit, even though this was not statistically significant in the EPIC fit. This should be explored further using future, higher signal-to-noise spectra. For IGR J1719, although the basic features of the RGS spectra were reproduced using the EPIC model (including the normalization), the reduced is 1.32 for 363 degrees of freedom. We obtained an improved fit (, 351 dof) by including a Gaussian deconvolution using the model and by letting the mekal density parameter be fitted. The fit converged to a high density regime (i.e., with no forbidden components for the He-like triplets) with 1250 km s-1, consistent with our findings from the phenomenological model. Similarly, a high density, mildly broadened model was more successful in fitting the RGS spectra of IGR J1509.
| IGR J1719 | |||
| Line | E | Flux | |
| keV | eV | photons cm-2 s-1 | |
| OVII | |||
| OVIII | |||
| NeIX | |||
| NeX | |||
| [km/s] | |||
| IGR J1509 | |||
| Line | E | Flux | |
| keV | eV | photons cm-2 s-1 | |
| OVII | |||
| OVIII | |||
| [km/s] | |||
| XSS0056 | |||
| Line | E | Flux | |
| keV | eV | photons cm-2 s-1 | |
| OVII | |||
4 Discussion
The CVs analyzed here are all found to be strong X-ray pulsators with periods ranging from 470 s to 1800 s. In IGR J0839, IGR J1817, IGR J1719, V2069 Cyg, IGR J1509 and XSS J0056, periodicities are also identified in simultaneous OM optical (B or U bands) or UV photometry. X-ray pulses are unambiguous signature of magnetically confined accretion and hence of the WD rotational period. Therefore, all sources can be classified as CVs of the IP type.
The XMMNewton data have allowed us: to identify for the first time the WD spin period in IGR J1830, IGR J1650, IGR J1817, IGR J1719, V2069 Cyg and RX J0636, and to refine the spin period of IGR J0839 and IGR J1509 (but we determined a slightly different period for XSS J0056). Furthermore, we could infer the orbital periods (except for IGR J1650). We provide first estimates for IGR J0839, IGR J1830, IGR J1817 and find consistency with the spectroscopic periods for IGR J1719, IGR J1509, V2069 Cyg and XSS J0056 except RX J0636.
We have also presented the first broad band X-ray spectral analysis of these sources as well as spin phase-resolved spectra, allowing us to identify commonalities to IPs, but also peculiarities in some sources.
We discuss here the results in terms of accretion and emission properties.
4.1 X-ray pulses as tracers of accretion mode
The presence in the power spectra of a strong and dominant signal at the WD spin period, especially in the hard (E4 keV) X-rays, is a signature that accretion occurs predominantly through a disc because the circulating material loses memory of the orbital motion (Wynn & King 1992). For IGR J0839, V2069 Cyg and IGR J16500, we have detected only the spin frequency in X-rays, and then they likely are pure disc-accretors. Noteworthy, the OM optical (but not the UV) data of IGR J0839 and the ground-based optical photometry of IGR J16500, IGR J1719 (Pretorius 2009) and RX J0636 (Gänsicke et al. 2005) reveal instead stronger signals at the orbital sideband, , rather than at the spin period. Since the optical light originates from reprocessing of X-rays at fixed regions within the binary (Warner 1995), this makes the X-rays the best tracers of the true WD rotational period.
Six out of nine systems, while displaying a dominant spin periodicity in the X-ray band, also show signals at sideband frequencies (table 2), with spin-to-sideband amplitude ratios 1.4–2.6. Hence, although the bulk of accretion onto the WD takes place through a disc, a fraction of it (35 up to 70) passes over the disc and is directly channeled onto the WD magnetic poles. This hybrid mode of accretion, the disc-overflow, is also observed in other confirmed IPs (Hellier 1995; Norton & Taylor 1996; Norton et al. 1997) and in more recently identified members (Anzolin et al. 2008). Worth mentioning is the case of IGR J1719 whose X-ray light curve reveals spin and sideband pulses only during the first 2/3 of observation, while no strong coherent signals are found afterward. This system is the one with a low spin to beat amplitude ratio of 1.4 and a spin PF. It could be possible that the two variabilities interfere destructively, as also suggested by the large jumps in the phase of the signal with time (see figure 2) and the low-frequency variations in the power spectrum. Hence, the somewhat peculiar behaviour of this IP could be due to substantial disc-overflow.
Two systems, IGR J1817 and XSS J0056, reveal a weak signal at a putative positive sideband, , that would imply a retrograde WD rotation. We cannot exclude that the true spin period is the latter and hence the stronger signal is the beat. In this case the two systems would be beat-dominated at both X-ray and optical wavelengths and then disc-less accretor. A similar problem raised for BG CMi (Norton et al. 1992; Garlick et al. 1994; de Martino et al. 1995). To solve this issue, both fast time-resolved spectroscopy and polarimetry are needed.
Furthermore, for IGR J1830 and RX J0636 the presence of the sideband would imply an orbital modulation of the amplitude of the beat frequency if this is an intrinsic emission. Hence, the beat and the spin pulses would be produced by different modes, stream-fed and disc-fed accretion respectively, see also Norton et al. (1997).
Long-term variation consistent with the orbital period was found in XSS J0056, and likely in V2069 Cyg. In the latter, we also detected a dip at minimum of the possible orbital modulation, more pronounced in the soft bands, indicating a spectral hardening. Orbital variations are often found in IPs and are likely due to absorption effects from fixed regions within the binary frame, such as the disc edge, in systems viewed at relatively large inclination angles, i (Parker et al. 2005).
Using the adopted orbital periods, reported in table 2, the spin-orbit period ratios, defined as , are lower than 0.1, except for IGR J1830 (0.12), and cluster around 0.03-0.05 (see figure 11). All but one (XSS J0056), have above the orbital gap. A strong asynchronism ( 0.1) and long orbital periods are predicted by evolutionary models, where mCVs evolve towards shorter orbital periods and, depending on the WD magnetic field strength, may or may not eventually synchronize (Norton et al. 2004, 2008). In long period highly asynchronous systems, the accretion flow is expected to take part in a disc-like configuration, as indeed inferred from X-rays. Such configuration may change while the system evolves towards short orbital periods, depending on the WD magnetic field strength. To further progress in this issue, polarimetric measures of new systems are crucial to assess whether these systems will eventually synchronize. For IGR J1509 a recent polarimetric survey of new IPs has indeed revealed that the optical-red light is polarized at a few percent (), suggesting a strong magnetic field (10 MG) and a likely evolution towards synchronism (Potter et al. 2012).
4.2 Origin of pulses
In most of the sampled sources the harmonics of the fundamental (up to 4) are detected, indicating departures from strictly sinusoidal pulse shapes. Non strictly sinusoidal pulses are seen also in the hard X-rays, where absorption is negligible. This suggests that the emitting regions depart from a symmetric dipole structure.
V2069 Cyg is the one showing the most structured pulse in our sample (see figure 6), with a secondary maximum centered on a primary broad minimum seen at all energies. This indicates the presence of a secondary emitting pole. Furthermore, HRs in the 0.3–1 keV and 1–3 keV bands display a softening at spin minimum, indicating an additional contribution at this phase. V2069 Cyg also shows a BB component at soft energies (see Sect. 3.2.1) whose contribution increases at the minimum of pulse (see table 6). Hence, a reprocessed component at the WD surface is present and is anti-phased with the optically thin emission from the PSR.
On the other hand, IGR J1817 pulsates at a period that is half that found at optical wavelengths, indicating two symmetric poles contributing almost equally in the X-rays. The optical pulse is broad and overlaps the two X-ray maxima (figure 6) and hence likely originates from wide upper accretion regions above the two poles.
For all sources the pulses are energy dependent, with amplitude decreasing at high energies. The softest band (0.3–1 keV) has pulse fractions even up to 99, seen in IGR J0839, decreasing to a few percent in the harder band 5-15 keV. The pulses harden at spin minimum in most sources as confirmed from the spectral analysis (see Sect. 3.2.2). This is a typical behaviour observed in IP type CVs and consistent with the accretion curtain scenario proposed by Rosen et al. (1988), where the modulation is mainly caused by spin-dependent photoelectric absorption in an arc-shaped accretion curtain. The absorption is expected to be larger when viewing the curtain along the magnetic field lines (spin minimum). At these phases the softest regions are absorbed resulting in a spectral hardening.
The curtain is also expected to contribute in the UV and optical light and hence the pulses at these wavelengths should be in phase with the X-rays. This is the case of IGR J0839, and IGR J1509, though the optical light is dominated by the beat in the first system. A peculiar case is XSS J0056 that reveals optical pulses changing phase with time: they are phase aligned with the X-rays only during the first 2/5th of observation. This may suggest a non-stationary contribution from two poles in the optical light. Also IGR J1719 and V2069 Cyg display anti-phased X-ray and optical pulses that could be due either to a more luminous secondary pole or to the heated WD polar cap. For V2069 Cyg the second option could be favored because of the detection of the BB component in its spectrum.
4.3 X-ray emission components and energy budget
The analysis of the average 0.3–100 keV spectra gives evidence of multi-temperature emission components as well as of complex intrinsic absorption. A low temperature (0.1-0.7 keV) plasma traces the regions closer to the WD surface. The oxygen H- and He-like lines detected in the RGS spectra of IGR J1719 and IGR J1509 give further evidence for the presence of low-temperature plasma. Their intensity ratio (Mauche 2002) indicates a temperature of 0.2 keV and 0.1 keV, respectively. Since no forbidden component is detected in the He-like triplet, these lines form in high density regime (). The presence of Ne IX and Ne X and their ratio further indicate a temperature at 0.3 keV in IGR J1719.
The intermediate temperature component is required in the PN spectral fits to account for the Kα lines of Fe XXV (6.7 keV) and Fe XXVI (6.97 keV). These are strong in the spectrum of XSS J0056 thus providing a satisfactory fit with only two mekal components.
On the other hand, the high temperature component should originate in regions close to the shock. The wide range of values (30-60 keV) found in our sample would also imply a range of WD masses. The emitting hot regions have typically larger (3 times) emission measures (EM, normalizations in table 4) than those of the intermediate component, being that of IGR J1650 5 times. As , the larger might indicate a larger emitting volume and hence, on average, a larger size.
Hence, the multi-temperature spectra indicate a temperature gradient in the PSR though we are unable to map it with the present data.
Different are the cases of RX J0636 and V2069 Cyg that display a non-negligible soft BB component with eV. These two sources add themselves to the small group of soft X-ray IPs (Anzolin et al. 2008) increasing the roster to 15 systems. The ratio of bolometric fluxes are for V2069 Cyg and for RX J0636, respectively. Therefore, this component represents a substantial fraction of the energy budget in V2069 Cyg, but not in RX J0636. The normalization of this optically thick component increases at spin minimum in both sources. It can be identified with the X-ray heated WD polar cap, whose projected area is larger at this phase. We estimate an average spot area in V2069 Cyg, and hence a fractional WD area , for (see table 5 and also its notes for the lower limit estimate of distances). For RX J0636 we estimate and . These values are small, but comparable to what found in other soft X-ray IPs with similar BB temperatures.
An additional component, ubiquitous in magnetic CVs, is the fluorescent line at 6.4 keV. It is detected in all sources of our sample with large EWs (100-200 eV), arising from reflection of cold material. The lack of velocity shifts and the EW variability at pulse maximum and minimum in IGR J0839 and IGR J1509 suggest a likely origin at the WD surface. Such feature should be accompanied by a reflection continuum but our data do not allow to constrain this component.
A lower limit to the mass accretion rate can be derived assuming that the accretion luminosity is totally emitted in the X-rays: , where is the bolometric luminosity of the X-ray optically thin components and is the reprocessed X-ray luminosity, that is only included for V2069 Cyg and RX J0636. The estimated values are reported in column 3 of table 5. The secular mass accretion rates expected from angular momentum loss (AML) due to magnetic braking at the adopted orbital periods, would be in the range of M⊙ (McDermott & Taam 1989), for the sources above the gap. Hence, unless they are located at a distance 10 times larger than the estimated lower limits (very unlikely possibly except for IGR J1830 and IGR J1719), the X-ray emission can not be solely representative of accretion luminosity. A substantial fraction should be reprocessed and emitted in low energy bands, as supported by the detection of periodic signals at the spin and/or beat periods at UV and/or optical wavelengths, as firstly raised by Mukai et al. (1994). The only exception is XSS J0056 that falls in the period gap, for which the lower limit to the rate is compatible with the values expected either from magnetic braking or gravitational radiation (Warner 1995).
The spectral analysis has also shown the presence of dense (column densities up to ) material partially absorbing the X-ray emission. The spin phase dependence of absorption indicates that the spin pulsations are mainly due to photoelectric absorption from pre-shock material in the accretion curtain. Furthermore, we found indication for the presence of absorbing ionized material in one source (IGR J0839), whose signature is an OVII absorption edge detected at 0.76 keV. IGR J0839 adds as the third IP showing this feature (Mukai et al. 2001; de Martino et al. 2008). A warm absorber is commonly recognized in Low Mass X-ray Binaries (LMXB) through the presence of absorption edges and lines that have been related to ionized atmosphere above the accretion disc, giving rise to dips in close to edge-on systems (Diaz Trigo et al. 2006). The spectra at pulse maximum and minimum of this source do not provide strong evidence of changing in the edge parameters, suggesting that this material could be located within the binary, but not in the pre-shock magnetically confined accretion flow. A possible similarity to the LMXB dippers should be further investigated with phase–resolved spectroscopy along the binary period that we are unable to perform with the present data.
4.4 Are hard X-ray IPs different?
The hard X-ray sources analyzed here are confirmed as IP type CVs. Their spin periods are well within the range of previously known members of this group as depicted in figure 11 where our sample is shown together with the current confirmed IPs. Orbital periods have been estimated combining X-ray and optical results. Most of them are found above the 2–3 hr period gap except for XSS J0056 whose high asynchronism (=0.05) might suggest it will never synchronize. The inferred spin-to-orbit period ratios are 0.12 consistent with most IPs. Hence, there is no striking difference between hard X-ray discovered IPs and other known IPs. Nonetheless, the orbital period distribution is now being also populated by the new hard systems at 5 h.

To inspect whether these selected INTEGRAL and Swift IPs possess massive WD we derived their masses using the maximum temperature obtained from fitting the broad-band spectra with the PSR model and taking it as an estimate of the shock temperature (see table 5). These are obtained using and adopting the WD mass-radius relation from Nauenberg (1972). The mean WD mass of our sample is 0.860.07 M⊙. Consistent results were also found in a recent study of 17 IPs made by Yuasa et al. (2010), though they suggest a likely bias toward high masses (due to a high energy sampling). The average WD mass we found is also fully consistent with a recent determination of CV primary masses of 0.80.2 made by Zorotovic et al. (2011). These authors also find that the WDs in CVs are substantially more massive than those in pre-CVs (0.67) and than single WDs (0.6 ). While the latter cases imply that the WDs increase their mass during the CV stage, the fact that IPs have primaries with masses similar to those of the whole CV population, suggests that the mass is not the driving parameter. Therefore, we conclude that the hard X-ray detected CVs, though possibly biased toward high mass, do not show remarkable difference from the whole CV population.
With the increase in the INTEGRAL and Swift exposures with time, most of the undiscovered IPs within 1.5 kpc will be likely detected. This is the case of the faint RX J0636, which only recently appeared in the new Swift/BAT catalogue (Cusumano et al. 2010). Therefore, the true population of IP type CVs is expected to be eventually unveiled by sensitive hard X-ray surveys of next generation mission. Moreover, as the new discovered IPs are being found in the previously poorly populated range of long orbital periods (P5 h), this will allow us a better understanding of the evolution these systems through comparison with recent models, e.g.Knigge et al. (2011).
5 Conclusions
The main goal of this work is the characterization of a sample of 9 new hard X-ray selected CVs, to unambiguously identify them as magnetic systems of the IP type. The main results can be summarized as follow:
-
•
All sources are strong X-ray pulsators with periods between 470–1820 s and thus are confirmed CVs of the IP type.
-
•
All but two sources are spin dominated systems in the X-rays. IGR J1817 and XSS J0056, remain ambiguous cases. IGR J0839, IGR J1719, IGR J1650 and RX J0636 are beat dominated at optical wavelengths.
-
•
IGR J0839, V2069 Cyg and IGR J16500 are disc-fed accretors, while IGR J1830, IGR J1719, RX J0636 and IGR J1509 display a disc-overflow accretion mode. IGR J1817 and XSS J0056 could be either stream-fed or disc-fed systems.
-
•
We also estimated the orbital periods (except for IGR J1650), all found to be above the 2–3 h period gap. XSS J0056 is the only exception, lying in the gap. We derived first estimates for IGR J0839 ( h), IGR J1830 ( h), and IGR J1817 (6.3–8.7 h).
-
•
The amplitude of the X-ray pulse was always found to decrease with energy due to complex absorption.
-
•
We identified two or three optically thin components with characteristic temperatures in the ranges: 0.1–0.7, 4–10 and 30–60 keV (signature of a temperature gradient in the post-shock region). Three are present in six sources.
-
•
V2069 Cyg and RX J0636 are instead found to possess a soft X-ray optically thick component at kT80 eV. This increases to 15 the current roster of soft X-ray IPs, confirming a relatively large () incidence.
-
•
A strong Kα Fe line at 6.4 keV is present in all sources likely originating at the WD surface from the reflection of X-rays from cold material.
-
•
The spectrum of IGR J0839 reveals an absorption edge at 0.76 keV from OVII. This increases to three the IPs were a warm absorber is found.
-
•
The WD masses of our sample are found between 0.74 and 0.96 , with an average mass , suggesting no striking difference with the whole CV population.
Acknowledgements.
This publication also makes use of data products from the Two Micron All Sky Survey, which is a joint project of the University of Massachusetts and the Infrared Processing and Analysis Center (California Institute of Technology), funded by NASA and National Science Foundation. FB and DdM acknowledge financial support from ASI under contract ASI/INAF I/009/10/0.References
- Aizu (1973) Aizu, K. 1973, Prog. Theor. Phys., 49, 1184
- Anzolin et al. (2008) Anzolin, G., de Martino, D., Bonnet-Bidaud, J.-M., et al. 2008, A&A, 489, 1243
- Anzolin et al. (2009) Anzolin, G., de Martino, D., Falanga, M., et al. 2009, A&A, 501, 1047
- Barlow et al. (2006) Barlow, E. J., Knigge, C., Bird, A. J., et al. 2006, MNRAS, 372, 224
- Barthelmy (2000) Barthelmy, S. 2000, in Proc. SPIE, Vol. 4140, X-ray and Gamma-Ray Instrumentation for Astronomy XI, ed. K. A. Flanagan & O. Siegmund, 50
- Beuermann (2004) Beuermann, K. 2004, in ASP Conf. Ser., Vol. 315, IAU Colloq. 190: Magnetic Cataclysmic Variables, ed. S. Vrielmann & M. Cropper, 187
- Bird et al. (2010) Bird, A. J., Malizia, A., Bazzano, A., et al. 2010, ApJS, 186, 1
- Bonnet-Bidaud et al. (2007) Bonnet-Bidaud, J. M., de Martino, D., Falanga, M., Mouchet, M., & Masetti, N. 2007, A&A, 473, 185
- Bonnet-Bidaud et al. (2009) Bonnet-Bidaud, J.-M., de Martino, D., & Mouchet, M. 2009, ATel, 1895
- Butters et al. (2009) Butters, O. W., Katajainen, S., Norton, A. J., Lehto, H. J., & Piirola, V. 2009, A&A, 496, 891
- Butters et al. (2008) Butters, O. W., Norton, A. J., Hakala, P. J., Mukai, K., & Barlow, E. 2008, A&A, 487, 271
- Cropper et al. (1999) Cropper, M., Wu, K., Ramsay, G., & Kocabiyik, A. 1999, MNRAS, 306, 684
- Cusumano et al. (2010) Cusumano, G., La Parola, V., Segreto, A., et al. 2010, A&A, 524, 64
- Dall’Osso et al. (2003) Dall’Osso, S., Israel, G., Stella, L., Possenti, A., & Perozzi, E. 2003, ApJ, 599, 485
- de Martino (2007) de Martino, D. 2007, AIPC, 924, 524
- de Martino et al. (2010) de Martino, D., Falanga, M., Bonnet-Bidaud, J.-M., et al. 2010, A&A, 515, A25
- de Martino et al. (2004) de Martino, D., Matt, G., Belloni, T., Haberl, F., & Mukai, K. 2004, A&A, 415, 1009
- de Martino et al. (2008) de Martino, D., Matt, G., Mukai, K., et al. 2008, A&A, 481, 149
- de Martino et al. (1995) de Martino, D., Mouchet, M., Bonnet-Bidaud, J.-M., et al. 1995, A&A, 298, 849
- den Herder et al. (2001) den Herder, J. W., Brinkman, A. C., Kahn, S. M., et al. 2001, A&A, 365, L7
- Diaz Trigo et al. (2006) Diaz Trigo, M., Parmar, A., Boirin, L., Mendez, M., & Kaastra, J. S. 2006, A&A, 445, 179
- Done & Magdziarz (1998) Done, C. & Magdziarz, P. 1998, MNRAS, 298, 737
- Evans et al. (2008) Evans, P., Beardmore, A., & Osborne, J. 2008, ATel, 1669
- Evans & Hellier (2007) Evans, P. A. & Hellier, C. 2007, ApJ, 663, 1277
- Fischer & Beuermann (2001) Fischer, A. & Beuermann, K. 2001, A&A, 373, 211
- Gänsicke et al. (2005) Gänsicke, B. T., Marsh, T. R., Edge, A., et al. 2005, MNRAS, 361, 141
- Garlick et al. (1994) Garlick, M. A., Rosen, S. R., Mittaz, J. P. D., Mason, K., & de Martino, D. 1994, MNRAS, 267, 1095
- Goldwurm et al. (2003) Goldwurm, A., David, P., Foschini, L., et al. 2003, A&A, 411, L223
- Hellier (1995) Hellier, C. 1995, in ASP Conf. Ser., Vol. 85, Magnetic Cataclysmic Variables, ed. D. A. H. Buckley & B. Warner, 185
- Hong et al. (2012) Hong, J., van der Berg, M., Grindlay, J., Servillat, M., & Zhao, P. 2012, ApJ, 746, 165
- Katajainen et al. (2007) Katajainen, S., Butters, O. W., Norton, A. J., Lehto, H. J., & Piirola, V. 2007, A&A, 475, 1011
- Knigge (2006) Knigge, C. 2006, MNRAS, 373, 484
- Knigge et al. (2011) Knigge, C., Baraffe, I., & Patterson, J. 2011, ApJS, 194, A28
- Lebrun et al. (2003) Lebrun, F., Leray, J. P., Lavocat, P., et al. 2003, A&A, 411, L141
- Mason et al. (2001) Mason, K. O., Breeveld, A., Much, R., et al. 2001, A&A, 365, L36
- Mauche (2002) Mauche, C. 2002, in ASP Conf. Ser., Vol. 261, The Physics of Cataclysmic Variables, ed. B. T. Gänsicke, K. Beuermann, & K. Reinsch, 113
- McDermott & Taam (1989) McDermott, P. & Taam, R. 1989, ApJ, 342, 1019
- Mukai et al. (1994) Mukai, K., Ishida, M., & Osborne, J. 1994, PASJ, 46, 87
- Mukai et al. (2001) Mukai, K., Smale, P., Stahle, K., Schlegel, E., & Wijnands, R. 2001, ApJ, 561, 938
- Nauenberg (1972) Nauenberg, M. 1972, ApJ, 175, 417
- Nichelli et al. (2009) Nichelli, E., Israel, G., Moretti, A., et al. 2009, ATel, 2354
- Norton et al. (2008) Norton, A. J., Butters, O., Parker, T., & Wynn, G. A. 2008, ApJ, 672, 524
- Norton et al. (1997) Norton, A. J., Hellier, C., Beardmore, A. P., et al. 1997, MNRAS, 289, 362
- Norton et al. (1992) Norton, A. J., McHardy, I. M., Lehto, H. J., & Watson, M. G. 1992, MNRAS, 258, 697
- Norton et al. (2004) Norton, A. J., Wynn, G. A., & Somerscales, R. V. 2004, ApJ, 614, 349
- Norton & Taylor (1996) Norton, A. J.and Beardmoree, A. P. & Taylor, P. 1996, MNRAS, 280, 937
- Parker et al. (2005) Parker, T. L., Norton, A. J., & Mukai, K. 2005, A&A, 439, 213
- Piirola et al. (1993) Piirola, V., Hakala, P., & Coyne, G. V. 1993, ApJ, 410, L107
- Potter et al. (1997) Potter, S. B., Cropper, M., Mason, K. O., Hough, J. H., & Bailey, J. A. 1997, MNRAS, 285, 82
- Potter et al. (2012) Potter, S. B., Romero-Colmenero, E., Kotze, M., et al. 2012, MNRASin press (arXiv:1111.5482)
- Pretorius (2009) Pretorius, M. 2009, MNRAS, 395, 386
- Revnivtsev et al. (2009) Revnivtsev, M., Sazonov, S., Churazov, E., et al. 2009, Nature, 458, 1142
- Revnivtsev et al. (2011) Revnivtsev, M., Sazonov, S., Forman, W., Churazov, E., & Sunyaev, R. 2011, MNRAS, 414, 495
- Revnivtsev et al. (2008) Revnivtsev, M., Sazonov, S., Krivonos, R., Ritter, H., & Sunyaev, R. 2008, A&A, 489, 1121
- Rosen et al. (1988) Rosen, S. R., Mason, K. O., & Cordova, F. A. 1988, MNRAS, 231, 549
- Sazonov et al. (2008) Sazonov, S., Revnivtsev, M., Burenin, R., et al. 2008, A&A, 487, 509
- Sazonov et al. (2006) Sazonov, S., Revnivtsev, M., Gilfanov, M., Churazov, E., & Sunyaev, R. 2006, A&A, 450, 117
- Scaringi et al. (2011) Scaringi, S., Connolly, S. Patterson, J., Thorstensen, J., et al. 2011, A&A, 530, A6
- Schwarz et al. (2007) Schwarz, R., Schwope, A., Staude, A., et al. 2007, A&A, 473
- Strüder et al. (2001) Strüder, L., Briel, U., Dennerl, K., et al. 2001, A&A, 365, L18
- Suleimanov et al. (2005) Suleimanov, V., Revnivtsev, M., & Ritter, H. 2005, A&A, 435, 191
- Thorstensen & Taylor (2001) Thorstensen, J. & Taylor, C. 2001, MNRAS, 326, 1235
- Turner et al. (2001) Turner, M. J. L., Abbey, A., Arnaud, M., et al. 2001, A&A, 365, L27
- Ubertini et al. (2003) Ubertini, P., Lebrun, F., Di Cocco, G., et al. 2003, A&A, 411, L131
- Warner (1995) Warner, B. 1995, Cataclysmic variable stars (Cambridge: Cambridge University Press)
- Wheatley (1995) Wheatley, P. J. 1995, MNRAS, 274, L51
- Woelk & Beuermann (1996) Woelk, U. & Beuermann, K. 1996, A&A, 306, 232
- Wu et al. (1994) Wu, K., Chanmugam, G., & Shaviv, G. 1994, ApJ, 426, 664
- Wynn & King (1992) Wynn, G. A. & King, A. R. 1992, MNRAS, 255, 83
- Yuasa et al. (2010) Yuasa, T., Nakazawa, K., Makishima, K., et al. 2010, A&A, 520, 25
- Zorotovic et al. (2011) Zorotovic, M., Schreiber, M., & Gänsicke, B. 2011, A&A, 536, A42