XMM-Newton observations of five INTEGRAL sources
located towards the Scutum Arm
Abstract
Results are presented for XMM-Newton observations of five hard X-ray sources discovered by INTEGRAL in the direction of the Scutum Arm. Each source received 20 ks of effective exposure time. We provide refined X-ray positions for all 5 targets enabling us to pinpoint the most likely counterpart in optical/infrared archives. Spectral and timing information (much of which are provided for the first time) allow us to give a firm classification for IGR J184620223 (catalog ) and to offer tentative classifications for the others. For IGR J184620223 (catalog ), we discovered a coherent pulsation period of 9971 s which we attribute to the spin of a neutron star in a highly-obscured ( cm-2) high-mass X-ray binary (HMXB). This makes IGR J184620223 (catalog ) the seventh supergiant fast X-ray transient (SFXT) candidate with a confirmed pulsation period. IGR J184570244 (catalog ) is a highly-absorbed ( cm-2) source in which the possible detection of an iron line suggests an active galactic nucleus (AGN) of type Sey-2 situated at . A periodic signal at 4.4 ks could be a quasi-periodic oscillation which would make IGR J184570244 (catalog ) one of a handful of AGN in which such features have been claimed, but a slowly-rotating neutron star in an HMXB can not be ruled out. IGR J184820049 (catalog ) represents a new obscured HMXB candidate with cm-2. We tentatively propose that IGR J185320416 (catalog ) is either an AGN or a pulsar in an HMXB system. The X-ray spectral properties of IGR J185380102 (catalog ) are consistent with the AGN classification that has been proposed for this source.
1 Introduction
Surveys by INTEGRAL have enabled the discovery of hundreds of new high-energy sources (e.g., Bird et al., 2010; Krivonos et al., 2010). While INTEGRAL has proven adept at finding new sources, the position error radii are on the order of a few arcminutes. These are clearly too large to permit the identification of a single counterpart in the optical and infrared bands. Establishing the nature of the optical/IR counterpart is a crucial element in helping to categorize an INTEGRAL Gamma-Ray source (IGR)111a comprehensive list of IGRs and their properties can be found at http://irfu.cea.fr/Sap/IGR-Sources into one of the many groups of high-energy emitters.

Hence, the classification of IGRs depends on subsequent observations with X-ray focusing telescopes which provide position accuracies of a few arcseconds (e.g., Rodriguez et al., 2010). What these follow-up observations have shown is that some IGRs belong to a previously-rare subclass of high-mass X-ray binary (HMXB) called supergiant X-ray binaries (SGXBs: e.g., Walter et al., 2006, and references therein). Of the 50 IGR HMXBs, 26 of them are SGXBs representing new additions to a subclass that once contained less than a dozen members (Liu et al., 2000): the most prominent examples of which are Vela X-1 (catalog ) and GX 3012. A common characteristic of SGXBs is their high intrinsic column ( cm-2) which suggests that the compact accretor is embedded in the dense winds shed by its supergiant companion star. The most extreme case is IGR J163184848 (catalog ) with the largest of any X-ray source known in the Galaxy ( cm-2, Matt & Guainazzi, 2003). The typical value of these systems is a few cm-2.
The spatial distribution of obscured HMXBs in the inner Milky Way appears to be asymmetric about the Galactic Center (GC) (Bodaghee et al., 2007). In the inner quadrant of the Galactic Plane (Fig. 1), there are 37 HMXBs (with and without measurements) at positive longitudes, and an equivalent number (34) at negative longitudes. Among HMXBs whose values are known to be less than cm-2, the left-right distribution is also symmetrical about the GC: 21 vs. 18. Thus, the asymmetry is only evident for the most obscured systems ( cm-2): there are around half as many obscured HMXBs (7) at positive longitudes as there are at negative longitudes (13). On the other hand, we have an incomplete picture of the obscured HMXB population in the direction of the Scutum Arm. There are unclassified IGRs (including HMXB candidates) in this region. If some of these are shown to be obscured HMXBs, then it will level the Galactic distribution, which might indicate that the asymmetry was the result of an observational bias rather than being due to, e.g., a possible evolutionary difference between the hard X-ray populations of the arms.
| Target | Spacecraft Rev. | Obs. ID | Start Time (UTC) | End Time (UTC) | Eff. Exp. (ks) |
|---|---|---|---|---|---|
| IGR J184570244 (catalog ) | 2075 | 0651680201 | 2011-04-09T05:18:17 | 2011-04-09T12:41:58 | 25.036 |
| IGR J184620223 (catalog ) | 2080 | 0651680301 | 2011-04-18T08:52:18 | 2011-04-18T17:44:32 | 31.937 |
| IGR J184820049 (catalog ) | 2079 | 0651680401 | 2011-04-16T18:39:11 | 2011-04-17T01:06:24 | 23.236 |
| IGR J185320416 (catalog ) | 2077 | 0651680501 | 2011-04-12T12:10:49 | 2011-04-12T17:56:41 | 20.752 |
| IGR J185380102 (catalog ) | 2081 | 0651680101 | 2011-04-20T14:44:35 | 2011-04-20T21:48:30 | 25.437 |
In order to help complete, at least partially, the sample of obscured HMXBs, we obtained XMM-Newton observations of five unclassified (or tentatively classified) IGRs that are located in the direction of the Scutum Arm. Their persistent emission above 20 keV, lack of known X-ray counterpart below 10 keV, and location close to the Galactic Plane make them good candidates for being obscured HMXBs. We present our observations and analysis methods in Section 2. Results for individual sources are discussed and summarized in Sections 3–4.
2 Observations & Analysis
Our target list consists of five hard X-ray sources located towards the Scutum Arm. These sources were observed by the XMM-Newton (Jansen et al., 2001; Strüder et al., 2001; Turner et al., 2001) telescope during April, 2011, for approximately 30 ks each (Observation IDs: 0651680101–0651680501; PI: Bodaghee). Table 1 provides the observation logs. All data reduction and analysis steps were performed using HEASOFT 6.11 and the Science Analysis System (SAS) 11.0.0.
| Source Name | R.A. | Dec. | counterpart candidate | offset (′′) | ||
|---|---|---|---|---|---|---|
| IGR J184570244 (catalog ) | 34.682 | 2.514 | 2MASS J184540390242088 (catalog ) | 2.7 | ||
| IGR J184620223 (catalog ) | 30.223 | 0.079 | 2MASS J184612790222261 (catalog ) | 3.4 | ||
| IGR J184820049 (catalog ) | 33.275 | 1.070 | 2MASS J184815400047332 (catalog ) | 2.0 | ||
| IGR J185320416 (catalog ) | 36.965 | 1.553 | 2MASS J185316020417481 (catalog ) | 2.9 | ||
| IGR J185380102 (catalog ) | 32.275 | 1.002 | 2MASS J185348470102295 (catalog ) | 1.6 |
We reprocessed the MOS and pn events files using emproc and epproc, respectively. To identify epochs with a high particle background, we used evselect to create single-event (i.e., PATTERN0) light curves above 10 keV for MOS1/2 and between 10 and 12 keV for pn which covered the full field of view (FOV) of each instrument. For the spectral analysis, we excluded epochs in which the particle background was higher than 1 count per second (cps). The good time intervals (GTIs) that remained were then used in evselect to produce filtered event files for each instrument. Time stamps from the satellite reference frame were converted to that of the Solar System’s barycenter with the barycen tool.
From these cleaned event lists, we generated images for MOS1/2 and for pn over the full FOV and covering the full spectrum of each instrument. The source extraction region consisted of a circle with a radius of 25′′ ( 500 pixels in the unbinned image) centered on the brightest pixel. This radius was chosen to be wide enough to encompass most of the source photons (this corresponds to an encircled energy fraction of 80% for the PSF from MOS and pn according to the SAS user’s manual222http://xmm.esac.esa.int/external/xmm_user_support/documentation/uhb_2.5/node17.html). However, since some of our targets are located near the edge of a CCD, we also wanted this radius to be restrictive enough so as to avoid collecting photons from an adjacent CCD. For the background extraction region, we used a circle of radius equal to 70′′ (1400 pixels) from a source-free region located on the same CCD as the target source. Whenever possible, this background region was chosen to be more than 1′ away from the target source, at an equivalent off-axis angle as the source region in MOS, or centered at the same RAW_Y pixel in pn (i.e., the center of the background region is shifted horizontally in the detector space with respect to the center of the source region).
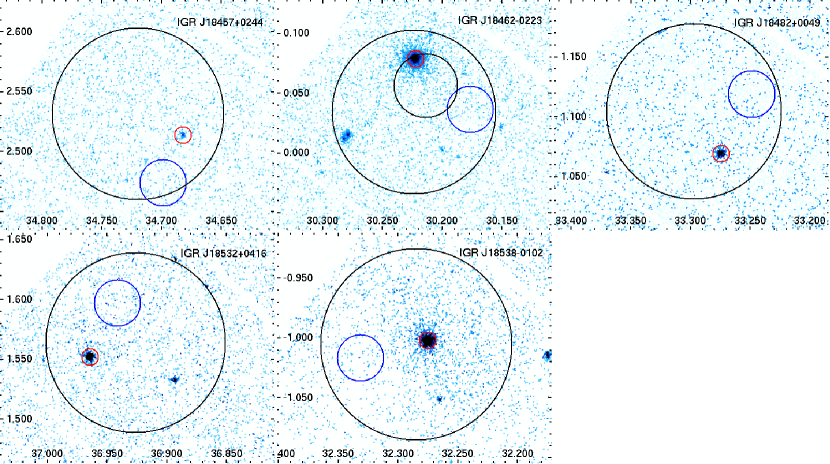
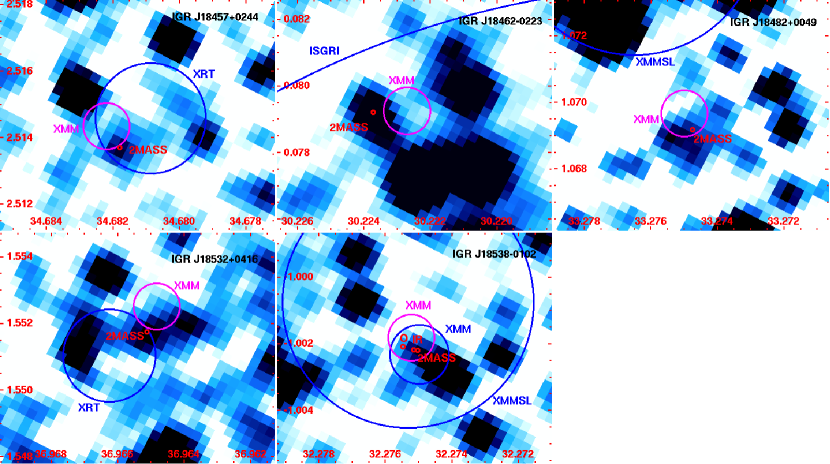
Figure 2 presents the MOS1 images of the fields centered on the INTEGRAL-ISGRI positions of the five targets from Bird et al. (2010). We ran edetect on the cleaned event files of each instrument and produced lists of detected sources in several energy bands. The output list from edetect includes a dozen or more source detections, a few of which are located inside the 90%-confidence ISGRI error circle. Spectra were extracted for all sources detected inside the most accurate ISGRI position available: the radius of the error circle is 16 for IGR J184620223 (catalog ) (Grebenev & Sunyaev, 2010), and 4′ for the others (Bird et al., 2010). Within each ISGRI circle, we identified a single XMM-Newton counterpart (which happened to be the brightest one) whose spectrum was consistent with the source being an IGR, i.e., a hard power law (0–2) with some photoelectric absorption ( cm-2). We were also able to compare the spectral parameters (and coordinates) with those from previous soft X-ray observations (Section 3).
Once the correct X-ray counterpart was identified for each IGR source, its coordinates from MOS1/2 and pn were averaged and this position is reported in Table 2 (equinox 2000.0 is used throughout this work). According to the latest calibration documents (XMM-SOC-CAL-TN-0018333http://xmm2.esac.esa.int/external/xmm_sw_cal/calib), the position uncertainty for EPIC is 15 (at 68% confidence) which is dominated by systematics. Thus, we have adopted a value of 25 (at 90% confidence) for the source position uncertainty.
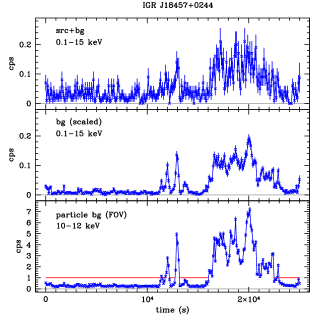
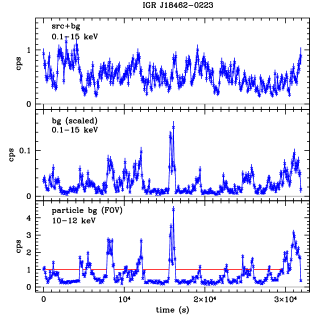
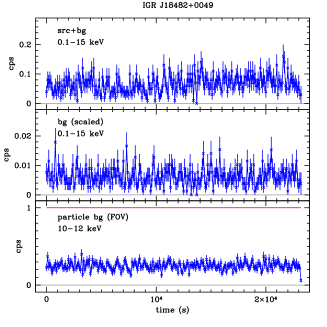
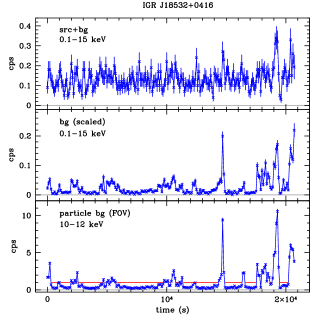
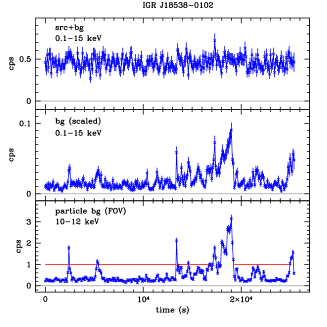
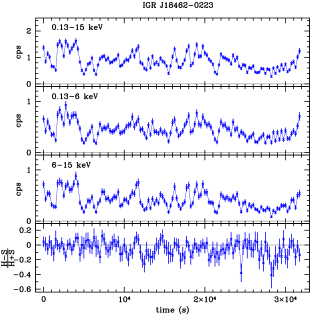
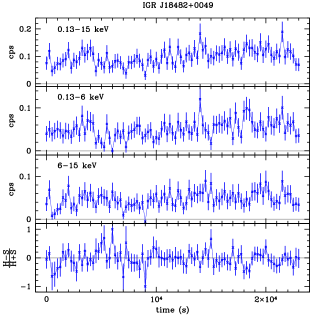
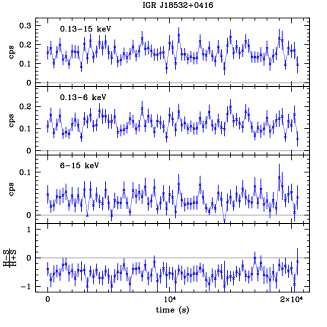
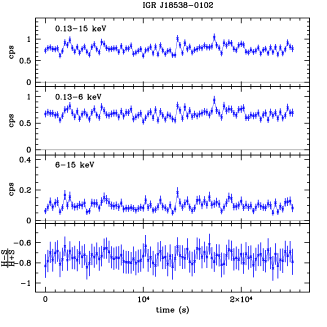
Figure 3 presents the light curve for the particle background, as well as for the source and background extraction regions as defined above. Light curves and spectra were created for the source and background regions in 0.1–10 keV (PATTERN12) for MOS1/2 (5 s resolution), and in 0.13–15 keV (PATTERN4) for pn (0.1 s resolution). We accounted for the difference in the size of the extraction areas by running epiclccorr on the light curves (which subtracted this scaled background count rate from the source count rate while correcting for exposure, PSF, and vignetting effects), and by running backscale on the spectra. Spectral RMF and ARF files were generated using rmfgen and arfgen, respectively. These files were grouped with the source and background spectral files by employing specgroup with a minimum of 20 counts per bin and a maximum oversampling factor of 3. Figures 4 and 5 present the light curves and spectra, respectively, of the five sources in our study. We searched for periodic signals in the raw (i.e., not corrected for the background) source light curves from pn using both efsearch and the fast algorithm for Lomb-Scargle periodograms developed by Press & Rybicki (1989) with error analysis from Horne & Baliunas (1986). Spectral fits employed the abundances of Wilms et al. (2000) and the photo-ionization cross sections of Balucinska-Church & McCammon (1992). In the following section, we will discuss the results of each source in detail.

3 Results & Discussion
3.1 IGR J184570244
Soon after the discovery of this source by Bird et al. (2010), it was followed up by a Swift observation in which a soft X-ray counterpart was detected at the 4- level in the 0.3–10-keV band (Landi et al., 2010). The X-ray position that we obtain for IGR J184570244 (catalog ) is R.A. and Dec. . Our XMM-Newton position is 4.9′′ away from the Swift position listed in Landi et al. (2010), but the latter has a reported uncertainty radius of 6′′ so the positions are statistically compatible. The nearest infrared source in the 2MASS catalog (Fig. 6), 2MASS J184540390242088, is 2.8′′ away from the XMM-Newton position (i.e., just outside the 90%-confidence radius of 25), and it has , , and -band magnitudes of 16.2, 15.30.1, and 14.60.1, respectively (Skrutskie et al., 2006). There are no catalogued objects from other wavelengths inside the XMM-Newton error circle.
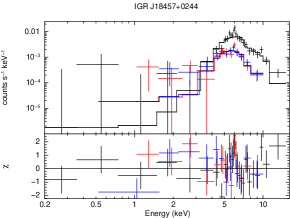
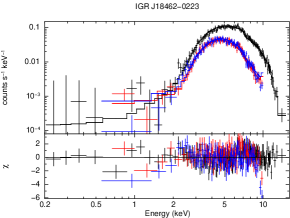

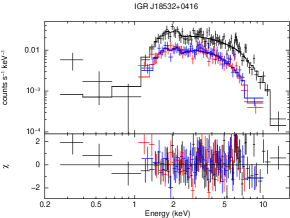
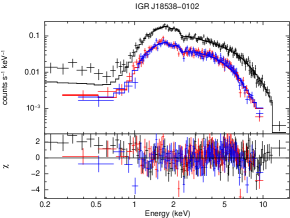
Figure 4 presents the pn light curve for IGR J184570244 (catalog ). Searching for periodicities in this light curve uncovers a potential signal at a period of s (8 bins per trial period) with (6- significance, not corrected for the number of trials) and a pulse fraction () of 32%7%. Large wings surround the main peak due to the long period of this potential signal which means that only 5 cycles are contained within the full 25-ks observation. The distribution and folded light curve are presented in Fig. 7. This signal is only seen with efsearch, and not with the Lomb-Scargle periodogram nor in the power spectrum. Using the Leahy-normalized power spectrum (Leahy et al., 1983), we determined a 90% confidence upper limit of 25.33 on the Leahy Power (van der Klis, 1989) which converts to an upper limit of 14% on the fractional r.m.s. expected for a periodic signal due to noise (i.e., less than the pulse fraction that we measured).
| Source Name | Xspec Model | or | or | Norm. | /dof | ||||||
|---|---|---|---|---|---|---|---|---|---|---|---|
| cm-2 | keV | keV | keV | eV | photons cm-2 s-1 | erg cm-2 s-1 | |||||
| IGR J184570244 | c*phabs*pow | 2.30.7 | 7.70.5 | 1.13/49 | |||||||
| c*phabs*(pow+gauss) | 1.90.7 | 300150 | 4.10.2 | 0.85/46 | |||||||
| c*phabs*(cutoffpl+gauss) | 0.01 | 310160 | 43 | 0.87/45 | |||||||
| c*phabs*(bbodyrad+gauss) | 310160 | 1.40.2 | 0.92/46 | ||||||||
| c*phabs*(comptt+gauss) | 2.8 | 115 | 300150 | 2.20.3 | 0.89/44 | ||||||
| IGR J184620223 | c*phabs*pow | 1.130.03 | 281 | 1.50.1 | 36.50.7 | 1.32/337 | |||||
| c*phabs*(pow+gauss) | 1.130.03 | 281 | 1.50.1 | 7032 | 155 | 27.70.6 | 1.25/334 | ||||
| c*phabs*(cutoffpl+gauss) | 1.130.03 | 212 | 0.80.6 | 6.410.05 | 1610 | 1.14/333 | |||||
| c*phabs*(bbodyrad+gauss) | 1.130.03 | 191 | 14.90.3 | 1.16/334 | |||||||
| c*phabs*(comptt+gauss) | 1.130.03 | 1.7 | 229 | 10.30.5 | 1614 | 1.15/332 | |||||
| IGR J184820049 | c*phabs*pow | 445 | 2.00.3 | 82 | 1.01/108 | ||||||
| c*phabs*bbodyrad | 2.40.4 | 1.05/108 | |||||||||
| IGR J185320416 | c*phabs*pow | 1.160.07 | 1.40.1 | 1.80.1 | 1.05/166 | ||||||
| c*phabs*(pow+gauss) | 1.160.07 | 3.40.4 | 1.40.1 | 1.80.1 | 0.94/163 | ||||||
| c*phabs*(cutoffpl+gauss) | 1.160.07 | 3.10.6 | 6 | 25090 | 1.70.2 | 0.94/162 | |||||
| c*phabs*(bbodyrad+gauss) | 1.160.07 | 1.20.2 | 1.530.08 | 1.20.1 | 1.23/163 | ||||||
| c*phabs*(comptt+gauss) | 0.8 | 294 | 270110 | 6.5 | 0.94/161 | ||||||
| IGR J185380102 | c*phabs*pow | 1.980.08 | 1.570.04 | 6.30.1 | 1.33/359 | ||||||
| c*phabs*cutoffpl | 1.70.1 | 1.10.2 | 5.60.8 | 1.28/358 |
Note. — Errors are quoted at 90% confidence. is an instrumental cross-calibration coefficient which is fixed at 1 for pn and variable for MOS. In the Xspec formalism: phabs photoelectric absorption; pow power law; cutoffpl cutoff power law; bbodyrad radial blackbody; comptt Compton thermalization; and gauss Gaussian.
We note that aperiodic variability on a 4-ks timescale (i.e., a large fraction of the observation duration) would also lead to multiple wings surrounding a central peak in the distribution, so this can not be excluded. Thus, an intriguing possibility is that the weak periodicity at 4.4 ks is a quasi-periodic oscillation (QPO) related to the motion of material along the innermost stable orbit of an accretion disk. Such QPOs are a common feature of the power spectrum of black hole binaries. They have been confirmed in one AGN thus far (RE J1034+396 (catalog )) where the peak frequency of the QPO is Hz (i.e., 3.7-ks periodicity) (Gierliński et al., 2008), and they have been proposed in other AGN as well (e.g., Espaillat et al., 2008; Gupta et al., 2009; Lachowicz et al., 2009). These frequencies are similar in scale to the 4.4-ks periodicity that we see in IGR J184570244 (catalog ).
A power law fit to the X-ray spectrum (Fig. 5) yields a column density ( cm-2) that is larger than that expected along the line of sight (Kalberla et al., 2005), which suggests that it is intrinsic to the system, and a steep photon index ( 2.30.7). These parameters are in good agreement with those from Swift-XRT (Landi et al., 2010), despite the fact that our observed (i.e., not corrected for absorption) 0.5–10-keV flux is erg cm-2 s-1 ( erg s-1), i.e., lower than that of the 2–10-keV flux observed with XRT. The quality of the fit is good (/dof 1.13/49), but a few residuals around 6 keV hint at an iron fluorescence line. Adding a Gaussian to the model reduces the /dof to 0.85/46. The line energy is keV with an equivalent width () of 300150 eV. A good fit (/dof 0.92/46) is also obtained with an absorbed blackbody model that includes a Gaussian profile for the possible iron line. In this case, the blackbody temperature is keV, and cm-2. Modeling the spectrum with a cutoff power law or a thermal Comptonization model (comptt in Xspec) returned upper limits on the spectral parameters. These results are summarized in Table 3.
Assuming that the rest energy of the iron line is 6.41 keV, this would place IGR J184570244 (catalog ) at a redshift of , suggesting an active galactic nucleus (AGN) most likely of the Seyfert-2 class given its large absorbing column. The corresponding (unabsorbed) X-ray luminosity in the 0.5–10-keV band is erg s-1, assuming km s-1 Mpc-1 and a flat cosmology. We point out that other than the high value (which can also be found among obscured X-ray pulsars), the main evidence supporting the AGN designation is the iron line energy, and this detection is marginal since only 2 spectral bins in pn show significant deviations () from the continuum (1 bin for each MOS detector). On the other hand, if the potential periodic modulation can be reproduced in other observations, and if the signal were found to be coherent, it would point instead to a neutron star spin period, and the AGN would no longer be a viable explanation.
In any case, additional long-duration observations are needed to elucidate the nature of IGR J184570244 (catalog ).
3.2 IGR J184620223
Grebenev et al. (2007) discovered IGR J184620223 (catalog ) during a flare that lasted a few hours. The source was actually in outburst a year earlier but this flare had gone unnoticed until reexamination of archival data (Grebenev & Sunyaev, 2010). A day after its discovery, it could no longer be detected. The source erupted again in 2010, which led Grebenev & Sunyaev (2010) to suggest that the source belonged to a newly-recognized class of SGXB: a supergiant fast X-ray transient (SFXT). These are HMXBs with early-type supergiant donors feeding an X-ray source that, unlike in “classical” SGXBs, features huge variability in its emission (luminosity swings of – are typical).

For IGR J184620223 (catalog ), we obtain with XMM-Newton a position of R.A. and Dec. which is from (and still compatible with) the ISGRI position of Grebenev & Sunyaev (2010) which has an error radius of . The 2MASS image of the field (Fig. 6) shows that the nearest catalogued infrared source is located outside the XMM-Newton error radius ( from the EPIC position): 2MASS J184612790222261 (catalog ) with magnitudes of 14.50.1, 13.80.1, and 12.7, respectively, in the , , and bands (Skrutskie et al., 2006). This object is also listed as USNO B-1.0 0876-0579765 (catalog ) (Monet et al., 2003), DENIS J184612.8022226 (catalog ) (The DENIS Consortium, 2005), and GLIMPSE G030.223100.0791 (catalog ) (Benjamin et al., 2003). No other objects from other wavelengths are located inside the XMM-Newton error circle.
In the X-ray spectrum of IGR J184620223 (catalog ) shown in Fig. 5, we detect a large column density ( (2–3) cm-2) and an iron line at keV (7032 eV). The addition of a Gaussian to the power law (to account for the line) leads to a small improvement in the quality of the fit from /dof 1.32/337 to 1.25/334. The best fit (/dof 1.14/333) is obtained with the addition of a cutoff at keV. The resulting photon index and column density are and cm-2, respectively. A blackbody (bbodyrad) also provides a good fit to the X-ray spectra (/dof 1.16/334). For a Compton thermalization model (compTT), the plasma temperature and energy of the seed photons could not be constrained.
The spectral shape is reminiscent of other wind-accreting X-ray binaries discovered by INTEGRAL, particularly that of the obscured SGXB pulsar in the Norma Arm IGR J163934643 (catalog ) (Bodaghee et al., 2006): both sources have large values, hard power law continua, iron line(s), and low-energy cutoffs. It is important to note that the cutoff energy in IGR J184620223 (catalog ) is below 20 keV. This cutoff is required since the photon index in the ISGRI band (20–60 keV) is (Grebenev & Sunyaev, 2010), i.e., steeper than the slope of 1.50.1 that we measure for an absorbed power law between 0.5 and 10 keV. In HMXB systems, such low cutoff energies are typical of accreting neutron stars (Nagase, 1989).
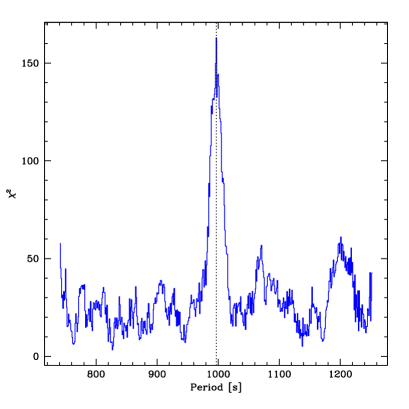
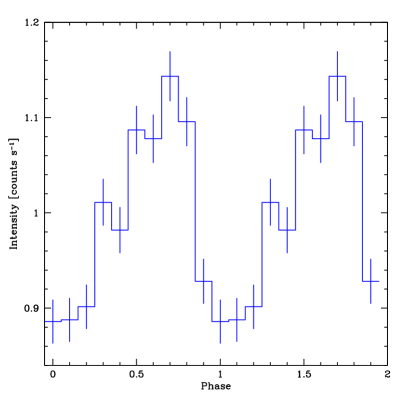
Therefore, we searched for periodic modulations in the pn light curve of IGR J184620223 (catalog ) and we found a coherent pulsation at a period of 9971 s with for 10 bins per trial period (12 significance, not corrected for the number of trials). The pulse profile folded on a period of 997 s and beginning at MJD 55669.00808(1) is shown in Fig. 8. The pulse fraction is 12%2%. Thus, the compact object hosted by IGR J184620223 (catalog ) is an accreting neutron star whose magnetic and spin axes are misaligned.
The SFXT designation for IGR J184620223 (catalog ) rests on its sporadic detection history in the hard X-rays (Grebenev & Sunyaev, 2010). In our 30-ks long and continuous observation (Fig. 4), we find no evidence of the large variability associated with this class of objects. The dynamic range for the 0.13–15-keV flux is an order of magnitude or less. This is more typical of persistently-emitting SGXB systems. Assuming that the source resides within the Scutum Arm whose tangent is 7 kpc away (e.g., Russeil, 2003), its unabsorbed flux (0.5–10 keV) of erg cm-2 s-1 converts to a luminosity of around erg s-1. This is a typical luminosity for an SFXT in the active state (e.g., Romano et al., 2011), but it is an order of a magnitude lower than in other persistently-emitting SGXBs (e.g., Walter et al., 2006), unless the source were located more than 7 kpc from us.
Overall, the timing and spectral characteristics of IGR J184620223 (catalog ) suggest that this system is an obscured (and probably distant) SGXB pulsar, and one of the few examples of a highly-obscured HMXB in the direction of the Scutum Arm. The source could represent an intermediate SGXB-SFXT system like IGR J164794514 (catalog ), which would make IGR J184620223 (catalog ) the seventh (out of 20 known SFXT candidates) to have a measured spin period.
3.3 IGR J184820049
Our XMM-Newton observation provides us with the most accurate X-ray position for IGR J184820049 (catalog ): R.A. , and Dec. . This position is compatible with the discovery position of ISGRI (Bird et al., 2010) which is away and has an error radius of . Stephen et al. (2010) proposed an association of IGR J184820049 (catalog ) with an object from the XMM-Newton Slew Survey (XMMSL: Saxton et al., 2008) that is located from the ISGRI position and has a 90%-confidence radius of . However, our XMM-Newton position is 21′′ from the XMMSL source which is henceforth ruled out. Only one object in the 2MASS catalog is consistent with the XMM-Newton position: 2MASS J184815400047332 (catalog ), which is located from the center of the XMM-Newton error circle and has magnitudes of 15.8, 14.0, and 13.90.1, respectively, in the , , and bands (Skrutskie et al., 2006). This source is also listed as GLIMPSE G033.2747+01.0692 (catalog ) (Benjamin et al., 2003). There are no other objects from other wavelengths inside the XMM-Newton error circle.
An absorbed power law is sufficient to model the X-ray spectrum of IGR J184820049 (catalog ) (Fig 5). The column density is large ( cm-2) and is well in excess of the cumulative line-of-sight absorption value (Kalberla et al., 2005), and so favors an interpretation in which most of the obscuring material is intrinsic to the system. The photon index is 2.00.3 with an unabsorbed flux of erg cm-2 s-1 in the 0.5–10-keV band ( erg s-1). This simple model provides an excellent fit (/dof 1.01/108). An absorbed blackbody with a temperature of keV also provides a good fit (/dof 1.05/108), but residuals appear above 10 keV. More complicated spectral models (i.e., cutoff power laws, and Comptonization) lead to unconstrained spectral parameters. We tested for the presence of a soft excess by adding a blackbody component to the absorbed power law. The addition of this component with a free temperature did not improve the fit, but holding the temperature at 0.1 keV led to a marginal improvement over the absorbed power law (/dof 0.99/107; F-test probability of 5%) with the other spectral parameters ( and ) remaining consistent.
Given the shape of the spectral continuum and the large absorbing column, its location close to the Galactic Plane, and its persistent emission in the hard X-rays, we conclude that IGR J184820049 (catalog ) is most likely a new obscured HMXB in the Scutum Arm. Many sources in this class feature pulsation periods in the X-rays, but we did not find conclusive evidence for a periodic signal between 1 s and 5000 s in the the light curve of IGR J184820049 (catalog ). Confirmation of the HMXB nature of IGR J184820049 (catalog ) must await spectral analysis of the candidate optical/IR counterpart proposed here.
3.4 IGR J185320416
Bird et al. (2010) discovered IGR J185320416 (catalog ), and the source was followed up by Swift-XRT which provided a refined X-ray position (Fiocchi et al., 2011). The position that we obtain from our XMM-Newton observation is R.A. , and Dec. . Figure 6 shows that this position is 73 away from (but still statistically compatible with) the location of XRT Source #2 in Fiocchi et al. (2011). The nearest potential counterpart across all wavelengths is 2MASS J185316020417481 (catalog ) which is located away. It has magnitudes of 16.5, 15.20.1, and 13.90.1 in the , , and bands, respectively (Skrutskie et al., 2006).
A power law ( 1.40.1) with moderate absorption ( cm-2) provides a good fit to the source spectrum (/dof 1.05/166). Residuals can be seen near 6 keV (Fig. 5) so we included a Gaussian at keV ( eV) which yields a fit with /dof 0.94/163. This suggests a redshifted iron line source at . The unabsorbed flux (0.5–10 keV) is erg cm-2 s-1 which converts to a luminosity of erg s-1. The implied (unabsorbed) luminosity at would be erg s-1 ( km s-1 Mpc-1). Using a cutoff power law or a Compton thermalization model gave fits with acceptable values but left important parameters unconstrained (e.g., cutoff energy and plasma temperature). A blackbody model shows residuals at low and high energies and provides a poor fit overall.
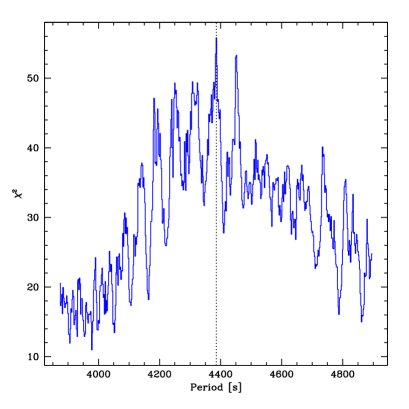
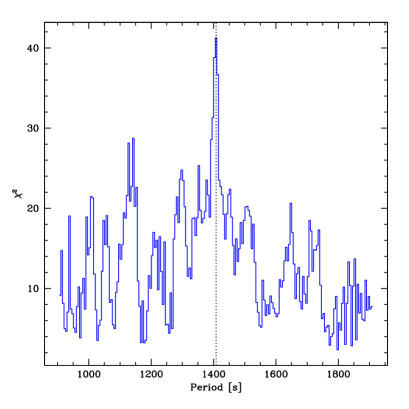
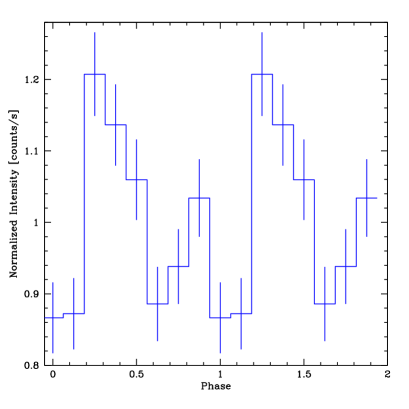
The light curve for IGR J185320416 (catalog ) is presented in Fig. 4. The source is soft with a hardness ratio that is negative during most of the observation. The distribution for the pn light curve (Fig. 9) contains a weak potential period at 1408 s ( for 8 bins per trial, i.e., 5- significance, not corrected for the number of trials). This candidate signal is not present in the Lomb-Scargle periodogram nor in the power spectrum. If this periodic signal is real and coherent, it would suggest an accreting neutron star in an HMXB. On the other hand, if the iron line is real, then it would invalidate the pulsar hypothesis (ascribing the candidate signal to chance or to aperiodic variability on a 1-ks timescale) and would suggest either a redshifted line from material in a low-inclination disk around a black hole in an X-ray binary (e.g., Fabian et al., 1989; van der Woerd et al., 1989), or a source located at a cosmological distance (i.e., an AGN). Just as with IGR J184570244 (catalog ), if both the iron line and modulation are real, then the latter could be the signature of a low-frequency QPO from an AGN. In other words, we can not firmly establish the nature of IGR J185320416 (catalog ) because of the low signal-to-noise ratio of both the iron line and the periodicity. Confirmation (or refutation) of either of these observables will require additional observations.
3.5 IGR J185380102
IGR J185380102 (catalog ) was listed as a new source in Bird et al. (2010). Stephen et al. (2010) noted the positional association with G 32.10.9 (catalog ) (Folgheraiter et al., 1997), a candidate supernova remnant (SNR) located from the ISGRI position. Given that the spectrum of the IGR source is harder and more absorbed than that of the SNR, Stephen et al. (2010) concluded that IGR J185380102 (catalog ) is probably a distant Galactic source or an extragalactic source, with only a coincidental association with G 32.10.9 (catalog ). Subsequently, an archival XMM-Newton observation of the field which contained the source was reanalyzed by Halpern & Gotthelf (2010) who found a persistent source at the following coordinates: R.A. , and Dec. . This source is also listed as 2XMM J185348.4010229 (catalog ) (Watson et al., 2009). Inside its error circle of , there is a single catalogued infrared source, 2MASS J185348470102295 (catalog ), which has magnitudes of 14.2, 14.00.1, and 12.50.1, respectively, in the , , and bands (Skrutskie et al., 2006). Among multiple optical counterpart candidates present within the XMM-Newton error circle, Lutovinov et al. (2012) identified a faint source whose spectrum shows a broad H line corresponding to a Sey-1 AGN at .
Our X-ray position for IGR J185380102 (catalog ) is R.A. , and Dec. . This is and away from, but still compatible with, the XMM-Newton positions of Halpern & Gotthelf (2010) and Malizia et al. (2010), respectively. Compared to these previously-reported XMM-Newton positions, our position is closer ( away) to the optical counterpart (Sey-1) identified by Lutovinov et al. (2012), and it remains compatible with the 2MASS source which is located away, the optical/IR counterpart ( offset) listed in Halpern & Gotthelf (2010), and with USNO-B1.0 08890406090 (catalog ) (Monet et al., 2003). With a uncertainty radius (Saxton et al., 2008), the position of the XMMSL source listed in Stephen et al. (2010) encompasses our XMM-Newton error circle (Fig. 6).
The X-ray spectrum of the source (Fig. 5) can be adequately described (/dof 1.33/359) by a power law with moderate absorption: cm-2. This is slightly larger than the measured by Halpern & Gotthelf (2010) and by Malizia et al. (2010), but the photon index ( 1.570.04) and unabsorbed 0.5–10-keV flux ( erg cm-2 s-1) are in agreement. Adding a cutoff at keV leads to a small improvement in the fit (/dof 1.28/358). Replacing the power law with a radial blackbody or a thermal Comptonization model leads to large residuals and poor fits.
No periodic signal could be found in the 1–5000-s range in the pn light curve of IGR J185380102 (catalog ). The photon index that we measured is consistent with the AGN classification proposed by Lutovinov et al. (2012), and the column density is larger than the cumulative line-of-sight value indicating a distant or extragalactic source.
4 Summary & Conclusions
In this work, we have analyzed XMM-Newton observations of five unclassified hard X-ray sources located towards the Scutum Arm. Refined X-ray positions, soft X-ray light curves, and spectral energy distributions have been derived for all five targets (Tables 2–3).
Our results indicate that IGR J184620223 (catalog ) and IGR J184820049 (catalog ) are probably new heavily-absorbed ( cm-2) high-mass X-ray binaries (HMXBs). The former is a slow X-ray pulsar ( 9971 s) in a supergiant fast X-ray transient (SFXT) system. This makes IGR J184620223 (catalog ) the seventh SFXT (in a class composed of 20 members) to have confirmed X-ray pulsations, providing a useful laboratory to test SFXT emission mechanisms which assume highly-magnetized ( G) neutron stars (e.g., Grebenev & Sunyaev, 2007; Bozzo et al., 2008). These two additional systems represent a 40% increase in the number of known obscured HMXBs in this region (Fig. 1), helping to reduce (somewhat) the asymmetry that we continue to observe between the large number of obscured HMXB systems found towards the Norma Arm compared with the low number found in the direction of the Scutum Arm (Bodaghee et al., 2007).
We can not conclusively determine the nature of the three other targets in our sample, IGR J184570244 (catalog ), IGR J185320416 (catalog ), and IGR J185380102 (catalog ). We propose that IGR J184570244 (catalog ) and IGR J185320416 (catalog ) are probably active galactic nuclei (AGN) viewed through the plane of the Milky Way, but Galactic X-ray binaries can not be ruled out. For IGR J185380102 (catalog ), the spectral parameters (photon index and column density) are consistent with an AGN interpretation.
Confirmation of the classifications for all sources in this study (see Table 4) will require further observations of the optical/infrared counterparts which we propose here.
| Source Name | Classification |
|---|---|
| IGR J184570244 (catalog ) | probable AGN, HMXB possible |
| IGR J184620223 (catalog ) | absorbed SFXT pulsar |
| IGR J184820049 (catalog ) | absorbed HMXB |
| IGR J185320416 (catalog ) | AGN? HMXB? |
| IGR J185380102 (catalog ) | probable Sey-1 |
References
- Balucinska-Church & McCammon (1992) Balucinska-Church, M., & McCammon, D. 1992, ApJ, 400, 699
- Benjamin et al. (2003) Benjamin, R. A., et al. 2003, PASP, 115, 953
- Bird et al. (2010) Bird, A. J., et al. 2010, ApJS, 186, 1
- Bodaghee et al. (2006) Bodaghee, A., Walter, R., Zurita Heras, J. A., Bird, A. J., Courvoisier, T. J.-L., Malizia, A., Terrier, R., & Ubertini, P. 2006, A&A, 447, 1027
- Bodaghee et al. (2007) Bodaghee, A., et al. 2007, A&A, 467, 585
- Bozzo et al. (2008) Bozzo, E., Falanga, M., & Stella, L. 2008, ApJ, 683, 1031
- Dickey & Lockman (1990) Dickey, J. M., & Lockman, F. J. 1990, ARA&A, 28, 215
- Espaillat et al. (2008) Espaillat, C., Bregman, J., Hughes, P., & Lloyd-Davies, E. 2008, ApJ, 679, 182
- Fabian et al. (1989) Fabian, A. C., Rees, M. J., Stella, L., & White, N. E. 1989, MNRAS, 238, 729
- Fiocchi et al. (2011) Fiocchi, M., Landi, R., Bassani, L., Bazzano, A., Bird, A. J., Gehrels, & Kennea, J. A. 2011, The Astronomer’s Telegram, 3256, 1
- Folgheraiter et al. (1997) Folgheraiter, E. L., Warwick, R. S., Watson, M. G., & Koyama, K. 1997, MNRAS, 292, 365
- Gierliński et al. (2008) Gierliński, M., Middleton, M., Ward, M., & Done, C. 2008, Nature, 455, 369
- Grebenev et al. (2007) Grebenev, S. A., Revnivtsev, M. G., & Sunyaev, R. A. 2007, The Astronomer’s Telegram, 1319, 1
- Grebenev & Sunyaev (2007) Grebenev, S. A., & Sunyaev, R. A. 2007, Astronomy Letters, 33, 149
- Grebenev & Sunyaev (2010) —. 2010, Astronomy Letters, 36, 533
- Gupta et al. (2009) Gupta, A. C., Srivastava, A. K., & Wiita, P. J. 2009, ApJ, 690, 216
- Halpern & Gotthelf (2010) Halpern, J. P., & Gotthelf, E. V. 2010, The Astronomer’s Telegram, 2445, 1
- Horne & Baliunas (1986) Horne, J. H., & Baliunas, S. L. 1986, ApJ, 302, 757
- Jansen et al. (2001) Jansen, F., et al. 2001, A&A, 365, L1
- Kalberla et al. (2005) Kalberla, P. M. W., Burton, W. B., Hartmann, D., Arnal, E. M., Bajaja, E., Morras, R., & Pöppel, W. G. L. 2005, A&A, 440, 775
- Krivonos et al. (2010) Krivonos, R., Tsygankov, S., Revnivtsev, M., Grebenev, S., Churazov, E., & Sunyaev, R. 2010, A&A, 523, A61
- Lachowicz et al. (2009) Lachowicz, P., Gupta, A. C., Gaur, H., & Wiita, P. J. 2009, A&A, 506, L17
- Landi et al. (2010) Landi, R., Malizia, A., Bazzano, A., Fiocchi, M., Bird, A. J., Gehrels, N., & Burrows, D. N. 2010, The Astronomer’s Telegram, 3078, 1
- Leahy et al. (1983) Leahy, D. A., Darbro, W., Elsner, R. F., Weisskopf, M. C., Kahn, S., Sutherland, P. G., & Grindlay, J. E. 1983, ApJ, 266, 160
- Liu et al. (2000) Liu, Q. Z., van Paradijs, J., & van den Heuvel, E. P. J. 2000, A&AS, 147, 25
- Lutovinov et al. (2012) Lutovinov, A. A., Burenin, R. A., Revnivtsev, M. G., & Bikmaev, I. F. 2012, Astronomy Letters, 38, 1
- Malizia et al. (2010) Malizia, A., Bassani, L., Sguera, V., Stephen, J. B., Bazzano, A., Fiocchi, M., & Bird, A. J. 2010, MNRAS, 408, 975
- Matt & Guainazzi (2003) Matt, G., & Guainazzi, M. 2003, MNRAS, 341, L13
- Monet et al. (2003) Monet, D. G., et al. 2003, AJ, 125, 984
- Nagase (1989) Nagase, F. 1989, PASJ, 41, 1
- Press & Rybicki (1989) Press, W. H., & Rybicki, G. B. 1989, ApJ, 338, 277
- Rodriguez et al. (2010) Rodriguez, J., Tomsick, J. A., & Bodaghee, A. 2010, A&A, 517, A14
- Romano et al. (2011) Romano, P., et al. 2011, MNRAS, 410, 1825
- Russeil (2003) Russeil, D. 2003, A&A, 397, 133
- Saxton et al. (2008) Saxton, R. D., Read, A. M., Esquej, P., Freyberg, M. J., Altieri, B., & Bermejo, D. 2008, A&A, 480, 611
- Skrutskie et al. (2006) Skrutskie, M. F., et al. 2006, AJ, 131, 1163
- Stephen et al. (2010) Stephen, J. B., Landi, R., Masetti, N., Fiocchi, M., Capitanio, F., Bird, A. J., & Clark, D. J. 2010, The Astronomer’s Telegram, 2441, 1
- Strüder et al. (2001) Strüder, L., et al. 2001, A&A, 365, L18
- The DENIS Consortium (2005) The DENIS Consortium. 2005, VizieR Online Data Catalog, 2263, 0
- Turner et al. (2001) Turner, M. J. L., et al. 2001, A&A, 365, L27
- Vallée (2008) Vallée, J. P. 2008, ApJ, 681, 303
- van der Klis (1989) van der Klis, M. 1989, in Timing Neutron Stars, ed. H. Ögelman & E. P. J. van den Heuvel, 27
- van der Woerd et al. (1989) van der Woerd, H., White, N. E., & Kahn, S. M. 1989, ApJ, 344, 320
- Walter et al. (2006) Walter, R., et al. 2006, A&A, 453, 133
- Watson et al. (2009) Watson, M. G., et al. 2009, A&A, 493, 339
- Wilms et al. (2000) Wilms, J., Allen, A., & McCray, R. 2000, ApJ, 542, 914