Spectroscopic and Photometric Study of the Contact Binary BO CVn
Abstract
We present the results of the study of the contact binary system BO CVn. We have obtained physical parameters of the components based on combined analysis of new, multi-color light curves and spectroscopic mass ratio. This is the first time the latter has been determined for this object. We derived the contact configuration for the system with a very high filling factor of about 88 percent. We were able to reproduce the observed light curve, namely the flat bottom of the secondary minimum, only if a third light has been added into the list of free parameters. The resulting third light contribution is significant, about 20-24 percent, while the absolute parameters of components are: M1=1.16, M2=0.39, R1=1.62 and R2=1.00 (in solar units).
The O-C diagram shows an upward parabola which, under the conservative mass transfer assumption, would correspond to a mass transfer rate of = , matter being transferred from the less massive component to the more massive one. No cyclic, short-period variations have been found in the O-C diagram (but longer-term variations remain a possibility).
keywords:
binaries: eclipsing binaries: close binaries – fundamental parameters.1 Introduction
The light variability of BO CVn (9.9 mag) was first discovered by Oja (1989), who published the first U, B and V light curves of the system with an initial period of 0.517460 days and also classified BO CVn as a W UMa type eclipsing variable. With the help of the Hydrogen ( and ) and CaII K lines, taken using the objective prism plates, Oja (1989) determined the spectral type of the system as F0.
The first light curve and period analysis of the system were performed by Albayrak et al. (2001), using the normal points derived from the B and V light curves of the system obtained with a SSP-5A photometer attached to the 30 cm Maksutov telescope at the Ankara University Observatory. They used the revised version of the Wilson-Devinney code (Wilson & Devinney, 1971) for the study. Due to the lack of spectroscopically determined mass ratio, Albayrak et al. (2001) performed a “so-called q search” and determined the best value of the mass ratio as q = 0.205. As the results they showed that BO CVn is in the contact configuration with a filling factor of = 0.18 and a temperature difference of = 90 K. From the period (O-C) analysis, assuming that the period change is due to mass transfer, they determined the period increase of 0.037 s/yr, that under the conservative case, corresponds to mass transfer rate of 1.57 x 10⁻¹⁰ /yr (matter being transferred from the less massive to the more massive component).
Another light curve and period analysis of BO CVn were carried out by Qian & Zhu (2006). Using the B, V and R light curves obtained with PI1024 TKB CCD attached to the 1.0 m reflecting telescope at the Yunnan Observatory of China, they analyzed their original data points with the 2003 version of the Wilson-Devinney code. Similarly to the procedure done by Albayrak et al. (2001), Qian & Zhu (2006) obtained a solution for the photometric mass ratio = 0.204, very close indeed to that obtained by Albayrak et al. (2001). They also determined the value of as 1.70 0.21 , using the statistical relation between and q for hotter contact binaries and estimated the value of as 0.35 .
| DAO | Mid Time | Exposure | S/N | Phase at | V1 | V2 |
|---|---|---|---|---|---|---|
| Image # | (HJD - 2400000) | Time (sec) | Mid-Exposure | (km/s) | (km/s) | |
| 4801 | 54569.0244 | 2448 | 75 | 0.255 | -56.77.9 | 245.911.2 |
| 4851 | 54571.8556 | 3600 | 95 | 0.726 | 85.610.7 | -226.05.0 |
| 4886 | 54574.6943 | 3600 | 109 | 0.212 | -60.29.3 | 227.412.9 |
| 4888 | 54574.7383 | 3600 | 115 | 0.297 | -52.210.2 | 241.216.8 |
| 5298 | 54925.8028 | 3600 | 116 | 0.731 | 89.55.4 | -220.14.7 |
| 5339 | 54926.8407 | 1800 | 82 | 0.736 | 92.83.4 | -218.68.1 |
| 5387 | 54928.7197 | 3600 | 99 | 0.368 | -25.84.4 | 198.811.2 |
| 5432 | 54929.9678 | 3103 | 59 | 0.780 | 95.23.2 | -215.94.2 |
| 2650 | 55673.8127 | 3600 | 111 | 0.264 | -56.13.9 | 238.58.8 |
| 2740 | 55677.9635 | 3600 | 88 | 0.285 | -48.36.1 | 243.64.9 |
V1, V2 are radial velocities of primary and secondary components, respectively
In this study, Johnson V, R and Strömgren v, b, y light curves were analyzed making use of the system spectroscopic mass ratio value, determined for the first time, in order to obtain accurate absolute parameters of the components of the BO CVn eclipsing binary. In addition, an up-to-date analysis of the system period behavior was performed.
2 Observations and Data Reduction
2.1 Photometry
BO CVn was observed photometrically with the aim to obtain as accurate as possible, multicolor light curve. The observations in the Strömgren v and b filters have been gathered at Mt. Suhora Observatory of the Pedagogical University using the 60 cm telescope and an Apogee Alta U47 CCD, mounted at the primary focus of the telescope. The 50 cm telescope at the Astronomical Observatory of the Jagiellonian University in Krakow, Poland, equipped with an Andor DZ 936-BV CCD, installed at the Cassegrain focus, was used to take additional data in the Strömgren y and wide band V and R (Bessell) filters. We used the same comparison star (GSC 3030 1129, 8.5 mag, K0) at both sites while GSC 3030 1123 served as the check star (10.7 mag, B-V=0.74). The light curve in Strömgren v and b filters has been gathered during four nights: March 27th, 29th, April 10th and 17th, 2011. Observations in Krakow (in Strömgren y and wide band V and R filters) were taken on March 8th, 28th, 29th 30th and April 3rd, 2011. Calibration of frames has been performed in a standard way: using the IRAF package all scientific images have been calibrated for bias, dark and flatfield which have been taken each night. The magnitude differences between variable, comparison and check stars were derived by means of the aperture photometry making use of the CMunipack program (http://c-munipack.sourceforge.net/, March 30th, 2012), which is an interface for the DAOPHOT package. Due to the large color difference between our target and chosen comparison star we accounted for both differencial and color terms of atmospheric extinction. The observations have been phased using the following linear ephemeris, taken from the Kreiner’s on-line catalogue Kreiner (2004) (http://www.as.up.krakow.pl/minicalc/CVNBO.HTM, August 29th, 2011):
| (1) |
The data in V and R filters taken at different nights were combined smoothly. However, those gathered in the Strömgren filters showed a small but noticeable shift for one night (March 27/28, 2011). To make them fit, we have moved the outlying night points by the values calculated from the overlapping part of the light curve. The final light curve consists of 1633, 1624, 1616, 933 and 994 individual points in v, b, y, V and R filters, respectively. The new multicolor light curve shows no or negligible difference in the maxima heights and the flat-bottom secondary minimum is clearly visible.

2.2 Spectroscopy
During three nights in 2008, four in 2009, and two in 2011 (all in April), a total of 10 spectra (at 10 /mm reciprocal dispersion, resolving power = 10,000) were taken by R.H. Nelson at the Dominion Astrophysical Observatory (DAO) in Victoria, British Columbia, Canada; then the Rucinski’s broadening functions (Rucinski, 2004) were used to obtain radial velocity (RV) curves (see Nelson et al. 2006 and Nelson 2010b for details). The spectral range was approximately 5000-5260 . A log of the DAO observations and RV results are presented in Table 1, while two spectra taken at phases: 0.30 and 0.73 and broadening functions at these phases are shown in Fig. 1. The fit of the sinusoidal curves gave the following orbital parameters: Vγ=15.4, K1=72.5 and K1=233.6 km/s. The spectroscopic mass ratio value qspec=0.31 (M2/M1) is significantly higher than that derived by Albayrak et al. (2001) and Qian & Zhu (2006) from the light curve modelling alone. This is not surprising, as Terrell & Wilson (2005) showed numerically that the photometric mass ratio is unreliable for contact binaries exhibiting partial eclipses.
3 The Light Curve Modeling
All previous BO CVn light curves modelling gave a contact configuration. However, without knowing the spectroscopic mass ratio value, any attempt to derive the parameters of components may lead to spurious values. This situation has improved with the qspec mass ratio determined and we performed the analysis of the new, multicolor light curve. In order to speed up computations mean points in each filter have been calculated: 141 in v and b filters, 139, 134 and 136 in the y, V and R filters, respectively. Furthermore, the magnitudes of the mean points have been recalculated to the flux units and normalized to unity at the first maximum.

We used the Wilson-Devinney code (Wilson 1979, 1993, hereafter W-D), appended with the Monte Carlo search method. This code has been already applied to solve light curves of dozens of systems (see Zola et al. 2010 and references therein). Instead of the original differential correction method it deploys the Monte Carlo as the search algorithm, greatly improving the chances of finding the global solution in the searched range of parameters. It does not require to assume any initial system configuration - it is found as the result of computations. To avoid the problem of arbitrary assumed weights to a few radial velocities measurements and photometric data (a thousand or more) we decided to perform the computations in an iterative way. The photometric light curve has been solved separately, then, after solution has converged, the results from this step serve for the mass ratio determination using the original W-D code and the radial velocity measurements. Only parameters relevant to the orbit are adjusted in this step. The recomputed mass ratio value is used for another run, when the best solution of the photometric light curve is found and such a procedure was repeated until the corrections become smaller than the mass ratio error.

Several parameters have been fixed or calculated in our modelling: the temperature of the primary component was set according to its F0 spectral type at 6980 K (Harmanec, 1988), the values for albedo and gravity darkening coefficients have been chosen at their theoretical values while the darkening coefficients adopted from the Díaz-Cordovés et al. (1995) tables as functions of the temperature and wavelength. Furthermore, we adopted the values for albedo and gravity darkening to agree with theoretical values: 0.50 and 0.32, respectively, appropriate for a convective stellar envelope. The following parameters have been adjusted: inclination (70-90 degrees), temperature of the secondary (6000-7500 K), components potentials (2-3.8) and luminosity of the primary (4-13.5). The ranges of fitted parameters have been listed in the parentheses.
| parameter | value |
|---|---|
| filling factor | 88 % |
| phase shift | 0.00020.0001 |
| (deg) | 89.40.2 |
| * 6980 | |
| 7191 10 | |
| = | 2.3796 0.0002 |
| (/ | * 0.340 |
| 5.853 0.018 | |
| 6.055 0.018 | |
| 6.287 0.020 | |
| 6.262 0.019 | |
| 6.427 0.022 | |
| ** 2.820 | |
| ** 2.874 | |
| ** 2.935 | |
| ** 2.922 | |
| ** 2.953 | |
| 0.2400 0.0014 | |
| 0.2276 0.0015 | |
| 0.2164 0.0017 | |
| 0.2168 0.0017 | |
| 0.2035 0.0021 |
*-not adjusted, **-computed
The spectroscopic mass ratio value has been estimated from the spectroscopic observations to be qspec=0.31 and this value was kept fixed in the first run. During subsequent runs this value has been modified to qcorr=0.34 and further correction have been smaller than the estimated error of the fit. The modified mass ratio value being the result of subsequent fits to the RV curves using the W-D code (only orbital parameters have been adjusted) is of somewhat higher value than qspec but the recomputed q accounts for proximity effects. It soon turned out that for the spectroscopic mass ratio value it was not possible to derive a model showing the flat bottom secondary minimum. We were able to get a good description of the observed light curve only if another free parameter is added - the third light (l3). Only then did the model fit the flat bottom shape of the secondary minimum.
The final results are presented in Tab. 2 and the theoretical light curve along with the observed one is shown in Fig. 2. In Fig. 3 the theoretical radial velocities (lines) along with measured ones (squares) are shown. As it can be seen, the model without a third light (thin lines) gives a very poor fit in both minima. When a third light parameter has been adjusted, a much better fit was obtained (thick lines) and the shape of the secondary minimum resembles that observed. In Fig. 3 the theoretical and observed radial velocities calculated for the best fit parameters are shown.
4 The orbital period variation
The O-C analysis of BO CVn was performed in order to investigate the orbital period variation behavior of the system. All available minima times, which cover 24 years (between 1987 and 2011), were used during the analysis and listed in Table 3 together with the minimum time obtained in this study.
| HJD Min | Type | Meth | O - C | Ref. | HJD Min | Type | Meth | O - C | Ref. |
|---|---|---|---|---|---|---|---|---|---|
| (2400000+) | |||||||||
| 46895.4550 | 1 | pe | -0.00060 | 1 | 52757.5142 | 2 | pe | 0.00675 | 13 |
| 47624.5540 | 1 | pe | -0.00136 | 2 | 52813.3986 | 2 | pe | 0.00379 | 13 |
| 47624.5550 | 1 | pe | -0.00136 | 2 | 52835.3914 | 1 | ccd | 0.00390 | 14 |
| 47626.6300 | 1 | pe | 0.00301 | 2 | 53119.2196 | 2 | ccd | 0.00475 | 15 |
| 47626.6380 | 1 | pe | 0.01083 | 2 | 53413.3989 | 1 | ccd | 0.00795 | 16 |
| 47651.4684 | 1 | pe | 0.00474 | 3 | 53413.3990 | 1 | ccd | 0.00795 | 16 |
| 47651.4690 | 1 | pe | 0.00474 | 3 | 53413.3991 | 1 | ccd | 0.00795 | 16 |
| 47673.4643 | 2 | pe | 0.00874 | 4 | 53461.5214 | 1 | ccd | 0.00518 | 17 |
| 47709.4180 | 1 | pe | -0.00166 | 4 | 53475.2303 | 2 | ccd | 0.00341 | 16 |
| 48036.4588 | 1 | pe | 0.00215 | 4 | 53475.2321 | 2 | ccd | 0.00341 | 16 |
| 48065.4322 | 1 | pe | 0.00091 | 4 | 53475.2376 | 2 | ccd | 0.01122 | 16 |
| 48071.3841 | 2 | pe | -0.00067 | 4 | 53476.2681 | 2 | ccd | 0.00755 | 16 |
| 48341.4974 | 2 | pe | -0.00195 | 4 | 53476.2691 | 2 | ccd | 0.00755 | 16 |
| 48383.4156 | 2 | pe | 0.00169 | 4 | 53476.2692 | 2 | ccd | 0.00755 | 16 |
| 48419.3795 | 1 | pe | 0.00300 | 4 | 53485.3277 | 1 | ccd | 0.01058 | 14 |
| 48724.4164 | 2 | pe | -0.00110 | 5 | 53504.4707 | 1 | ccd | 0.00515 | 14 |
| 48724.4187 | 2 | pe | -0.00110 | 5 | 53504.4714 | 1 | ccd | 0.00906 | 14 |
| 49056.3672 | 1 | pe | -0.00301 | 2 | 53504.4728 | 1 | ccd | 0.00906 | 14 |
| 49056.3682 | 1 | pe | -0.00301 | 2 | 53504.4735 | 1 | ccd | 0.00906 | 14 |
| 49439.5470 | 2 | pe | -0.00308 | 6 | 53545.3509 | 1 | pe | 0.00856 | 18 |
| 49439.5490 | 2 | pe | 0.00083 | 6 | 54131.8950 | 2 | ccd | 0.00966 | 19 |
| 49465.4221 | 2 | pe | -0.00112 | 6 | 54547.1619 | 1 | ccd | 0.01296 | 20 |
| 49465.4223 | 2 | pe | -0.00112 | 6 | 54554.4039 | 1 | ccd | 0.01070 | 21 |
| 49503.4554 | 1 | pe | 0.00066 | 6 | 54557.7673 | 2 | ccd | 0.01048 | 22 |
| 49503.4555 | 1 | pe | 0.00066 | 6 | 54656.3429 | 1 | ccd | 0.01232 | 23 |
| 49763.4798 | 2 | pe | 0.00003 | 7 | 54665.4026 | 2 | ccd | 0.01535 | 23 |
| 49763.4803 | 2 | pe | 0.00003 | 7 | 54671.3491 | 1 | ccd | 0.00986 | 23 |
| 50570.4605 | 1 | pe | 0.00031 | 8 | 54678.3377 | 2 | ccd | 0.01242 | 23 |
| 51271.3630 | 2 | pe | 0.00195 | 9 | 54699.2940 | 1 | ccd | 0.01229 | 23 |
| 51295.4252 | 1 | pe | 0.00252 | 9 | 54933.4463 | 2 | ccd | 0.01360 | 24 |
| 51362.4360 | 2 | pe | 0.00306 | 10 | 54950.7803 | 1 | ccd | 0.01460 | 25 |
| 52070.3231 | 2 | pe | 0.00334 | 11 | 55294.3759 | 1 | ccd | 0.01435 | 26 |
| 52375.3677 | 1 | pe | 0.00315 | 11 | 55651.4263 | 1 | ccd | 0.01715 | 27 |
| 52740.4401 | 2 | pe | 0.00874 | 12 |
References: 1. Oja (1989), 2. Hübscher et al. (1993), 3. Hübscher et al. (1991), 4. Albayrak et al. (2000), 5. Hübscher et al. (1992), 6. Hübscher et al. (1994), 7. Agerer & Hübscher (1996), 8. Agerer & Hübscher (1999), 9. Agerer & Hübscher (2000), 10. Agerer & Hübscher (2001), 11. Albayrak et al. (2002), 12. Müyesseroğlu et al. (2003), 13. Selam et al. (2003), 14. Brát et al. (2007), 15. Nagai (2005), 16. Qian & Zhu (2006), 17. Hübscher et al. (2005), 18. Albayrak et al. (2005), 19. Nelson (2008), 20. Nagai (2009), 21. Brát et al. (2008), 22. Nelson (2009), 23. Yılmaz et al. (2009), 24. Brát et al. (2009), 25. Nelson (2010a), 26. Hübscher & Monninger (2011), 27. This study
All the previous O-C analysis of the contact binary BO CVn (see Section 1) indicated a period increase of the system. Therefore, as the first attempt, we tried to determine the best fit to this secular variation using an IDL111http://ittvis.com/ProductServices/IDL.aspx routine, relying on the Levenberg-Marquardt algorithm. The resulting quadratic light elements (including the errors) are given below:
| (2) |
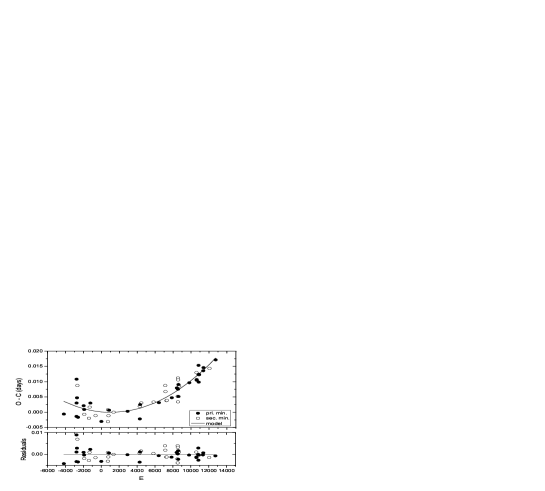
The O-C diagram with the model are shown in Fig. 4, including the residuals from the fit. As it can be seen from Fig. 4, the residuals from the quadratic fit show no any short-period cyclic variation that can be attributed to either the Light-Time Effect or some magnetic activity of the system. However, the possibility for long-term variation due to a light time effect remains a possibility.
The parameters derived from the O-C analysis, with the help of the absolute dimensions (masses of both components) determined from the photometric analysis are given in Table 4.
5 Results and Discussion
We gathered new, accurate, multicolor light curves of the eclipsing binary system BO CVn. Ten spectra taken around the quadratures make it possible to derive the spectroscopic mass ratio of the system for the first time.
| parameter | value | error |
|---|---|---|
| (days/cycle) | ||
| (days/year) | ||
| (/year) |
We made light curve modelling of the new light curves with the W-D code and making use of the spectroscopic mass ratio. It turned out that it was not possible to obtain a good fit without an additional free parameter: the third light. Only when the third light was allowed to be adjusted, we could achieve the observed shape of the secondary minimum. The theoretical light curves fit observations reasonably well, with very small departures at the beginning of the descending branch of the secondary and primary minima. As mentioned in Section 2.1, we found a problem in combining the data from a single night, covering these phases. Therefore, we can only speculate that despite of all our attempts, not all atmospheric effects have been reduced. There could be also another reason for this asymmetry in the light curve: some magnetic activity resulting in spot(s) appearing on the surface of one or both stars. Large, cool polar spots have been reported on the surface of 31 Com despite its thin convective layer (Strassmeier et al., 2010).

Our light curve modelling results indicate that BO CVn is a deep contact system with a very high filling factor of 88 percent. A view of the system configuration is shown in Fig. 5. The secondary, a smaller star, is about 200 K hotter than the primary one. We derived a high system inclination, close to 90 degrees. The contribution of the third light is significant, reaching about 24 percent in the Strömgren v filter.
Spectra exposure times compared to the orbital period were long and that must cause the phase smearing that reduces the amplitude of the measured radial velocity variations. We recomputed the amplitudes accounting for this effect and derived the following values: K1=74.9 and K2=241.8 km/s. Combining the results from spectroscopy and those derived from light curve modelling, we calculated the absolute system parameters, listed in Table 5. While parameters of the primary place it at or near the Main Sequence, the secondary is much oversized for its mass. The errors of parameters are given for the 90% confidence level while radius is that in the side direction. It is worth noting here that our values of physical parameters, which are based on the spectroscopic observations and those derived by Qian & Zhu (2006) based on the “photometric” mass ratio, differ significantly. As mentioned in Sect. 2.2 an application of the “q-search” to solve the light curves of partial eclipsed, contact binaries most likely will result in unreliable results.
Since the O’Connell effect is not clearly visible, we decided to present a no-spot solution as the final one. However, if indeed a spot presence is responsible for the small discrepancy between the theoretical and observed light curves, we eventually checked how this would influence the physical parameters and their uncertainties. To do this, we made two additional computations but including a cool spot either on the primary or on the secondary and searching the entire surfaces for its location. It turned out that the results did not change much when we assumed the spot to be on the surface of the secondary star. However, the solution with a cool spot placed on the primary component resulted in the temperature of the secondary component being about 300 K smaller than that of the primary, while other parameters being similar to these obtained in the non-spotted solution. As expected, the theoretical light curves of spotted solutions fit observed ones better, as the number of free parameters was larger.
| Parameter | Primary | Secondary |
|---|---|---|
| () | 3.140.05 | |
| () | 1.160.04 | 0.390.02 |
| () | 1.620.03 | 1.000.02 |
| () | 5.530.37 | 2.380.09 |
We analyzed the O-C diagram of BO CVn based on the literature data appended with a new time of primary minimum determined from our observations. Although we found the period was not constant, we found no short-period behavior that would provide support for a companion to the binary system. Thus third light may or may not represent a star gravitationally bound to the binary system. The O-C diagram shows an upward parabola that could be a result of period increase. This could be interpreted as mass transfer between the components, in a conservative case such a period increase would correspond to 6.310-8 /year. However, if the third star orbits the binary system in a very wide orbit, this might also be a part of a cyclic behavior due to the light travel effect.
We conclude that in several aspects, BO CVn is very similar to UZ Leo (Zola et al., 2010) - both systems have similar spectral types, mass ratios and high filling factors. Also for both, a considerable third light was found and their O-C diagrams (upward parabolas) indicate periods increase, therefore excluding mass loss from the system.
6 Acknowledgments
We acknowledge a helpful discussion with Bob Wilson. This research has made use of the SIMBAD database, operated at CDS, Strasbourg, France.
References
- Agerer & Hübscher (1996) Agerer, F., Hübscher, J., 1996, IBVS, 4382, 1
- Agerer & Hübscher (1999) Agerer, F., Hübscher, J., 1999, IBVS, 4711, 1
- Agerer & Hübscher (2000) Agerer, F., Hübscher, J., 2000, IBVS, 4912, 1
- Agerer & Hübscher (2001) Agerer, F., Hübscher, J., 2001, IBVS, 5016, 1
- Albayrak et al. (2000) Albayrak, B., Müyesseroğlu, Z., Özdemir, S., 2000, IBVS, 4941, 1
- Albayrak et al. (2001) Albayrak, B., Müyesseroğlu, Z., Özdemir, S., 2001, AN, 322, 125
- Albayrak et al. (2002) Albayrak, B., Tanrıverdi, T., Aydın C., 2002, IBVS, 5300, 1
- Albayrak et al. (2005) Albayrak, B., Yüce, K., Selam, S.O., Tanrıverdi, T., Okan, A., Çınar, D., Topal, S., Özgür, E., Şener, H.T., Ergün, İ., Civelek, E., 2005, IBVS, 5649, 1
- Brát et al. (2007) Brát, L., Zejda, M., Svoboda, P., 2007, OEJV, 74, 1
- Brát et al. (2008) Brát, L., Šmelcer, L, Kuèáková, H., Ehrenberger, R., Kocián, R., Lomoz, F., Urbanèok L., Svoboda, P., Trnka, J., Marek, P., Døevìný, R., Uhláø, R., Poddaný, S., Zasche, P., Skarka, M., 2008, OEJV, 94, 1
- Brát et al. (2009) Brat, L., Trnka, J., Lehky, M., Smelcer, L., Kucakova, H., Ehrenberger, R., Dreveny, R., Lomoz, F., Marek, P., Kocian, R., Svoboda, P., Pribik, V., Urbancok, L., Poddany, S., Dubovsky, P. A., Uhlar, R., Horalek, P., Hanzl, D., Broz, M., Kalisch, T., Macek, O., Exnerova, M., Vitek, M., 2009, OEJV, 107, 1
- Díaz-Cordovés et al. (1995) Díaz-Cordovés, J., Claret, A., Gimenez, A., 1995, A&AS, 110, 329
- Harmanec (1988) Harmanec, P., 1988, BAICz, 39, 329
- Hübscher et al. (1991) Hübscher, J., Agerer, F., Wunder, E., 1991, BAV Mitt. 59
- Hübscher et al. (1992) Hübscher, J., Agerer, F., Wunder, E., 1992, BAV Mitt. 60
- Hübscher et al. (1993) Hübscher, J., Agerer, F., Wunder, E., 1993, BAV Mitt. 62
- Hübscher et al. (1994) Hübscher, J., Agerer, F., Frank, P., Wunder, E., 1994, BAV Mitt. 68
- Hübscher et al. (2005) Hübscher, J., Paschke, A., Walter, F., 2005, IBVS, 5657, 1
- Hübscher & Monninger (2011) Hübscher, J., Monninger, G., 2011, IBVS, 5959, 1
- Kreiner (2004) Kreiner, J.M., 2004, AcA, 54, 207
- Müyesseroğlu et al. (2003) Müyesseroğlu, Z., Törün, E., Özdemir, T., Gürol, B., Özavcı, İ., Tunç, T., Kaya, F., 2003, IBVS, 5463, 1
- Nagai (2005) Nagai, K., 2005, VSOLJ, 43
- Nagai (2009) Nagai, K., 2009, VSOLJ, 48
- Nelson et al. (2006) Nelson, R.H. ,Terrell, D., Gross, J., 2006, IBVS, 5715, 1
- Nelson (2008) Nelson, R.H., 2008, IBVS, 5820, 1
- Nelson (2009) Nelson, R.H., 2009, IBVS, 5875, 1
- Nelson (2010a) Nelson, R.H., 2010a, IBVS, 5929, 1
- Nelson (2010b) Nelson, R.H., 2010b, ”Spectroscopy for Eclipsing Binary Analysis in The Alt-Az Initiative, Telescope Mirror & Instrument Developments”, in: Genet, J.M. Johnson and V. Wallen (Eds.), Collins Foundation Press, Santa Margarita, CA
- Oja (1989) Oja, T., 1989, IBVS, 3288, 1
- Qian & Zhu (2006) Qian, S.-B., Zhu, L.-Y., 2006, AJ, 131, 1032
- Rucinski (2004) Rucinski, S.M., 2004, ”Advantages of the Broadening Function (BF) over the Cross-Correlation Function (CCF)”, in Stellar Rotation, Proc. IAU Symp. 215
- Selam et al. (2003) Selam, S.O., Albayrak, B., Şenavcı, H.V., Tanrıverdi, T., Elmaslı, A., Kara, A., Aksu, O., Yılmaz, M., Karakaş, T., Çınar, D., Demirhan, M., Şahin, S., Çeviker, S., Gözler, A.P., 2003, IBVS, 5471, 1
- Strassmeier et al. (2010) Strassmeier, K.G., Granzer, T., Kopf, M., Weber, M., Küker, M., Reegen, P., Rice, J. B., Matthews, J. M., Kuschnig, R., Rowe, J. F., Guenther, D. B., Moffat, A. F. J., Rucinski, S. M., Sasselov, D., Weiss, W. W., 2010, A&A, 520, 52
- Terrell & Wilson (2005) Terrell, D. Wilson, R.E., 2005, Ap&SS, 296, 221
- Wilson & Devinney (1971) Wilson, R.E., Devinney, E.J., 1971, ApJ, 166, 605
- Wilson (1979) Wilson, R.E., 1979, ApJ, 234, 1054
- Wilson (1993) Wilson, R.E., 1993, Documentation of Eclipsing Binary Computer Model, University of Florida
- Yılmaz et al. (2009) Yılmaz, M., Başturk, Ö., Alan, N., Şenavcı, H.V., Tanrıverdı, T., Kılıçoğlu, T., Çalışkan, S., Çelik, L., Aydın, G., Çakan, D., Bilgiç, D., Uluş, N.D., Elmaslı, A., Selam, S.O., Albayrak, B., Ekmekçi, F., 2009, IBVS, 5887, 1
- Zola et al. (2010) Zola, S., Gazeas, K., Kreiner, J.M., Ogloza, W., Siwak, M., Koziel-Wierzbowska, D., Winiarski, M., 2010, MNRAS, 408, 464