Coherent oscillations and the evolution of the apparent emission area in the decaying phase of radius-expansion bursts from 4U 1636–53
Abstract
We analysed all archival data of the low-mass X-ray binary 4U 1636–53 with the Rossi X-ray Timing Explorer (1490 observations). We found a total of 336 type-I X-ray bursts from this source. In the time-resolved spectra of 69 of these bursts, close to the peak of the burst, the best-fitting blackbody radius shows the sharp increase and decrease that is typical of photospheric radius-expansion (PRE) bursts. We found that in 17 of these 69 PRE bursts, after the touchdown point, the blackbody radius increases again quickly after about 1 second, and from then on the radius decreases slightly or it remains more or less constant. In the other 52 PRE bursts, after touchdown, the radius of the blackbody stays more or less constant for seconds, and after that it increases slowly. Interestingly, those PRE bursts in which the blackbody radius remains more or less constant for seconds show coherent oscillations in the tail of the burst, whereas those PRE bursts in which the blackbody radius changes rapidly after touchdown show no coherent oscillations in the tail of the burst. We found that the distribution of durations of the post touchdown phase between these two groups of PRE bursts is significantly different; the Kolmogorov-Smirnov probability that the two groups of PRE bursts come from the same parent populations is only . This is the first time that the presence of burst oscillations in the tail of X-ray bursts is associated with a systematic behaviour of the spectral parameters in that phase of the bursts. This result is consistent with predictions of models that associate the oscillations in the tail of X-ray bursts with the propagation of a cooling wake in the material on the neutron-star surface during the decay of the bursts.
keywords:
stars: neutron — X-rays: binaries — X-rays: bursts — stars: individual: 4U 1636–53Accepted. Received; in original form
1 introduction
Thermonuclear, type-I, X-ray bursts (e.g., Lewin et al., 1993; Strohmayer & Bildsten, 2003; Galloway et al., 2008) are due to unstable burning of H and He on the surface of accreting neutron stars in low-mass X-ray binaries (LMXBs). Some X-ray bursts are strong enough to lift up the outer layers of the star. During these so-called photospheric radius expansion (PRE) bursts (e.g., Basinska et al., 1984; Kuulkers et al., 2002), the radiation flux that emerges from the stellar surface is limited by the Eddington flux.
One of the best studied sources of X-ray bursts is the LMXB 4U 1636–53. For instance, from observations with the Rossi X-ray Timing Explorer (RXTE) up to May 2010, Zhang et al. (2011) detected 298 X-ray bursts. Most of these bursts have standard, single-peaked, fast rising and exponentially decaying light curves; 52 of these bursts are PRE bursts (Zhang et al., 2011).
Some of the bursts in 4U 1636–53 show millisecond oscillations at 581 Hz, the so-called burst oscillations (Strohmayer et al., 1998). These oscillations likely reflect the spin frequency of the neutron star (Strohmayer et al., 1997; Chakrabarty et al., 2003). Similar burst oscillations have been detected in several other low-luminosity accreting neutron-star systems (for a review see, e.g. Muno et al., 2001; Galloway et al., 2008; Watts, 2012), e.g. 4U 1728–34, 4U 1608–52, KS 1731–260 and Aquila X–1. Burst oscillations do not occur in every burst from these LMXBs; but when burst oscillations are present, they occur sometimes during the rise, sometimes in the decay, and sometimes both in the rise and the decay of the burst. In KS 1731–260, oscillations are only found at high mass accretion rate, both in the rise and the decay of the burst, and all but one of the bursts with oscillations also show radius expansion (Muno et al., 2001). In 4U 1728–34, burst oscillations (both in the rise and the decay) are also only detected when the mass accretion rate is high, whereas most PRE bursts occur when the accretion rate is low, and these PRE bursts show no oscillations (van Straaten et al., 2001; Franco, 2001). In 4U 1636–53, the situation is more complex than in 4U 1731–260 and 4U 1728–34. Burst oscillations in 4U 1636–53 are observed both in PRE and non-PRE bursts, and are detected both at low and high mass accretion rate (Zhang et al., 2011). From these results, it appears that in 4U 1636–53 burst oscillations are neither correlated with mass accretion rate nor with the PRE phenomenon.
Burst oscillations have been explained as arising from rotation of a brightness asymmetry on the neutron-star surface at the spin frequency of the neutron star (Strohmayer et al., 1997). Asymmetries in the emission pattern of the neutron-star surface in the rising phase of thermonuclear X-ray bursts can be due to initially localised nuclear burning at the place where the burst first ignites; the flame front subsequently spreads to the entire neutron-star surface, and the asymmetry, and hence the oscillations, disappears (Strohmayer et al., 1996). Strohmayer et al. (1997) found that the amplitude of the burst oscillations in 4U 1728–34 decreases monotonically as the burst flux increases during the rising phase of the burst (See also Muno et al., 2002). This result is consistent with the spreading hotspot model, since as the spot grows in size, the amplitude of the oscillation should decrease.
As we already mentioned, oscillations are detected not only in the rising, but also at the peak and the decaying phase (the so-called tail) of X-ray burst; in fact, burst oscillations are most commonly detected in the tail of the bursts (hereafter tail oscillations; van Straaten et al., 2001; Muno et al., 2002; Galloway et al., 2008). Most burst oscillations exhibit a frequency drift of Hz in the tail of the burst (Galloway et al., 2001; Muno et al., 2002), with at least one example where the drift is as large as 5 Hz (Wijnands et al., 2001). In general the frequency of the oscillations increases towards an asymptotic value in the tail of the burst, although Strohmayer et al. (1998) and Strohmayer (1999) found that in 4U 1636–53 the frequency of the oscillations decreases in some bursts. The spreading hotspot model can neither explain the tail oscillations, nor this frequency drift (Cumming & Bildsten, 2000; Cumming et al., 2002).
| Obsid | start time (UTC) | soft colour | hard colour | intensity | (s) | ||
|---|---|---|---|---|---|---|---|
| 10088-01-07-02 | 1996-12-28 22:39:29 | 2.18 | 3.00 | 1.02 | |||
| 10088-01-08-01 | 1996-12-29 23:26:52 | 2.13 | 3.75 | 1.05 | |||
| 30053-02-02-02 | 1998-08-19 11:44:42 | 2.15 | 2.00 | 1.30 | |||
| 30053-02-01-02 | 1998-08-20 03:40:12 | 2.13 | 9.75 | 1.02 | |||
| 40028-01-02-00 | 1999-02-27 08:47:32 | 2.11 | 2.00 | 1.11 | |||
| 40028-01-04-00 | 1999-04-29 01:43:41 | 2.13 | 3.75 | 1.00 | |||
| 40028-01-06-00 | 1999-06-10 05:55:33 | 2.09 | 9.00 | 1.68 | |||
| 40030-03-04-00 | 1999-06-19 17:31:00 | 2.10 | 2.00 | 1.53 | |||
| 40031-01-01-06 | 1999-06-21 19:05:55 | 2.09 | 3.00 | 1.82 | |||
| 40028-01-15-00 | 2000-06-15 05:05:47 | 2.13 | 10.00 | 1.32 | |||
| 40028-01-18-000 | 2000-08-09 01:18:42 | 2.07 | 3.25 | 0.72 | |||
| 40028-01-18-00 | 2000-08-09 08:56:56 | 2.08 | 3.75 | 1.19 | |||
| 40028-01-19-00 | 2000-08-12 23:32:24 | 2.05 | 3.75 | 1.56 | |||
| 40028-01-20-00 | 2000-10-03 23:32:51 | 2.07 | 2.50 | 1.23 | |||
| 50030-02-01-00 | 2000-11-05 04:22:01 | 2.24 | 3.00 | 1.62 | |||
| 50030-02-02-00 | 2000-11-12 18:02:30 | 2.34 | 7.50 | 0.94 | |||
| 50030-02-04-00 | 2001-01-28 02:47:15 | 2.15 | 4.75 | 1.09 | |||
| 50030-02-05-01 | 2001-02-01 21:00:53 | 2.18 | 3.75 | 1.29 | |||
| 50030-02-05-00 | 2001-02-02 02:24:23 | 2.12 | 4.25 | 0.88 | |||
| 50030-02-10-00 | 2001-04-30 05:28:36 | 2.07 | 4.25 | 0.81 | |||
| 60032-01-06-01 | 2001-08-28 06:41:22 | 2.15 | 4.00 | 0.88 | |||
| 60032-01-12-000 | 2001-09-30 14:47:20 | 2.12 | 2.50 | 1.40 | |||
| 60032-01-14-01 | 2001-11-01 07:38:21 | 2.26 | 5.50 | 1.09 | |||
| 60032-01-20-000 | 2002-01-09 00:26:41 | 2.05 | 5.00 | 1.44 | |||
| 60032-01-20-01 | 2002-01-09 12:48:26 | 2.09 | 6.25 | 1.52 | |||
| 60032-05-06-00 | 2002-01-14 12:20:38 | 1.98 | 2.75 | 1.13 | |||
| 60032-05-13-00 | 2002-02-05 22:21:53 | 2.25 | 4.00 | 1.50 | |||
| 60032-05-14-00 | 2002-02-11 17:35:09 | 2.23 | 1.75 | 4.09 | |||
| 91024-01-42-00 | 2005-05-26 07:30:56 | 2.07 | 3.75 | 1.33 | |||
| 91024-01-46-00 | 2005-06-03 09:19:56 | 2.05 | 3.00 | 1.33 | |||
| 91024-01-80-00 | 2005-08-10 05:36:39 | 2.14 | 3.75 | 1.41 | |||
| 91024-01-82-00 | 2005-08-14 02:06:29 | 2.30 | 3.25 | 0.74 | |||
| 91024-01-83-00 | 2005-08-16 01:45:39 | 2.32 | 6.25 | 1.32 | |||
| 91024-01-30-10 | 2005-11-14 22:50:47 | 2.12 | 3.50 | 0.85 | |||
| 91152-05-02-00 | 2006-07-03 01:46:33 | 2.02 | 4.50 | 1.54 | |||
| 92023-01-72-00 | 2006-07-24 11:49:15 | 2.14 | 6.50 | 1.17 | |||
| 92023-01-31-10 | 2006-11-15 05:58:36 | 2.06 | 4.25 | 1.19 | |||
| 92023-01-60-10 | 2007-01-12 00:03:36 | 2.08 | 4.50 | 0.87 | |||
| 70036-01-02-00 | 2007-06-21 02:12:13 | 2.07 | 5.25 | 1.00 | |||
| 93087-01-69-00 | 2007-11-12 07:37:32 | 2.08 | 3.75 | 1.74 | |||
| 93087-01-28-10 | 2008-03-05 19:07:59 | 2.07 | 4.00 | 0.65 | |||
| 93087-01-57-10 | 2008-05-02 03:56:54 | 2.00 | 4.25 | 1.49 | |||
| 93087-01-70-10 | 2008-05-28 19:34:02 | 2.08 | 4.75 | 1.07 | |||
| 93087-01-91-10 | 2008-07-09 14:29:09 | 2.11 | 4.25 | 1.35 | |||
| 93087-01-04-20 | 2008-07-31 06:25:42 | 2.04 | 9.25 | 1.16 | |||
| 94310-01-01-00 | 2009-03-14 19:59:22 | 2.08 | 8.25 | 1.11 | |||
| 94310-01-03-000 | 2009-09-05 05:16:19 | 2.09 | 4.50 | 1.09 | |||
| 94087-01-73-10 | 2009-12-01 00:38:48 | 2.13 | 4.00 | 1.40 | |||
| 94087-01-74-10 | 2009-12-03 07:43:50 | 2.24 | 5.75 | 1.54 | |||
| 95087-01-42-00 | 2010-03-25 12:59:07 | 2.22 | 4.00 | 1.22 | |||
| 96087-01-46-00 | 2011-04-01 15:23:03 | 2.35 | 4.50 | 1.06 | |||
| 96087-01-50-10 | 2011-10-22 23:59:42 | 2.09 | 5.50 | 0.91 |
-
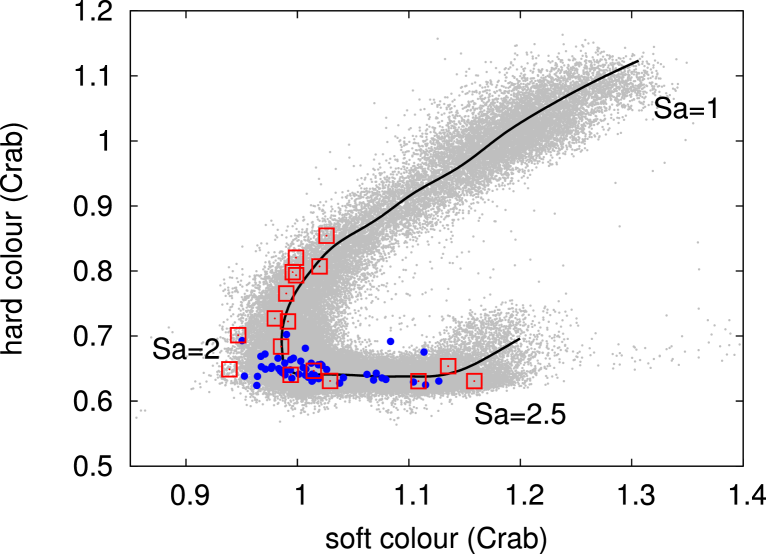
Note. – The colour and intensity are normalised by Crab. parametrizes the position of the source in the colour-colour diagram at the onset of the burst (see Figure 1). is the duration of post touchdown (PTD) phase. is the reduced for a fit with a constant function to the radius profile during the PTD phase.
| Obsid | start time (UTC) | soft colour | hard colour | intensity | (s) | ||
|---|---|---|---|---|---|---|---|
| 10088-01-08-030 | 1996-12-31 17:36:57 | 2.31 | 2.25 | 1.72 | |||
| 40028-01-08-00 | 1999-06-18 23:43:06 | 2.37 | 1.75 | 2.89 | |||
| 40028-01-10-00 | 1999-09-25 20:40:51 | 2.37 | 1.50 | 4.54 | |||
| 50030-02-09-000 | 2001-04-05 17:07:07 | 2.02 | 2.75 | 2.11 | |||
| 60032-05-01-00 | 2002-01-12 01:17:51 | 1.78 | 1.25 | 13.99 | |||
| 60032-05-02-00 | 2002-01-12 13:18:44 | 1.82 | 1.25 | 10.31 | |||
| 60032-05-04-00 | 2002-01-13 12:31:34 | 1.78 | 1.50 | 16.97 | |||
| 60032-05-07-00 | 2002-01-14 23:23:08 | 1.87 | 1.50 | 16.79 | |||
| 60032-05-07-01 | 2002-01-15 07:01:42 | 1.82 | 1.75 | 14.19 | |||
| 60032-05-09-00 | 2002-01-15 23:26:50 | 1.94 | 1.50 | 9.72 | |||
| 60032-05-22-000 | 2002-10-04 06:01:46 | 1.95 | 4.50 | 2.94 | |||
| 80425-01-01-00 | 2003-09-17 22:39:50 | 1.71 | 3.75 | 4.45 | |||
| 92023-01-23-20 | 2007-05-02 10:04:36 | 2.10 | 2.25 | 1.95 | |||
| 93087-01-24-10 | 2008-02-26 16:28:24 | 1.99 | 1.25 | 3.83 | |||
| 93091-01-02-00 | 2008-02-27 13:52:55 | 2.13 | 2.50 | 1.86 | |||
| 94087-01-45-10 | 2009-10-06 05:38:23 | 2.16 | 1.50 | 2.57 | |||
| 95087-01-39-00 | 2010-03-19 11:55:03 | 2.07 | 1.25 | 24.46 |
- Columns are the same as in Table LABEL:tab_burst_pre_os_info.
Regarding the tail oscillations, Payne & Melatos (2006) proposed that during the decaying phase of the burst, the burning front is stalled by the presence of a magnetic field; the combination of partial surface burning and magnetic fields could lead to anisotropic emission during the tail of X-ray bursts. Alternatively, a cooling wake in the tail of the burst due to hydrodynamic instabilities can also produce asymmetric emission (Spitkovsky et al., 2002). Finally, instability modes (eg., pressure, gravity, buoyancy, etc.) excited in the neutron star burning layer can also produce burst oscillations; this scenario can also account for the observed frequency drift of the oscillations in the tail of some bursts (Cumming & Bildsten, 2000; Heyl, 2004; Piro & Bildsten, 2005).
In this paper we compare simultaneous power density spectra and time-resolved energy spectra of 336 X-ray bursts in 4U 1636–53. We find that bursts with oscillations in the tail of the burst always show an extended period, s, of a more or less constant blackbody radius during the burst decay. We describe the observations and data analysis in §2, and we present our results in §3. Finally, in §4 we discuss our findings and compare them with current models for burst oscillations.
2 Observation and data analysis
We analysed all available data (1490 observations) of 4U 1636–53 from the Proportional Counter Array (PCA) on board RXTE. The PCA consists of an array of five collimated proportional counter units (PCUs) operating in the 260 keV range. We produced 0.5-s light curves from the Standard-1 data (0.125-s time-resolution with no energy resolution) and searched for X-ray bursts in these light curves following the procedure described in Zhang et al. (2011). We detected a total of 336 bursts.
We used the Standard-2 data (16-s time-resolution and 129 channels covering the full keV PCA band) to calculate X-ray colours of the source (see Zhang et al., 2011, for details). Hard and soft colours are defined as the keV and keV count rate ratios, respectively. We show the colour-colour diagram (CD) of all observations of 4U 1636–53 in Figure 1. We parametrized the position of the source on the diagram by the length of the solid curve (see, e.g. Méndez et al., 1999), fixing the values of and at the top-right and the bottom-left vertex of the CD, respectively.
In order to study the bursts in detail, we used the high-time resolution modes that were available for each observation to produce time-resolved spectra of each burst. About 8% of the observations have a mode with 500-s time resolution. The rest of the observations have a mode with at least 125-s time resolution. For every burst we produced a spectrum every 0.25 s during the whole duration of the burst. We generated the instrument response matrix for each spectrum with the standard FTOOLS routine , and we corrected each spectrum for dead time using the methods supplied by the RXTE team. Because of the short exposure of each spectrum, in this case the statistical errors dominate, and therefore we did not add any systematic error to the spectra. For each burst we extracted the spectrum of the persistent emission just before (or after) the burst to use as background in our fits; this approach, used to obtain the net emission of a burst, is a well established procedure in X-ray burst analysis (e.g. Kuulkers et al., 2002). We note that this procedure fails if the blackbody component during the burst comes from the same source that produces the blackbody component seen in the persistent emission, since the difference between two blackbody spectra is not a blackbody (van Paradijs & Lewin, 1986). This effect is significant only when the net burst emission is small, and therefore problems may arise only at the start and the tail of the burst, when the burst emission is comparable to the persistent emission (see the discussion in Kuulkers et al., 2002). In Zhang et al. (2011), we already established that this issue does not significantly affect the spectral results in 4U 1636–53.
We fitted the spectra using XSPEC version 12.7.0 (Arnaud, 1996), restricting the spectral fits to the energy range keV. We fitted the time-resolved net burst spectra with a single-temperature blackbody model ( in XSPEC), as generally burst spectra are well fitted by a blackbody (Galloway et al., 2008). We also included the effect of interstellar absorption along the line of sight using the XSPEC model . During the fitting we kept the hydrogen column density, , fixed at cm-2 (Pandel et al., 2008), and to calculate the radius of the emitting blackbody area in km, , we assumed a distance of 5.95 kpc (Galloway et al., 2008). We examined the time-resolved energy spectra of all 336 bursts in 4U 1636–53, and used the same method described in Galloway et al. (2008) to identify PRE and non-PRE bursts; we give the list of PRE bursts, and some of their properties, in Tables LABEL:tab_burst_pre_os_info and 2.
For each burst we computed Fourier power density spectra (PDS) from 2-s data segments for the duration of the burst using the 125 s binned data over the full PCA band pass, setting the start time of each segment to 0.125 s after the start time of the previous segment. Because of this, the individual power spectra are not independent. For each segment we calculated the Fast Fourier Transform up to a Nyquist frequency of 1024 Hz, with a frequency resolution of 0.5 Hz. We then computed the power density spectrum using the normalisation of Leahy et al. (1983). Under this normalisation, a signal consisting only of Poissonion noise yields powers that follow a distribution with 2 degrees of freedom, which allows us to estimate the chance probability of any fluctuation in the power spectrum (van der Klis, 1989).
We used these PDS to produce time-frequency plots (also known as dynamic power spectra; see Berger et al., 1996) for each burst. We searched within an interval of s immediately after the peak of each burst for coherent (tail) oscillations; we only searched the frequency range Hz with a resolution of 0.5 Hz. The number of possible independent trials in each burst is therefore equal to the duration of this interval divided by the length of the PDS (2 s) multiplied by the number of frequencies searched (11). Because we computed overlapping PDS (see above), we actually carried out more trials than this, although not all of them were independent. We therefore considered that a signal was significant if it had a probability of that it was produced by noise accounting for the number of possible independent trials, and if the signal appeared in at least two PDS within the tail of a single burst.
If we normalize the power spectra according to Leahy et al. (1983), the fractional rms amplitude at a given frequency is
| (1) |
where is the power, is the count rate (source plus background), and is the background (Belloni & Hasinger, 1990). To calculate the signal power, , from the measured power, , accounting for the distribution of powers from Poisson noise in the power spectrum, we used the algorithm described in the appendix of Vaughan et al. (1994, see also )
3 results
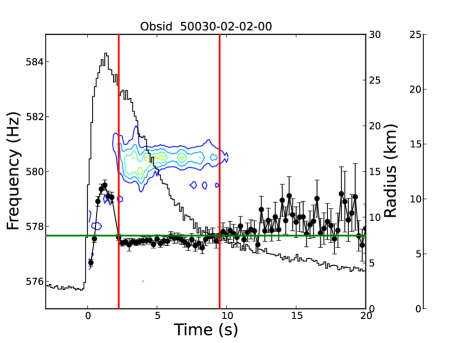
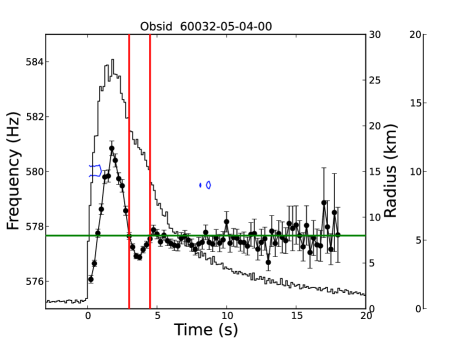
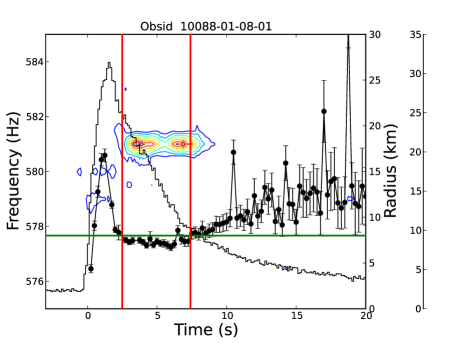
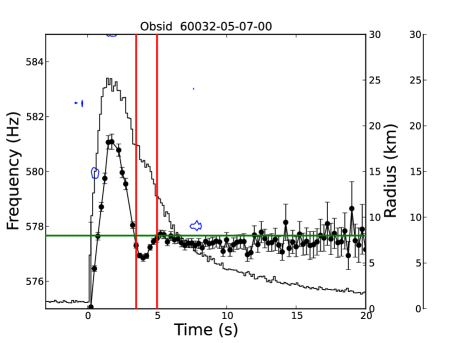
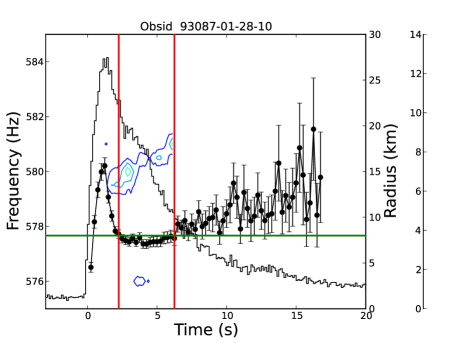
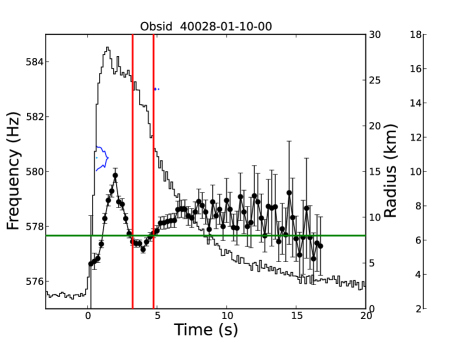
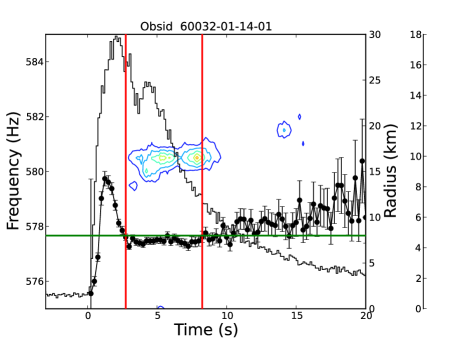
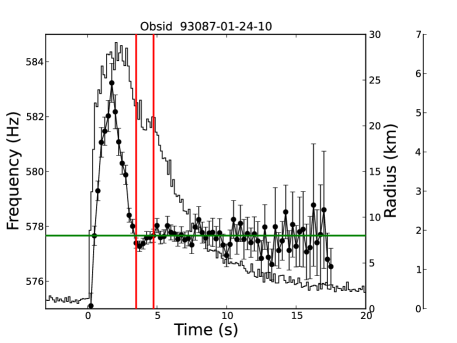
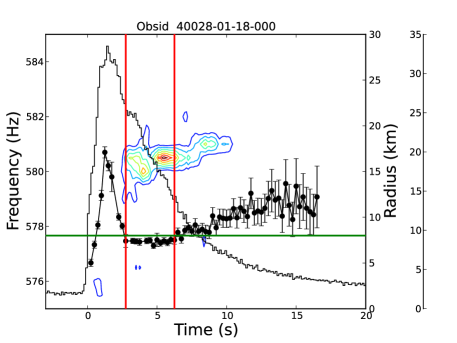
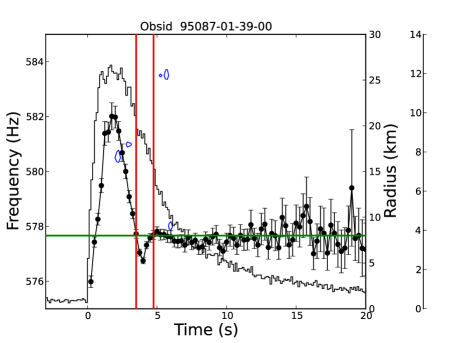
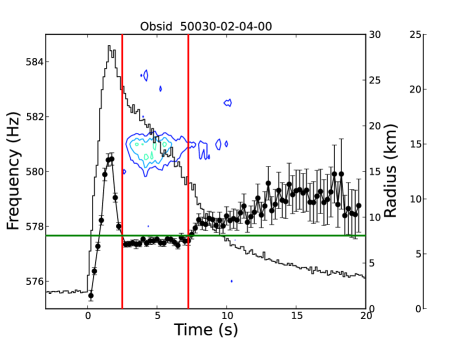
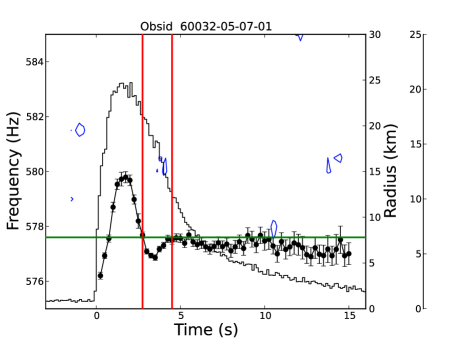
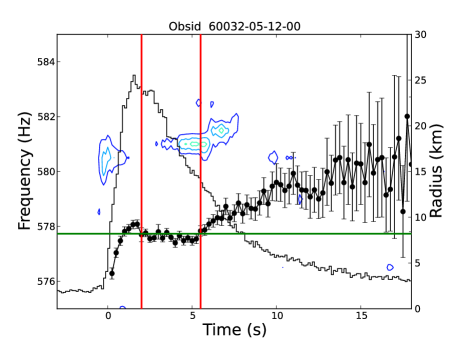
We examined the time-resolved energy spectra of all the 69 PRE bursts in 4U 1636–53. Here we concentrate on the time interval immediately after the radius expansion and contraction phase. In all PRE bursts the blackbody radius first increases, it then decreases abruptly to a local minimum (the so-called touch-down, TD, point) and after that it either increases or decreases slowly. In Figure 2 we show twelve examples of PRE bursts, in the left panels of this Figure we show six cases of bursts with tail oscillations, while in the right panels we show six cases of PRE bursts without tail oscillations. The black histogram shows the shape of the light curve of the bursts at a resolution of 0.125s. The contour lines show constant Fourier power values, increasing from 10 to 80 in steps of 10 (values are in Leahy units), as a function of time (x axis) and frequency (left y-axis). Black filled circles connected by a line show the fitted blackbody radius as a function of time with 0.25s time resolution (see the right y-axis). The burst light curve is aligned to the centre of each data interval used to calculate the power and energy spectra.
We find that the behaviour of the blackbody radius after TD is not the same in all PRE bursts. In 52 out of the 69 PRE bursts, after the expansion phase the blackbody radius first decreases rapidly, it then continues decreasing at a lower rate, it reaches a minimum value of km, and finally it increases slowly towards the tail of the burst (see left panel of Figure 2). In the other 17 PRE bursts, after the expansion phase the blackbody radius first decreases rapidly to a minimum of km, then it immediately increases again very quickly, and finally it either decreases slightly, or it remains more or less constant (see right panel of Figure 2). We can classify each of the 69 PRE bursts in 4U 1636–53 into one of these two groups.
While it is apparent that the duration of the phase around the minimum radius is not always the same among the 69 PRE bursts, we need to find an objective way to measure the duration of this phase. We initially defined the time interval starting at touchdown and ending at a given bolometric flux relative to the bolometric flux at the peak of the burst. We took values between 20% and 50% of the bolometric peak flux to define the ending time of this phase. Defined in this manner, the average duration of this phase in the 52 bursts that have radius profiles like the ones shown in the left panels of Figure 2 is longer than the duration of the 17 bursts that have radius profiles like the ones shown in the right panels of the same Figure. The Kolmogorov-Smirnov (K-S) probability that the distribution of durations of the two groups of bursts are samples of the same parent population is . A careful inspection of the intervals obtained using this definition shows that in several bursts the intervals extend beyond the duration of the short dips seen in the radius plots in the right panel of Figure 2, whereas in other bursts the intervals do not extend for the full period in which the radius remains constant in the left panels of the same Figure. It is therefore apparent that the bolometric flux is not a good indicator of the duration of this phase of the bursts, and we therefore considered a different way of defining the duration of this phase. We then decided to choose a contiguous time interval within which the radius was below a certain value. We chose this value such that it was larger than the minimum radius reached in all bursts after the expansion phase, which for this sample of bursts is 7.3 km, and it was smaller than the local maximum of the radius just after the touchdown point in bursts like the ones shown in the right panels of Figure 2. The smallest of these maxima in the whole sample is km. We therefore define the post touchdown (PTD) phase as the contiguous time interval after the peak of the burst in which the radius of the fitted blackbody is less than km. The red vertical lines in Figure 2 show the PTD phase for all the bursts shown in that Figure. Our results do not change significantly if we choose a value between km and km. If we used a value smaller than km, the duration of the PTD phase of several bursts would be zero, while if we used a value larger than km, the duration of the PTD phase of several bursts would be unbound. We realize that this is not the ideal way to define the PTD phase, and that it would be better to choose a parameter other than the radius itself for this. However, our experiments indicate that, while for some bursts the duration of the PTD phase may change slightly if we change the way we define it, the main result of our analysis does not significantly change. The threshold of km is represented by a horizontal green line in Figure 2. We show the duration of the PTD phase, , for all PRE bursts in Tables LABEL:tab_burst_pre_os_info and 2. We find that most PRE bursts in 4U 1636–53 show a long duration of the PTD phase, s.
We fitted the blackbody radius during the PTD phase of each PRE burst with a constant function. We show the best-fitting reduced , , in the last column of Tables LABEL:tab_burst_pre_os_info and 2. We found that in bursts with short PTD phase the radius profile during the PTD phase is not well fitted by a constant: in all cases , with only 7 out of 17 of these bursts yielding . On the contrary, in all but 3 out of 52 bursts with long PTD phase a fit with a constant to the radius profile during the PTD phase yields .
We also examined all the dynamic power spectra of these PRE bursts, concentrating only on the decaying phase of the burst. We find that 52 out of the 69 PRE bursts in 4U 1636–53 have tail oscillations (see the left panels in Figure 2). We calculated the upper limit of the power for the 17 PRE bursts in which we did not detect tail oscillations (Groth, 1975; Vaughan et al., 1994). Except for four bursts, the upper limits are lower than the average power of the detected tail oscillations. During the other four bursts only one or two of the five PCU detectors were on, and hence the upper limits are not very constraining. From the 12 examples in Figure 2 it is apparent that the bursts in the left panels, which show long ( s) PTD phase, have oscillations at the tail, while the bursts in the right panels, which have short ( s) PTD phase, have no oscillations at the tail.
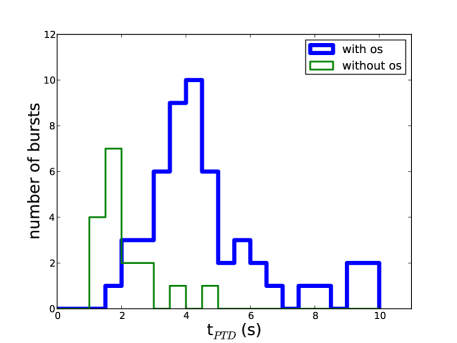
We calculated the duration of the PTD phase for all PRE bursts and divided them into two groups: burst with and without tail oscillations. Figure 3 shows the distribution of the duration of the PTD phase for PRE bursts with (blue thick histogram) and without (green thin histogram) tail oscillations. This plot confirms our initial impression: bursts with tail oscillations have on average times longer PTD times than burst without tail oscillations. We carried out a K-S test to assess whether the two distributions are consistent with being samples of the same parent population. We find a chance probability of .
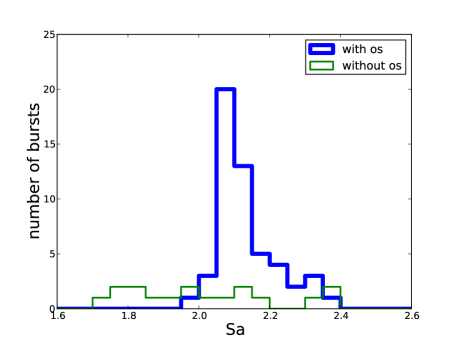
Figure 3 shows the distributions of for the PRE bursts with and without tail oscillations. We find that the PRE bursts with tail oscillations have values that are larger than 1.9, and the distribution peaks at , whereas PRE bursts without tail oscillations distribute uniformly from to ,
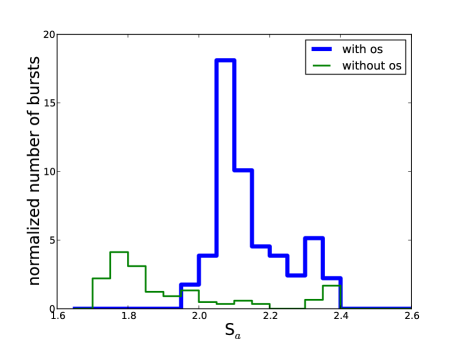
To compensate for the fact that RXTE did not sample the CD of 4U 1636–53 evenly, we normalised the bursts number per bin in Figure 3 by the total exposure time with RXTE at each position in the CD. We show the resulting distribution in Figure 3. We find that the distribution of in PRE bursts with tail oscillations still peaks at , whereas the distribution of in PRE bursts without tail oscillations peaks at . The KS probability that the two distributions111This is the KS probability from the raw data, i.e., without normalising the number of bursts per interval according to the RXTE exposure along the CD. We get an even lower probability if we instead compare the two histograms in Figure 3 using the test. Here we take the most conservative result. come from the same parent population is .
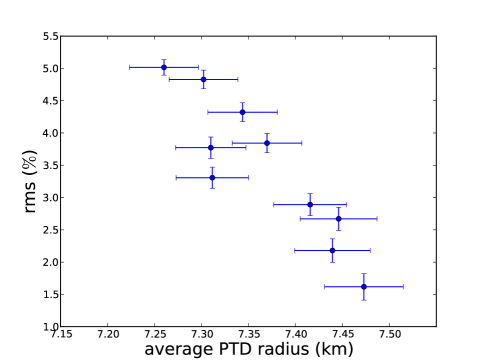
To check whether there is a correlation between the blackbody radius during the PTD phase (hereafter PTD radius) and the amplitude of the tail oscillation, for each burst we calculated the PTD radius and the rms amplitude of the tail oscillations every second. Finally we rebinned the data (220 measurements) into 10 points and plotted them in Figure 4. From this Figure it appears that the fractional rms amplitude decreases as the average PTD radius increases. We fitted the data both with a constant and a linear function, and we carried out an F-test to compare both fits. The F-test probability is , indicating that a linear fit is - better (for Gaussian errors) than a fit with a constant. We also calculated the distribution of the average PTD radius for PRE bursts with and without tail oscillations. The KS-test probability that both samples come from the same parent population is .
We also detected nine non-PRE bursts with tail oscillations in our observations. Similar to the case of PRE bursts, after the peak of the burst, the energy spectra of these non-PRE bursts show a period in which remains more or less constant during the time in which tail oscillations are present (see Figure 5). However, in this case it is difficult to identify the PTD phase because non-PRE bursts do not have (by definition) a radius expansion phase, and a subsequent TD point. We therefore did not include non-PRE bursts in our analysis, although it is quite possible that the connection between constant and tail oscillations applies also to this kind of bursts.
4 discussion
We analysed all 336 type-I X-ray bursts in the LMXB 4U 1636–53 observed with RXTE; 69 of them are PRE bursts. For the first time, we found a correlation between the spectral parameters of the bursts and the presence of oscillations in the decaying phase of these PRE bursts. After the radius contraction phase, in some bursts the blackbody radius reaches a minimum value followed by a fast increase (short post touchdown, PTD, phase). We do not detect burst oscillations during the decaying phase of these bursts. In other bursts, the blackbody radius reaches the minimum value followed by a slow evolution (long PTD phase). We do detect tail oscillations in these bursts. The duration of the PTD phase of PRE bursts with and without tail oscillations is significantly different. The K-S probability that the two groups of bursts come from the same parent population is (5- assuming Gaussian distribution).
Time-resolved spectra in the decaying phase of thermonuclear X-ray bursts can be used to measure the masses and radii of NSs. The net spectra of the thermonuclear X-ray bursts are usually well fitted by a blackbody spectrum (Strohmayer et al., 1996; Galloway et al., 2008), providing and , the apparent blackbody radius and colour temperature, respectively. The apparent radius of the NS depends on the NS mass and radius via , where is the true NS radius, is the gravitational redshift, and is the colour-correction factor, which accounts for hardening of the spectrum arising from electron scattering in the NS atmosphere (Suleimanov et al., 2011; Zhang et al., 2011; Özel, 2013).
In PRE bursts, if the NS atmosphere has returned to the NS surface at the touchdown point, and the distance of the NS can be estimated with sufficient precision, the observed touch-down flux and the inferred apparent emission area measured in the late parts of the burst can be used to estimate the neutron-star mass and radius, provided that one can properly model the NS atmosphere to estimate . We found that the blackbody radius does not always remain constant after touchdown. The changes of the apparent radius in the tail of X-ray bursts could be due to changes in either the emitting area of the neutron star or during this phase.
The mechanism that produces burst oscillations, and why these oscillations are not present in all type-I X-ray bursts, still remains unclear (Strohmayer et al., 1996, 1998; Muno et al., 2002; Muno, 2004). Unstable nuclear burning is likely not happening uniformly across the neutron-star surface so, as the neutron star rotates, variations of the neutron-star surface brightness and the neutron-star rotation should produce oscillations during an X-ray burst. Strohmayer et al. (1996) suggested that burst oscillations are caused by asymmetries due to initially localised nuclear burning (the ignition point of the burst) that later spreads over the surface of the neutron star in the rising phase of the burst. This scenario, however, cannot explain the tail oscillations that persist for as long as 5–10 s, unless the asymmetry can be maintained for such a long period. Spitkovsky et al. (2002) found that the speed of the burning front near the equator is higher than that near the poles. They also suggested that tail oscillations could be due to the spread of a cooling wake, which is formed by vortices during the cooling of the neutron-star atmosphere. In this scenario, the speed of the cooling wake would also depend on latitude.
Our results match some of the predictions of the model by Spitkovsky et al. (2002), if we assume that the bursts with tail oscillations are due to a cooling wake starting near the poles, while bursts without tail oscillations are due to a cooling wake starting near the equator. According to this model, the width and speed of the cooling wake should decrease by a factor of as the front propagates from the equator to the pole. If the cooling wake starts from the equator, the entire equator belt is covered very rapidly, and the asymmetry during the cooling disappears. After the atmosphere contracts to the neutron star surface, the emission area changes very quickly due to the high speed of the cooling wake near the equator. These bursts would have no tail oscillations and a short PTD phase.
If the cooling wake starts at high latitude, the front speed is slower than that in the equator (see Fig. 8 in Spitkovsky et al., 2002). After the atmosphere contracts to the neutron-star surface, the emission area changes slowly, the asymmetric emission during the tail of the burst lasts longer, and the emission area changes slowly. These bursts would have tail oscillations and a long PTD phase. It is interesting that bursts with tail oscillations have a PTD phase that is about 4 times longer than that of bursts without tail oscillations (see Figure 3), consistent with the prediction of Spitkovsky et al. (2002)
Cooper & Narayan (2007) found that the latitude at which bursts ignite increases as mass accretion rate onto the neutron star increases. We find that in 4U 1636–53 PRE bursts with tail oscillations always appear in the CD at high values (see Figure 3). Since is considered to be correlated to mass accretion rate (Hasinger & van der Klis, 1989; Méndez et al., 1999), this suggests that the cooling wake of PRE bursts with tail oscillations starts at high latitude.
In 4U 1636–53 the rms amplitude of the oscillations decreases as the average PTD radius increases (Figure 4). We find that a linear function fits the rms amplitude versus PTD radius better than a constant; the F-test probability that the improvement in the fit is just by chance is only . This result is consistent with the scenario in which the tail oscillations are due to a brightness asymmetry on the neutron-star surface, where the larger the area of the asymmetry the smaller the amplitude of the modulation (Strohmayer et al., 1996; Strohmayer et al., 1997; Muno et al., 2002).
The observed changes in during the tail of X-ray bursts could be due, in part, to the effect of , which depends on temperature, chemical composition, and (Suleimanov et al., 2011). However, during the PTD phase in PRE bursts with long PTD phase, in which the apparent emitting area remains more or less constant, the inferred (calculated from the best-fitting burst temperature and bolometric flux; Zhang et al., 2011) changes by less than 15%. This means that during the PTD phase of these bursts, the true emitting area and the colour factor both remain (more or less) constant. Alternatively, if one of them changed, the other would also have to change in a specific way such that the apparent area remained constant. Given that these two quantities are independent, the latter scenario is quite unlikely. On the other hand, during the PTD phase in PRE bursts with short PTD phase, in which the apparent emitting area changes rapidly, the inferred changes by less than 20 %. From all the above we conclude that, during the PTD phase, in bursts without tail oscillations the % variations of the apparent emitting area (see § 3) could be explained by changes in the colour factor, although we cannot discard that changes in the true emitting area also play a role; on the other hand, in bursts with tail oscillations, during the PTD phase, both the colour factor and the true emitting area remain more or less constant.
Bhattacharyya et al. (2010) found that in long X-ray bursts, during the decay phase of the burst, the apparent emitting area increases, whereas in short X-ray bursts the apparent emitting area increases. These authors proposed that this trend could be due to variations in the colour factor, indicative of different chemical composition of the neutron-star atmosphere in long and short bursts. The trend reported by Bhattacharyya et al. (2010) takes place at the end of the decaying phase of long and short bursts, whereas we find a bimodal behaviour of the blackbody radius at the very beginning of the decaying phase of PRE bursts in 4U 1636–53. While the result of Bhattacharyya et al. (2010) and ours could be connected, it is worth noticing that all PRE bursts in our sample belong to the class of short bursts in Bhattacharyya et al. (2010).
The relation between the duration of the PTD phase, , on one hand, and tail oscillations on the other, may actually extend to non-PRE bursts. Some non-PRE bursts in 4U 1636–53 show tail oscillations, and the blackbody radius stays constant as well during the oscillating time (see Figure 5). This suggests that tail oscillations are always associated with an emitting area that remains constant for a while, regardless of the nature (PRE or non-PRE) of the bursts. We note, however, that there are instances in which the blackbody radius stays constant for more than s in some non-PRE bursts in 4U 1636–53, whereas we do not detect tail oscillations in these bursts. This suggests that a blackbody radius staying constant for s or more is a necessary but not a sufficient condition for the presence of tail oscillations in 4U 1636–53.
Both positive and negative drift of the frequency of burst oscillations have been detected in 4U 1636-53 (Strohmayer et al., 1998; Strohmayer, 1999). Strohmayer (1999) found that in 4U 1636–53 an episode of a negative frequency drift was correlated with the appearance in the burst of an extended tail of emission with a decay timescale much longer than in other bursts from this source. If tail oscillations are from vortices in the neutron-star atmosphere (Spitkovsky et al., 2002), the direction in which the vortices drift on the surface of the neutron-star may affect the oscillation frequency. When the vortices move toward the pole, the frequency of oscillations decreases and the low-speed cooling wake makes this a burst with an extended emission tail. When the vortices move toward the equator, the frequency of oscillations increases and the high-speed cooling wake makes these bursts decay fast.
Our analysis shows that tail oscillations in type-I X-ray bursts in 4U 1636–53 are always associated with an emitting area that remains more or less constant for at least s. A similar trend is apparent in another LMXB system, 4U 1728–34 (Zhang et al. in prep.). In hindsight, this trend in 4U 1728–34 is already visible in Fig. 1 of van Straaten et al. (2001) and in 4U 1731-260 in Fig. 5 of Muno et al. (2000), although it was then not recognised by those authors, probably because of the low number of bursts available at the time.
Acknowledgments
This research has made use of data obtained from the High Energy Astrophysics Science Archive Research Center (HEASARC), provided by NASA’s Goddard Space Flight Center. We thank Laurens Keek, Rudy Wijnands, Chris Done, Peter Jonker, Diego Altamirano, and Anna Watts for useful comments and discussions. We acknowledge an anonymous referee for useful comments. TMB acknowledges support from INAF/ASI grant I/009/10/0.
References
- Arnaud (1996) Arnaud K. A., 1996, in G. H. Jacoby & J. Barnes ed., Astronomical Data Analysis Software and Systems V Vol. 101 of Astronomical Society of the Pacific Conference Series, XSPEC: The First Ten Years. p. 17
- Basinska et al. (1984) Basinska E. M., Lewin W. H. G., Sztajno M., Cominsky L. R., Marshall F. J., 1984, ApJ, 281, 337
- Belloni & Hasinger (1990) Belloni T., Hasinger G., 1990, A&A, 230, 103
- Berger et al. (1996) Berger M., van der Klis M., van Paradijs J., Lewin W. H. G., Lamb F., Vaughan B., Kuulkers E., Augusteijn T., Zhang W., Marshall F. E., Swank J. H., Lapidus I., Lochner J. C., Strohmayer T. E., 1996, ApJ, 469, L13
- Bhattacharyya et al. (2010) Bhattacharyya S., Miller M. C., Galloway D. K., 2010, MNRAS, 401, 2
- Chakrabarty et al. (2003) Chakrabarty D., Morgan E. H., Muno M. P., Galloway D. K., Wijnands R., van der Klis M., Markwardt C. B., 2003, Nature, 424, 42
- Cooper & Narayan (2007) Cooper R. L., Narayan R., 2007, ApJ, 657, L29
- Cumming & Bildsten (2000) Cumming A., Bildsten L., 2000, ApJ, 544, 453
- Cumming et al. (2002) Cumming A., Morsink S. M., Bildsten L., Friedman J. L., Holz D. E., 2002, ApJ, 564, 343
- Franco (2001) Franco L. M., 2001, ApJ, 554, 340
- Galloway et al. (2001) Galloway D. K., Chakrabarty D., Muno M. P., Savov P., 2001, ApJ, 549, L85
- Galloway et al. (2008) Galloway D. K., Muno M. P., Hartman J. M., Psaltis D., Chakrabarty D., 2008, ApJS, 179, 360
- Groth (1975) Groth E. J., 1975, ApJS, 29, 285
- Hasinger & van der Klis (1989) Hasinger G., van der Klis M., 1989, A&A, 225, 79
- Heyl (2004) Heyl J. S., 2004, ApJ, 600, 939
- Kuulkers et al. (2002) Kuulkers E., Homan J., van der Klis M., Lewin W. H. G., Méndez M., 2002, A&A, 382, L947
- Leahy et al. (1983) Leahy D. A., Darbro W., Elsner R. F., Weisskopf M. C., Kahn S., Sutherland P. G., Grindlay J. E., 1983, ApJ, 266, 160
- Lewin et al. (1993) Lewin W. H. G., van Paradijs J., Taam R. E., 1993, Space Sci. Rev., 62, 223
- Méndez et al. (1999) Méndez M., van der Klis M., Ford E. C., Wijnands R., van Paradijs J., 1999, ApJ, 511, L49
- Muno (2004) Muno M. P., 2004, in P. Kaaret, F. K. Lamb, & J. H. Swank ed., X-ray Timing 2003: Rossi and Beyond Vol. 714 of American Institute of Physics Conference Series, Millisecond Oscillations During Thermonuclear X-ray Bursts. pp 239–244
- Muno et al. (2001) Muno M. P., Chakrabarty D., Galloway D. K., Savov P., 2001, ApJ, 553, L157
- Muno et al. (2000) Muno M. P., Fox D. W., Morgan E. H., Bildsten L., 2000, ApJ, 542, 1016
- Muno et al. (2002) Muno M. P., Özel F., Chakrabarty D., 2002, ApJ, 581, 550
- Özel (2013) Özel F., 2013, Reports on Progress in Physics, 76, 016901
- Pandel et al. (2008) Pandel D., Kaaret P., Corbel S., 2008, ApJ, 688, 1288
- Payne & Melatos (2006) Payne D. J. B., Melatos A., 2006, ApJ, 652, 597
- Piro & Bildsten (2005) Piro A. L., Bildsten L., 2005, ApJ, 629, 438
- Spitkovsky et al. (2002) Spitkovsky A., Levin Y., Ushomirsky G., 2002, ApJ, 566, 1018
- Strohmayer & Bildsten (2003) Strohmayer T., Bildsten L., 2003, ArXiv Astrophysics e-prints
- Strohmayer (1999) Strohmayer T. E., 1999, ApJ, 523, L51
- Strohmayer et al. (1998) Strohmayer T. E., Zhang W., Swank J. H. Lapidus I., 1998, ApJ, 503, L147
- Strohmayer et al. (1997) Strohmayer T. E., Zhang W., Swank J. H., 1997, ApJ, 487, L77
- Strohmayer et al. (1996) Strohmayer T. E., Zhang W., Swank J. H., Smale A., Titarchuk L., Day C., Lee U., 1996, ApJ, 469, L9
- Suleimanov et al. (2011) Suleimanov V., Poutanen J., Werner K., 2011, A&A, 527, A139
- van der Klis (1989) van der Klis M., 1989, in Ögelman H., van den Heuvel E. P. J., eds, Timing Neutron Stars Fourier techniques in X-ray timing. p. 27
- van Paradijs & Lewin (1986) van Paradijs J., Lewin H. G., 1986, A&A, 157, L10
- van Straaten et al. (2001) van Straaten S., van der Klis M., Kuulkers E., Méndez M., 2001, ApJ, 551, 907
- Vaughan et al. (1994) Vaughan B. A., van der Klis M., Wood K. S., Norris J. P., Hertz P., Michelson P. F., van Paradijs J., Lewin W. H. G., Mitsuda K., Penninx W., 1994, ApJ, 435, 362
- Watts (2012) Watts A. L., 2012, ARA&A, 50, 609
- Watts et al. (2005) Watts A. L., Strohmayer T. E., Markwardt C. B., 2005, ApJ, 634, 547
- Wijnands et al. (2001) Wijnands R., Strohmayer T., Franco L. M., 2001, ApJ, 549, L71
- Zhang et al. (2011) Zhang G., Méndez M., Altamirano D., 2011, MNRAS, 413, 1913