Novel substrates for Helium adsorption: Graphane and Graphene–Fluoride
Abstract
The discovery of fullerenes has stimulated extensive exploration of the resulting behavior of adsorbed films. Our study addresses the planar substrates graphene–fluoride (GF) and graphane (GH) in comparison to graphene. We present initial results concerning the potential energy, energy bands and low density behavior of 4He and 3He films on such different surfaces. For example, while graphene presents an adsorption potential that is qualitatively similar to that on graphite, GF and GH yield potentials with different symmetry, a number of adsorption sites double that on graphene/graphite and a larger corrugation for the adatom. In the case of GF, the lowest energy band width is similar to that on graphite but the He atom has a significantly larger effective mass and the adsorption energy is about three time that on graphite. Implications concerning the monolayer phase diagram of 4He are explored with the exact path integral ground state method. A commensurate ordered state similar to the R30o state on graphite is found the be unstable both on GF and on GH. The ground states of submonolayer 4He on both GF and GH are superfluids with a Bose Einstein condensate fraction of about 10%.
1 Introduction
Probably the best understood adsorption system is the He monolayer on graphite [1]. Experiments carried out at the University of Washington ca. 1970 revealed for the first time behavior corresponding to a two–dimensional (2D) gas. More dramatic was the appearance of a spectacular peak in the specific heat of 4He near K. This peak, well described by the 3 state Potts model, manifested a 2D transition from a high fluid to a low commensurate ( R30o) phase, providing a benchmark measure of coverage, not seen in previous adsorption experiments. This ordered phase (at density Å-2) corresponds to atoms localized on second–nearest neighbor hexagons. At higher densities near completion of the first monolayer (Å-2) an incommensurate 2D triangular solid phase is present; the phase diagram at intermediate densities is not yet completely determined. A quantitative understanding of the He–graphite interaction was made possible by precise scattering measurements of surface bound states and band structures [2].
The availability of graphene (Gr) and its derivatives like graphane (GH) [3] and graphene–fluoride (GF) [4] offers the prospect of novel adsorption phenomena. No special phenomenon is expected for He adsorbed on one side of Gr because the interaction is similar to that on graphite. The situation is different for GH and GF due to the modified symmetry of the adsorption potential. We have developed a model adsorption potential for He on GF and GH. With exact Quantum Monte Carlo methods we have studied a single 4He and 3He atom on these substrates, as well as submonolayer films of 4He at coverages similar to that (Å-2) of the R30o state on graphite.
2 Adsorption potential
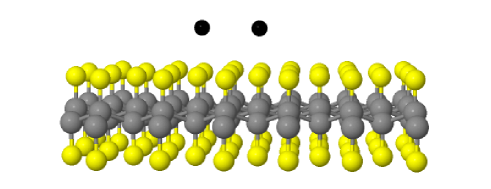
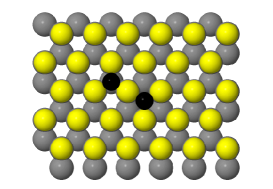
Graphane and graphene–fluoride have a similar geometry; half of the H (F) atoms are attached on one side of the graphene sheet to the carbon atoms forming one of the two sublattices of graphene. The other half are attached on the other side to the C atoms forming the other sublattice. The H (F) atoms are located on two planes (see Fig.1a); one is an overlayer located at a distance h above the pristine graphene plane while the other is an underlayer at a distance h below the graphene plane. In addition, there is a buckling of the C–plane with the C atoms of one sublattice moving upward by a distance b while the other sublattice moves downward by the same amount. A He atom approaching GH (GF) from above will interact primarily with the H (F) overlayer, but it will interact also with the C atoms and the H (F) atoms of the underlayer.
We have adopted a traditional, semi–empirical model to construct the potential energy of a single He atom at position near a surface [5, 6, 7]. The potential is written , a sum of a Hartree–Fock repulsion derived from effective medium theory, and an attraction, , which is a sum of “damped” He atom van der Waals (VDW) interactions and the polarization interaction with the surface electric field. The first term is . Here eV–bohr3 is a value derived by several workers as the coefficient of proportionality between the repulsive interaction and the substrate’s electronic charge density prior to adsorption. The geometry of GH and GF, their electronic charge density and the electrostatic potential have been obtained using Density Functional Theory with an all–electron triple numerical plus polarization basis set with an orbital cutoff of 3.7 Å as implemented in the DMol3 code [8]. The exchange and correlation potential was treated in a Generalized Gradient Approximation parametrized by Perdew, Burke, and Ernzerhof [9]. We use a tetragonal unit cell containing four C atoms and four H (F) atoms for GH and GF, respectively. The cell dimensions for GF are Å, Å, and Å, while for GH we use Å, Å, and Å. The Brillouin zone was sampled with a Monkhorst–Pack grid of k points in both cases. The self–consistent cycles were run until the energy difference was less than 10-6 eV. The atomic positions were relaxed until the forces on all atoms were lower than eV/Å. As a result, the C–F distance is Å, the C–C distance Å, the C–C distance projected on the plane is Å and the buckling displacement Å; while in GH, the C–H distance is Å, the C–C distance Å, Å and Å.
The attraction is a sum of contributions; for GH,
| (1) |
The right–most term is the induced dipole energy, where Å3 is the static polarizability of the He atom and is the electric field due to the substrate. The three VDW terms for GH originate from the H overlayer, the graphene sheet (we are neglecting in this term the small buckling of the graphene sheet) and the H underlayer, respectively. The graphene term may be written , where is the He distance from the graphene sheet and eV–Å4. Here meV–Å3 is the coefficient of proportionality entering the He–graphite VDW interaction and is the interlayer spacing of graphite. The term , a sum of individual He–H interactions, requires the use of damping because the He–H separation can be small; we have adopted the Tang–Toennies damping procedure for this situation [7] with the parameter Å-1. Also required are the VDW coefficients entering the asymptotic He–H interaction, . Here we have used the value eV–Å6, derived from the ab initio He–H2 interaction of Meyer, Hariharan and Kutzelnigg [10]. is treated similarly to but it is considered to be function of , with eV–Å4, because of the larger He distance from the H- plane ( Å). in the case of GF has an expression similar to (2) with and replaced by and by with the coefficient eV–Å6 as given by Frigo et al [11], Å-1 and eV–Å4.
With such model potentials the adsorption sites (see Fig.1b) are above the centers of each triplets of H (F) atoms of the overlayer, forming a honeycomb lattice with the number of sites equal to the number of C atoms, twice as many as those on Gr. Half of the sites are above H (F) of the underlayer but the difference between the well depths for the two kinds of adsorption sites is very small, below 1%. For GF the well depth is 498 K and for GH it is 195 K. These values do not include the induced dipole energy which gives a contribution below 1%. The inter–site energy barrier is 24 K for GF and 13 K for GH. Both values are significantly smaller than the barrier height 41K for graphite. In this last case the energy barrier does not depend much on the direction in the plane whereas in the case of GF and GH the ratio between maximum and minimum barrier height in the plane is of order of 4–5: the energy landscape of the two last substrates is characterized by a very large corrugation with narrow channels along which low potential barriers are present. The motion of the He atom, especially in the case of GF, visits only these channels , as though the atom moves in a multiconnected space. Another significant difference is that the distance between two neighboring sites is Å for GF and Å for GH whereas it is Å for graphite and for Gr. Prior to these studies, graphite was believed to be the most attractive surface for He, with a well–depth a factor of 10 greater than that on the least attractive surface (Cs). If correct, the present results reveal GF to replace graphite, since its well is a factor of 3 more attractive.
3 A single Helium atom on the substrates
We verified that the electrostatic contribution to is small so we neglected it in this first computation. We computed the exact ground state energy of one 4He atom or one 3He atom on GF and GH, see Table 1. The binding energy on GH is similar to that on graphite, whereas that on GF is about three times that on graphite. In both cases the ground state is delocalized over the full substrate and both kinds of adsorption sites are occupied with comparable probability.
Our computation is based on the Path Integral Ground State (PIGS) method [12]. With this method we can compute quantum averages of the ground state of the system using the quantum evolution in imaginary–time of a trial wave function . If is not orthogonal to the ground state, and is sufficiently long, the quantum evolution purges from the contributions of the excited states, yielding the ground state energy and wave function. A valuable feature of the PIGS method is that it is exact, in principle; the results are independent of [13] and systematic errors may be reduced below the statistical uncertainty. An additional feature of PIGS is that it can be used for a single particle as well as for many–body Bose systems like the system in the study reported in sect. 3.
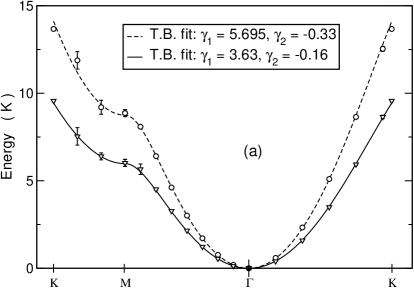
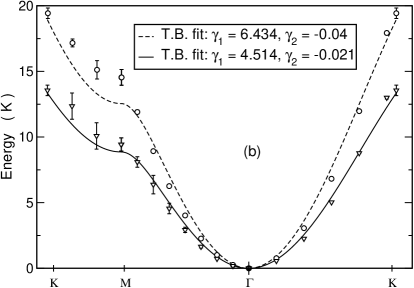
With the PIGS method one can compute also imaginary–time correlation functions like the density–density one in Fourier space at imaginary time : , . Here is the position of the atom at imaginary time . contains information on the excited states of the system. The state of wave vector of the lowest energy band has a dominant role in and its energy can be estimated via Laplace inversion using powerful inversion methods [14]. The computed energy spectrum along the directions K and M for He on GF and on GH is shown in Fig.2. These bands are represented rather accurately by a tight binding model with nearest and next nearest coupling [18]. For comparison we have computed with this same method the band energy for He on graphite finding substantial agreement with the Carlos and Cole result for the lowest band [15]. The bandwidths of He on these three substrates are given in Table 1.
| \brSystem | (K) | (K) | (K) | (K) |
|---|---|---|---|---|
| \mr4He+GF | 46.78(2) | -422.94(1) | -376.16(3) | 9.6(1) |
| 3He+GF | 51.08(1) | -413.41(1) | -362.33(1) | 13.7(1) |
| \mr4He+GH | 20.51(1) | -153.58(1) | -133.07(2) | 13.6(4) |
| 3He+GH | 22.53(1) | -149.50(1) | -126.97(3) | 19.4(4) |
| \mr4He+Gr | 25.30(4) | -168.49(1) | -143.19(4) | 9.6(2) |
| 3He+Gr | 27.05(2) | -162.87(1) | -135.82(2) | 15.7(4) |
| \br |
The effective masses of the various systems reflect the varying corrugations of the potentials. For 4He (3He), the ratios of to the bare mass are 1.40 (1.25), 1.10 (1.08) and 1.05 (1.01) on GF, graphite and GH, respectively. The smaller mass enhancement of 3He than 4He reflects the smaller ratio of the corrugation potential to the translational zero–point energy.
4 Ground state of submonolayer 4He on GF
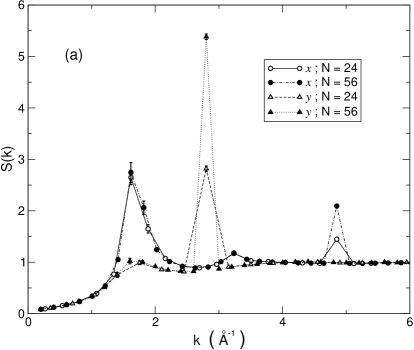
We have studied a 4He submonolayer on GF. As He–He interaction we have used an Aziz potential [16]. The ground state has been computed for a number of 4He atoms from 22 to about 100 spanning the density range =0.04–0.09 Å-2. On graphite the ground state is the commensurate R30o state with filling factor 1/3 of the adsorption sites. A similar state on GF is obtained by populating fourth neighbor sites (this corresponds to second neighbors in one of the sublattices of the honeycomb at a distance 4.482 Å) with a filling factor of the adsorption sites equal to and it corresponds to a density Å-2. Notice that this density is smaller than the Å-2 on graphite due to the dilation of the C plane in GF. We find that this ordered state is unstable: starting the simulation from an ordered configuration after a short Monte Carlo evolution the Bragg peaks corresponding to the R30o state disappear and the system evolves into a disordered fluid state modulated by the substrate potential. at this density is plotted in Fig.3a as function of and for two numbers of particles: the intensity of some of the peaks do not depend on so they are due to short range order, others scale roughly as and arise from the modulation of the density due to the adsorption potential. The energy has a minimum value K per atom at the density Å-2. This lies 1.5 K below the single particle energy, implying that the ground state is a self–bound liquid. For comparison, we note that the strictly 2D cohesive energy of 4He [17] is just 0.84 K and the equilibrium density is Å-2.
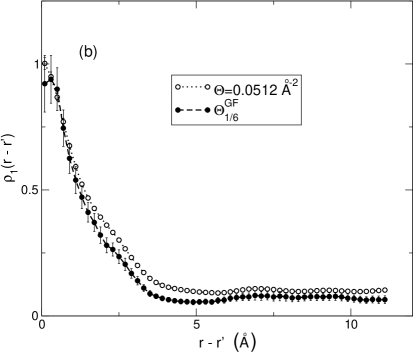
We have computed the off diagonal one body density matrix . As can be seen in Fig.3b reaches a plateau at large and the Bose Einstein condensate (BEC) fraction is % at Å-2 and % at ; the system is superfluid. We reach a similar conclusion in the case of the GH substrate: the ground state is a liquid with density Å-2 and K per atom and the BEC fraction is % near the equilibrium density and % at Å-2. Note that this condensate fraction is significantly smaller than the value ( %) for 4He in 2D [17]. The smaller value is a consequence of the spatial order, albeit imperfect, induced by the substrate potential and of the smaller effective surface available to the atoms due to the strong channeling induced by that potential.
5 Discussion
He adsorption on new substrate materials is valuable because of the fundamental importance of helium in many–body physics, with a variety of phases seen in both 2D and 3D. Our results indicate that the GF substrate provides the strongest binding of any surface (since the previous record was held by graphite). Moreover, the novel symmetry, the smaller intersite distance and large corrugation imply that quite novel properties may be anticipated for this system. This is indeed the case. When many 4He atoms are adsorbed on GF and on GH the most striking result is that the ground state is a low density liquid modulated by the substrate potential and the system has BEC, i.e. it is a superfluid. This is qualitatively different from graphite for which the lowest energy state is the R30o commensurate one with no BEC [19]. We have verified that such an ordered state on GF and GH is unstable relative to the liquid phase. In subsequent work we will provide predictions concerning the phase diagrams and thermodynamic properties for both He/GF and He/GH, hoping to stimulate experimental studies of these systems.
It should be noticed that some of the parameters in the adsorption potential are not known with high precision or they have been adopted from other systems. We have verified that even a change of parameters like , and by 10–20% does not modify the qualitative behavior of the adsorbed He atoms even if there can be a sizable change in the value, for instance, of the adsorption energy. Measurement of thermodynamic properties and He atomic beam scattering experiments from GF and GH will be important to test the accuracy of our model potentials.
Acknowledgements
This work has been supported by Regione Lombardia and CILEA Consortium through a LISA Initiative (Laboratory for Interdisciplinary Advanced Simulation) 2010 grant [http://lisa.cilea.it]. Chris Billman and Jorge Sofo are partially supported by the Donors of the Petroleum Research Fund administrated by the American Chemical Society.
References
References
- [1] Dash J G, Schick M and Vilches O E 1994 Surf. Sci. 299/300 405-414
- [2] Cole M W, Frankl D R and Goodstein D L 1981 Rev. Mod. Phys. 53 199; Boato G and Cantini P 1983 Adv. Electronics and Electron Phys. 60 95
- [3] Sofo J O, Chaudhari A S and Barber G D 2007 Phys. Rev. B75 153401
- [4] Nain R R et al. 2010 Small 6 2877; Zbor̆il R et al. 2010 Small 6 2885
- [5] Stott M J and Zaremba E 1980 Phys. Rev. B22 1564; Cole M W and Toigo F 1985 Phys. Rev. B31 727
- [6] Vidali G, Cole M W and Schwartz C 1979 Surf. Sci. 87 L273
- [7] Tang K T and Toennies J P 1984 J. Chem. Phys. 80 3726
- [8] Delley B 1990 J. Chem. Phys. 92 508 and 2000 J. Chem. Phys. 113 7756
- [9] Perdew J P, Burke K and Ernzerhof M 1996 Phys. Rev. Lett. 77 3865
- [10] Meyer W, Hariharan P C and KutzelniggW 1980 J. Chem. Phys. 73 1880
- [11] Frigo A, Toigo F, Cole M W and Goodman F O 1986 Phys. Rev. B 33 4184
- [12] Sarsa A, Schmidt K E and Magro W R 2000 J. Chem. Phys. 113 1366
- [13] Rossi M, Nava M, Reatto L and Galli D E 2009 J. Chem. Phys. 131 154108
- [14] Vitali E, Rossi M, Reatto L and Galli D E 2010 Phys. Rev. B82 174510
- [15] Carlos W E and Cole M W 1980 Phys. Rev. B21 3713
- [16] Aziz R A et al. 1979 J. Chem. Phys. 70 4330
- [17] Whitlock P A, Chester G V and Kalos M H 1988 Phys. Rev. B38 2418
- [18] Castro Neto et al. 2009 Rev. Mod. Phys. 81 109
- [19] Buzzacchi M, Galli D E and Reatto L 2002 J. Low Temp. Phys. 126 205