Dead Zones around Young Stellar Objects: FU Orionis Outbursts and Transition Discs
Abstract
We perform global time-dependent simulations of an accretion disc around a young stellar object with a dead zone (a region where the magneto-rotational instability cannot drive turbulence because the material is not sufficiently ionised). For infall accretion rates on to the disc of around , dead zones occur if the critical magnetic Reynolds number is larger than about . We model the collapse of a molecular gas cloud. At early times when the infall accretion rate is high, the disc is thermally ionised and fully turbulent. However, as the infall accretion rate drops, a dead zone may form if the critical magnetic Reynolds number is sufficiently large, otherwise the disc remains fully turbulent. With a dead zone the disc can become unstable to the gravo-magneto instability. The mass of the star grows in large accretion outbursts that may explain FU Orionis events. At late times there is not sufficient mass in the disc for outbursts to occur but the dead zone becomes even more prominent as the disc cools. Large inner dead zones in the later stages of disc evolution may help to explain observations of transition discs with an inner hole.
keywords:
accretion, accretion discs – planetary systems: protoplanetary discs – stars: pre-main-sequence – circumstellar matter1 Introduction
The core of a protostellar molecular cloud collapses to form a low-mass protostar with a disc on a timescale of a few (Shu, Adams & Lizano, 1987). Angular momentum is transported outwards through the disc by turbulence, thus allowing material to accrete on to the central star (Pringle, 1981). Turbulence in accretion discs may be driven by the magneto-rotational instability (MRI, Balbus & Hawley, 1991) but can be suppressed by a low ionisation fraction (Gammie, 1996; Gammie & Menou, 1998). The inner parts of the disc may be hot enough to be thermally ionised and fully MRI active (turbulent). Further out, where the disc is cooler, a dead zone forms at the midplane. In this region the MRI cannot drive turbulence. The surface layers of the disc are ionised by cosmic rays or X-rays from the star and may remain turbulent (e.g. Sano et al., 2000; Matsumura & Pudritz, 2003). A second form of turbulence may also be driven by gravitational instability if the disc becomes massive enough (Paczynski, 1978; Lodato & Rice, 2004).
Previously, time-dependent numerical disc simulations have used a simple description for the extent of the dead zone (Armitage, Livio & Pringle, 2001; Zhu et al., 2010a; Zhu, Hartmann & Gammie, 2010b). They assume that cosmic rays penetrate a constant surface density in the disc surfaces and are attenuated exponentially with a stopping depth of less than (e.g. Umebayashi & Nakano, 1981; Zhu, Hartmann & Gammie, 2009; Terquem, 2008; Matsumura, Pudritz & Thommes, 2009). A more realistic way to determine the dead zone extent is with a magnetic Reynolds number. Turbulence is suppressed if the magnetic Reynolds number is less than some critical value (Fleming, 2000). However, as we discussed in a preceding paper (Martin et al., 2012, MLLP1), the critical value is uncertain. The magnetohydrodynamical (MHD) simulations of Fleming (2000) suggest it is of the order of if there is no magnetic flux through the disc, but it may be close to 100 if there is a magnetic flux. The linear stability analysis of Wardle (1999) and Balbus & Terquem (2001) suggest it may be as small as , but conditions for linear stability are not necessarily the same as those for maintaining turbulence (Balbus & Hawley, 2000). In MLLP1 we showed that a constant surface density in the active layer may only be a good approximation for a disc with a low critical magnetic Reynolds number of around 1. Even then, the surface density of the layer may be much larger than the constant values that have been assumed, that were less than about .
The luminosity of the protostar depends upon the accretion rate through the disc. The typical bolometric luminosity of protostars is much smaller than would be expected from the observed infall rate and duration of the protostellar phase (Kenyon et al., 1990). Time-dependent accretion is thought to be a solution to this luminosity problem. Observational evidence for this scenario has been seen in FU Orionis systems that show outbursts with a peak accretion rate of around lasting a timescale of years to decades (Herbig, 1977; Hartmann & Kenyon, 1996). A plausible explanation for FU Orionis outbursts is a disc instability resulting from the formation of a dead zone, known as the gravo-magneto instability. The MRI turbulent active layers of the disc supply material to the dead zone that builds up until it becomes self-gravitating. Self-gravity drives a second type of turbulence that can dissipate sufficient heat for the MRI to be triggered. The now very high surface density disc flows on to the central star in an accretion outburst. The disc then cools, the dead zone re-forms and the cycle repeats (Armitage, Livio & Pringle, 2001; Zhu, Hartmann & Gammie, 2009). This process can be understood as a limit cycle (Martin & Lubow, 2011a). There are two steady state solutions, one with a fully turbulent disc and a second that is self-gravitating. There is a range of accretion rates for which no steady state disc solution exists. The outbursts can be explained as transitions between the two steady solutions in a state diagram that plots the accretion rate through the disc against the surface density at a fixed radius.
In the later stages of disc evolution, the infall accretion slows. There is not enough mass flowing through the disc for the gravo-magneto instability to operate on a reasonable timescale yet there may still be a dead zone present. Observations of protostellar discs show that about five to ten percent are transition discs (Skrutscki et al., 1990). These have no significant near-IR excess compared to younger discs and are thought to have a hole in the inner regions up to sizes of several tens of AU (e.g. Calvert et al., 2002; Forrest et al., 2004). There is still some gas accretion on to the star but no dust is observed there. There have been several models suggested to explain these discs such as planets (Rice et al., 2003), disc evolution (Dullemond & Dominik, 2005), disc clearing (Clarke, Gendrin & Sotomayor, 2001; Alexander, Clarke & Pringle, 2006) and the presence of companions (Jensen & Mathieu, 1997). Alexander & Armitage (2009) suggest that young discs contain a planet whereas the older ones may be undergoing disc clearing. We consider an additional possibility that transition discs may contain a large dead zone that causes a sharp transition in the surface density of the disc and allows only a small amount of accretion on to the central star.
In Section 2 we describe the layered disc model. In Section 3 we find fully turbulent steady state disc solutions with a constant infall accretion rate and consider parameters for which a dead zone can form. In Section 4 we solve the time-dependent layered accretion disc equations and find the evolution of a system with a dead zone and a constant infall accretion rate. In Section 5 we model the infall accretion rate from a collapsing gas cloud and consider disc parameters necessary for the gravo-magneto instability to explain observed FU Orionis outbursts. In Section 6 we discuss implications of a dead zone model for transition disc observations.
2 Layered Disc Model


In an accretion disc, material orbits the central mass, , at Keplerian velocity at radius with angular velocity (Lynden-Bell & Pringle, 1974; Pringle, 1981). We use a one-dimensional layered disc model to follow the time evolution of the total surface density, , and midplane temperature, as described by equations 1-8 in Martin & Lubow (2011a) but we do not assume a constant surface density in the active layer. Instead, we use the analytic approximations for the active layer surface density given in equations 26 and 27 in MLLP1. These are approximations to the solution of the equation , assuming that cosmic rays are the dominant source of ionisation. We note that this description assumes Ohmic resistivity is the dominant non-ideal MHD effect. However, recent works suggest that ambipolar diffusion and the Hall effect may determine the active layer (e.g. Perez-Becker & Chiang, 2011a, b; Bai & Stone, 2011). Wardle & Salmeron (2011) find the Ohmic resistivity term provides an average value for the active layer surface density for a range of vertical magnetic fields. Because Ohmic resistivity also has the advantage of being independent of the magnetic field (Fleming, 2000) we consider only this effect here. We note that other sources of turbulence, such as the baroclinic instability (e.g. Klahr & Bodenheimer, 2003; Lyra & Klahr, 2011), have been suggested to generate viscosity within the dead zone. However, in this work we we assume there is no turbulence within the dead zone.
In MLLP1 we found that the dead zone extent is not significantly affected by variation in the metallicity and hence we use the high metallicity limit for the electron fraction (see equation 19 in MLLP1) and consider changes in the critical magnetic Reynolds number. The active layer has a surface density , temperature and viscosity parametrised with the prescription by
| (1) |
(Shakura & Sunyaev, 1973), where the sound speed in the active layer is
| (2) |
where is the Boltzmann constant and is the mean molecular mass. We approximate the disc scale height by and so
| (3) |
The Shakura & Sunyaev (1973) parameter still has some uncertainty. 111We note that it may be more realistic to take where is the local scale height in the layer. The scale height in the active layer should be at the base of the active layer and so typically . As mass builds up in the dead zone, the magnetic surface layer will lie further above the disc midplane, resulting in higher local gravity and a smaller scale height. This means that the parameter we take is effectively increased to . For example if we have and then the effective parameter in the active layer is larger, . This should be investigated further in future work. Numerical MHD simulations find (Brandenburg et al., 1995; Stone et al., 1996) but observations suggest (King, Pringle & Livio, 2007). If the disc is fully turbulent the single layer has and . However, where a dead zone exists the disc has two layers and the complementary region is defined with surface density and temperature . The dead layer may become self-gravitating if , where the Toomre parameter is
| (4) |
the sound speed at the midplane is
| (5) |
and we take . Self-gravity drives a second effective viscosity in the disc as explained in Martin & Lubow (2011a).
In MLLP1, we found that the active layer surface density may be significantly smaller than that assumed by the constant prescription, especially at the inner edge of the dead zone. The active layer may become optically thin and this affects the relationship between the layer temperatures. The optical depth of the turbulent layer is
| (6) |
where is the opacity and the density is approximated as with scale height . The optical depth within the complementary region, if it exists, is
| (7) |
where the density is and the scale height is . The total optical depth of the disc is
| (8) |
the sum of the optical depths of the two layers.
In this work we consider two different opacity prescriptions. The first is a simple power law in temperature
| (9) |
(Armitage, Livio & Pringle, 2001; Martin & Lubow, 2011a). This is useful for finding analytic solutions because it does not depend on the density of the disc. It is the opacity in the tables of Bell & Lin (1994) around the temperature where the MRI is triggered of around (see Umebayashi, 1983; Gammie, 1996). The second is the full opacity shown in table 1 of Zhu, Hartmann & Gammie (2009) that depends on both the temperature and the density of the disc.
If the active layer is optically thick, the opacity , the temperatures in the layers are found with
| (10) |
where is the surface temperature, and
| (11) |
However, if the active layer is optically thin, , we take and
| (12) |
The active layer may be optically thin in the inner parts of the disc where the layer is thinnest.
With a large active layer surface density the inner parts of the disc remain hot enough for thermal ionisation. However, when the dead zone is determined by a critical magnetic Reynolds number the active layer can become very thin and the inner parts of the disc provide little accretional heating. In this case, heating from the star may dominate the accretional heating. We consider this further in Section 4.3 but find it makes little difference except for radii .
3 Analytical Steady State Discs
For sufficiently small critical magnetic Reynolds numbers a steady state disc solution exists that is fully turbulent, thus everywhere. There is no complementary region, , and the temperatures are related with and
| (13) |
For a fully turbulent disc, the surface density is found with
| (14) |
(Pringle, 1981), where is the steady accretion rate through the disc. There is a zero torque inner boundary condition applied at where the mass falls freely on to the star. Similarly, the surface temperature is found with
| (15) |
(Pringle, 1981). In this section, we use the simplified power law opacity given in equation (9) so that we can easily solve equations (13), (14) and (15) analytically for the surface density and temperature in the disc. With this fully turbulent disc solution, we check if the solution has a dead zone (we solve ). If it does, then the steady state does not exist and we expect time dependent accretion (see Section 4).
In Fig. 1 we show the steady state surface density of the disc around a star of mass for varying infall accretion rates with critical magnetic Reynolds number and with on the left and on the right. For larger , the steady state surface density is smaller. Unless the accretion rate is very small, there is no dead zone for .

In Fig. 2 we show the corresponding disc temperatures, for the fully turbulent disc, that decrease with the infall accretion rate. Because the active layer surface density decreases with temperature (MLLP1) the active layer surface density also decreases with the infall accretion rate. In a time dependent disc, this steady solution can only exist if the disc is fully turbulent.
In MLLP1 we found that the active layer surface density is only sensitive to the temperature and not the total surface density. The temperature in the steady state disc found here is higher than often considered in static discs (e.g. Fromang, Terquem & Balbus, 2002; Matsumura & Pudritz, 2003). The new result is that for time evolving discs, dead zones exist only for large critical magnetic Reynolds number. In order to investigate discs with large critical magnetic Reynolds numbers, and hence dead zones, we must solve the time-dependent accretion disc equations.
4 Time-Dependent Simulations
We solve numerically the time-dependent layered accretion disc equations with a one-dimensional code similar to Martin & Lubow (2011a). The disc around a star of mass extends from up to (see e.g. Armitage, Livio & Pringle, 2001; Martin & Lubow, 2011a, b). The grid has 200 points distributed uniformly in so that at each radius the grid point separation is . Material is continuously added to the disc at a radius of at a rate . The inner edge of the disc has a zero torque inner boundary condition and the outer edge has a zero radial velocity boundary condition that prevents outward flow. The initial conditions do not have any effect on the outcome because we evolve the disc until it reaches a steady state or a limit cycle in the accretion rate. We consider both the simple power law opacity given in equation (9) and also a full opacity given in table 1 of Zhu, Hartmann & Gammie (2009) in our numerical models.


4.1 Small Critical Magnetic Reynolds Number
Only with large critical magnetic Reynolds numbers does a dead zone exist in the steady state disc. However, our analytical models in the previous section used only the simple power law opacity. In this Section, we numerically evolve the disc until it reaches a steady state (with no dead zone) in order to examine properties of a disc with the full opacity prescription.
In Fig. 3 we show the surface density of the fully turbulent steady state disc with an infall accretion rate of and . The simple power law opacity approximates well the analytical solutions shown. In the outer parts of the disc, the numerical solutions have a zero radial velocity condition imposed that alters the solution slightly from the analytical one. We also show a simulation for a disc with the full opacity table. The inner parts of the disc are significantly more massive than with the simple opacity law. However, these parts are hot enough to be thermally ionised.
In Fig. 3 we also show the midplane and surface temperatures of the steady state disc. The numerical simulation with the simple opacity law approximates well the analytical steady state solution. The simulation with the full opacity table shows that the inner parts of the disc may be slightly cooler compared with the simple opacity law. However, further out in the disc where dead zone formation occurs the power law is a reasonable approximation to the full opacity. Hence, even though we have taken a simple opacity law in the previous section, it does not change our conclusion significantly that dead zones will only form for large critical magnetic Reynolds numbers unless the accretion rate is very small (we have also verified this numerically).
4.2 Large Critical Magnetic Reynolds Number
For sufficiently large critical magnetic Reynolds number, the steady state disc solution contains a dead zone. Hence, it cannot be in steady state and we expect the disc to be unstable to the gravo-magneto instability. This results in outbursts in the accretion rate on to the central object (Gammie, 1996; Armitage, Livio & Pringle, 2001; Zhu, Hartmann & Gammie, 2009). We use the analytic approximation for the active layer surface density given in equations 26 and 27 in MLLP1 that is valid for . We choose , and so that we can compare with previous work with a constant surface density in the active layer. We use the simple power law opacity because we have seen in Section 4.1 that it makes little difference except to the hottest parts of the disc which are already thermally ionised and fully turbulent.
In Fig. 4 we show the accretion rate on to the central star. When the dead zone is present, the accretion rate on to the star is extremely low. The accretion outbursts occur on a timescale of and a mass of around is accreted during each. After a few outbursts the disc reaches a limit cycle that repeats itself. Following Martin & Lubow (2011a) and Lubow & Martin (2012), in Fig. 5 we show the limit cycle in the plane at a radius of . The steady accretion rate corresponds to the steady surface temperature in equation (15). The disc moves in an anti-clockwise direction around the cycle. In the dead zone branch, the active layer deposits material on to the dead zone and as a result, the surface density increases along the branch. The accretion rate decreases with increasing surface density because the active layer decreases. The disc becomes self-gravitating along the gravo-magneto (GM) branch. The temperature, and hence accretion rate, begins to rise as the surface density continues to increase. The disc eventually becomes hot enough for thermal ionisation to take place at some radius and the MRI is triggered at the end of the GM branch. The disc moves quickly to the upper MRI branch. Now the accretion rate on to the star is much larger than the accretion on to the disc and so the accretion rate declines as the surface density decreases. The dead zone re-forms, the disc quickly transitions down to the dead zone branch and the cycle repeats.


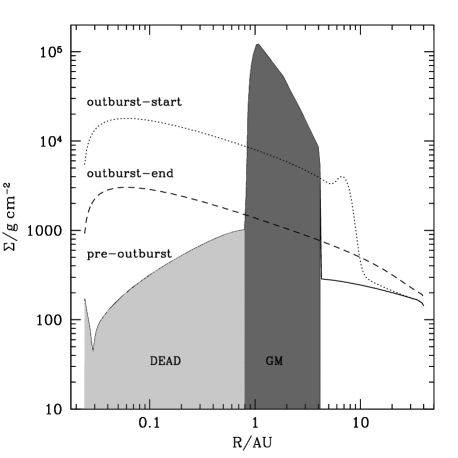
In Fig. 6 we show the surface density and midplane temperature of the disc just before an outburst and during an outburst. There is very little mass in the inner parts of the accretion disc. This is different to the disc with a constant (and large) surface density in the active layer. The active layer here is very thin and little mass flows around the dead zone. Material in the dead zone builds up and peaks in the disc where it becomes self-gravitating. The temperatures also peak at this radius. The MRI is first triggered at the peak and the outburst begins. We have found that the gravo-magneto instability mechanism is the same no matter how the extent of the dead zone is determined.
4.3 Irradiation from the star
When the active layer is very thin, in the innermost parts of the disc the accretional heating may be dominated by the heating from the star. The flux of radiation is
| (16) |
where
| (17) |
(Chiang & Goldreich, 1997) and we take the radius of the star to be and the temperature . If the midplane temperature of the disc drops below the irradiation temperature
| (18) |
then we assume that the disc is isothermal and set .
When we include this term the inner parts of the disc are warmer and as a result, up to a radius of around the disc is thermally ionised. However, because the innermost part of the dead zone still has a very small active layer, the accretion rate on to the star remains small. For example, for the model in the previous section, without the irradiation term we find that the accretion rate between outbursts is around whereas with the effects of irradiation this increases to around . This is still significantly too small to account for the T Tauri accretion rates that are thought to be around at an age of (Valenti, Basri & Johns, 1993; Hartmann et al., 1998). For the rest of this work we ignore the heating from the star because is only affects a very small part of the disc.

5 FU Orionis Outbursts
In a collapsing molecular cloud the accretion rate on to the disc will not be constant in time. We follow Armitage, Livio & Pringle (2001) who use a simple model for the the protostellar accretion history. At early times the infall rate is expected to be where is the sound speed in the cloud (Shu, 1977). For a temperature of , this is around . We assume that the accretion rate declines exponentially in time
| (19) |
where we take the initial accretion rate to be . At this time, we begin with an initially fully turbulent steady state accretion disc. The free fall timescale is
| (20) |
where is the cloud density. We take (Armitage, Livio & Pringle, 2001).
With a star formation rate predicted by Miller & Scalo (1979), theoretically, Hartmann & Kenyon (1985) predict that each FU Orionis system should show around ten outbursts during its lifetime. In Fig. 7 we show the accretion rate on to the central star as a function of time for the infall accretion rate on to the disc given in equation (19) with and three different critical magnetic Reynolds numbers. In all cases, initially the disc is fully turbulent and the accretion on to the star proceeds at a rate close to . However, once a dead zone forms, the accretion rate drops. For a solar mass star with a disc with , the critical magnetic Reynolds number must be of the order of a few times for a significant number of outbursts to occur. For the lowest critical magnetic Reynolds number shown of , a dead zone forms once the infall accretion rate has dropped to about . However, at this time there is not enough material in the disc for outbursts to occur.
In Fig. 8 we show the accretion rate on to the star for and . For a higher we need an even larger critical Reynolds number for outbursts to occur. We note that the evolution is also dependent on the mass of the star. The active layer surface density decreases as the mass of the central star increases (MLLP1). Increasing the mass of the central star has the same effect as increasing the critical magnetic Reynolds number. So, for larger mass stars, dead zones will form for a smaller critical magnetic Reynolds number.


If the observed FU Orionis outbursts are driven by the gravo-magneto instability, then the critical magnetic Reynolds number must be very large, of order a few . The outbursts are similar to those previously found with a model with constant surface density in the active layer. However, we predict a very small accretion rate in between outbursts. We should try to observe FU Orionis systems in quiescence in order to draw conslusions about the surface density in the active layer. It is possible that effects such as ambipolar diffusion or the Hall effect could play a role in increasing the active layer surface density in the inner regions and this should be investigated in future work.
6 Transition Discs
At later times of disc evolution, the infall accretion rate on to the disc slows and the mass and temperature of the disc both decrease. A dead zone determined by a critical magnetic Reynolds number becomes more prominent as the disc cools (e.g. see Fig. 1). However, with the constant active layer surface density previously assumed this is not the case. The constant active layer model predicts that when the surface density drops below the critical value (of around ) the whole disc becomes turbulent. The increasingly large dead zone found with a critical magnetic Reynolds number has implications for low mass discs in the later stages of evolution.
After the infall on to the disc ends, there is not sufficient accretion through the disc for it to build up enough material for accretion outbursts (see for example top pannel in Fig. 7). We have investigated this numerically and find the surface density and temperature distributions are similar to the pre-outburst distribution shown in Fig. 6. The inner parts of the disc, that are mostly dead, are depleted by several orders of magnitude compared with the outer parts that are self-gravitating. Similarly the temperature is several orders of magnitude smaller in the inner regions. Only a small amount of material can flow through the thin active layer on top of the dead zone. The depleted inner parts of the disc could appear to form a hole at the inside on the viscous timescale
| (21) | ||||
| (22) | ||||
| (23) |
This is very short compared with the lifetime of the disc.
A large dead zone could help to explain observed transition objects without the need for a photoevaporation model. The surface density distribution is qualitatively similar to that shown in Figure 1 in Clarke, Gendrin & Sotomayor (2001) for their ultra violet switch photoevaporation model. However, that model takes a few years to form the inner hole whereas the dead zone model forms a hole much more quickly. We have not included dust grains in our models. These suppress the ionisation of the disc further leading to a larger dead zone (e.g. Bai & Goodman, 2009; Perez-Becker & Chiang, 2011a; Bai & Stone, 2011). The dead zone model should be investigated further in future work with respect to observations of transtion discs.
7 Conclusions
We have presented global time-dependent calculations of circumstellar discs with a dead zone determined by a critical magnetic Reynolds number. For infall accretion rates around , if the critical magnetic Reynolds number is larger than about , the disc around a young stellar object forms a dead zone. If the critical magnetic Reynolds number is smaller, then the disc is fully turbulent.
If the infall accretion rate is sufficiently high when a dead zone forms, the disc becomes unstable to the gravo-magneto instability. The outburst behaviour is similar to that found previously by assuming a constant active layer surface density. If the gravo-magneto instability is responsible for FU Orionis outbursts, then the critical magnetic Reynolds number must be greater than a few .
A disc model with a dead zone determined by a critical magnetic Reynolds number predicts a very low accretion rate between outbursts that was not predicted with the constant active layer surface density assumption. This low quiescent rate should be observed both before and after FU Orionis outbursts take place. Alternatively, the accretion rate the model predicts may be increased if effects such as ambipolar diffusion or the Hall effect are included.
The size of a dead zone in a disc increases as the disc cools. We suggest that large inner dead zones may help to explain observations of the depleted inner regions of transition discs. However, there are some limitations to the model used here. Some of these have already been discussed in Martin & Lubow (2011a) and MLLP1. There is much more work to be done in future to establish criteria for the formation of dead zones. This is not straightforward because it depends on assumptions about the magnetic field and the still unresolved problem of the viscosity parameter. Once the criteria are established, the evolution of a protostellar disc should be computed, from times of high infall rates to late time disc dissipation.
Acknowledgements
RGM thanks the Space Telescope Science Institute for a Giacconi Fellowship. SHL acknowledges support from NASA grant NNX07AI72G. JEP thanks the Collaborative Visitor Program at STScI for its support and hospitality
References
- Alexander & Armitage (2009) Alexander R. D., Armitage P. J., 2009, ApJ, 704, 989
- Alexander, Clarke & Pringle (2006) Alexander R. D., Clarke, C. J., Pringle, J. E. 2006, MNRAS, 369, 229
- Armitage, Livio & Pringle (2001) Armitage P. J., Livio M., Pringle J. E., 2001, MNRAS, 324, 705
- Bai & Goodman (2009) Bai X. N., Goodman J. 2009, ApJ, 701, 737
- Bai & Stone (2011) Bai X., Stone J. M., 2011, ApJ, 736, 144
- Balbus & Hawley (1991) Balbus S. A., Hawley J. F., 1991, ApJ, 376, 214
- Balbus & Hawley (2000) Balbus S. A., Hawley J. F., 2000, in Benz W., Kallenbach R., Lugamair G. W., eds, ISSI Space Sci. Ser. 9, From Dust to Terrestrial Planets, Kluwer, Dordrecht, p. 39
- Balbus & Terquem (2001) Balbus S. A., Terquem C., 2001, ApJ, 552, 235
- Bell & Lin (1994) Bell K. R., Lin D. N. C., 1994, ApJ, 427, 987
- Brandenburg et al. (1995) Brandenburg A., Nordland A., Stein R. F., Torkelsson U., 1995, ApJ, 446, 741
- Calvert et al. (2002) Calvet N., D’Alessio P., Hartmann L., Wilner D., Walsh A., Sitko M., 2002, ApJ, 568, 1008
- Chiang & Goldreich (1997) Chiang E. I., Goldreich P., 1997, ApJ, 490, 376
- Clarke, Gendrin & Sotomayor (2001) Clarke C., Gendrin A., Sotomayor M., 2001, MNRAS, 328, 485
- Dullemond & Dominik (2005) Dullemond C. P., Dominik C., 2005, A&A, 434, 971
- Fleming (2000) Fleming T. P., Stone J. M., Hawley J. F., 2000, ApJ, 530, 464
- Forrest et al. (2004) Forrest W. et al., 2004, ApJS, 154, 443
- Fromang, Terquem & Balbus (2002) Fromang S., Terquem C., Balbus S. A., 2002, MNRAS, 329, 18
- Gammie (1996) Gammie C. F., 1996, ApJ, 457, 355
- Gammie & Menou (1998) Gammie C. F., Menou K., 1998, ApJ, 492, 75
- Gullbring et al. (1998) Gullbring E., Hartmann L., Briceño C., Calvet N., 1998, ApJ, 492, 323
- Hartmann & Kenyon (1985) Hartmann L., Kenyon S. J., 1985, ApJ, 299, 462
- Hartmann & Kenyon (1996) Hartmann L., Kenyon S. J., 1996, ARA&A, 34, 207
- Hartmann et al. (1998) Hartmann L., Calvet N., Gullbring E., D’Alessio P., 1998, ApJ, 495, 385
- Herbig (1977) Herbig G. H., 1977, ApJ, 217, 693
- Jensen & Mathieu (1997) Jensen E. L. N., Mathieu R. D., 1997, AJ, 114, 301
- Kenyon et al. (1990) Kenyon S. J., Hartmann L. W., Strom K. M., Strom S. E., 1990, AJ, 99, 869
- King, Pringle & Livio (2007) King A. R., Pringle J. E., Livio M., 2007, MNRAS, 376, 1740
- Klahr & Bodenheimer (2003) Klahr H. H., Bodenheimer P., 2003, ApJ, 582, 869
- Lodato & Rice (2004) Lodato, G., Rice, W. K. M. 2004, MNRAS, 351, 630
- Lubow & Martin (2012) Lubow S. H., Martin R. G., 2012, submitted
- Lynden-Bell & Pringle (1974) Lynden-Bell D., Pringle J. E., 1974, MNRAS, 168, 60
- Lyra & Klahr (2011) Lyra W., Klahr H., 2011, A&A, 2011, A&A, 527, 138
- Martin & Lubow (2011a) Martin R. G., Lubow S. H., 2011a, ApJ, 740, L6
- Martin & Lubow (2011b) Martin R. G., Lubow S. H., 2011b, MNRAS, 413, 1447
- Martin et al. (2012) Martin R. G., Lubow S. H., Livio M., Pringle J. E., 2012, MNRAS, 420, 3139 (MLLP1)
- Matsumura & Pudritz (2003) Matsumura S., Pudritz R. E., 2003, ApJ, 598, 645
- Matsumura, Pudritz & Thommes (2009) Matsumura S., Pudritz R. E., Thommes E. W., 2009, ApJ, 691, 1764
- Miller & Scalo (1979) Miller G. E., Scalo J. M., 1979, ApJS, 41, 513
- Paczynski (1978) Paczynski, B. 1978, Acta Astron., 28, 91
- Perez-Becker & Chiang (2011a) Perez-Becker D., Chiang E., 2011a, ApJ, 727, 2
- Perez-Becker & Chiang (2011b) Perez-Becker D., Chiang E., 2011b, ApJ, 735, 8
- Pringle (1981) Pringle J. E., 1981, ARA&A, 19, 137
- Rice et al. (2003) Rice W. K. M., Wood K., Armitage P. J., Whitney B. A., Bjorkman J. E., 2003, MNRAS, 342, 79
- Sano et al. (2000) Sano T., Miyama S. M., Umebayashi T., Nakono T., 2000, ApJ, 543, 486
- Shakura & Sunyaev (1973) Shakura N. I., Sunyaev R. A., 1973, A&A, 24, 337
- Shu (1977) Shu F. H., 1977, ApJ, 214, 488
- Shu, Adams & Lizano (1987) Shu F. H., Adams F. C., Lizano S., 1987, ARA&A, 25, 23
- Skrutscki et al. (1990) Skrutskie M. F., Dutkevitch D., Strom S. E., Edwards S., Strom K. M., Shure M. A., 1990, AJ, 99, 1187
- Stone et al. (1996) Stone J. M., Hawley J. F., Gammie C. F., Balbus S. A., 1996, ApJ, 463, 656
- Terquem (2008) Terquem C. E. J. M. L. J., 2008, ApJ, 689, 532
- Umebayashi (1983) Umebayashi T., 1983, Prog. Theor. Phys., 69, 480
- Umebayashi & Nakano (1981) Umebayashi T., Nakano T., 1981, PASJ, 33, 617
- Valenti, Basri & Johns (1993) Valenti J. A., Basri G., Johns C. M., 1993, AJ, 106, 2024
- Wardle & Salmeron (2011) Wardle M., Salmeron S., 2011, arXiv:1103.3562
- Wardle (1999) Wardle M., 1999, MNRAS, 307, 849
- Zhu, Hartmann & Gammie (2009) Zhu Z., Hartmann L., Gammie C., 2009, ApJ, 694, 1045
- Zhu et al. (2010a) Zhu Z., Hartmann L., Gamme C. F., Book L. G., Simon J. B., Engelhard E., 2010a, ApJ, 713, 1134
- Zhu, Hartmann & Gammie (2010b) Zhu Z., Hartmann L., Gammie C., 2010b, ApJ, 713, 1143