Astrometric and photometric initial mass functions from the UKIDSS Galactic Clusters Survey: I The Pleiades ††thanks: Based on observations made with the United Kingdom Infrared Telescope, operated by the Joint Astronomy Centre on behalf of the U.K. Particle Physics and Astronomy Research Council.
Abstract
We present the results of a deep wide-field near-infrared survey of the entire Pleiades cluster recently released as part of the UKIRT Infrared Deep Sky (UKIDSS) Galactic Clusters Survey (GCS) Data Release 9 (DR9). We have identified a sample of 1000 Pleiades cluster member candidates combining photometry in five near-infrared passbands and proper motions derived from the multiple epochs provided by the UKIDSS GCS DR9. We also provide revised membership for all previously published Pleiades low-mass stars and brown dwarfs in the past decade recovered in the UKIDSS GCS DR9 Pleiades survey based on the new photometry and astrometry provided by the GCS. We find no evidence of -band variability in the Pleiades members larger than mag. In addition, we infer a substellar binary frequency of 22–31% in the 0.075–0.03 M⊙ range for separations less than 100 au. We employed two independent but complementary methods to derive the cluster luminosity and mass functions: a probabilistic analysis and a more standard approach consisting of stricter astrometric and photometric cuts. We found that the resulting luminosity and mass functions obtained from both methods are very similar. We derive the Pleiades mass function in the 0.6–0.03 M⊙ mass range and found that it is best reproduced by a log-normal representation with a mean characteristic mass of M⊙, in agreement with earlier studies and the extrapolation of the field mass function.
keywords:
Techniques: photometric — stars: low-mass, brown dwarfs; stars: luminosity function, mass function — galaxy: open clusters and associations: individual (Pleiades) — infrared: stars1 Introduction
Over the past two decades star forming regions and rich, young open clusters have been the focal points of numerous searches for substellar objects in the form of wide-field or pencial-beam surveys (e.g. Jameson & Skillen, 1989; Hambly et al., 1993; Luhman, 1999; Lucas & Roche, 2000; Béjar et al., 2001; Zapatero Osorio et al., 2002; Tej et al., 2002; Moraux et al., 2003; Lodieu et al., 2006; Lodieu et al., 2007). Among the key milestones in the study of substellar objects, we should point out the discovery of a first brown dwarf in a star-forming region ( Oph; Luhman et al., 1997), the identification of young L dwarfs (Martín et al., 1998), and the first young T dwarf member of Orionis (SOri 70; Zapatero Osorio et al., 2002). The common scientific driver of these surveys in young regions is the study of the Initial Mass Function (IMF; Salpeter, 1955; Miller & Scalo, 1979; Scalo, 1986; Kroupa, 2002; Chabrier, 2005) and its possible universality through the imaging and spectroscopic confirmation of candidate members in a wide variety of environments.
The UKIRT Infrared Deep Sky Survey (UKIDSS; Lawrence et al., 2007)111The survey is described at www.ukidss.org is a deep large-scale infrared survey. All photometric observations, obtained with the Wide field CAMera (WFCAM; Casali et al., 2007) equipped with five infrared filters (; Hewett et al., 2006), are pipeline-processed at the Cambridge Astronomical Survey Unit (CASU; Irwin et al. 2007, Irwin et al. in preparation)222The CASU WFCAM-dedicated webpage can be found at http://apm15.ast.cam.ac.uk/wfcam. The processed data are then archived in Edinburgh and released to the user community through the WFCAM Science Archive (WSA; Hambly et al., 2008)333The WFCAM Science Archive is accessible at the URL http://surveys.roe.ac.uk/wsa. One of its components, the Galactic Clusters Survey (hereafter GCS) aims at covering 1000 square degrees in 10 star-forming regions and open clusters down to 0.03–0.01 M⊙ (depending on the age and distance) to investigate the universality of the initial mass function. Each cluster is covered in with a second epoch in to provide proper motions with accuracies of a few milli-arcsec per year (mas/yr). The latest GCS data release (DR) to date, DR9 on 25 October 2011, provides full coverage of the Pleiades in those five filters along with proper motions. This paper is the first of a series dedicated to the astrometric and photometric mass functions in young and intermediate-age open clusters as well as star-forming regions to address the fundamental issue of the universality of the IMF in an homogeneous manner.
The rich Pleiades cluster has been subjected to a particularly high degree of scrutiny for several reasons. First, its members share a significant common proper motion compared to neighbouring stars estimated to (, ) = (19.15, 45.72) and (20.10, 45.39) mas/yr by Robichon et al. (1999) and van Leeuwen (2009) respectively, making astrometric selection relatively straightforward. Furthermore, the Pleiades is among the nearest well-populated open clusters located at 134 pc from the Sun with an uncertainty of 5 pc (Johnson, 1957; Gatewood et al., 2000; Pinfield et al., 2000; Southworth et al., 2005) while the improved reduction of the Hipparcos data by van Leeuwen (2009) suggests a distance of 120.21.9 pc. In this work we adopt this latter estimate. Its age has been determined using various methods, including the Zero-Age-Main-Sequence turn-off (Mermilliod, 1981) and the lithium depletion boundary methods (Stauffer et al., 1998). The latter method yielded a most probable value of Myr. Moreover, reddening along the line of sight to the cluster is generally low, E() = 0.03 (O’dell, Hendry & Collier Cameron, 1994). Finally, the number of Pleiades members is large due to the numerous surveys dedicated to the stellar and substellar components of the cluster (Jameson & Skillen, 1989; Hambly et al., 1993; Stauffer et al., 1994; Zapatero Osorio et al., 1997; Stauffer et al., 1998; Martín et al., 1998; Bouvier et al., 1998; Festin, 1998; Zapatero Osorio et al., 1999; Hambly et al., 1999; Pinfield et al., 2000; Adams et al., 2001; Moraux et al., 2001; Jameson et al., 2002; Dobbie et al., 2002; Moraux et al., 2003; Deacon & Hambly, 2004; Bihain et al., 2006; Bihain et al., 2010; Casewell et al., 2007; Lodieu et al., 2007; Bihain et al., 2010; Casewell et al., 2011).
In this paper we present the Pleiades mass function derived from 80 square degrees surveyed in 5 passbands, one at 2 epochs, by the UKIDSS GCS to provide photometry and astrometry for about one million sources. These data come from the latest data release of the UKIDSS GCS, DR9. In Section 2 we present the photometric and astrometric dataset employed to extract Pleiades member candidates. In Section 3 we review the list of previously published members recovered by the UKIDSS GCS DR9 and revise their membership. In Section 4 we outline two methods for deriving the cluster luminosity function. One method relies on a relatively conservative photometric selection followed by the calculation of formal membership probabilities based on objects positions in the proper motion vector point diagram (Section 4.1). The second method applies a rigorous astrometric selection based on the formal errors on the proper motions for each photometric candidate compared to the mean of the cluster (Section 4.2) after more stringent multicolour cuts. In Section 5 we discuss the photometric binary frequency in the substellar regime and compare it with previous estimates in the Pleiades and for ultracool field dwarfs. In Section 6 we discuss the -band variability of Pleiades cluster member candidates. In Section 7 we derive the cluster luminosity and (system) mass function and compare it to earlier estimates for this cluster and others, along with that of the field population.
2 The astrometric and photometric dataset
2.1 Photometry
We selected point sources in the full Pleiades cluster, in the region defined by RA=50–64 degrees and dec=18–30 degrees. We retrieved the catalogue using a Structure Query Language (SQL) query similar to our earlier study of the Pleiades (Lodieu et al., 2007) and applied it to the DR9 release of the GCS (see also the SQL query in appendix A of Lodieu et al. (2007)).
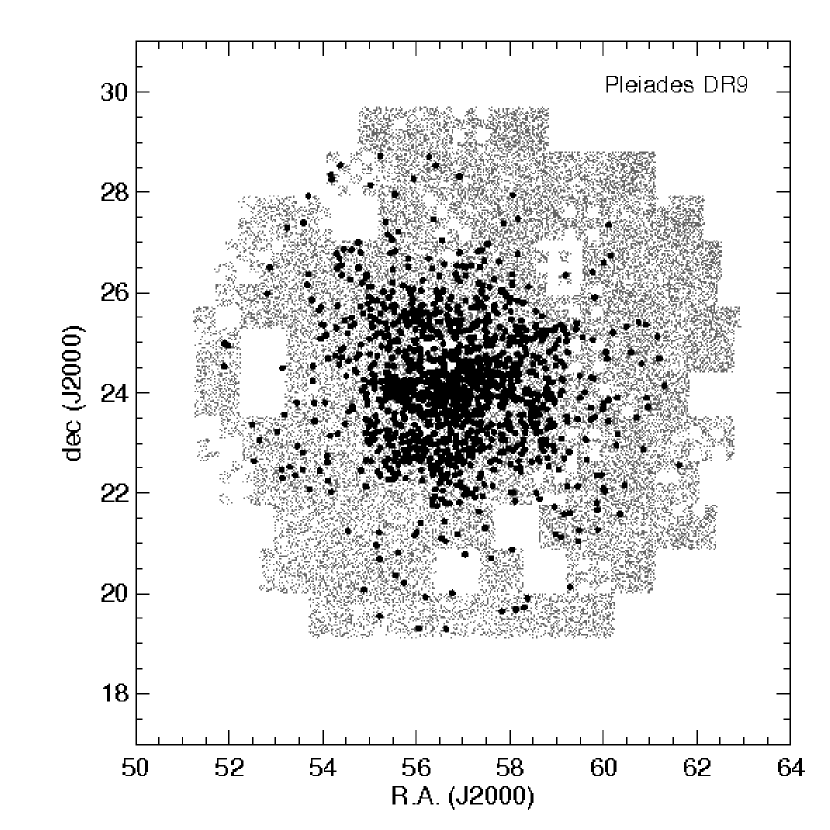
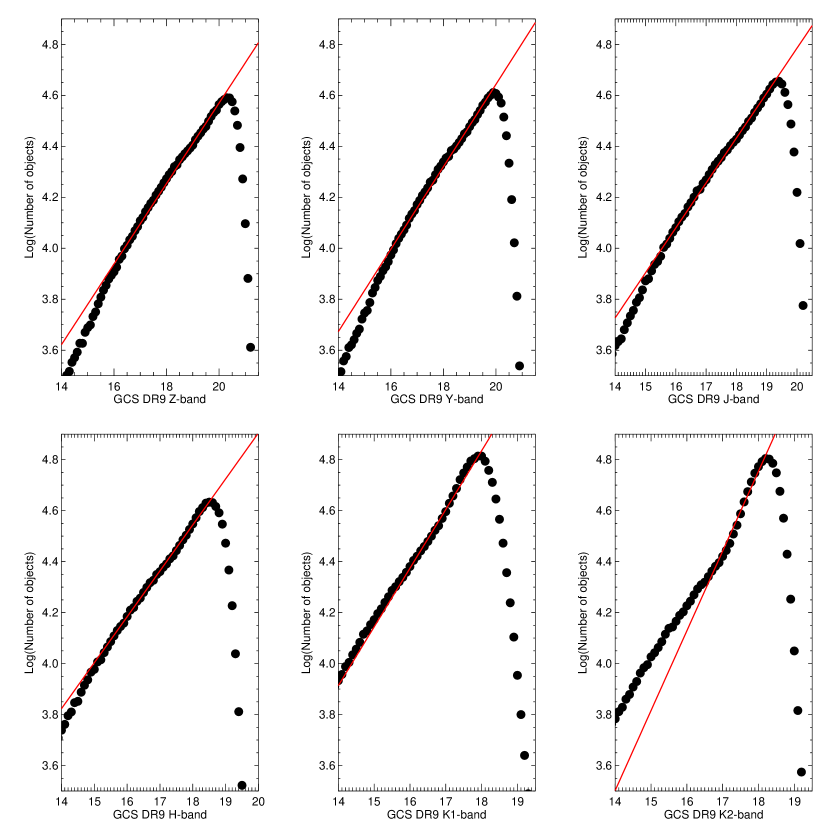
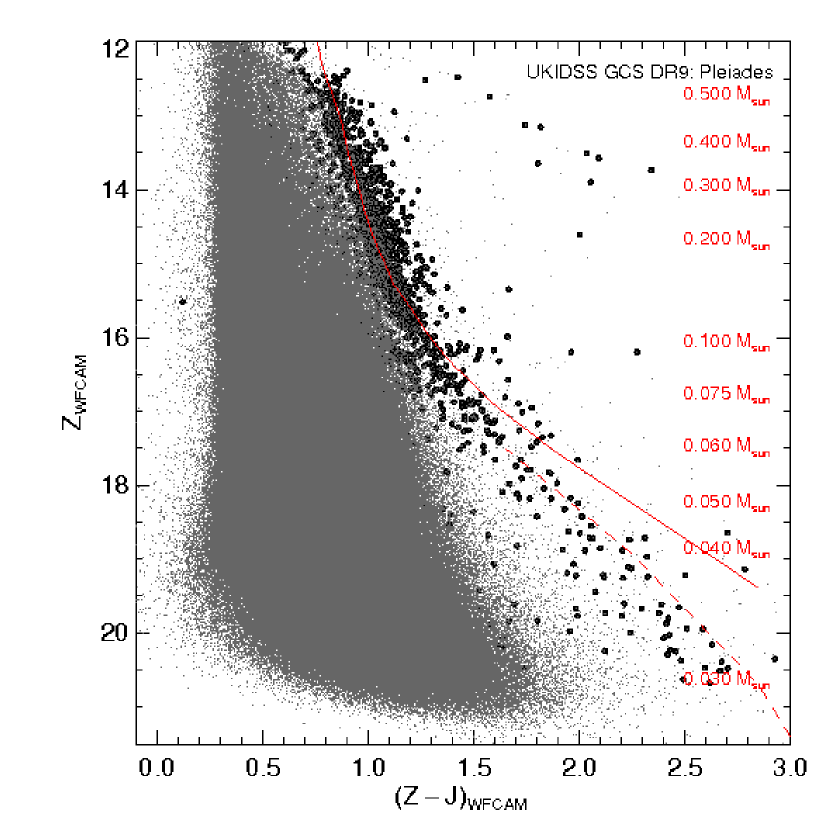
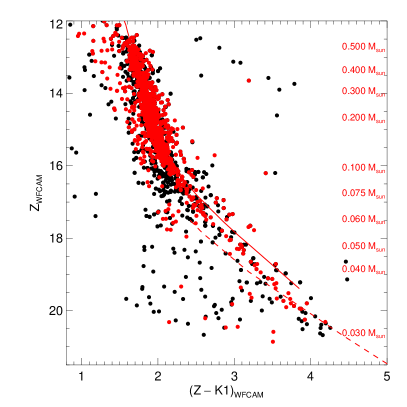
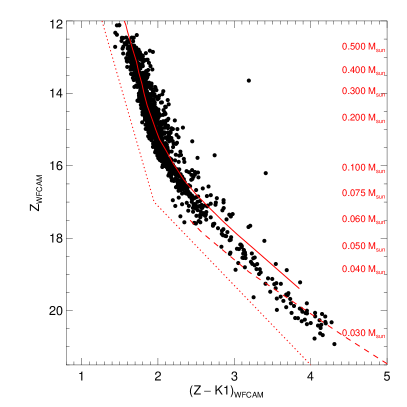
Briefly, we selected only good quality point sources in all passbands and included and non detections to allow for cooler brown dwarf candidates to be extracted. We did not impose a detection in the second -band either because the proper motions are not only computed with the two -band epochs but with any filter observed at a different time (see Section 2.2). We limited our selection to sources fainter than = 11.3, = 11.5, = 11.0, = 11.3, and 1 = 9.9 mag where the GCS saturates. The completeness limits, taken as the magnitude where the straight line fitting the shape of the number of sources as a function of magnitudes falls off, are = 20.2, = 19.8, = 19.3, = 18.4, 1 = 17.9, and 2 = 18.1 mag (Fig. 2). The SQL query includes a cross-match with the Two Micron All Sky Survey (2MASS; Cutri et al., 2003; Skrutskie et al., 2006) if available. The main change here compared to our previous study of the Pleiades made with the GCS DR1, apart from the significant increase in areal coverage, is the inclusion of the proper motions determined from the multiple passband coverage taken at different epochs by the GCS and released in DR9 (see Section 2.2 for more details). The query returned a total of 937,723 sources over 80 square degrees. The full coverage is displayed in Fig. 1 and the resulting (,) colour-magnitude diagram is shown in Fig. 3. We note that the theoretical isochrones plotted in the different figures of the paper were specifically computed for the WFCAM set of filters and kindly provided by I. Baraffe and F. Allard.
2.2 Astrometry
Proper motion measurements are available in the WFCAM Science Archive for UKIDSS data releases from DR9 for all the wide/shallow surveys with multiple epoch coverage in each field (i.e. the LAS, GCS and GPS). Details of the procedure will appear elsewhere (Collins & Hambly 2012), but here we give a brief description of the process.
When complete, each field imaged in the UKIDSS surveys is covered by a set of detector frames in various passbands with one passband revisited at least once. In general, these frames may have been taken at any time over the lifetime of the survey (at the time of writing, years) resulting in multiple epoch coverage for all sources. The approach taken in the WSA for computing proper motions is simple444we emphasise that this work was done within the WSA for all the UKIDSS wide/shallow surveys, and not carried out for the sake of this paper only: first a set of local plane coordinates was established for all detections in all frames that have any systematic offsets in absolute positions minimised; then proper motions were measured from linear least–squares fits in these local plane coordinates as a function of time. In the first process, for each set of frames, one reference frame was taken to map each other ‘slave’ frame onto that master using all available detections and a simple linear ‘plate’ model. Working in local plane coordinates, the model comprises 6 coefficients allowing for independent zeropoint shifts and scale changes in both coordinates, rotation and non–orthogonality between the coordinate axes (shear). The reason for applying these local models is that the absolute astrometry of each frame is done with respect to relatively bright 2MASS standard stars, so the zeropoint of any proper motions derived by simply taking these raw positions would be defined by these relatively nearby stars, and would be subject to any bulk motions and/or drift of such stars as seen from our vantage point in space. The idea was to define a zeropoint for the proper motions across all surveys that is as close as possible to a true zero, i.e. one in which the average galaxy and quasar proper motions would be zero. Clearly this is not possible in low–latitude sightlines and/or for relatively shallow detection lists containing few identified extragalactic sources, so the best that can be done is to use the faintest and hence on average most distant stars possible. Since the number counts are dominated by the fainter stars, all stars were simply used. Note that rather than weighting these local model fits by the formal errors on each detection, unit–weight fits were chosen. Again, this is because the brighter, and on average nearer stars would carry the most weight given their low centroiding errors, but the local mapping models should not be biased towards the possibly drifting reference frame that would be defined by such stars which exhibit significant angular motions simply because of their proximity to the Sun.
Once a set of mapped local plane coordinates was set for every source paired across the detections available from the set of frames, a weighted linear least–squares fit is done for each coordinate as a function of time, resulting in four astrometric parameters (coordinates at a reference epoch along with proper motions in those coordinates) plus formal errors and a standard goodness–of–fit parameter (a reduced chi–squared statistic).
3 Cross-match with previous surveys
We compiled a list of Pleiades member candidates published over the past decades by various groups (Table 1) to update their membership status with the photometry and astrometry in DR9 of the GCS (Table 5). This list will serve as starting point to identify new Pleiades members in the GCS data and derive the cluster luminosity and mass functions.
For the brightest members, we used the extensive compilation of 1417 sources from Stauffer et al. (2007) which includes candidate cluster members from several large-scale proper motion studies of the Pleiades (Trumpler, 1921; Hertzsprung, 1947; Artyukhina, 1969; Jones, 1981; Haro et al., 1982; van Leeuwen et al., 1986; Stauffer et al., 1991; Hambly et al., 1993; Pinfield et al., 2000; Adams et al., 2001; Deacon & Hambly, 2004). We added candidates from a large number of additional papers dedicated to the Pleiades low-mass stars and brown dwarfs over the past 20 years, many sources being common to several studies which surveyed independently the same region of the cluster. The references are listed in Table 1 along with the original numbers of sources published by each study (All) and the corresponding numbers of candidates covered by the GCS (DR9). The success rate in the recovery of published candidate members is usually quite high (Table 1) because the GCS covers now the entire Pleiades cluster, as can be seen from Fig. 1. Earlier studies such as Hambly et al. (1993), Adams et al. (2001)555We should mention that this catalogue was not publish but is included in the Stauffer et al. (2007) compilation, and the list of 916 high-probability member candidates from Deacon & Hambly (2004) are contained in Stauffer et al. (2007) fnd ocused not only on Pleiades very-low-mass stars but also on brighter members which are saturated on the UKIDSS images. Thus these higher mass members are not retrieved by our SQL query due to our photometric cuts at the bright end of the survey. Similarly, many L and T dwarf candidates reported by Bihain et al. (2006) and Casewell et al. (2007)666Four objects have wrong coordinates, rectified in the erratum of this paper (Casewell et al., 2010) are too faint to be detected on the GCS images. Some of the earlier Pleiades candidates are not recovered mainly because (Table 1):
-
•
341 sources brighter than our saturation limits equivalent to 58.5% of previously published sources not recovered by our SQL query (mainly coming from early surveys as mentioned above)
-
•
185 sources (i.e. 31.7%) missing images in , , or 1
-
•
10 sources located in holes of the UKIDSS GCS coverage due to quality control issues (1.7% of all published members)
-
•
8 (or 1.37%) known Pleiades candidates located beyond our 3 arcsec cross-match limit, possibly because that they are higher proper motion non-members
To quantify the completeness limit of the GCS Pleiades dataset, we have listed in Column 1 of Table 1 (numbers in brackets) the numbers of previously-published candidates within the magnitude range probed by the GCS (see Section 2.1). The average of the percentages listed in the last column of Table 1 amounts for 92.2%, not taking into account the sample of Zapatero Osorio et al. (1997) due to problems with their coordinates. We also considered the most complete and updated sample of high-mass stars and low-mass Pleiades member candidates published by Stauffer et al. (2007). We recovered 94% of their sources, suggesting that overall our GCS sample is at least 92–94% complete.
Table 5 is provided in electronic format only with a total of 3196 known Pleiades member candidates reported in the literature. From this sample we removed the multiple detections and kept all different names from earlier studies in the last column for future searches: we are left with 1379 Pleiades candidates. We give the GCS DR9 coordinates of these 1379 Pleiades candidates, the 12 photometry, the proper motions in right ascension and declination with their respective errors as well as the value which represents the reduced chi-squared statistic of the astrometric fit for each source. This parameter is equal to the usual chi-squared statistic (sum of normalised residuals) divided by the degrees of freedom (i.e. number of data points minus the number of fitted parameters). The penultimate column supplies the membership probability for 1067 of the 1379 previously reported Pleiades candidates (see Section 4.1.1 for the method). A total of 312 out of 1379 Pleiades candidates have no membership probabilities because they are not classified as Pleiades members by the probabilistic selection (see Section 4.1 for the photometric and astrometric criteria). They are divided into four groups as follows: 190 sources detected in but classified as proper motion non members, 42 objects without photometry, 74 objects without only, and 6 sources without only. The last column gives the old names used by earlier studies (names from different authors are separated by an underscore “_”).
Previously-published Pleiades member candidates not recovered in the GCS DR9 are listed in Table 6 with their coordinates and old names from earlier studies. After removing common sources, we are left with 544 known Pleiades member candidates not in our sample. The large majority of these sources are either too bright or too faint to in the GCS database or photometric and/or astrometric non members of the Pleiades.
| Survey | All | DR9 | Memb | NM | % |
|---|---|---|---|---|---|
| Hambly1993 | 440 (440) | 418 | 303/302 | 115/116 | 95.0 |
| Zapatero1997a | 9 (9) | 2 | 1/1 | 1/1 | 22.2 |
| Festin1998 | 45 (44) | 37 | 24/24 | 13/13 | 84.1 |
| Stauffer1998 | 20 (19) | 16 | 11/10 | 5/6 | 84.2 |
| Bouvier1998 | 26 (26) | 25 | 12/15 | 13/10 | 96.2 |
| Zapatero1999 | 46 (44) | 38 | 8/13 | 30/25 | 86.4 |
| Hambly1999 | 9 (9) | 9 | 5/6 | 4/3 | 100.0 |
| Pinfield2000 | 339 (338) | 320 | 185/187 | 135/133 | 94.7 |
| Moraux2001 | 25 (25) | 25 | 12/15 | 13/10 | 100.0 |
| Dobbie2002 | 90 (87) | 61 | 8/9 | 53/52 | 70.0 |
| Moraux2003 | 109 (108) | 107 | 74/74 | 33/33 | 99.1 |
| Deacon2004 | 916 (746) | 674 | 467/450 | 207/224 | 90.3 |
| Bihain2006 | 34 (31) | 28 | 11/14 | 17/14 | 90.3 |
| Lodieu2007 | 456 (456) | 454 | 376/376 | 78/78 | 99.6 |
| Casewell2007 | 23 (16) | 16 | 4/7 | 9/6 | 100.0 |
| Stauffer2007 | 1416 (944) | 888 | 567/639 | 321/249 | 94.0 |
4 New substellar members in the Pleiades
4.1 Probabilistic approach
4.1.1 Method
In this section we outline the probabilistic approach we employed to select low-mass stars and brown dwarf member candidates of the Pleiades using photometry and astrometry from the UKIDSS GCS DR9. This method is described in detail in Deacon & Hambly (2004) and Lodieu et al. (2007). The main steps are:
-
1.
Define the cluster sequence using candidates published in the literature within the area covered by the latest release of the GCS
-
2.
Make a conservative photometric cut in the (,) diagram to include known members and identify new cluster member candidates (dashed lines on the top-left panel in Fig. 6).
-
3.
Analyse the vector point diagram in a probabilistic manner to assign a membership probability for each photometric candidate with a proper motion measurement (Section 4.1.2).
-
4.
Obtain an illustrative list of high probability cluster members by choosing a specific threshold for the membership, chosen as p0.6 here
-
5.
Derive the luminosity and mass function using all candidates with membership probabilities without any threshold for a complete count of the membership

4.1.2 Membership probabilities
In order to calculate formal membership probabilities we used the same technique as Deacon & Hambly (2004) and Lodieu et al. (2007) to fit distribution functions to proper motion vector point diagrams (Hambly et al., 1995). We refer the reader to those papers for more details and additional equations. First we have rotated the vector point diagram so the cluster lies on the y-axis using the rotation transformation below (Equations 1 and 2):
| (1) |
| (2) |
corresponding a rotation angle of 23.7 degrees, assuming a relative proper motion of (19.7,44.82) mas/yr for the Pleiades as measured on the vector point diagram created from the GCS DR9 data (slightly different from the Hipparcos absolute motion; van Leeuwen, 2009). It is common to refer to the proper motions in the rotated vector point diagram as and .
We have assumed that there are two contributions to the total distribution , one from the cluster () and one from the field stars (). The fitting region was delineated by 50 50 mas/yr and 20 70 mas/yr. These were added by means of a field star fraction to yield an expression for given in Equation 3:
| (3) |
We have assumed that the cluster distribution is characterised by a bivariate Gaussian with a single standard deviation and mean proper motion values in each axis and (Equation 4):
| (4) |
The field star distribution was fitted by a single Gaussian in the axis (with standard deviation and mean ) and a declining exponential in the axis with a scale length . The use of a declining exponential is a standard method (e.g. Jones & Stauffer, 1991) and is justified in that the field star distribution is not simply a circularly-symmetric error distribution (i.e. capable of being modelled as a 2d Gaussian) - rather there is a prefered direction of real field star motions resulting in a characteristic velocity ellipsoidal signature, i.e. a non-Gaussian tail, in the vector point diagram. This is best modelled (away from the central error-dominated distribution) as an exponential in the direction of the antapex (of the solar motion).
The best fitting set of parameters were chosen using a maximum likelihood method (see Deacon & Hambly, 2004). However in a deviation from this method we did not fit for the standard deviation of the cluster proper motions (). Instead we calculated the mean astrometric error for all objects in each magnitude range and used this as our cluster standard deviation. This fitting process was tested by Deacon & Hambly (2004) where simulated data sets were created and run through the fitting process to recover the input parameters. These tests produced no significant offsets in the parameter values (see Table 3 and Appendix A of Deacon & Hambly, 2004, for results and more details on the procedure). Hence, we have calculated the formal membership probabilities as,
| (5) |
| Nb | f | |||||||
|---|---|---|---|---|---|---|---|---|
| 12–13 | 486 | 0.86 | 3.22 | -1.36 | 44.65 | 15.51 | 17.97 | -9.48 |
| 13–14 | 853 | 0.79 | 3.14 | 0.21 | 46.25 | 14.95 | 17.46 | -9.22 |
| 14–15 | 1394 | 0.78 | 3.21 | -0.11 | 46.12 | 13.50 | 16.95 | -9.13 |
| 15–16 | 1712 | 0.86 | 3.28 | 0.47 | 45.60 | 13.19 | 16.06 | -9.45 |
| 16–17 | 1885 | 0.95 | 3.41 | 0.68 | 45.25 | 11.16 | 15.16 | -9.79 |
| 17–18 | 1256 | 0.96 | 3.70 | -0.26 | 44.99 | 9.58 | 14.28 | -10.34 |
| 18–19 | 493 | 0.93 | 4.28 | -1.23 | 44.07 | 11.02 | 15.09 | -11.18 |
| 19–20 | 358 | 0.92 | 5.93 | -0.63 | 45.76 | 10.30 | 15.72 | -9.86 |
| 20–21 | 369 | 0.84 | 9.62 | 7.80 | 41.75 | 10.80 | 17.49 | -7.76 |
As the astrometric errors are a function of magnitude we split the sample into nine bins. Each bin was one magnitude wide and the constituent stars used to fit for six of the seven parameters in the same way as described in Deacon & Hambly (2004). We used bins of one magnitude to have a sufficient number of Pleiades members in each range. In the faintest bins where the astrometric errors increase rapidly, the number of cluster stars was so small that we fixed the location of the cluster on the vector point diagram ( and ) to the values from a brighter bin. The other parameters were fitted as normal. A summary of the fitted parameters from the probabilistic analysis described above is given in Table 2.
Deacon & Hambly (2004) test the reliability of this method in Section 2.6 and find that the method accurately recovers the parameters from simulated datasets. We refer the reader to Table 3 in this paper for approximate errors on parameters but note that these tests were performed on simulated datasets with a much larger fraction of cluster stars. Hence our cluster parameters will likely have higher errors than those quoted. Some parameters such as and vary between magnitude bins due to noise as a result of two competing factors. As we go fainter the real proper motions of our field star contaminants decrease as our typical field star will be more distant but the measurement errors on the proper motions increase. Hence these two parameters which describe the proper motions of the field stars initially fall with increasing magnitude but as the measurement errors (as traced by the parameter ) blow up, these in turn also increase.
4.1.3 Probabilistic sample
The probabilistic approach yielded a total sample of 8797 sources with membership probabilities assigned to each of them. This sample contains 947 sources with membership probabilities higher than 60% listed in Table 7. Relaxing the probability to 50% yields a sample of 1076 Pleiades member candidates. These high-probability members are displayed in Fig. 5 along with previously published Pleiades candidates.
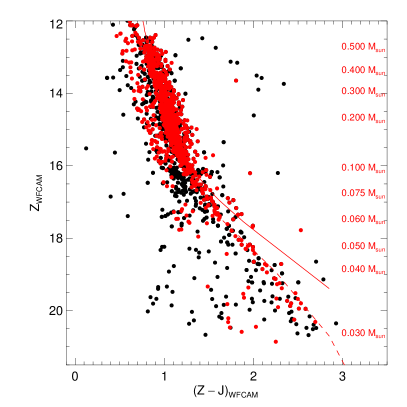
We note that the sequence of member candidates in our probabilistic sample is very similar to the sequence of previously-known members down to = 16 mag (Fig. 5). However, we observe differences in the = 16–17 mag range and at fainter magnitudes, mainly because candidates identified in earlier surveys focusing on Pleiades brown dwarfs did not have as much as information as the GCS i.e. 6-band photometry and accurate astrometry down to 25 Jupiter masses. Hence, our new dataset allows us to reject many of the earlier substellar candidates either on photometric or astrometric grounds.
4.2 Photometry and proper motion selection
In this section we outline a more widely used method (referred to as method #2 in the rest of the paper) that we applied to select low-mass and substellar Pleiades member candidates. This procedure consists of selecting cluster candidates by applying stricter photometric cuts in various colour-magnitude diagrams supplemented by a proper motion selection (e.g. Lodieu et al., 2006; Lodieu et al., 2007). This method is complementary but independent from the probabilistic approach presented in the previous section.
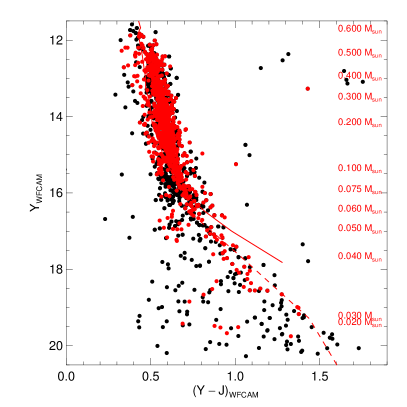
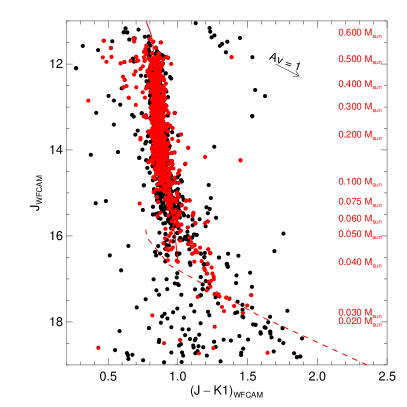
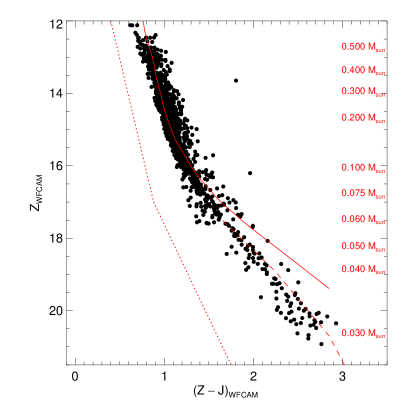
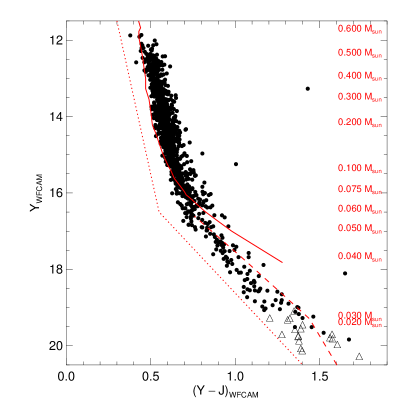
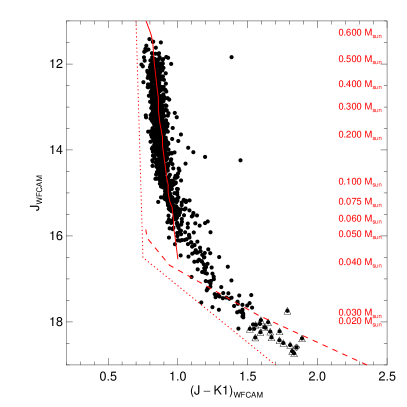
First, we plotted several colour-magnitude diagrams (Fig. 5) to study the position of known Pleiades members identified in earlier studies and published over the past decades (Table 1). Based on these known members, we define a series of lines to select photometrically member candidates with photometry in in four colour-magnitude diagrams as indicated below (dotted lines in the diagrams in Fig. 6):
-
•
(,) = (0.50,12.0) to (1.05,17.0)
-
•
(,) = (1.05,17.0) to (2.40,21.5)
-
•
(,) = (1.20,11.5) to (1.95,17.0)
-
•
(,) = (1.95,17.0) to (4.00,21.5)
-
•
(,) = (0.30,11.5) to (0.55,16.5)
-
•
(,) = (0.55,16.0) to (1.40,20.5)
-
•
(,) = (0.70,11.0) to (0.70,16.5)
-
•
(,) = (0.70,16.5) to (1.70,19.0)
These photometric cuts remain conservative and the contamination to the blue side of the Pleiades sequence is still high. Hence, the second step consisted of applying a proper motion selection in the vector point diagram (Fig. 4) to improve on the photometric selection. We applied a 3 selection given the formal errors on the individual proper motions for each object, implying a completeness higher than 99% for normally–distributed errors. We assumed a mean proper motion of (18, 42) mas/yr for the Pleiades, slightly different from the Hipparcos values (Robichon et al., 1999; van Leeuwen, 2009) because the proper motion measurements are on a relative system rather than the Hipparcos system as described in Collins & Hambly (2012). The main advantage of this method is that it doesn’t rely on a single radius for the proper motion selection but rather takes into account the increasing uncertainty on the proper motion measurements for fainter stars, and allows for different time baselines of the epoch frames affecting the proper motion errors.
After applying both the photometric and proper motion selections, we found a large number of objects lying to the blue of the Pleiades sequence. Hence, we applied an additional photometric cut in the (,) colour-magnitude diagram, eliminating all sources in the = 12–18 mag range and located to the left of a line defined by (,) = (0.6,12.0) to (1.2,16.5). This selection yielded a total 1147 low-mass stars and brown dwarfs with magnitude ranging from 12 to 21.5 (Table 7). This total number is similar to the number of high probability Pleiades member candidates identified via the probabilistic approach; we note however that the membership count from the different methods is identical within the counting errors if we sum the membership probabilities of all stars, as expected.
4.3 Search for lower mass members
In this section we search for fainter and cool substellar members of the Pleiades by dropping the constraint on the -band detection and later the bands.
4.3.1 detections
To extend the Pleiades cluster sequence to fainter brown dwarfs and cooler temperatures, we searched for potential candidate members undetected in . We imposed similar photometric and astrometric criteria as those detailed in Section 4.2 but imposed a non detection and associated criteria as described below:
-
•
No detection
-
•
18 and 19.3 mag
-
•
Candidates should lie above the line defined by (,) = (0.55,16.0) and (1.40,20.5)
-
•
Candidates should lie above the line defined by (,) = (0.75,16.5) and (1.70,19.0)
-
•
The position on the proper motion vector point diagram of each candidate should not deviate from the assumed cluster proper motion by more than 3
This selection returned 22 additional Pleiades member candidates which have been added to Table 7 along with sources identified with both selection methods presented earlier. All but four of them are indeed invisible in the -band images and look well detected in the other bands after checking the GCS DR9 images by eye.
4.3.2 detections
We repeated the procedure described above looking for and non detections. We applied the following criteria:
-
•
No and detection
-
•
= 18–19.3 mag
-
•
Candidates should lie above the line defined by (,) = (0.75,16.5) and (1.70,19.0)
-
•
The position on the proper motion vector point diagram of each candidate should not deviate from the assumed cluster proper motion by more than 3
This query returned 19 new Pleiades candidate members. After checking the images by eye, we kept only one of them because one is actually visible in (although a detection is not reported in the GCS DR9 catalogue), one is visible in both the and images. The remaining 16 have no and images available so we can’t confirm if they are indeed drop-outs (Table 7).
5 The substellar binary frequency
The multiplicity in the substellar domain at different ages provides one way to constrain the formation mechanisms of brown dwarfs. As in our earlier study of the Pleiades (Lodieu et al., 2007), we investigated the binary frequency of Pleiades brown dwarfs using the photometry and colours from the GCS. However, our sample is now two times larger and, with the proper motions, is of much higher quality because it is drawn from the same homogeous survey. We consider in this section all Pleiades member candidates selected through method #2.
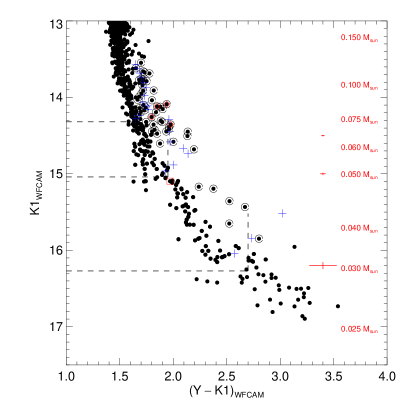
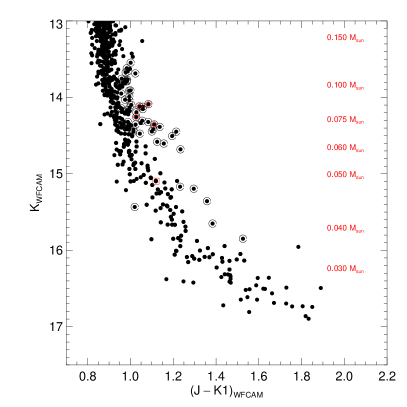
We applied the same method as described in Lodieu et al. (2007) to select substellar binary candidates in the Pleiades. We briefly summarise the technique here. Figure 7 displays two colour-magnitude diagrams used to identify binary candidates because of the large colour range and the presence of sources above the cluster (single star) sequence. We started off our selection in the (1,1) colour-magnitude diagram (left-hand side plot in Fig. 7) because it shows large colour difference in the substellar regime. We applied the following method: for a given magnitude, e.g. 1 = 15.5–16.5 mag, we defined two horizontal lines intercepting the mean value of the single object sequence. From the intercept points we defined two vertical lines with a length of 0.75 mag (dashed lines in Fig. 7). Then we divided the box formed by both sequences and the vertical lines into two boxes: single stars lie in the bottom part whereas binary candidates in the top one. Except for one system which appears to the blue of the single-star sequence in the (1,1) diagram, the location of the binary candidates is confirmed in this diagram and others as well, adding credence to their potential multiplicity. Our method is corroborated by the presence of four known Pleiades brown dwarf binaries (IPMBD 25, IPMBD 29, PPl15, CFHT-Pl-IZ 4 Basri & Martín, 1999; Martín et al., 2000, 2003; Bouy et al., 2006) above the single star sequence where Teide 1 (Rebolo et al., 1995), an isolated Pleiades brown dwarf is located (red symbol in Fig. 7). Note that we observe a dispersion of 0.5 mag in the single-star sequence which can explained by the tidal radius of the cluster leading to a variation of 10% in the distance of the members, i.e. 12 pc corresponding to 0.2 mag (Pinfield et al., 2000).
The binary fraction was then defined as the number of binaries divided by the total number of objects (single starsbinaries). We counted 51 binary candidates (Table 8) and 137 single stars in the 1 14.32–16.27 mag range, corresponding to masses between 0.075 and 0.03 M⊙ at the age and distance of the Pleiades. Hence, we derive a binary frequency of 51/(13751) = 27.15.8% in this mass range for projected separations smaller than 100–200 au. This value is likely a lower limit because some binaries may hide in the single star sequence due to higher separations or mass ratios and we have not considered wider systems. The overall result is in agreement within the error bars with our previous estimate although on the lower side (36.58.0% Lodieu et al., 2007). We also divided up this mass range into two bins covering 0.075–0.05 M⊙ and 0.05–0.03 M⊙, yielding binary fractions of 33.09.1% (35 binaries and 71 singles) and 19.57.0% (16 binaries and 66 singles), respectively. The binary frequency over the lowest mass range is not reproduced by the latest hydrodynamical simulation of a 500 M⊙ stellar cluster as no brown dwarf binary was found in the 0.07–0.03 M⊙ range (Table 2 in Bate, 2011). Unfortunately, we cannot test further those theoretical predictions with estimates on the numbers of triple and high-order multiple, separation distributions, and mass ratios.
We investigated the range of validity of our binary frequency by plotting the expected positions of binary systems with primary masses of 0.075, 0.05, and 0.03 M⊙ (blue crosses in Fig. 7. Adding smaller mass brown dwarfs (going from 0.075 M⊙ i.e. equal-mass binaries down to 0.02 M⊙) to primaries with masses of 0.075 M⊙ places those systems to the red of single stars and then turn over towards higher luminosities. The same behaviour is observed for binaries with primary masses of 0.05 M⊙ whereas binaries with primary masses of 0.03 M⊙ turn redder and brighter. To estimate the sensitivity of our binary frequency in terms of mass ratios, we considered the photometric errors of the GCS for the three mass values. We inferred that our binary frequencies over the 0.075–0.05 M⊙ and 0.05–0.03 M⊙ are valid for mass ratios larger than 0.4–0.5 and 0.8, respectively. Hence, the factor of two observed in the multiplicity between those two mass bins should be interpreted with caution because they are not valid over the same mass ratio interval. If we consider only binaries with mass ratios larger than 0.8 in the 0.075–0.05 M⊙ mass range, we derive a binary fraction of 9/(719) = 11.35.0%, lower by a factor of two than the frequency inferred in the 0.05–0.03 M⊙ range although consistent within the error bars.
We note that we applied the same procedure to the probabilistic sample and found very similar numbers which do not change the main conclusions discussed in this Section. We infer a substellar binary frequency of 24.37.3% which can be divided up into 29.212.0 and 20.08.7% for the 0.075–0.05 M⊙ and 0.05–0.03 M⊙ mass bins, respectively.
Our binary fraction is higher by a factor two to three than the frequency inferred from high-resolution imaging (13.3%; Martín et al., 2000, 2003; Bouy et al., 2006) especially if we consider that all known Pleiades brown dwarf binaries lie in the 0.065–0.055 M⊙ mass range. Our multiplicity is lower than the 50% estimate derived by Pinfield et al. (2000) from a purely photometric estimate (i.e. no proper motion measurements involved) and on the low side of Monte-Carlo predictions (32–45%; Maxted & Jeffries, 2005). However, our results are in agreement with the upper limit of 2610% quoted by Basri & Reiners (2006) for low-mass stars and brown dwarfs. This total binary frequency is split into 11% of spectroscopic binaries with projected separation below 3 au, and 15% of wider binaries (3–15 au) in agreement with high-resolution imaging surveys of field ultracool dwarfs (for a review, see Burgasser et al., 2007) and theoretical predictions from hydrodynamical simulations (Bate, 2011).

6 Variability at 120 Myr
In this section we discuss the variability of the Pleiades low-mass stars and brown dwarfs using the two epochs provided by the GCS. We only considered the Pleiades member candidates with membership probabilities larger than 60%, many of them being already published in the literature (Tables 5 and 7).
Figure 8 shows the (1–2) vs 1 for all Pleiades member candidates with probabilities higher than 60%. The brightening in the 1 = 11–12 mag range is due to the difference in saturation characteristics between the first and second epoch, of the order of 0.5 mag both in the saturation and completeness limit. This is understandable because the exposure times have been doubled for the second epoch with relaxed constraints on the seeing requirement and weather conditions. We excluded those objects from our variability study. Overall, the sequence indicates consistent photometry between the two K epochs and very few objects appear variable in the -band.
We selected variable objects by looking at the standard deviation, defined as 1.48 the median absolute deviation which is the median of the sorted set of absolute values of deviation from the central value of the 1–2 colour. In the 1 = 11–13 mag, we identified four potential variable abjects with differences in the -band larger than 3 above the standard deviation. However, all appeared saturated in the second epoch images suggesting that the variability may be caused by the inaccurate photometry derived from saturated sources. We extracted another potential variable low-mass star around 14.5 mag but this source is located at the edge of the detector, casting doubt on any intrinsic variability. The analysis is not possible beyond 16 mag due to the small number of Pleiades members with high probabilities.
We conclude that the level of K–band variability at 120 Myr is small, with standard deviations in the 0.05–0.08 mag range, suggesting that it cannot account for the dispersion in the cluster sequence. The same conclusions are drawn from the sample derived from method #2.
7 The Initial mass function
In this section we discuss the cluster luminosity and mass functions derived from the samples of Pleiades member candidates extracted from both methods described in the previous section. We did not attempt to correct the mass function for binaries.
7.1 The cluster luminosity function
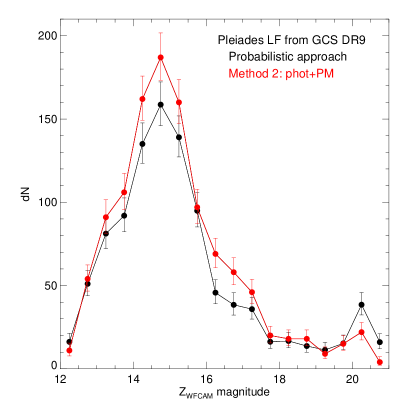
In this section, we construct two luminosity functions: i) we used the sample of 8797 Pleiades cluster member candidates selected by the probabilistic approach (Section 4.1); and ii), the 1147 candidates identified with method #2 (Section 4.2). The luminosity function of the former method is derived by summing membership probabilities of all stars fitted to distribution functions in the vector point diagram, whereas the luminosity function of the latter is derived simply by summing the number of member candidates.
Both luminosity functions i.e. the number of stars and brown dwarfs as a function of magnitude plotted per 0.5 mag bin is displayed in Fig. 9. The brightest bin is a lower limit due to the saturation limit of the GCS survey. The last bin is very likely incomplete due to the constraint imposed on the -band detection. The numbers of objects per 0.5 mag bin increase quickly to reach a peak around = 14.5–15 and drop off afterwards down to the completeness of our survey with a possible peak beyond = 20 mag (Tables 3 & 4). Both luminosity functions look very similar and match each other within the error bars. Therefore, we conclude that both methods provide the same result and a good representation of the Pleiades luminosity and mass functions.
| Mag range | Nb_obj | Mass range | Mid-mass | dN | errH | errL | dN/dM | errH | errL | dN/dlogM | errH | errL |
|---|---|---|---|---|---|---|---|---|---|---|---|---|
| 12.0–12.5 | 179 | 0.6200–0.5400 | 0.5800 (0.5550–0.5890) | 16.18 | 5.11 | 3.99 | 202.29 | 63.94 | 49.90 | 2.43 | 0.27 | 0.28 |
| 12.5–13.0 | 306 | 0.5400–0.4690 | 0.5045 (0.4850–0.5125) | 51.03 | 8.20 | 7.13 | 718.70 | 115.43 | 100.36 | 2.92 | 0.15 | 0.15 |
| 13.0–13.5 | 372 | 0.4690–0.3890 | 0.4290 (0.4025–0.4380) | 81.18 | 10.05 | 9.00 | 1014.71 | 125.64 | 112.45 | 3.00 | 0.12 | 0.12 |
| 13.5–14.0 | 480 | 0.3890–0.3030 | 0.3460 (0.3145–0.3595) | 91.95 | 10.63 | 9.58 | 1069.15 | 123.58 | 111.35 | 2.93 | 0.11 | 0.11 |
| 14.0–14.5 | 614 | 0.3030–0.2300 | 0.2665 (0.2365–0.2800) | 135.02 | 12.65 | 11.61 | 1849.55 | 173.31 | 159.03 | 3.05 | 0.09 | 0.09 |
| 14.5–15.0 | 779 | 0.2300–0.1740 | 0.2020 (0.1775–0.2140) | 158.64 | 13.63 | 12.59 | 2832.91 | 243.31 | 224.74 | 3.12 | 0.08 | 0.08 |
| 15.0–15.5 | 848 | 0.1740–0.1350 | 0.1545 (0.1365–0.1655) | 139.02 | 12.82 | 11.78 | 3564.67 | 328.78 | 302.06 | 3.10 | 0.09 | 0.09 |
| 15.5–16.0 | 863 | 0.1350–0.1070 | 0.1210 (0.1073–0.1305) | 94.90 | 10.78 | 9.73 | 3389.36 | 385.01 | 347.46 | 2.97 | 0.11 | 0.11 |
| 16.0–16.5 | 931 | 0.1070–0.0862 | 0.0966 (0.0858–0.1048) | 45.73 | 7.82 | 6.74 | 2198.46 | 375.84 | 324.22 | 2.69 | 0.16 | 0.16 |
| 16.5–17.0 | 953 | 0.0862–0.0710 | 0.0786 (0.0671–0.0855) | 38.41 | 7.26 | 6.18 | 2527.30 | 477.51 | 406.43 | 2.66 | 0.17 | 0.18 |
| 17.0–17.5 | 747 | 0.0710–0.0549 | 0.0630 (0.0534–0.0711) | 35.81 | 7.05 | 5.96 | 2224.41 | 437.69 | 370.40 | 2.51 | 0.18 | 0.18 |
| 17.5–18.0 | 508 | 0.0549–0.0486 | 0.0517 (0.0463–0.0589) | 16.22 | 5.12 | 4.00 | 2574.60 | 812.61 | 634.33 | 2.49 | 0.27 | 0.28 |
| 18.0–18.5 | 268 | 0.0486–0.0440 | 0.0463 (0.0414–0.0506) | 16.70 | 5.18 | 4.06 | 3630.65 | 1125.53 | 881.74 | 2.59 | 0.27 | 0.28 |
| 18.5–19.0 | 224 | 0.0440–0.0396 | 0.0418 (0.0383–0.0461) | 13.66 | 4.80 | 3.66 | 3105.68 | 1090.16 | 832.42 | 2.47 | 0.30 | 0.31 |
| 19.0–19.5 | 164 | 0.0396–0.0368 | 0.0382 (0.0356–0.0420) | 11.34 | 4.48 | 3.33 | 4051.07 | 1599.11 | 1189.51 | 2.55 | 0.33 | 0.35 |
| 19.5–20.0 | 193 | 0.0368–0.0339 | 0.0353 (0.0330–0.0390) | 15.26 | 5.00 | 3.87 | 5260.69 | 1724.40 | 1335.78 | 2.63 | 0.28 | 0.29 |
| 20.0–20.5 | 223 | 0.0339–0.0311 | 0.0325 (0.0305–0.0370) | 38.49 | 7.26 | 6.18 | 13745.71 | 2594.29 | 2208.46 | 3.01 | 0.17 | 0.18 |
| 20.5–21.0 | 145 | 0.0311–0.0294 | 0.0302 (0.0286–0.0350) | 15.99 | 5.09 | 3.97 | 9408.24 | 2995.26 | 2334.04 | 2.82 | 0.28 | 0.29 |
| Mag range | Nb_obj | Mass range | Mid-mass | dN | errH | errL | dN/dM | errH | errL | dN/dlogM | errH | errL |
|---|---|---|---|---|---|---|---|---|---|---|---|---|
| 12.0–12.5 | 11 | 0.6200–0.5400 | 0.5800 (0.5550–0.5890) | 11.00 | 4.43 | 3.28 | 137.50 | 55.35 | 40.98 | 2.26 | 0.34 | 0.35 |
| 12.5–13.0 | 54 | 0.5400–0.4690 | 0.5045 (0.4850–0.5125) | 54.00 | 8.40 | 7.33 | 760.56 | 118.30 | 103.26 | 2.95 | 0.14 | 0.15 |
| 13.0–13.5 | 91 | 0.4690–0.3890 | 0.4290 (0.4025–0.4380) | 91.00 | 10.58 | 9.53 | 1137.50 | 132.23 | 119.08 | 3.05 | 0.11 | 0.11 |
| 13.5–13.0 | 106 | 0.3890–0.3030 | 0.3460 (0.3145–0.3595) | 106.00 | 11.33 | 10.28 | 1232.56 | 131.77 | 119.58 | 2.99 | 0.10 | 0.10 |
| 14.0–14.5 | 162 | 0.3030–0.2300 | 0.2665 (0.2365–0.2800) | 162.00 | 13.76 | 12.72 | 2219.18 | 188.46 | 174.22 | 3.13 | 0.08 | 0.08 |
| 14.5–15.0 | 187 | 0.2300–0.1740 | 0.2020 (0.1775–0.2140) | 187.00 | 14.70 | 13.67 | 3339.29 | 262.54 | 244.03 | 3.19 | 0.08 | 0.08 |
| 15.0–15.5 | 160 | 0.1740–0.1350 | 0.1545 (0.1365–0.1655) | 160.00 | 13.68 | 12.64 | 4102.56 | 350.74 | 324.08 | 3.16 | 0.08 | 0.08 |
| 15.5–16.0 | 97 | 0.1350–0.1070 | 0.1210 (0.1073–0.1305) | 97.00 | 10.89 | 9.84 | 3464.29 | 388.82 | 351.29 | 2.98 | 0.11 | 0.11 |
| 16.0–16.5 | 69 | 0.1070–0.0862 | 0.0966 (0.0858–0.1048) | 69.00 | 9.35 | 8.29 | 3317.31 | 449.60 | 398.63 | 2.87 | 0.13 | 0.13 |
| 16.5–17.0 | 58 | 0.0862–0.0710 | 0.0786 (0.0671–0.0855) | 58.00 | 8.66 | 7.60 | 3815.79 | 570.06 | 499.96 | 2.84 | 0.14 | 0.14 |
| 17.0–17.5 | 46 | 0.0710–0.0549 | 0.0630 (0.0534–0.0711) | 46.00 | 7.84 | 6.76 | 2857.14 | 486.79 | 420.12 | 2.61 | 0.16 | 0.16 |
| 17.5–18.0 | 20 | 0.0549–0.0486 | 0.0517 (0.0463–0.0589) | 20.00 | 5.56 | 4.44 | 3174.60 | 881.78 | 705.41 | 2.58 | 0.25 | 0.25 |
| 18.0–18.5 | 18 | 0.0486–0.0440 | 0.0463 (0.0414–0.0506) | 18.00 | 5.33 | 4.21 | 3913.04 | 1158.72 | 915.89 | 2.62 | 0.26 | 0.27 |
| 18.5–19.0 | 18 | 0.0440–0.0396 | 0.0418 (0.0383–0.0461) | 18.00 | 5.33 | 4.21 | 4090.91 | 1211.39 | 957.52 | 2.59 | 0.26 | 0.27 |
| 19.0–19.5 | 9 | 0.0396–0.0368 | 0.0382 (0.0356–0.0420) | 9.00 | 4.12 | 2.96 | 3214.29 | 1472.32 | 1056.44 | 2.45 | 0.38 | 0.40 |
| 19.5–20.0 | 15 | 0.0368–0.0339 | 0.0353 (0.0330–0.0390) | 15.00 | 4.97 | 3.84 | 5172.41 | 1713.32 | 1324.34 | 2.62 | 0.29 | 0.30 |
| 20.0–20.5 | 22 | 0.0339–0.0311 | 0.0325 (0.0305–0.0370) | 22.00 | 5.77 | 4.66 | 7857.14 | 2060.61 | 1665.60 | 2.77 | 0.23 | 0.24 |
| 20.5–21.0 | 4 | 0.0311–0.0294 | 0.0302 (0.0286–0.0350) | 4.00 | 3.18 | 1.94 | 2352.94 | 1870.26 | 1139.11 | 2.21 | 0.58 | 0.66 |
Assuming that the observed lithium depletion boundary is at M 0.075 M⊙ (MZ = 11.44 Stauffer et al., 1998; Barrado y Navascués et al., 2004) and a distance of 120.2 pc, the sample extracted by method #2 contains 1147 Pleiades member candidates, divided up into 978 stars (83.3%) and 169 brown dwarfs (14.7%). Similar percentages are obtained considering the sample of 947 high probability members (p60%) identified in the probabilistic approach with 10.3% of brown dwarfs. Hence, the star (0.6–0.08 M⊙) to brown dwarf (0.08–0.03 M⊙) ratio in the Pleiades lies between 5.4–6.3 and 8.6–9.3 if we consider a 3 limit in the distance of the Pleiades (114.5–125.9 pc; van Leeuwen, 2009). These numbers are in agreement with measurements (with slightly different mass ranges depending on the survey) derived from the field mass function (1.7–5.3; Kroupa, 2002; Chabrier, 2005; Andersen et al., 2006), young star-forming regions (3.0–6.4 for the Trapezium Cluster; 3.8-4.3 for Orionis; 3.8 for Chamaeleon; 8.3–11.6 for IC 348; Hillenbrand & Carpenter, 2000; Muench et al., 2002; Luhman et al., 2003; Andersen et al., 2006; Luhman, 2007; Lodieu et al., 2009), open clusters (3.7 for the Pleiades and 4.5 for M35; Bouvier et al., 1998; Barrado y Navascués et al., 2001), and hydrodynamical simulations of star clusters (3.8–5.0; Bate, 2009, 2011).
7.2 The cluster mass function
In this section we adopt the logarithmic form of the Initial Mass Function as originally proposed by Salpeter (1955): () = d/d() m-α. We converted the luminosity into a mass function using the NextGen models (Baraffe et al., 1998) for stars and brown dwarfs more massive than 50 MJup (Teff) and the DUSTY models (Chabrier et al., 2000) for less massive brown dwarfs. The = 12–21.5 mag range translates into masses between 0.62 and 0.03 M⊙, assuming a revised distance of 120.2 pc (van Leeuwen, 2009) and an age of 120 Myr for which the models are computed.
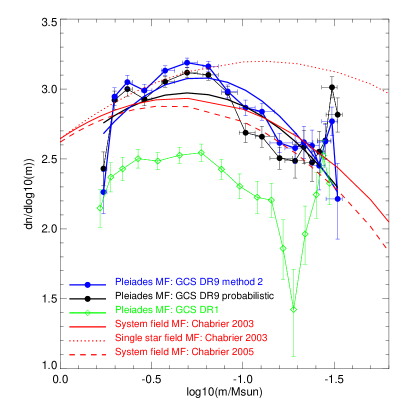
We included in Fig. 9 errors in both the x-axis (M) and y-axis (dN/dM) as follows. For the error bars on the masses, we considered three times the uncertainties on the age (1258 Myr; Stauffer et al., 1998) and distance (120.21.9 pc; van Leeuwen, 2009) of the Pleiades given us a validity range of 3 on the x-axis. Hence, we computed the masses with the 100 Myr NextGen and DUSTY isochrones shifted at a distance of 114.5 pc to define the lower limit and repeated the procedure with the 150 Myr isochrones for a distance of 125.9 pc as upper limits. (The uncertainties on the y-axis i.e. the dN/dM values are simply Gehrels error bars). The highest-mass point is incomplete due to the saturation of the GCS as are the two lowest-mass points of the mass function because the last two magnitude bins in the -band are more contaminated. Using these upper and lower bounds for the predicted masses for cluster members we refit the log–normal MF to examine the effects on the parameters of the fit (Fig. 10.) Following the Chabrier (2003) Gaussian parameterisation (his Equation 12) 4e find a characteristic mass M⊙ and a mass dispersion (Chabrier (2005) quotes and for the disk system MF whereas Chabrier (2003) quotes and ).
Overall we find that our Pleiades mass function is well represented by a log-normal form over the 0.6–0.03 M⊙ mass range with a characteristic mass of 0.24 M⊙ (Fig. 10). This result is in agreement with all previous studies in the Pleiades (Moraux et al., 2001; Tej et al., 2002; Dobbie et al., 2002; Deacon & Hambly, 2004) over the same mass range and consistent with the extrapolation of the system field mass function (Chabrier, 2005) which can also reproduce preliminary densities of field L and T dwarfs found in large-scale surveys (Metchev et al., 2008; Burningham et al., 2010; Reylé et al., 2010; Kirkpatrick et al., 2011) as displayed in Fig. 9. All these determinations of the mass function support the universality of the IMF as discussed in the review of Bastian et al. (2010) except for the case of Taurus (Briceño et al., 2002; Luhman et al., 2003). The latest hydrodynamical simulation of Bate (2011) is able to reproduce the observed field mass function (Kroupa, 2002; Chabrier, 2005) with high confidence after inclusion of radiative feedback, in agreement with independent calculations (Offner et al., 2009; Urban et al., 2010; Krumholz et al., 2011).
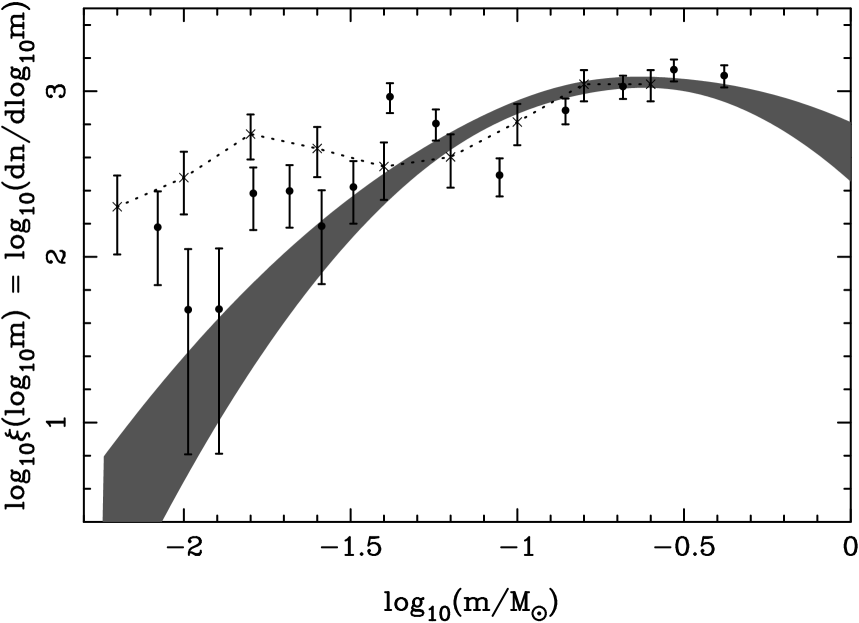
It is interesting to compare an extrapolation to lower masses of the log–normal Pleiades mass function derived here with results from other younger GCS targets (Fig. 10). While the Pleiades is measured in a higher mass range and shows a closely log–normal form, the IMF from a carefully cleaned spectroscopic sample in Upper Sco (Lodieu et al., 2011) penetrates to lower masses and seems to be much shallower in the substellar regime, implying the presence of more brown dwarfs. Results for the sigma Orionis cluster show a similar trend (Lodieu et al., 2009), although to a less obvious extent. Of course, these mass functions have been derived assuming that the evolutionary models accurately predict colours, bolometric magnitudes and temperatures at the different ages (especially ages 10 Myr) and assuming also that any systematic errors introduced by not accounting for unresolved binarity cancel in the comparison. In Fig. 11 we show an ’-plot’ equivalent to the ‘alpha plot’ with = 1), i.e. a plot of the gradient of mass function as a function of mass, in order to compare with the constraints set on the field IMF gradient by the UKIDSS Large Area Survey T–type brown dwarf searches (e.g. Lodieu et al., 2007; Pinfield et al., 2008; Burningham et al., 2010)). While the mass functions of the more aged populations like Praesepe (Kraus & Hillenbrand, 2007; Boudreault et al., 2010; Baker et al., 2010) or the field (Metchev et al., 2008; Burningham et al., 2010; Reylé et al., 2010; Kirkpatrick et al., 2011) show gradients consistent with the Pleiades log–normal, power–law fits to the very young Upper Sco (; Lodieu et al., 2011) and Orionis (=-0.50.2; Lodieu et al., 2009) clusters are flatter. This may be evidence of a variation in the substellar IMF, or simply an artefact of systematic errors in the evolutionary model predictions at very young ages or age spreads. We should emphasise that the upper limit set for the field mass function by Burningham et al. (2010) remains under debate (due to the lack of constraints on masses and ages) as the CFHT brown dwarf survey (Reylé et al., 2010) and the preliminary densities determined by WISE (Kirkpatrick et al., 2011) suggest positive values for the mass function in the T dwarf regime (see also Metchev et al., 2008).

8 Summary
We have presented the outcome of a wide (80 square degrees) and deep ( 18.8 mag) survey in the Pleiades open cluster as part of the UKIDSS Galactic Clusters Survey Data Release 9. The main results of our analysis can be summarised as follows:
-
•
we recovered Pleiades member candidates previously published and updated their membership assignations
-
•
we selected photometrically and astrometrically potential Pleiades member candidates using two independent but complementary methods: the probabilistic analysis and a more standard method combining photometry and proper motion cuts
-
•
we derived a BD binary fraction around 25.64.5% in the 0.075–0.03 M⊙ mass range with a difference of a factor of two between high-mass (0.075–0.05 M⊙) and low-mass (0.05–0.03 M⊙) brown dwarfs for separations less than 100–200 au
-
•
we investigated the -band variability of Pleiades members and found virtually no variability at the level of 0.08 mag
-
•
we derived the luminosity function from both selection methods and found no difference within the error bars
-
•
we derived the Pleiades mass function which is best fit by a log-normal function peaking at 0.16–0.20 M⊙ in the 0.6–0.03 M⊙ range, in agreement with previous studies in the cluster and the extrapolation of the system field mass function
This paper represents a significant improvement in our knowledge of the Pleiades population and the cluster mass function in the substellar regime over the full cluster. We believe that this paper will represent a reference for many more years to come. We will now extend this study to other regions surveyed by the GCS to adress the question of the universality of the mass function using an homogeneous set of photometric and astrometric data. Future work to constraint current models of star formation include the search for companions to investigate their multiplicity properties, the determination of the radial velocities of Pleiades members, and deeper surveys to test the theory of the fragmentation limit.
Acknowledgments
NL is funded by the Ramón y Cajal fellowship number 08-303-01-02 and the national program AYA2010-19136 funded by the Spanish ministry of science and innovation. This work is based in part on data obtained as part of the UKIRT Infrared Deep Sky Survey (UKIDSS). The UKIDSS project is defined in Lawrence et al. (2007). UKIDSS uses the UKIRT Wide Field Camera (WFCAM; Casali et al., 2007). The photometric system is described in Hewett et al. (2006), and the calibration is described in Hodgkin et al. (2009). The pipeline processing and science archive are described in Irwin et al. (in prep) and Hambly et al. (2008), respectively. We thank our colleagues at the UK Astronomy Technology Centre, the Joint Astronomy Centre in Hawaii, the Cambridge Astronomical Survey and Edinburgh Wide Field Astronomy Units for building and operating WFCAM and its associated data flow system. We are grateful to Isabelle Baraffe and France Allard for providing us with the NextGen, DUSTY and COND models for the WFCAM filters.
This research has made use of the Simbad database, operated at the Centre de Données Astronomiques de Strasbourg (CDS), and of NASA’s Astrophysics Data System Bibliographic Services (ADS). This publication has also made use of data products from the Two Micron All Sky Survey, which is a joint project of the University of Massachusetts and the Infrared Processing and Analysis Center/California Institute of Technology, funded by the National Aeronautics and Space Administration and the National Science Foundation.
References
- Adams et al. (2001) Adams J. D., Stauffer J. R., Monet D. G., Skrutskie M. F., Beichman C. A., 2001, AJ, 121, 2053
- Andersen et al. (2006) Andersen M., Meyer M. R., Oppenheimer B., Dougados C., Carpenter J., 2006, AJ, 132, 2296
- Artyukhina (1969) Artyukhina N. M., 1969, 12, 987
- Baker et al. (2010) Baker D. E. A., Jameson R. F., Casewell S. L., Deacon N., Lodieu N., Hambly N., 2010, MNRAS, 408, 2457
- Baraffe et al. (1998) Baraffe I., Chabrier G., Allard F., Hauschildt P. H., 1998, A&A, 337, 403
- Barrado y Navascués et al. (2004) Barrado y Navascués D., Stauffer J. R., Jayawardhana R., 2004, ApJ, 614, 386
- Barrado y Navascués et al. (2002) Barrado y Navascués D., Bouvier J., Stauffer J. R., Lodieu N., McCaughrean M. J., 2002, A&A, 395, 813
- Barrado y Navascués et al. (2001) Barrado y Navascués D., Stauffer J. R., Bouvier J., Martín E. L., 2001, ApJ, 546, 1006
- Basri & Martín (1999) Basri G., Martín E. L., 1999, AJ, 118, 2460
- Basri & Reiners (2006) Basri G., Reiners A., 2006, AJ, 132, 663
- Bastian et al. (2010) Bastian N., Covey K. R., Meyer M. R., 2010, ArXiv e-prints
- Bate (2009) Bate M. R., 2009, MNRAS, 392, 590
- Bate (2011) Bate M. R., 2011, MNRAS, 418, 703
- Béjar et al. (2001) Béjar V. J. S., et al. 2001, ApJ, 556, 830
- Bihain et al. (2006) Bihain G., Rebolo R., Béjar V. J. S., Caballero J. A., Bailer-Jones C. A. L., Mundt R., Acosta-Pulido J. A., Manchado Torres A., 2006, A&A, 458, 805
- Bihain et al. (2010) Bihain G., Rebolo R., Zapatero Osorio M. R., Béjar V. J. S., Caballero J. A., 2010, A&A, 519, A93
- Boudreault et al. (2010) Boudreault S., Bailer-Jones C. A. L., Goldman B., Henning T., Caballero J. A., 2010, A&A, 510, A27+
- Bouvier et al. (1998) Bouvier J., Stauffer J. R., Martín E. L., Barrado y Navascués D., Wallace B., Béjar V. J. S., 1998, A&A, 336, 490
- Bouy et al. (2006) Bouy H., Moraux E., Bouvier J., Brandner W., Martín E. L., Allard F., Baraffe I., Fernández M., 2006, ApJ, 637, 1056
- Briceño et al. (2002) Briceño C., Luhman K. L., Hartmann L., Stauffer J. R., Kirkpatrick J. D., 2002, ApJ, 580, 317
- Burgasser et al. (2007) Burgasser A. J., et al. eds, Protostars and Planets V Not Alone: Tracing the Origins of Very-Low-Mass Stars and Brown Dwarfs Through Multiplicity Studies. pp 427–441
- Burningham et al. (2010) Burningham B., et al. 2010, MNRAS, 406, 1885
- Casali et al. (2007) Casali M., et al. 2007, A&A, 467, 777
- Casewell et al. (2007) Casewell S. L., Dobbie P. D., Hodgkin S. T., Moraux E., Jameson R. F., Hambly N. C., Irwin J., Lodieu N., 2007, MNRAS, 378, 1131
- Casewell et al. (2010) Casewell S. L., Dobbie P. D., Hodgkin S. T., Moraux E., Jameson R. F., Hambly N. C., Irwin J., Lodieu N., 2010, MNRAS, 402, 1407
- Casewell et al. (2011) Casewell S. L., Jameson R. F., Burleigh M. R., Dobbie P. D., Roy M., Hodgkin S. T., Moraux E., 2011, MNRAS, 412, 2071
- Chabrier (2003) Chabrier G., 2003, PASP, 115, 763
- Chabrier (2005) Chabrier G., 2005, in E. Corbelli, F. Palla, & H. Zinnecker ed., The Initial Mass Function 50 Years Later Vol. 327 of Astrophysics and Space Science Library, The Initial Mass Function: from Salpeter 1955 to 2005. p. 41
- Chabrier et al. (2000) Chabrier G., Baraffe I., Allard F., Hauschildt P., 2000, ApJ, 542, 464
- Cutri et al. (2003) Cutri R. M., et al. 2003, 2MASS All Sky Catalog of point sources, 2246
- Deacon & Hambly (2004) Deacon N. R., Hambly N. C., 2004, A&A, 416, 125
- Dobbie et al. (2002) Dobbie P. D., Kenyon F., Jameson R. F., Hodgkin S. T., Pinfield D. J., Osborne S. L., 2002, MNRAS, 335, 687
- Dobbie et al. (2002) Dobbie P. D., Pinfield D. J., Jameson R. F., Hodgkin S. T., 2002, MNRAS, 335, L79
- Festin (1998) Festin L., 1998, A&A, 333, 497
- Gatewood et al. (2000) Gatewood G., de Jonge J. K., Han I., 2000, ApJ, 533, 938
- Hambly et al. (2008) Hambly N. C., et al. 2008, MNRAS, 384, 637
- Hambly et al. (1993) Hambly N. C., Hawkins M. R. S., Jameson R. F., 1993, A&AS, 100, 607
- Hambly et al. (1999) Hambly N. C., Hodgkin S. T., Cossburn M. R., Jameson R. F., 1999, MNRAS, 303, 835
- Hambly et al. (1995) Hambly N. C., Steele I. A., Hawkins M. R. S., Jameson R. F., 1995, MNRAS, 273, 505
- Haro et al. (1982) Haro G., Chavira E., Gonzalez G., 1982, Boletin del Instituto de Tonantzintla, 3, 3
- Hertzsprung (1947) Hertzsprung E., 1947, Annalen van de Sterrewacht te Leiden, 19, A1
- Hewett et al. (2006) Hewett P. C., Warren S. J., Leggett S. K., Hodgkin S. T., 2006, MNRAS, 367, 454
- Hillenbrand & Carpenter (2000) Hillenbrand L. A., Carpenter J. M., 2000, ApJ, 540, 236
- Hodgkin et al. (2009) Hodgkin S. T., Irwin M. J., Hewett P. C., Warren S. J., 2009, MNRAS, 394, 675
- Jameson et al. (2002) Jameson R. F., Dobbie P. D., Hodgkin S. T., Pinfield D. J., 2002, MNRAS, 335, 853
- Jameson & Skillen (1989) Jameson R. F., Skillen I., 1989, MNRAS, 239, 247
- Johnson (1957) Johnson H. L., 1957, ApJ, 126, 121
- Jones (1981) Jones B. F., 1981, AJ, 86, 290
- Jones & Stauffer (1991) Jones B. F., Stauffer J. R., 1991, AJ, 102, 1080
- Kirkpatrick et al. (2011) Kirkpatrick J. D., et al. 2011, ApJS, 197, 17
- Kraus & Hillenbrand (2007) Kraus A. L., Hillenbrand L. A., 2007, AJ, 134, 2340
- Kroupa (2002) Kroupa P., 2002, Science, 295, 82
- Krumholz et al. (2011) Krumholz M. R., Klein R. I., McKee C. F., 2011, ApJ, 740, 74
- Lawrence et al. (2007) Lawrence A., et al. 2007, MNRAS, 379, 1599
- Lodieu et al. (2007) Lodieu N., Dobbie P. D., Deacon N. R., Hodgkin S. T., Hambly N. C., Jameson R. F., 2007, MNRAS, 380, 712
- Lodieu et al. (2007) Lodieu N., et al. 2007, MNRAS, 379, 1423
- Lodieu et al. (2011) Lodieu N., Dobbie P. D., Hambly N. C., 2011, A&A, 527, A24
- Lodieu et al. (2006) Lodieu N., Hambly N. C., Jameson R. F., 2006, MNRAS, 373, 95
- Lodieu et al. (2007) Lodieu N., Hambly N. C., Jameson R. F., Hodgkin S. T., Carraro G., Kendall T. R., 2007, MNRAS, 374, 372
- Lodieu et al. (2009) Lodieu N., Zapatero Osorio M. R., Rebolo R., Martín E. L., Hambly N. C., 2009, A&A, 505, 1115
- Lucas & Roche (2000) Lucas P. W., Roche P. F., 2000, MNRAS, 314, 858
- Luhman (1999) Luhman K. L., 1999, ApJ, 525, 466
- Luhman (2007) Luhman K. L., 2007, ApJS, 173, 104
- Luhman et al. (2003) Luhman K. L., Briceño C., Stauffer J. R., Hartmann L., Barrado y Navascués D., Caldwell N., 2003, ApJ, 590, 348
- Luhman et al. (1997) Luhman K. L., Liebert J., Rieke G. H., 1997, ApJL, 489, L165
- Luhman et al. (2003) Luhman K. L., Stauffer J. R., Muench A. A., Rieke G. H., Lada E. A., Bouvier J., Lada C. J., 2003, ApJ, 593, 1093
- Martín et al. (2003) Martín E. L., Barrado y Navascués D., Baraffe I., Bouy H., Dahm S., 2003, ApJ, 594, 525
- Martín et al. (1998) Martín E. L., Basri G., Gallegos J. E., Rebolo R., Zapatero-Osorio M. R., Bejar V. J. S., 1998, ApJL, 499, L61
- Martín et al. (2000) Martín E. L., Brandner W., Bouvier J., Luhman K. L., Stauffer J., Basri G., Zapatero Osorio M. R., Barrado y Navascués D., 2000, ApJ, 543, 299
- Martín et al. (1998) Martín E. L., Zapatero Osorio M. R., Rebolo R., 1998, in ASP Conf. Ser. 134: “Brown Dwarfs and Extrasolar Planets”, eds. R. Rebolo, E. L. Martín, and M. R. Zapatero Osorio The Substellar Initial Mass Function in the Pleiades. p. p 507
- Maxted & Jeffries (2005) Maxted P. F. L., Jeffries R. D., 2005, MNRAS, 362, L45
- Mermilliod (1981) Mermilliod J. C., 1981, A&A, 97, 235
- Metchev et al. (2008) Metchev S. A., Kirkpatrick J. D., Berriman G. B., Looper D., 2008, ApJ, 676, 1281
- Miller & Scalo (1979) Miller G. E., Scalo J. M., 1979, ApJS, 41, 513
- Moraux et al. (2001) Moraux E., Bouvier J., Stauffer J. R., 2001, A&A, 367, 211
- Moraux et al. (2003) Moraux E., Bouvier J., Stauffer J. R., Cuillandre J.-C., 2003, A&A, 400, 891
- Muench et al. (2002) Muench A. A., Lada E. A., Lada C. J., Alves J., 2002, ApJ, 573, 366
- O’dell et al. (1994) O’dell M. A., Hendry M. A., Collier Cameron A., 1994, MNRAS, 268, 181
- Offner et al. (2009) Offner S. S. R., Klein R. I., McKee C. F., Krumholz M. R., 2009, ApJ, 703, 131
- Pinfield et al. (2000) Pinfield D. J., Hodgkin S. T., Jameson R. F., Cossburn M. R., Hambly N. C., Devereux N., 2000, MNRAS, 313, 347
- Pinfield et al. (2008) Pinfield D. J., et al. 2008, MNRAS, 390, 304
- Rebolo et al. (1995) Rebolo R., Zapatero-Osorio M. R., Martín E. L., 1995, Nat, 377, 129
- Reylé et al. (2010) Reylé C., et al. 2010, A&A, 522, A112
- Robichon et al. (1999) Robichon N., Arenou F., Mermilliod J.-C., Turon C., 1999, A&A, 345, 471
- Salpeter (1955) Salpeter E. E., 1955, ApJ, 121, 161
- Scalo (1986) Scalo J. M., 1986, Fundamentals of Cosmic Physics, 11, 1
- Skrutskie et al. (2006) Skrutskie M. F., et al. 2006, AJ, 131, 1163
- Southworth et al. (2005) Southworth J., Maxted P. F. L., Smalley B., 2005, A&A, 429, 645
- Stauffer et al. (1991) Stauffer J., Klemola A., Prosser C., Probst R., 1991, AJ, 101, 980
- Stauffer et al. (1994) Stauffer J. R., Hamilton D., Probst R. G., 1994, AJ, 108, 155
- Stauffer et al. (2007) Stauffer J. R., et al. 2007, ApJS, 172, 663
- Stauffer et al. (1998) Stauffer J. R., Schild R., Barrado y Navascues D., Backman D. E., Angelova A. M., Kirkpatrick J. D., Hambly N., Vanzi L., 1998, ApJ, 504, 805
- Stauffer et al. (1998) Stauffer J. R., Schultz G., Kirkpatrick J. D., 1998, ApJL, 499, 219
- Tej et al. (2002) Tej A., Sahu K. C., Chandrasekhar T., Ashok N. M., 2002, ApJ, 578, 523
- Trumpler (1921) Trumpler R. J., 1921, Lick Observatory Bulletin, 10, 110
- Urban et al. (2010) Urban A., Martel H., Evans II N. J., 2010, ApJ, 710, 1343
- van Leeuwen (2009) van Leeuwen F., 2009, A&A, 497, 209
- van Leeuwen et al. (1986) van Leeuwen F., Alphenaar P., Brand J., 1986, A&AS, 65, 309
- Zapatero Osorio et al. (2002) Zapatero Osorio M. R., Béjar V. J. S., Martín E. L., Rebolo R., Barrado y Navascués D., Mundt R., Eislöffel J., Caballero J. A., 2002, ApJ, 578, 536
- Zapatero Osorio et al. (1997) Zapatero Osorio M. R., Rebolo R., Martín E. L., 1997, A&A, 317, 164
- Zapatero Osorio et al. (1999) Zapatero Osorio M. R., Rebolo R., Martín E. L., Hodgkin S. T., Cossburn M. R., Magazzù A., Steele I. A., Jameson R. F., 1999, A&AS, 134, 537
Appendix A Table of known Pleiades member candidates published in the literature and recovered in UKIDSS GCS DR9.
| R.A. | Dec. | 1 | 2 | err | err | Prob | Name | |||||
|---|---|---|---|---|---|---|---|---|---|---|---|---|
| 03 27 54.26 | +24 56 10.9 | 13.808 | 13.400 | 12.820 | 12.255 | 12.005 | 99.999 | 16.626.95 | 43.606.95 | 0.47 | 0.93 | DH003 |
| 03 29 58.76 | +23 22 18.3 | 13.640 | 13.198 | 12.672 | 12.244 | 11.843 | 11.851 | 21.183.41 | 38.833.41 | 0.47 | 0.81 | DH009 |
| … | … | … | … | … | … | … | … | … | … | … | … | … |
| 04 05 13.75 | +24 08 42.7 | 14.983 | 14.471 | 13.846 | 13.261 | 12.933 | 12.917 | 19.773.38 | 41.503.38 | 0.54 | 0.94 | DH915 |
| 04 06 29.99 | +22 33 43.6 | 14.376 | 13.856 | 13.201 | 12.623 | 12.273 | 12.269 | 14.835.07 | 33.965.07 | 0.55 | 0.14 | DH2004_916 |
Appendix B Table of previously-known Pleiades member candidates not recovered in the UKIDSS GCS DR9
| R.A. | Dec. | Old Names |
|---|---|---|
| 03:27:42.06 | 23:48:13.3 | PELS121 |
| 03:28:01.56 | 23:04:42.6 | DH004 |
| … | … | … |
| 04:05:09.44 | 23:28:59.0 | DH913 |
| 04:05:13.72 | 22:18:19.0 | DH914 |
Appendix C Table of new Pleiades member candidates identified in the UKIDSS GCS DR9
| R.A. | Dec. | 1 | 2 | Prob | S | ||||||
|---|---|---|---|---|---|---|---|---|---|---|---|
| 03 24 59.74 | 25 34 04.5 | 16.878 0.009 | 16.243 0.007 | 15.582 0.007 | 14.987 0.010 | 14.606 0.005 | 99.99999.999 | 38.597.21 | 49.577.21 | — | 2 |
| 03 25 30.92 | 24 51 39.9 | 20.316 0.126 | 19.478 0.096 | 18.600 0.079 | 18.210 0.160 | 18.170 0.120 | 99.99999.999 | 10.7231.33 | 45.7631.33 | 0.60 | 1 |
| … | … | … | … | … | … | … | … | … | … | ||
| 04 10 54.54 | 26 01 42.4 | 19.642 0.091 | 99.99999.999 | 17.748 0.036 | 17.002 0.027 | 16.417 0.022 | 99.99999.999 | 17.385.99 | 47.115.99 | 0.66 | 1 |
| 04 11 03.84 | 23 15 48.9 | 17.766 0.017 | 17.254 0.014 | 16.599 0.014 | 15.986 0.017 | 15.599 0.021 | 15.623 0.012 | 18.366.81 | 46.346.81 | 0.61 | 1 |
Appendix D Table of substellar multiple system candidates in the Pleiades
| R.A. | Dec. | 1 | 2 | ||||||
|---|---|---|---|---|---|---|---|---|---|
| 03 25 38.73 | +22 57 39.8 | 15.890 | 15.269 | 14.601 | 13.974 | 13.618 | 13.628 | 24.455.11 | 47.025.11 |
| 03 31 20.71 | +25 57 33.6 | 16.847 | 16.068 | 15.309 | 14.745 | 14.321 | 14.328 | 21.733.39 | 38.423.39 |
| 03 32 11.55 | +21 27 55.7 | 16.385 | 15.652 | 14.906 | 14.339 | 13.949 | 13.920 | 13.643.89 | 40.003.89 |
| 03 33 49.22 | +19 59 52.0 | 18.539 | 18.104 | 16.453 | 15.767 | 15.433 | 15.492 | 1.676.44 | 40.376.44 |
| 03 34 38.61 | +24 51 28.5 | 17.097 | 16.247 | 15.459 | 14.920 | 14.445 | 14.466 | 13.392.69 | 37.212.69 |
| 03 36 01.95 | +27 11 04.7 | 16.248 | 15.492 | 14.774 | 14.234 | 13.810 | 13.782 | 15.793.79 | 42.703.79 |
| 03 36 03.85 | +22 52 03.5 | 18.072 | 16.873 | 15.913 | 15.240 | 14.679 | 14.679 | 22.463.15 | 46.193.15 |
| 03 36 53.30 | +26 34 27.9 | 17.046 | 16.171 | 15.379 | 14.804 | 14.355 | 14.353 | 15.543.33 | 34.043.33 |
| 03 40 11.98 | +21 48 31.8 | 16.578 | 15.884 | 15.169 | 14.580 | 14.187 | 14.178 | 24.162.54 | 40.672.54 |
| 03 40 45.16 | +27 50 40.4 | 17.074 | 16.218 | 15.404 | 14.816 | 14.321 | 14.333 | 12.373.34 | 40.373.34 |
| 03 40 53.66 | +28 21 11.5 | 18.880 | 17.570 | 16.490 | 15.852 | 15.194 | 15.199 | 13.914.06 | 31.574.06 |
| 03 41 40.91 | +25 54 24.1 | 16.893 | 16.001 | 15.180 | 14.574 | 14.122 | 14.125 | 16.942.26 | 42.132.26 |
| 03 41 42.41 | +23 54 57.1 | 16.171 | 15.464 | 14.709 | 14.124 | 13.686 | 99.999 | 14.072.31 | 47.372.31 |
| 03 41 54.16 | +23 05 04.7 | 17.349 | 16.376 | 15.522 | 14.975 | 14.415 | 14.418 | 18.192.30 | 44.742.30 |
| 03 43 34.49 | +25 57 30.6 | 16.571 | 15.727 | 14.909 | 14.359 | 13.909 | 13.901 | 20.922.25 | 47.722.25 |
| 03 44 14.65 | +23 49 40.0 | 15.892 | 15.245 | 14.547 | 13.957 | 13.546 | 99.999 | 14.462.31 | 40.152.31 |
| 03 44 35.16 | +25 13 42.8 | 17.656 | 16.584 | 15.662 | 14.985 | 14.448 | 14.460 | 19.332.26 | 44.972.26 |
| 03 44 35.90 | +23 34 41.9 | 16.307 | 15.672 | 14.985 | 14.376 | 13.990 | 13.985 | 16.942.23 | 44.392.23 |
| 03 45 09.46 | +23 58 44.7 | 16.974 | 16.250 | 15.438 | 14.872 | 14.424 | 14.410 | 16.072.25 | 42.232.25 |
| 03 45 31.37 | +24 52 47.4 | 17.332 | 16.330 | 15.465 | 14.839 | 14.354 | 14.326 | 16.692.24 | 40.302.24 |
| 03 45 37.76 | +23 43 50.1 | 16.240 | 15.456 | 14.715 | 14.172 | 13.756 | 13.742 | 20.912.23 | 45.452.23 |
| 03 45 41.27 | +23 54 09.7 | 17.166 | 16.189 | 15.360 | 14.782 | 14.305 | 14.309 | 17.462.24 | 44.472.24 |
| 03 45 50.66 | +24 09 03.5 | 17.478 | 16.582 | 15.705 | 15.095 | 14.580 | 14.560 | 16.012.26 | 40.582.26 |
| 03 46 05.11 | +23 45 34.9 | 17.229 | 16.347 | 15.522 | 14.851 | 14.385 | 14.404 | 15.882.25 | 39.212.25 |
| 03 46 15.11 | +26 46 48.8 | 16.624 | 15.838 | 15.032 | 14.495 | 14.037 | 14.088 | 20.732.97 | 42.792.97 |
| 03 46 20.27 | +23 58 18.9 | 19.259 | 18.174 | 17.034 | 16.269 | 15.650 | 15.585 | 12.972.40 | 35.002.40 |
| 03 46 22.25 | +23 52 26.6 | 17.120 | 16.323 | 15.518 | 14.917 | 14.474 | 14.472 | 17.652.25 | 38.042.25 |
| 03 46 26.09 | +24 05 09.5 | 16.810 | 15.967 | 15.160 | 14.584 | 14.118 | 14.098 | 19.412.24 | 38.712.24 |
| 03 46 27.10 | +21 48 22.6 | 19.797 | 18.650 | 17.374 | 16.564 | 15.848 | 15.925 | 20.952.98 | 48.672.98 |
| 03 47 11.79 | +24 13 31.3 | 16.305 | 15.554 | 14.792 | 14.261 | 13.841 | 13.850 | 16.882.23 | 41.272.23 |
| 03 47 20.48 | +19 54 25.5 | 17.011 | 16.054 | 15.210 | 14.615 | 14.152 | 14.140 | 28.115.10 | 39.395.10 |
| 03 48 04.67 | +23 39 30.1 | 17.014 | 16.054 | 15.283 | 14.704 | 14.256 | 14.238 | 16.072.24 | 44.272.24 |
| 03 48 31.53 | +24 34 37.2 | 19.218 | 17.883 | 16.715 | 15.977 | 15.357 | 15.312 | 11.922.37 | 46.682.37 |
| 03 48 35.20 | +22 53 42.1 | 16.176 | 15.452 | 14.745 | 14.185 | 13.770 | 13.772 | 15.222.15 | 45.622.15 |
| 03 48 50.45 | +22 44 29.8 | 16.562 | 15.825 | 15.098 | 14.531 | 14.141 | 14.143 | 15.642.16 | 42.062.16 |
| 03 48 57.41 | +23 13 59.1 | 16.835 | 16.033 | 15.222 | 14.673 | 14.194 | 14.194 | 14.932.17 | 36.622.17 |
| 03 50 52.17 | +23 27 11.2 | 17.690 | 16.638 | 15.700 | 15.060 | 14.505 | 14.555 | 19.892.21 | 41.332.21 |
| 03 51 38.96 | +24 30 44.8 | 18.711 | 17.407 | 16.400 | 15.718 | 15.168 | 15.122 | 23.012.34 | 40.472.34 |
| 03 53 55.13 | +23 23 36.1 | 16.947 | 16.027 | 15.172 | 14.569 | 14.088 | 14.081 | 19.172.28 | 44.722.28 |
| 03 55 27.06 | +25 14 45.8 | 16.118 | 15.402 | 14.649 | 14.071 | 13.671 | 13.650 | 15.242.24 | 39.662.24 |
| 03 56 52.31 | +25 10 05.1 | 16.146 | 15.491 | 14.756 | 14.192 | 13.771 | 13.801 | 16.662.50 | 38.222.50 |
| 03 58 00.62 | +21 18 20.8 | 17.399 | 16.380 | 15.545 | 14.931 | 14.445 | 14.423 | 24.813.43 | 32.133.43 |
| 03 58 17.43 | +22 11 52.7 | 16.259 | 15.503 | 14.768 | 14.193 | 13.787 | 13.778 | 20.642.89 | 34.952.89 |
| 03 59 59.85 | +25 08 53.6 | 16.368 | 15.695 | 15.004 | 14.433 | 14.029 | 14.075 | 14.872.51 | 35.692.51 |
| 04 00 03.21 | +22 24 46.0 | 16.534 | 15.875 | 15.128 | 14.550 | 14.132 | 14.141 | 15.922.87 | 33.982.87 |
| 04 00 08.16 | +22 32 01.1 | 16.449 | 15.820 | 15.102 | 14.503 | 14.098 | 14.104 | 16.312.88 | 39.632.88 |
| 04 00 50.52 | +23 43 52.9 | 16.184 | 15.380 | 14.647 | 14.089 | 13.660 | 99.999 | 24.523.56 | 40.903.56 |
| 04 01 28.43 | +23 30 59.6 | 16.318 | 15.539 | 14.772 | 14.202 | 13.788 | 13.788 | 24.553.37 | 39.203.37 |
| 04 01 39.83 | +22 47 53.7 | 16.669 | 15.899 | 15.153 | 14.575 | 14.169 | 14.157 | 21.163.39 | 42.623.39 |
| 04 01 50.95 | +22 59 15.5 | 16.363 | 15.631 | 14.906 | 14.311 | 13.912 | 13.906 | 20.723.38 | 38.983.38 |
| 04 09 17.80 | +26 03 31.2 | 17.120 | 16.480 | 15.759 | 15.003 | 14.603 | 99.999 | 6.564.49 | 33.734.49 |