Starbursts and High-Redshift Galaxies are Radioactive: High Abundances of 26Al and Other Short Lived Radionuclides
Abstract
Short lived radionuclides (SLRs) like 26Al are synthesized by massive stars and are a byproduct of star formation. The abundances of SLRs in the gas of a star-forming galaxy are inversely proportional to the gas consumption time. The rapid evolution of specific star formation rate (SSFR) of normal galaxies implies they had mean SLR abundances – times higher at . During the epoch of Solar system formation, the background SLR abundances of the Galaxy were up to twice as high as at present, if SLR yields from massive stars do not depend on metallicity. If SLRs are homogenized in the gas of galaxies, the high SSFRs of normal galaxies can partly explain the elevated abundance of SLRs like 60Fe and 26Al in the early Solar system. Starburst galaxies have much higher SSFRs still, and have enormous mean abundances of 26Al (26Al/27Al for Solar metallicity gas). The main uncertainty is whether the SLRs are mixed with the star-forming molecular gas: they could be trapped in hot gas and decay before entering the colder phases, or be blown out by starburst winds. I consider how variability in star-formation rate affects the SLR abundances, and I discuss how SLR transport may differ in these galaxies. The enhanced 26Al of starbursts might maintain moderate ionization rates ( – ), possibly dominating ionization in dense clouds not penetrated by cosmic rays. Similar ionization rates would be maintained in protoplanetary discs of starbursts, if the SLRs are well-mixed, and the radiogenic heating of planetesimals would likewise be much higher. In this way, galaxy evolution can affect the geological history of planetary systems.
keywords:
galaxies:starburst — galaxies:ISM — galaxies: evolution — nuclear reactions, nucleosynthesis, abundances — galaxies: high redshift — planets and satellites: formation1 Introduction
Massive, young stars are sites of nucleosynthesis, not just of the stable nuclides, but radioactive isotopes as well. Long-lived radioisotopes with decay times of billions of years or longer, such as 40K, mix into the interstellar medium (ISM), accumulating and provide a very low level source of energetic radiation in all gas (Cameron, 1962; Umebayashi & Nakano, 1981). More unstable isotopes are also synthesized; some have decay times of a few years or less and cannot reach most of the ISM. In between those two extremes are the short lived radionuclides (SLRs) of the ISM: with decay times, they can be present in a galaxy’s gas but only as long as star formation replenishes their abundances. The most prominent of the SLRs is 26Al, which is detected in gamma-ray decay lines from star-formation regions throughout the Milky Way (Mahoney et al., 1984; Diehl et al., 2006a). Another SLR that has recently been detected in gamma-ray lines is 60Fe (Harris et al., 2005).
SLRs are not just passive inhabitants of the ISM. By releasing energetic particles and radiation when they decay, they inject power that can heat or ionize the surrounding matter. In the Milky Way’s molecular clouds, the radioactivity is overwhelmed by that of cosmic rays, which sustain an ionization rate of . Rapidly star-forming galaxies known as starbursts may have elevated levels of cosmic rays and ionization rates a thousand times or more higher than the Milky Way (Suchkov, Allen, & Heckman 1993; Papadopoulos 2010). However, it is possible that cosmic rays are stopped by the abundant gas in starbursts before they enter the densest molecular gas. Gamma rays can provide ionization through large columns; but while the gamma-ray ionization rate can reach up to in the densest starbursts, in most starbursts gamma rays sustain relatively weak ionization (Lacki, 2012). SLRs like 26Al can in principle provide ionization through any column of gas, and if abundant enough, maintain moderate levels of ionization. The major open question for SLR-induced ionization is how well mixed the SLRs are with the gas of the galaxy, a process which takes anything up to 100 Myr; if the mixing times are longer than a few Myr, the SLRs are not abundant in most star-forming cores (Meyer & Clayton, 2000; Huss et al., 2009).
Meteorites recording the composition of the primordial Solar system demonstrate that SLRs were present during its formation. Assuming the SLRs were not created in situ by energetic radiation from the Sun (Lee et al., 1998), the SLRs provide evidence that the Solar system formed near a star-forming region with young massive stars (e.g., Adams, 2010). In fact, 26Al was overabundant by a factor in the primordial Solar system, with (), compared to its present day abundances in the Milky Way (e.g., Lee, Papanastassiou, & Wasserburg 1977; MacPherson, Davis, & Zinner 1995; Diehl et al. 2006a; Huss et al. 2009). Their quick decay time also indicate the Solar system formed quickly, within about a few Myr. SLRs, particularly 26Al, were a primary source of ionization in the Solar Nebula (Stepinski, 1992; Finocchi & Gail, 1997; Umebayashi & Nakano, 2009), affecting the conductivity and ultimately accretion rate in the protoplanetary disc. Moreover, 26Al and other SLRs may have regulated the early geological evolution of the Solar system by being a major source of heat in early planetesimals, driving their differentiation and rock metamorphism (e.g., Hutcheon & Hutchison, 1989; Grimm & McSween, 1993; Shukolyukov & Lugmair, 1993).
The contemporary Milky Way, with a star-formation rate (SFR) of a few stars per year is not a typical environment for most of the star-formation in the history of the Universe, however. Roughly 5-20% of star-formation at all times occurred in rapid starbursts mainly driven by galaxy-galaxy interactions and mergers (Rodighiero et al., 2011; Sargent et al., 2012). Furthermore, most of the star-formation in ‘normal’ galaxies occurred in massive galaxies with a much higher star-formation rate () at redshifts of 1 and higher, when most star-formation took place (e.g., Magnelli et al., 2009). These high star-formation rates translate into large masses of SLRs present in these galaxies. I will show that 26Al in these galaxies, if it is well mixed with the gas, can sustain rather high ionization rates in their ISMs. This has consequences for both star formation and planet formation.
When necessary, I assume a Hubble constant of , a matter density of , and a cosmological constant for the cosmology.
2 The Equilibrium Abundance of SLRs
In a one-zone model of a galaxy, which disregards spatial inhomogeneities, the complete equation for the SLR mass in the ISM is
| (1) |
where is the lifetime of the SLR in the galaxy. , the injection rate of the SLR, depends on the past star-formation history:
| (2) |
For a coeval stellar population of age , the yield is the mass ejection rate of the SLR into the interstellar medium per unit stellar mass (Cerviño et al., 2000).
If there are no big fluctuations in the star-formation rate over the past few Myr, then the SLR abundance approaches a steady-state. The equilibrium mass of a SLR in a galaxy is proportional to its star-formation (or supernova) rate averaged over the previous few Myr. We can then parametrize the injection of SLRs in the ISM by a yield per supernova:
| (3) |
regardless of whether SNe are actually the source of SLRs. The factor is the ratio of the supernova rate and star-formation rate. Then the equilibrium SLR mass is given by (e.g., Diehl et al., 2006a)
| (4) |
The supernova rate is proportional to the star-formation rate, so . The abundance of an SLR is given by , where is the mass of one atom of the SLR and is the gas mass in the galaxy. Therefore the abundance of an SLR is
| (5) |
The quantity is the gas consumption time. Note that it is related to the specific star formation rate, , as , where is the stellar mass and is the gas fraction. Therefore, we can express the equilibrium mass of the SLR in a galaxy as
| (6) |
Finally, the ratio of SLR abundance in a galaxy to that in the Milky Way is
| (7) | |||||
with a MW superscript referring to values in the present day Milky Way. Thus, galaxies with short gas consumption times (and generally those with high SSFRs) should have high abundances of SLRs. The reason is that in such galaxies, more of the gas is converted into stars and SLRs within the residence time of an SLR.
The greatest uncertainty in these abundances is the residence time . In the Milky Way, these times are just the radioactive decay times, defined here as the e-folding time. In starburst galaxies, however, much of the volume is occupied by a hot, low density gas which forms into a galactic wind with characteristic speeds of several hundred kilometres per second (e.g., Chevalier & Clegg 1985; Heckman, Armus, & Miley 1990; Strickland & Heckman 2009). If massive stars emit SLRs at random locations in the starburst, most of them will dump their SLRs into the wind phase of the ISM. The wind-crossing time is , where is the gas scale-height. The equilibrium time in starburst galaxies is then . Furthermore, the SLRs ejected into the wind may never mix with the molecular gas, so the fraction of SLRs injected into the molecular medium may be (I discuss this issue further in section 3.2). However, very massive stars are found close to their birth environments where there is a lot of molecular gas to enrich, and these may be the source of 26Al, as supported by the correlation of the 1.809 MeV 26Al decay line emission and free-free emission from massive young stars (Knödlseder, 1999).
Turning to the specific example of 26Al, I note that the yield of 26Al is thought to be per supernova (Diehl et al., 2006a). For a Salpeter initial mass function from , the supernova rate is , or in terms of the total infrared () luminosity of starbursts (Kennicutt 1998; Thompson, Quataert, & Waxman 2007). If I suppose all of the 26Al is retained by the molecular gas, so that the residence time is the 26Al decay time of 1.04 Myr, then the equilibrium abundance of 26Al in a galaxy is just
| (8) |
2.1 High-Redshift Normal Galaxies
The star-formation rates and stellar masses of normal star-forming galaxies lie on a ‘main sequence’ with a characteristic SSFR that varies weakly, if at all, with stellar mass (e.g., Brinchmann et al., 2004). However, the characteristic SSFR evolves rapidly with redshift (e.g., Daddi et al., 2007; Noeske et al., 2007; Karim et al., 2011), with out to – a rise of factor (Sargent et al., 2012). At , the SSFR of the main sequence then seems to remain constant (González et al., 2010).
Countering this rise in the SSFR, the gas fractions of normal galaxies at high were also higher: the high equilibrium masses of SLRs are diluted to some extent by higher gas masses. Hopkins et al. (2010) provide a convenient equation, motivated by the Schmidt law (Kennicutt, 1998), to describe the evolution of gas fraction:
| (9) |
assuming a gas fraction at , with a look back time of and a current cosmic age of (see also Hopkins et al., 2009). Since the gas fractions of normal galaxies at present are small, the evolution at low redshifts can be approximated as .
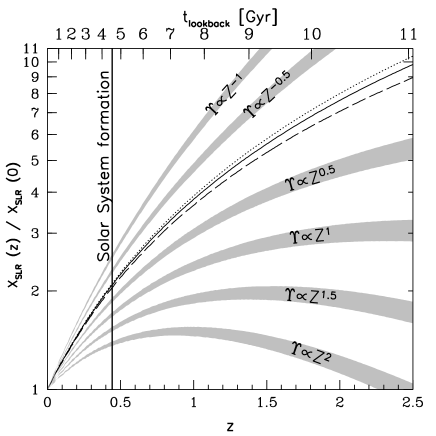
After calculating the mean abundances of SLRs in normal galaxies, I find that the rapid SSFR evolution overwhelms the modest evolution in at high : the SLR abundances of normal galaxies evolves quickly. These enhancements are plotted in Fig. 1.
Observational studies of high redshift main sequence galaxies indicate a slower evolution in , resulting from a quicker evolution of . Although equation 9 implies that was about twice as high ten billion years ago at , massive disc galaxies are observed with gas fractions of – , which is 3 to 10 times greater than at present (e.g., Tacconi et al., 2010; Daddi et al., 2010). According to Genzel et al. (2010), the typical (molecular) gas consumption time at redshifts 1 to 2.5 was . In the Daddi et al. (2010) sample of BzK galaxies at , gas consumption times are likewise – . To compare, the molecular gas consumption times at the present are estimated to be 1.5 to 3 Gyr (Diehl et al., 2006a; Genzel et al., 2010; Bigiel et al., 2011; Rahman et al., 2012), implying an enhancement of a factor 3 to 6 in SLR abundances at . But note that the BzK galaxies are not the direct ancestors of galaxies like the present Milky Way, which are less massive. The SSFR, when observed to have any mass dependence, is greater in low mass galaxies at all (Sargent et al., 2012). This means that lower mass galaxies at all have shorter , as indicated by observations of present galaxies (Saintonge et al., 2011). The early Milky Way therefore may have had a gas consumption time smaller than .
So far, I have ignored possible metallicity dependencies in the yield of SLRs. It may be generally expected that star-forming galaxies had lower metallicity in the past, since less of the gas has been processed by stellar nucleosynthesis. However, observations of the age-metallicity relation of G dwarfs near the Sun reveal that they have nearly the same metallicity at ages approaching 10 Gyr (e.g., Twarog 1980; Haywood 2006; Holmberg, Nordström, & Andersen 2007), though the real significance of the lack of a trend remains unclear, since there is a wide scatter in metallicity with age (see the discussion by Prantzos, 2009). Observations of external star-forming galaxies find weak evolution at constant stellar mass, with metallicity decreasing by dex per unit redshift (Lilly, Carollo, & Stockton 2003; Kobulnicky & Kewley 2004).
After adopting a metallicity dependence of (0.2 dex decrease per unit redshift), I show in the revised SLR abundances Fig. 1 assuming that the SLR yield goes as , , , , , and . If the yields are smaller at lower metallicity, the SLR abundances are still elevated at high redshift, though by not as much for metallicity-independent yields. As an example, the yield of 26Al in the winds of Wolf-Rayet stars is believed to scale as (Palacios et al., 2005). According to Limongi & Chieffi (2006), these stellar winds contribute only a minority of the 26Al yield, so it is unclear how the 26Al yield really scales. Martin et al. (2010) considered the 26Al and 60Fe yields from stars with half Solar metallicity. They found that, because reduced metallicity lowers wind losses, more SLRs are produced in supernovae. This mostly compensates for the reduced wind 26Al yield, and actually raises the synthesized amount of 60Fe.
2.2 Starbursts
| Starburst | SFR | ||||||||
|---|---|---|---|---|---|---|---|---|---|
| () | (yr-1) | () | () | (Myr) | |||||
| Milky Way ()e | 3.0 | 0.019 | 2.8 | 1500 | |||||
| Galactic Centre CMZf | 0.071 | 0.067 | 420 | ||||||
| NGC 253 coreg,h | 3.6 | 0.023 | 3.3 | 8.3 | |||||
| M82g,i | 10.5 | 0.067 | 9.8 | 19 | |||||
| Arp 220 nucleij | 50 | 0.3 | 44 | 20 | |||||
| Submillimeter galaxyk | 1000 | 6.4 | 930 | 25 | |||||
| BzK galaxiesl | 200 | 1 | 200 | 400 |
a: Mean abundance of 26Al, calculated assuming the 26Al is well-mixed with the gas and resides there for a full decay time (instead of, for example, a wind-crossing time).
b: Calculated assuming Solar metallicity with .
c: Ionization rate from 26Al with the derived abundance, with ionization only from MeV positrons released by the decay, assuming effective stopping.
d: Ionization rate from 26Al with the derived abundance, where ionization from the 1.809 MeV decay line and 0.511 keV positron annihilation gamma rays is included, assuming they are all stopped.
e: Supernova rate and gas mass from Diehl et al. (2006a); SFR calculated from supernova rate using Salpeter IMF for consistency.
f: Inner 100 pc of the Milky Way. SFR and from IR luminosity in Launhardt, Zylka, & Mezger (2002); gas mass from Molinari et al. (2011). Pierce-Price et al. (2000) gives a gas mass of .
g: SFR and from IR luminosity in Sanders et al. (2003).
h: Gas mass from Harrison, Henkel, & Russel (1999).
i: Gas mass from Weiß et al. (2001).
j: Assumes IR luminosity of for SFR and and gas mass given in Downes & Solomon (1998).
k: Typical gas mass and SFR of submillimetre galaxies from Tacconi et al. (2006).
l: Mean SFR and gas mass of the 6 BzK galaxies in Daddi et al. (2010), which are representative of main sequence galaxies at .
The true starbursts, driven by galaxy mergers and galaxies interacting with each other, represent about of star formation at all redshifts (Rodighiero et al., 2011; Sargent et al., 2012). They have SSFRs that are up to an order of magnitude higher than normal galaxies. The mean, background abundances of SLRs in starbursts are therefore about 100 times greater than the present day Milky Way.
I show the 26Al abundances in some nearby starburst galaxies in Table 1. In the Galactic Centre region, the 26Al abundance is only twice that of the present Milky Way as a whole. However, the 26Al abundances are extremely high in the other starbursts, , about twenty times that of the primordial Solar nebula. The ratio in these starbursts is also very high. Assuming Solar metallicity with an 27Al abundance of (Diehl et al., 2006a), this ratio is . Again, this ratio for Solar metallicity gas is times higher than that of the early Solar Nebula, .
3 Systematic Uncertainties
3.1 Effects of Variable Star-Formation Rates
The steady-state abundance (equation 4) is only appropriate when the star-formation rate is slowly varying on time-scales of a few Myr. Since young stellar populations produce SLRs for several Myr, and since 26Al and 60Fe themselves survive for , the injection rate of SLRs is smoothed over those time-scales (equation 2). Very high frequency fluctuations in the SFR therefore have little effect on the abundance of SLRs. In the opposite extreme, when the fluctuations in SLRs are slow compared to a few Myr, we can simply take the present SFR and use it in equation 4 for accurate results. However, intermediate frequency variability invalidates the use of equation 4, and can result in the SLR abundance being out of phase with the SFR.
Normal main sequence galaxies at high redshift built up their stellar populations over Gyr times, evolving secularly (c.f., Wuyts et al., 2011). They are also large enough to contain many stellar clusters, so that stochastic effects average out. It is reasonable to suppose that they have roughly constant SFRs over the relevant time-scales. True starbursts, on the other hand, are violent events that last no more than , as evinced by their short . They are relatively small, so stochastic fluctuations in their star-formation rates are more likely. Förster Schreiber et al. (2003) studied the nearby, bright starburst M82 and concluded that its star-formation history is in fact bursty. The star-formation histories of other starbursts are poorly known, but Mayya et al. (2004) present evidence for large fluctuations on times.
I estimate the magnitude of these fluctuations for the prototypical starburst M82 with the full equation for SLR mass in a one-zone model (equation 1). The solution to equation 1 for is
| (10) |
where
| (11) |
The quantity represents the SLR mass in the ISM from a coeval stellar population of unit mass and age . It is given by Cerviño et al. (2000) and Voss et al. (2009) for 26Al and 60Fe.
I use the star-formation history derived by Förster Schreiber et al. (2003) for the ‘3D region’ of M82, which consists of two peaks at 4.7 Myr ago and 8.9 Myr ago. The peaks are modelled as Gaussians with the widths given in Förster Schreiber et al. (2003) (standard deviations of 0.561 Myr for the more recent burst, and 0.867 Myr for the earlier burst). I convert the star-formation rate from a Salpeter IMF from 1 to 100 given in Förster Schreiber et al. (2003) to a Salpeter IMF from 0.1 to 100 for consistency with the rest of the paper.111I ignore the relatively small difference between the upper mass limit of 100 in Förster Schreiber et al. (2003) and 120 in Cerviño et al. (2000) and Voss et al. (2009). Since stars with masses 100 to 120 can affect stellar diagnostics, converting to that IMF may require an adjustment to the star-formation history beyond a simple mass scaling. This region does not include the entire starburst; it has roughly of the luminosity of the starburst, but the stellar mass formed within the 3D region over the past 10 Myr gives an average SFR of 10 in the Förster Schreiber et al. (2003) history. Note that Rodríguez-Merino, Rosa-González, & Mayya (2011) derives a different age distributions for stellar clusters (compare with Satyapal et al. 1997). Strickland & Heckman (2009) has also argued that the star-formation history of M82’s starburst core is not well constrained before 10 Myr ago (as observed from Earth), and may have extended as far back as 60 Myr ago. Thus, I take the Förster Schreiber et al. (2003) history merely as a representative example of fluctuating SFRs.
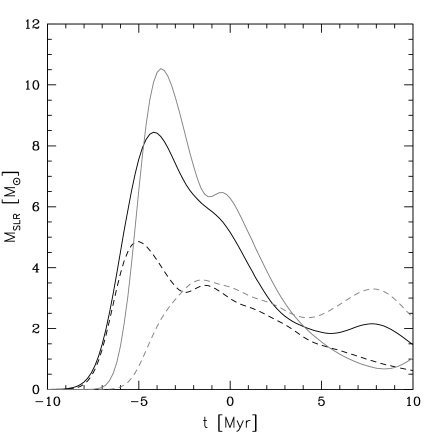
The calculated 26Al (black) and 60Fe (grey) masses are plotted in Fig. 2. At first, there is no SLR mass in the starburst, because it takes a few Myr for SLR injection to start. With the Voss et al. (2009) yields, the SLR masses rise quickly and peak ago (as observed from Earth). The SLR masses drop afterwards. Yet they are still within a factor of 1.7 of their peak values even now, after the last star-formation burst. If there is no further star-formation, the SLRs will mostly vanish over the next 10 Myr. The Cerviño et al. (2000) yields predict a greater role for supernovae from lower mass stars, so the fluctuations are not as great; the 60Fe mass remains roughly the same even 10 Myr from now. As long as there has been recent star-formation in the past , the SLR abundances are at least half of those predicted by the steady-state assumption.
There is a more fundamental reason to expect that the steady-state SLR abundances are roughly correct for starbursts. A common way of estimating star-formation rates in starbursts is to use the total infrared luminosity (Kennicutt, 1998), which is nearly the bolometric luminosity for these dust-obscured galaxies. Young stellar populations, containing very massive stars, are brighter and contribute disproportionately to the bolometric luminosity. Therefore, both the luminosity and the SLR abundances primarily trace young stars. To compare the bolometric luminosity, I ran a Starburst99 (v6.04) model of a metallicity coeval stellar population with a Salpeter IMF () between 0.1 and 120 Leitherer et al. (1999). I then calculate the SFR that would be derived from these luminosities using the Kennicutt (1998) conversion, and then from that, the expected steady-state SLR masses from equation 4. The ‘bolometric’ 26Al masses are compared to the actual masses in Fig. 3.
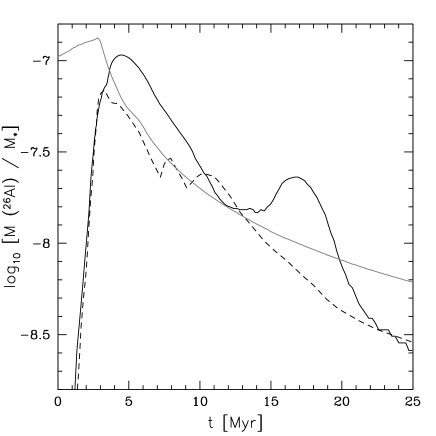
Although the very youngest stellar populations are bright but not yet making SLRs, the bolometric luminosity (grey) is a good tracer of 26Al mass (black) for stellar populations with ages between 3 and 20 Myr. For most of the interval, the bolometric 26Al masses are within a factor 2 of the actual masses. For populations between 15 Myr and 20 Myr, the Voss et al. (2009) and Cerviño et al. (2000) predictions envelop the bolometric 26Al masses. At 20 to 25 Myr old, the bolometric 26Al masses are about twice the true masses. For older populations still, the true 26Al masses finally die away while the bolometric luminosity only slowly declines. Note that, if stars have been forming continuously for the past 100 Myr, over half of the luminosity comes from stars younger than 20 Myr. Thus, the use of the bolometric luminosities introduces a factor systematic error.
In short, the use of bolometric luminosity as a SFR indicator, and the natural variability in the star-formation rates of starbursts can lead to overestimations of the SLR abundances by a factor . But I estimate the SLR abundances of true starbursts are a hundred times higher than in the present Milky Way (equation 8 and Table 1). The ratio is so great that the systematic effects do not undermine the basic conclusion that SLR abundances are much larger in true starbursts.
3.2 Are SLRs mixed quickly enough into the gas?
Although the average levels of SLRs in starbursts and high- normal galaxies are high, that does not by itself mean the SLRs influence the environments for star-formation. While SLRs can play an important role in star-forming regions, by elevating the ionization rates and by being incorporated into solid bodies, SLRs trapped in ionized gas are irrelevant for these processes.
The mixing of metals from young stars into the ISM gas mass is usually thought to be very slow in the present Milky Way, compared to SLR lifetimes. The massive stars responsible for making SLRs often live in star clusters, which blow hot and rarefied bubbles in the ISM. Supernovae also excavate the coronal phase of the ISM (McKee & Ostriker, 1977). Turbulence within the bubbles mixes the SLRs and homogenizes their abundances (e.g., Martin et al., 2010), over a time scale , where is the outer scale of turbulence (typical size of the largest eddies) and is the turbulent speed (Roy & Kunth, 1995; Pan & Scannapieco, 2010). The large outer scale of turbulence, 100 – 1000 pc, and the slow turbulent speeds (–) in the Milky Way imply mixing times of – . Even if the 26Al is homogenized within the superbubbles, this low density hot gas requires a long time to mechanically affect cold star-forming clouds, because of the large density contrast (de Avillez & Mac Low, 2002). Mixing between the phases, particularly warm and hot gas, is accelerated by Rayleigh-Taylor and Kelvin-Helmholtz instabilities (Roy & Kunth, 1995), but overall, mixing takes tens of Myr to operate in the Milky Way (de Avillez & Mac Low 2002; see also Clayton 1983, where mixing times are between the warm ISM from evaporated H I clouds, cool and large H I clouds, and molecular clouds). Thus, SLRs like 26Al are thought to decay long before they are mixed thoroughly with the star-forming gas. Indeed, studies of the abundances of longer lived isotopes in the primordial Solar system supports longer mixing times of – 100 Myr (e.g., Meyer & Clayton, 2000; Huss et al., 2009).
It is thought that these obstacles existed, at least qualitatively, in the Milky Way, when the Solar system formed. These problems are part of the motivation for invoking a local source of SLRs, including energetic particles from the Sun itself (Lee et al., 1998), injection from a nearby AGB star (Busso, Gallino, & Wasserburg 2003), or injection from an anomalously nearby supernova (Cameron & Truran, 1977) or Wolf-Rayet star (Arnould, Paulus, & Meynet 1997). Recently, though, several authors proposed models that might overcome the mixing obstacle, where young stars are able to inject SLRs into star-forming clouds. A motivation behind these models is the idea that molecular clouds are actually intermittent high density turbulent fluctuations in the ISM (e.g., Mac Low & Klessen, 2004), and the supernovae that partly drive the turbulence – indirectly forming the molecular clouds – also are the sources of SLRs (Gounelle et al., 2009). In the model of Gounelle et al. (2009), old superbubbles surrounding stellar clusters form into molecular clouds after ploughing through the ISM for 10 Myr. Supernovae continue going off in the star clusters, adding their SLRs into these newborn molecular clouds (see also Gounelle & Meynet, 2012). Simulations by Vasileiadis, Nordlund, & Bizzarro (2013) also demonstrate that SLRs from supernovae going off very near giant molecular clouds are mixed thoroughly with the star-forming gas. On a different note, Pan et al. (2012) argued that supernovae remnants are clumpy, and that clumps could penetrate into molecular clouds surround star clusters and inject SLRs.
If these scenarios are common, then a large fraction of the produced SLRs reaches the star-forming gas before decaying. In fact, these mechanisms may be so efficient that SLRs are concentrated only into star-forming molecular gas, a minority of the Milky Way gas mass. If so, then the abundance of SLRs within Galactic molecular gas () is greater than the mean background level (); in this way, SLR abundances could reach the elevated levels that existed in the early Solar system (Gounelle et al., 2009; Vasileiadis et al., 2013).
On the other hand, young stars can trigger star-formation in nearby gas without polluting them. This can occur when a shock from a supernova or from an overpressured H II region propagates into a molecular cloud, causing the cores within it to collapse (Bertoldi 1989; Elmegreen, Kimura, & Tosa 1995). This process has been inferred to happen in the Upper Scorpius OB association (Preibisch & Zinnecker, 1999). Since the cores are pre-existing, they may not be enriched with SLRs (although supernova shocks can also inject SLRs into a molecular cloud; see Boss et al. 2010 and Boss & Keiser 2012). The triggering can also occur before any supernovae enrich the material with SLRs. Star formation can also be triggered when a shock from a H II region sweeps up a shell of material, which eventually becomes gravitationally unstable and collapses (Elmegreen & Lada 1977; see also Gritschneder et al. 2009).
I note, however, that the homogeneity of the 26Al abundance in the early Solar system is controversial; if the abundance was inhomogeneous, that is inconsistent with efficient SLR mixing within the Solar system’s progenitor molecular cloud. Although Villeneuve, Chaussidon, & Libourel (2009) conclude that 26Al had a constant abundance, Makide et al. (2011) find that the 26Al abundance varied during the earliest stages of Solar system formation, when aluminium first condensed from the Solar nebula.
What is even less clear, though, is how similar the Milky Way is to starbursts and the massive high- normal galaxies that host the majority of the cosmic star formation. As in the Milky Way, supernovae in starbursts like M82 probably blast out a hot phase. But the hot phase escapes in a rapid hot wind in starbursts with high star-formation densities (; Chevalier & Clegg 1985; Heckman et al. 1990). There is direct evidence for this hot wind from X-ray observations (Strickland & Heckman, 2007, 2009). Furthermore, supernova remnants are observed to expand quickly in M82, implying that they are going off in a very low density environment (e.g., Beswick et al. 2006; compare with Chevalier & Fransson 2001). Cool and warm gas is observed outflowing alongside the hotter wind, possibly entrained by the hot wind (Strickland & Heckman, 2009). Whereas the edges of superbubbles eventually cool and fade back into the ISM in the Milky Way after a 10 – 100 Myr, any superbubble gas that does cool in these starbursts could still be pushed out by the wind. If the SLRs are trapped in the wind, they reside in these starbursts for only a few hundred kyr.
But the ISM conditions in the starbursts are much different, with higher densities in all phases, higher pressures, and higher turbulent speeds (e.g., Smith et al., 2006). Starbursts are physically small, with radii of at – comparable to the size of some individual superbubbles in the Milky Way. The eddy sizes therefore must be smaller and mixing processes could be faster. To demonstrate just how small superbubbles are in starbursts, Silich, Tenorio-Tagle, & Muñoz-Tuñón (2007) modelled the superbubble surrounding the star cluster M82 A-1 in M82, which has a mass of . They find that the wind propagates only for a few parsecs before being shocked and cooled. Stellar ejecta in the core of the cluster also cool rapidly in their model. The turbulent mixing time is therefore much smaller, for an eddy length of 10 pc and a turbulent speed of .
Conditions are even more extreme in present day compact Ultraluminous Infrared Galaxy starbursts, where the ISM is so dense (; Downes & Solomon 1998) that a hot phase may be unable to form (Thornton et al. 1998; Thompson, Quataert, & Murray 2005). Instead, the ISM is almost entirely molecular (Downes & Solomon, 1998). Indeed, observations of supernovae in Arp 220 indicate they are going off in average density molecular gas (Batejat et al., 2011). Supernovae remnants fade within a few tens of kyr into the ISM, due to powerful radiative losses (McKee & Ostriker, 1977). The SLRs then are incorporated into the molecular ISM in a turbulent mixing time, the whole process taking just a few hundred kyr. The main uncertainty is then, not whether the SLRs are injected into the molecular gas, but whether these SLR-polluted regions of the molecular gas fill the entire starburst. Turbulent mixing smooths abundances over regions the size of the largest eddies (Pan & Scannapieco, 2010), but if the distribution of SLR injection sites varies over larger scales, the final SLR abundance may also vary on these large scales.
We know very little about the conditions in high redshift galaxies. Star formation in main sequence galaxies is dominated by massive galaxies with large star-formation rates at high redshift. These massive galaxies are several kpc in radius, but contain large amounts of molecular gas (Daddi et al., 2010). They also have large star-formation densities and host winds. In the more extreme galaxies, radiative bremsstrahlung losses stall any hot wind (Silich et al., 2010). Turbulent speeds in these galaxies are high (Green et al., 2010), implying faster turbulent mixing than in the Milky Way. But it is not clear which phase the SLRs are injected into or how long it takes for them to mix throughout star formation regions. The effects of clustering in the ISM is also uncertain, but it probably is important in these galaxies, where huge clumps ( and a kpc wide) are observed (e.g., Genzel et al., 2011).
To summarize, while there are reasons to expect that most of the SLRs synthesized by young stars in the Milky Way decay before reaching star-forming gas, this is not necessarily true in starbursts or high- normal galaxies. Turbulent mixing is probably fast, at least in compact starbursts which are physically small. On the other hand, winds might blow out SLRs before they reach the star-forming gas, at least in the weaker starbursts. Clearly, this issue deserves further study.
4 Implications
4.1 Implications for the early Solar system and Galactic stars of similar age
The rapid evolution in SSFRs implies that Galactic background SLR abundances were up to twice as high during the epoch of Solar system formation (4.56 Gyr ago; ). If the evolution of the Milky Way’s gas fraction was comparable to that in observed massive main sequence galaxies, the enhancement may have been only above present values (see the discussion in section 2.1; Genzel et al. 2010). The inferred primordial abundances of 60Fe in the Solar system are in fact up to twice as high as in the contemporary Milky Way, as determined with gamma-ray lines (Williams, 2010; Gounelle & Meibom, 2008). This overabundance is cited as evidence for an individual, rare event enriching the early Solar system, or the gas that formed into the Solar system, with SLRs. However, my calculations show this is not necessarily the case: the twice high abundances of 60Fe in the early Solar system can arise simply because the Galaxy was more efficient at converting gas into stars 4.5 Gyr ago.
The primordial abundance of 26Al in the Solar system was about six times higher than the mean Galactic value at present (Diehl et al., 2006a), or three times higher than the mean Galactic abundance at assuming that equation 9 holds. Even so, the normal effects of galaxy evolution are a potential contributor to the greater 26Al abundances, assuming efficient mixing of 26Al with the molecular gas of the Milky Way. Furthermore, the high abundances of 26Al in the early Solar system are actually typical of star-formation at – when most cosmic star-formation occurred. In this sense, the early Solar system’s 26Al abundance may be normal for most planetary systems in the Universe.
As I have discussed in Section 3.2, it is not clear whether the background abundances of 26Al and other SLRs actually represent those of typical star-forming gas; if mixing takes more than a few Myr, these SLRs could not have affected star and planet formation (Meyer & Clayton, 2000; de Avillez & Mac Low, 2002; Huss et al., 2009). But although there may have been a wide distribution of abundances if mixing is inefficient, the mean of the distribution is still higher simply because there were more supernovae and young stars per unit gas mass. Thus, a greater fraction of star formation occurred above any given threshold in the past. In addition, the Galactic background level can be meaningful if a large fraction of the SLRs from young stars make it into the cold gas, and Gounelle et al. (2009), Gounelle & Meynet (2012), Pan et al. (2012), and Vasileiadis et al. (2013) have presented mechanisms where this can happen. Although there is suggestive evidence that these mechanisms did not operate for the Solar system (Makide et al., 2011), there is no reason they could not have worked for other star systems of similar ages. Then the Solar system’s relatively high abundance of SLRs, and 60Fe in particular, may be common for Galactic stars of similar ages, even if through a different process.
Finally, as I noted, these conclusions depend on how the yields of SLRs from massive stars change with metallicity, and what the mean Galactic metallicity was at the epoch of Solar system formation.
4.2 The Ionization Rate and Physical Conditions in Starbursts’ Dense Clouds
Radioactive decay from SLRs injects energy in the form of daughter particles into the ISM. The decay particles, with typical energies of order an MeV, ionize gas and ultimately heat the ISM, if they do not escape entirely. The high abundances of SLRs, including 26Al, can alter the ionization state of molecular gas in these galaxies. The ionization rate, in particular, is important in determining whether magnetic fields can thread through the densest gas. I focus here on the contribution from 26Al, which dominated the ionization rate from SLRs in the primordial Solar system (Umebayashi & Nakano, 2009). For the sake of discussion, I assume that the SLRs are well-mixed into the gas, despite the uncertainties (section 3.2).
Each 26Al decay releases an energy into the ISM in the form of MeV positrons and gamma rays. If each atom in the ISM takes an energy to be ionized, each 26Al decay can therefore ionize atoms. In 82% of the decays, a positron with kinetic energy of 1.16 MeV is released, and the positron is slowed by ionization losses (Finocchi & Gail, 1997). The minimum energy per decay, after accounting for this branching ratio, that goes into ionization is , when the medium stops the positron (inflight annihilation losses are negligible at these energies; Beacom & Yüksel 2006). The annihilation of the positron with an electron in the ISM produces gamma rays of total energy MeV. In addition, in very nearly all 26Al decays, a 1.809 MeV gamma ray is produced. These gamma rays only interact with the ISM over columns of several , so only in particularly dense regions will they contribute to the ionization (Finocchi & Gail, 1997). When they do, . Stepinski (1992) gives as 36.3 eV, so that the ionization rate is
| (12) |
In terms of gas consumption time, the ionization rate from 26Al is
| (13) |
My results for the mean ionization rate from 26Al of some characteristic starbursts are shown in Table 1; they are in the range . The maximal ionization rates are roughly an order of magnitude higher than that found in early Solar system, a dense environment with (Finocchi & Gail, 1997; Umebayashi & Nakano, 2009).
Even if the 26Al is in the cold star-forming gas, it could actually be condensed into dust grains instead of existing in the gas phase. Yet the decay products still escape into the ISM from within the grain. The attenuation of gamma rays at MeV is dominated by Compton scattering, requiring columns of a few to be important. Thus, gamma rays pass freely through dust grains that are smaller than a centimetre. The energy loss rate of relativistic electrons or positrons in neutral matter is approximately
| (14) |
from Schlickeiser (2002), where is the particle kinetic energy, is the physical length, and is the Thomson cross section. The sum is over elements ; for heavy elements , is the partial density of each element within the grain, and is related to the atomic properties of the element. I take the bracketed term to have a value and . Then the stopping length is , much bigger than the typical grain radius. Thus, 26Al (and other SLRs) in dust grains still contribute to the ionization of the ISM.
On the other hand, are the positrons actually stopped in starburst molecular clouds, or do they escape? For neutral interstellar gas, the stopping column of MeV positrons is through ionization and excitation of atoms. (Schlickeiser, 2002). In cold molecular gas, ionization and excitation continue to cool the positrons until , at which point they start annihilating by charge exchange reactions or they thermalize (Guessoum, Jean, & Gillard, 2005). The column densities of starbursts range from (e.g., Kennicutt, 1998), and the columns through individual molecular clouds are expected to be similar to those of the galaxies (Hopkins, Quataert, & Murray 2012). In the denser molecular clouds, positrons are stopped even if they are not confined at all. In massive main sequence galaxies, the columns are (Daddi et al., 2010), insufficient to stop positrons moving in straight lines. If magnetic waves with a wavelength near the positron gyroradius scale exist in these clouds, they efficiently scatter positrons and confine them. As a result, the propagation of the positrons can be described with a diffusion constant, as widely used when interpreting the Galactic GeV positron spectrum (e.g., Moskalenko & Strong 1998; Hooper, Blasi, & Dario Serpico 2009), although it is unclear how relevant these studies are for MeV positrons (Jean et al., 2009; Prantzos et al., 2011; Martin et al., 2012). However, these waves are probably damped quickly in dense neutral gas (see Jean et al. 2009; Higdon, Lingenfelter, & Rothschild 2009; Prantzos et al. 2011 and references therein). On the other hand, positrons move along magnetic field lines, and if the lines themselves are twisted on a scale , the positrons are forced to random walk with a similar mean free path (Martin et al., 2012). As long as is less than about a third of the molecular cloud size, then positrons are stopped in these galaxies.
If it is well mixed with the molecular gas, does 26Al dominate the ionization rate in molecular gas in starbursts, and if so, what physical conditions does it induce? The starburst 26Al ionization rates are about an order of magnitude lower than the canonical cosmic ray-sustained ionization rates in most Milky Way molecular clouds, but in some of the densest Galactic starless cores, the ionization rate drops to (Caselli et al., 2002; Bergin & Tafalla, 2007). Cosmic rays in starbursts can sustain much higher ionization rates (up to ; c.f., Papadopoulos 2010), but cosmic rays can be deflected by magnetic fields, possibly preventing them from penetrating high columns. Aside from cosmic rays themselves, starbursts are also bright sources of GeV gamma rays, which are generated when cosmic rays interact with the prevalent gas (e.g., Ackermann et al., 2012). These gamma rays can penetrate molecular clouds and induce low levels of ionization (Lacki, 2012). In Lacki (2012), I found that the gamma-ray ionization rate in starbursts can be anywhere from , with values of in M82 and in Arp 220’s radio nuclei. In the dense clouds of most starbursts, 26Al radioactivity could exceed the ionization rate over gamma rays, setting a floor to the ionization rate. In the most extreme starbursts, with mean gas surface densities of (c.f. equation 10 of Lacki 2012), however, gamma-ray ionization is more important, since the gamma-ray ionization rate depends strongly on the density of gas and compactness of the starbursts. Unlike the uncertainty of how SLRs and their positron decay products are transported and mixed with the gas of starbursts, gamma rays propagate relatively simply, so the gamma ray ionization rates are more secure.
An 26Al-dominated ionization rate has implications for the physical conditions of star-forming clouds. According to McKee (1989), the ionization fraction of a cloud with hydrogen number density is
| (15) |
when the ionization rate is low. We see that the ionization fraction of cloud with density is , if the ionization is powered solely by 26Al decay. For these ionization fractions, the ambipolar diffusion time of a molecular core, the time for magnetic fields to slip from the gas, is a few times its free-fall time. Since clouds with strong magnetic fields do not collapse until the field slips away by ambipolar diffusion (Mestel & Spitzer, 1956; Mouschovias & Spitzer, 1976), this means that 26Al-ionized clouds in starbursts collapse quasi-statically, as in the Milky Way.
On the other hand, the energy injection from 26Al has essentially no effect on the gas temperature. Papadopoulos (2010) gives the minimum gas temperature of gas as:
| (16) |
which was derived under the assumption that there is no heating from interactions with dust grains or the dissipation of turbulence in the gas, for gas with density and ionization rate . In typical starbursts, I find that 26Al decay alone heats gas of density to ( for ). As I note in Lacki (2012), under such conditions, dust heating is more likely to set the temperature of the gas than ionization, raising the temperature to the dust temperature for densities .
5 Conclusions
The high SSFRs of starbursts and high- normal galaxies implies high abundances of 26Al and other SLRs in their ISMs. In true starbursts, these abundances are enormous, with and 26Al/27Al . The SSFRs of normal galaxies evolve rapidly with ; even taking into account higher gas fractions, the SLR abundances were about 3 – 10 times higher at than in the present Milky Way. Even at the epoch of Solar system formation, the mean SLR abundance of the Milky Way was 1.5 to 2 times as high as at the present (Fig. 1). This alone could explain the high abundances of 60Fe in the early Solar system, and reduce the discrepancy in the 26Al abundances from a factor of to . In this way, the cosmic evolution of star-forming galaxies may have direct implications for the early geological history of the Solar system. The first main uncertainty is whether the SLRs produced by massive stars is well-mixed with the molecular gas: they may instead be ejected by the galactic winds known to be present in starbursts and high- galaxies, or decay before they can propagate far from its injection site, or before it penetrates cold gas. I discussed these uncertainties in section 3.2. The other uncertainty is how SLR yields depend on metallicity.
The most direct way to test the high 26Al abundances of starburst galaxies is to detect the 1.809 MeV gamma-ray line produced by the decay of 26Al, directly informing us of the equilibrium mass of 26Al. Whether most of the 26Al is ejected by the superwind can be resolved with spectral information. The turbulent velocities of molecular gas in starbursts, (Downes & Solomon, 1998), is much smaller than the bulk speed of the superwind, which is hundreds or even thousands of (Chevalier & Clegg, 1985). Unfortunately, the 26Al line fluxes predicted for even the nearest external starbursts () are too low to detect with any planned instrument (Lacki, Horiuchi, & Beacom 2012). However, Crocker et al. (2011) have argued that the inner 100 pc of the Galactic Centre are an analogue of starburst galaxies, launching a strong superwind. The 26Al line from this region should have a flux of , easily achievable with possible future MeV telescopes like Advanced Compton Telescope (ACT; Boggs 2006) or Gamma-Ray Burst Investigation via Polarimetry and Spectroscopy (GRIPS; Greiner et al. 2012). A search for the 26Al signal from this region may inform us on its propagation, since it is nearby and resolved spatially.222Naya et al. (1996) reported that the 26Al signal from the inner Galaxy had line widths corresponding to speeds of several hundred , but this was not verified by later observations by RHESSI (Smith, 2003) and INTEGRAL (Diehl et al., 2006b). Instead, recent observations indicate that Galactic 26Al is swept up in superbubbles expanding at 200 into the interarm regions (Kretschmer et al., 2013). However, this signal is from the entire inner Galactic disc on kiloparsec scales; the inner 100 pc of the Galactic Centre is a much smaller region and just a small part of this signal, so the kinematics of its 26Al are currently unconstrained. Current observations of the 26Al decay signal from the Galactic Centre region are summarized in Wang et al. (2009). If the 26Al generated in the Centre region is actually advected away by the wind, the ‘missing’ 26Al should be visible several hundred pc above and below the Galactic Plane near the Galactic Centre.333This will also be true in other starbursts, but these starbursts would not be resolved spatially by proposed MeV telescopes. The total amount of 26Al line emission from other starbursts would therefore not inform us of whether it is in the starburst proper or in the superwind; other information, such as the Doppler width of the line, is necessary to determine that. Resolved measurements of the Galactic Centre can also inform us on whether the 26Al is present in all molecular clouds in the region (and therefore is well-mixed), or just if it is trapped near a few injection sites.
If the SLRs do mix with the star-forming molecular gas of these galaxies, there are implications for both their star formation and planet formation. Ionization rates of , like those in some Milky Way starless cores, result from the energy injection of 26Al decay in starbursts. While cosmic ray ionization rates can easily exceed those ionization rates by orders of magnitude in gas they penetrate into, and while gamma rays produce higher ionization rates in the most extreme starbursts like Arp 220, 26Al might dominate the ionization rate in the dense clouds shielded from cosmic rays in typical starbursts. In starbursts’ protoplanetary discs, 26Al can provide moderate ionization through all columns, possibly eliminating the ‘dead zones’ where there is little accretion (e.g., Gammie 1996; Fatuzzo, Adams, & Melia 2006). Any planetesimals that do form in starbursts may have much higher radiogenic heating from 26Al. Admittedly, studying the geological history of planets, much less planetesimals, in other galaxies is very difficult for the forseeable future. However, at the Milky Way likely had background SLR abundances times higher than at present, so the effects of elevated SLR abundances may be studied in planetary systems around old Galactic stars.
On a final point, Gilmour & Middleton (2009) propose that the elevated abundances of 26Al in the early Solar system are mandated by anthropic selection, since high SLR abundances are necessary for planetesimal differentiation and the loss of volatiles, but that explanation may be difficult to maintain. If high 26Al abundances, far from being very rare, are actually typical of high- and starburst solar systems (and indeed, much of the star-formation in the Universe’s history), the anthropic principle would imply that most technological civilizations would develop in solar systems formed in these environments. Instead of asking why we find ourselves in a system with an 26Al abundance just right to power differentiation and evaporate volatiles, we must ask why we find ourselves in one of the rare solar systems with sufficient 26Al that formed in a normal spiral galaxy at , instead of the common 26Al-enriched solar systems formed at or in starbursts.
Acknowledgements
During this work, I was supported by a Jansky Fellowship from the National Radio Astronomy Observatory. The National Radio Astronomy Observatory is operated by Associated Universities, Inc., under cooperative agreement with the National Science Foundation.
References
- Ackermann et al. (2012) Ackermann, M., Ajello, M., Allafort, A., et al. 2012, ApJ, 755, 164
- Adams (2010) Adams F. C. 2010, ARA&A, 48, 47
- Arnould et al. (1997) Arnould M., Paulus G., Meynet G. 1997, A&A, 321, 452
- Batejat et al. (2011) Batejat F., Conway J. E., Hurley R., Parra R., Diamond P. J., Lonsdale C. J., Lonsdale C. J. 2011, ApJ, 740, 95
- Beacom & Yüksel (2006) Beacom J. F., Yüksel H. 2006, Physical Review Letters, 97, 071102
- Bergin & Tafalla (2007) Bergin E. A., Tafalla M. 2007, ARA&A, 45, 339
- Bertoldi (1989) Bertoldi, F. 1989, ApJ, 346, 735
- Beswick et al. (2006) Beswick R. J., Riley J. D., Marti-Vidal I., et al. 2006, MNRAS, 369, 1221
- Bigiel et al. (2011) Bigiel F., Leroy A. K., Walter F., et al. 2011, ApJL, 730, L13
- Boggs (2006) Boggs S. E. 2006, New Astron. Rev., 50, 604
- Boss et al. (2010) Boss A. P., Keiser S. A., Ipatov S. I., Myhill E. A., Vanhala H. A. T. 2010, ApJ, 708, 1268
- Boss & Keiser (2012) Boss A. P., Keiser S. A. 2012, ApJL, 756, L9
- Brinchmann et al. (2004) Brinchmann J., Charlot S., White S. D. M., Tremonti C., Kauffmann G., Heckman T., Brinkmann J. 2004, MNRAS, 351, 1151
- Busso et al. (2003) Busso M., Gallino R., Wasserburg G. J. 2003, PASA, 20, 356
- Cameron (1962) Cameron A. G. W. 1962, Icarus, 1, 13
- Cameron & Truran (1977) Cameron A. G. W., Truran J. W. 1977, Icarus, 30, 447
- Caselli et al. (2002) Caselli P., Walmsley C. M., Zucconi A., Tafalla M., Dore L., Myers P. C. 2002, ApJ, 565, 344
- Cerviño et al. (2000) Cerviño M., Knödlseder J., Schaerer D., von Ballmoos P., Meynet, G. 2000, A&A, 363, 970
- Chevalier & Clegg (1985) Chevalier R. A., Clegg A. W. 1985, Nature, 317, 44
- Chevalier & Fransson (2001) Chevalier R. A., Fransson C. 2001, ApJL, 558, L27
- Clayton (1983) Clayton D. D. 1983, ApJ, 268, 381
- Crocker et al. (2011) Crocker R. M., Jones D. I., Aharonian F., Law C. J., Melia F., Oka T., Ott J. 2011, MNRAS, 413, 763
- Daddi et al. (2007) Daddi E., Dickinson M., Morrison G., et al. 2007, ApJ, 670, 156
- Daddi et al. (2010) Daddi E., Bournaud F., Walter F., et al. 2010, ApJ, 713, 686
- de Avillez & Mac Low (2002) de Avillez M. A., Mac Low M.-M. 2002, ApJ, 581, 1047
- Diehl et al. (2006a) Diehl R., et al. 2006a, Nature, 439, 45
- Diehl et al. (2006b) Diehl R., Halloin H., Kretschmer K., et al. 2006b, A&A, 449, 1025
- Downes & Solomon (1998) Downes D., Solomon P. M. 1998, ApJ, 507, 615
- Elmegreen & Lada (1977) Elmegreen, B. G., & Lada, C. J. 1977, ApJ, 214, 725
- Elmegreen et al. (1995) Elmegreen B. G., Kimura T., Tosa M. 1995, ApJ, 451, 675
- Fatuzzo et al. (2006) Fatuzzo M., Adams F. C., Melia F. 2006, ApJL, 653, L49
- Finocchi & Gail (1997) Finocchi F., Gail H.-P. 1997, A&A, 327, 825
- Förster Schreiber et al. (2003) Förster Schreiber N. M., Genzel R., Lutz D., Sternberg A. 2003, ApJ, 599, 193
- Gammie (1996) Gammie C. F. 1996, ApJ, 457, 355
- Genzel et al. (2010) Genzel R., Tacconi L. J., Gracia-Carpio J., et al. 2010, MNRAS, 407, 2091
- Genzel et al. (2011) Genzel R., Newman S., Jones T., et al. 2011, ApJ, 733, 101
- Gilmour & Middleton (2009) Gilmour J. D., Middleton C. A. 2009, Icarus, 201, 821
- González et al. (2010) González V., Labbé I., Bouwens R. J., Illingworth G., Franx M., Kriek M., Breammer G. B. 2010, ApJ, 713, 115
- Gounelle & Meibom (2008) Gounelle M., Meibom A. 2008, ApJ, 680, 781
- Gounelle et al. (2009) Gounelle M., Meibom A., Hennebelle P., Inutsuka S.-i. 2009, ApJL, 694, L1
- Gounelle & Meynet (2012) Gounelle M., Meynet G. 2012, A&A, 545, A4
- Green et al. (2010) Green A. W., Glazebrook K., McGregor P. J., et al. 2010, Nature, 467, 684
- Greiner et al. (2012) Greiner J. et al. 2012, Experimental Astronomy, 34, 551
- Grimm & McSween (1993) Grimm R. E., McSween H. Y. 1993, Science, 259, 653
- Gritschneder et al. (2009) Gritschneder M., Naab T., Walch S., Burkert A., Heitsch F. 2009, ApJL, 694, L26
- Guessoum et al. (2005) Guessoum N., Jean P., Gillard W. 2005, A&A, 436, 171
- Harris et al. (2005) Harris M. J., Knödlseder J., Jean P., et al. 2005, A&A, 433, L49
- Harrison et al. (1999) Harrison A., Henkel C., Russell A. 1999, MNRAS, 303, 157
- Haywood (2006) Haywood M. 2006, MNRAS, 371, 1760
- Heckman et al. (1990) Heckman T. M., Armus L., Miley G. K. 1990, ApJS, 74, 833
- Higdon et al. (2009) Higdon, J. C., Lingenfelter, R. E., & Rothschild, R. E. 2009, ApJ, 698, 350
- Holmberg et al. (2007) Holmberg J., Nordström B., Andersen J. 2007, A&A, 475, 519
- Hooper et al. (2009) Hooper D., Blasi P., Dario Serpico P. 2009, JCAP, 1, 25
- Hopkins et al. (2009) Hopkins P. F., Hernquist L., Cox T. J., Keres D., Wuyts S. 2009, ApJ, 691, 1424
- Hopkins et al. (2010) Hopkins P. F., Younger J. D., Hayward C. C., Narayanan D., Hernquist L. 2010, MNRAS, 402, 1693
- Hopkins et al. (2012) Hopkins P. F., Quataert E., Murray N. 2012, MNRAS, 421, 3488
- Huss et al. (2009) Huss G. R., Meyer B. S., Srinivasan G., Goswami J. N., Sahijpal S. 2009, Geochim. Cosmochim. Acta, 73, 4922
- Hutcheon & Hutchison (1989) Hutcheon I. D., Hutchison R. 1989, Nature, 337, 238
- Jean et al. (2009) Jean, P., Gillard, W., Marcowith, A., & Ferrière, K. 2009, A&A, 508, 1099
- Karim et al. (2011) Karim A., Schinnerer E., Martínez-Sansigre A., et al. 2011, ApJ, 730, 61
- Kennicutt (1998) Kennicutt R. C. 1998, ApJ, 498, 541
- Knödlseder (1999) Knödlseder J. 1999, ApJ, 510, 915
- Kobulnicky & Kewley (2004) Kobulnicky H. A., Kewley L. J. 2004, ApJ, 617, 240
- Kretschmer et al. (2013) Kretschmer K., Diehl R., Krause M., et al. 2013, A&A, 559, A99
- Lacki (2012) Lacki B. C. 2012, arXiv:1204.2580
- Lacki et al. (2012) Lacki B. C., Horiuchi S., Beacom J. F. 2012, arXiv:1206.0772
- Launhardt et al. (2002) Launhardt R., Zylka R., Mezger P. G. 2002, A&A, 384, 112
- Lee et al. (1977) Lee T., Papanastassiou D. A., Wasserburg G. J. 1977, ApJL, 211, L107
- Lee et al. (1998) Lee T., Shu F. H., Shang H., Glassgold A. E., Rehm K. E. 1998, ApJ, 506, 898
- Leitherer et al. (1999) Leitherer C., Schaerer D., Goldader J. D., et al. 1999, ApJS, 123, 3
- Lilly et al. (2003) Lilly S. J., Carollo C. M., Stockton A. N. 2003, ApJ, 597, 730
- Limongi & Chieffi (2006) Limongi M., Chieffi A. 2006, ApJ, 647, 483
- Mac Low & Klessen (2004) Mac Low M.-M., Klessen R. S. 2004, Reviews of Modern Physics, 76, 125
- MacPherson et al. (1995) MacPherson G. J., Davis A. M., Zinner E. K. 1995, Meteoritics, 30, 365
- Magnelli et al. (2009) Magnelli B., Elbaz D., Chary R. R., et al. 2009, A&A, 496, 57
- Mahoney et al. (1984) Mahoney W. A., Ling J. C., Wheaton W. A., Jacobson A. S. 1984, ApJ, 286, 578
- Makide et al. (2011) Makide K., Nagashima K., Krot A. N., Huss G. R., Ciesla F. J., Hellebrand E., Gaidos E., Yang L. 2011, ApJL, 733, L31
- Martin et al. (2010) Martin P., Knödlseder J., Meynet G., Diehl R. 2010, A&A, 511, A86
- Martin et al. (2012) Martin, P., Strong, A. W., Jean, P., Alexis, A., & Diehl, R. 2012, A&A, 543, A3
- Mayya et al. (2004) Mayya Y. D., Bressan A., Rodríguez M., Valdes J. R., Chavez M. 2004, ApJ, 600, 188
- McKee & Ostriker (1977) McKee C. F., Ostriker J. P. 1977, ApJ, 218, 148
- McKee (1989) McKee C. F. 1989, ApJ, 345, 782
- Mestel & Spitzer (1956) Mestel L., Spitzer L., Jr. 1956, MNRAS, 116, 503
- Meyer & Clayton (2000) Meyer B. S., Clayton D. D. 2000, Space Sci. Rev., 92, 133
- Molinari et al. (2011) Molinari S., Bally J., Noriega-Crespo A., et al. 2011, ApJL, 735, L33
- Moskalenko & Strong (1998) Moskalenko I. V., Strong A. W. 1998, ApJ, 493, 694
- Mouschovias & Spitzer (1976) Mouschovias T. C., Spitzer L., Jr. 1976, ApJ, 210, 326
- Naya et al. (1996) Naya J. E., Barthelmy S. D., Bartlett L. M., Gehrels N., Leventhal M., Parsons A., Teegarden B. J., Tueller J. 1996, Nature, 384, 44
- Noeske et al. (2007) Noeske K. G., Weiner B. J., Faber S. M., et al. 2007, ApJL, 660, L43
- Palacios et al. (2005) Palacios A., Meynet G., Vuissoz C., Knödlseder J., Schaerer D., Cerviño M., Mowlavi N. 2005, A&A, 429, 613
- Pan & Scannapieco (2010) Pan L., Scannapieco E. 2010, ApJ, 721, 1765
- Pan et al. (2012) Pan L., Desch S. J., Scannapieco E., Timmes F. X. 2012, ApJ, 756, 102
- Papadopoulos (2010) Papadopoulos P. P. 2010, ApJ, 720, 226
- Pierce-Price et al. (2000) Pierce-Price D., Richer J. S., Greaves J. S., et al. 2000, ApJL, 545, L121
- Prantzos (2009) Prantzos N., 2009, in Andersen J., Bland-Hawthorn J., Nordström B., eds, IAU Symp., 254, The Galaxy Disk in Cosmological Context, Cambridge Univ. Press, Cambridge, p. 381
- Prantzos et al. (2011) Prantzos N., Boehm C., Bykov A. M., et al. 2011, Reviews of Modern Physics, 83, 1001
- Preibisch & Zinnecker (1999) Preibisch T., Zinnecker H. 1999, AJ, 117, 2381
- Rahman et al. (2012) Rahman N., Bolatto A. D., Xue R., et al. 2012, ApJ, 745, 183
- Rodighiero et al. (2011) Rodighiero G., Daddi E., Baronchelli I., et al. 2011, ApJL, 739, L40
- Rodríguez-Merino et al. (2011) Rodríguez-Merino L. H., Rosa-González D., Mayya, Y. D. 2011, ApJ, 726, 51
- Roy & Kunth (1995) Roy J.-R., Kunth D. 1995, A&A, 294, 432
- Saintonge et al. (2011) Saintonge A., Kauffmann G., Wang J., et al. 2011, MNRAS, 415, 61
- Sanders et al. (2003) Sanders D. B., Mazzarella J. M., Kim D.-C., Surace J. A., Soifer B. T. 2003, AJ, 126, 1607
- Sargent et al. (2012) Sargent M. T., Béthermin M., Daddi E., Elbaz D. 2012, ApJL, 747, L31
- Satyapal et al. (1997) Satyapal S., Watson D. M., Pipher J. L., Forrest W. J., Greenhouse M. A., Smith H. A., Fischer J., Woodward C. E. 1997, ApJ, 483, 148
- Schlickeiser (2002) Schlickeiser R. 2002, Cosmic Ray Astrophysics. Springer, New York.
- Shukolyukov & Lugmair (1993) Shukolyukov A., Lugmair G. W. 1993, Science, 259, 1138
- Silich et al. (2007) Silich S., Tenorio-Tagle G., Muñoz-Tuñón C. 2007, ApJ, 669, 952
- Silich et al. (2010) Silich S., Tenorio-Tagle G., Muñoz-Tuñón C., Hueyotl-Zahuantitla F., Wünsch R., Paulouš J. 2010, ApJ, 711, 25
- Smith (2003) Smith D. M. 2003, ApJL, 589, L55
- Smith et al. (2006) Smith L. J., Westmoquette M. S., Gallagher J. S., O’Connell R. W., Rosario D. J., de Grijs R. 2006, MNRAS, 370, 513
- Stepinski (1992) Stepinski T. F. 1992, Icarus, 97, 130
- Strickland & Heckman (2007) Strickland D. K., Heckman T. M. 2007, ApJ, 658, 258
- Strickland & Heckman (2009) Strickland D. K., Heckman T. M. 2009, ApJ, 697, 2030
- Suchkov et al. (1993) Suchkov A., Allen R. J., Heckman T. M. 1993, ApJ, 413, 542
- Tacconi et al. (2006) Tacconi L. J., Neri R., Chapman S. C., et al. 2006, ApJ, 640, 228
- Tacconi et al. (2010) Tacconi L. J., Genzel R., Neri R., et al. 2010, Nature, 463, 781
- Thompson et al. (2005) Thompson T. A., Quataert E., Murray N. 2005, ApJ, 630, 167
- Thompson, Quataert, & Waxman (2007) Thompson T. A., Quataert E., Waxman E. 2007, ApJ, 654, 219
- Thornton et al. (1998) Thornton K., Gaudlitz M., Janka H.-T., Steinmetz M. 1998, ApJ, 500, 95
- Twarog (1980) Twarog B. A. 1980, ApJ, 242, 242
- Umebayashi & Nakano (1981) Umebayashi T., Nakano T. 1981, PASJ, 33, 617
- Umebayashi & Nakano (2009) Umebayashi T., Nakano T. 2009, ApJ, 690, 69
- Vasileiadis et al. (2013) Vasileiadis A., Nordlund Å., Bizzarro M. 2013, ApJL, 769, L8
- Villeneuve et al. (2009) Villeneuve J., Chaussidon M., Libourel G. 2009, Science, 325, 985
- Voss et al. (2009) Voss R., Diehl R., Hartmann D. H., Cerviño M., Vink J. S., Meynet G., Limongi M., Cheiffi A. 2009, A&A, 504, 531
- Wang et al. (2009) Wang W., Lang M. G., Diehl R., et al. 2009, A&A, 496, 713
- Weiß et al. (2001) Weiß A., Neininger N., Hüttemeister S., Klein U. 2001, A&A, 365, 571
- Williams (2010) Williams J., 2010, in Montmerle T., Ehrenreich D., Lagrange A.-M., eds, EAS Publications Series 41, Physics and Astrophysics of Planetary Systems, Cambridge Univ. Press, Cambridge, p. 233
- Wuyts et al. (2011) Wuyts S., Förster Schreiber N. M., Lutz D., et al. 2011, ApJ, 738, 106