2em
Long-Baseline Neutrino Experiment (LBNE)
Conceptual Design Report
The LBNE Water Cherenkov Detector
![[Uncaptioned image]](/html/1204.2295/assets/x1.png)
PREFACE
The US department of energy approved the Mission Need (CD-0) for a long baseline neutrino experiment on January 8th 2010. This marked the official start of the LBNE project whose goal is to plan and execute the construction of a next generation neutrino experiment designed to measure neutrino oscillation parameters with a neutrino beam from Fermilab detected in a large detector a mile underground in the former Homestake mine in South Dakota. Two technologies were considered for the far detector: a large liquid argon time projection chamber (LArTPC) and a large Water Cherenkov Detector (WCD). Conceptual designs for both technologies were developed and the designs, scientific capabilities, cost, schedule and risks were evaluated. Internal review committees found that both detector designs were capable of meeting LBNE scientific needs and that the technical designs and schedules were reasonably well developed at the conceptual design (CDR) level. On January 6, 2012, the LBNE project recommended to DOE that the LArTPC technology be selected as the preferred technology for the far detector.
This report, completed in early 2012, documents the conceptual design of the WCD option for LBNE. Though not selected as the LBNE far detector this CDR represents the state of the art in WCD design, is technically sound and may be useful for future initiatives. This CDR includes the WCD detector and the Conventional Facilities (CF) for the WCD. Many additional supporting documents for the CF are archived separately. The cost and schedule for WCD and CF-WCD are also documented elsewhere (e.g. internal LBNE web pages: http://lbne.fnal.gov/reviews/CD1-alt.shtml#FDTech). Copies of documents identified with “LBNE:DocDB” may be obtained from the LBNE project office.
The LBNE Collaboration
1 Introduction
The Long-Baseline Neutrino Experiment (LBNE) Project team has prepared this Conceptual Design Report (CDR), which describes a world-class facility that will enable the scientific community to carry out a compelling research program in neutrino physics. The ultimate goal in the operation of the facility and experimental program is to measure fundamental physical parameters, explore physics beyond the Standard Model and better elucidate the nature of matter and antimatter.
Although the Standard Model of particle physics presents a remarkably accurate description of the elementary particles and their interactions, scientists know that the current model is incomplete and that a more fundamental underlying theory must exist. Results from the last decade, that the three known types of neutrinos have nonzero mass, mix with one another and oscillate between generations, point to physics beyond the Standard Model.
A set of measurable quantities is associated with neutrino physics. The three-flavor-mixing scenario for neutrinos can be described by three mixing angles (, and ) and one CP-violating phase (). The probability for neutrino oscillation also depends on the difference in the squares of the neutrino masses, ; three neutrinos implies two independent mass-squared differences ( and ).
Until recently, the entire complement of neutrino experiments to date had measured just four of these parameters: two angles, and , and two mass differences, and . The sign of is known, but not that of . In 2011, the MINOS[1], T2K[2], and Double Chooz[3] experiments presented indications of a non-zero value of . Recently, the Daya Bay reactor neutrino experiment announced observation of the disappearance of electron antineutrinos from a reactor, with a measured value of [4].
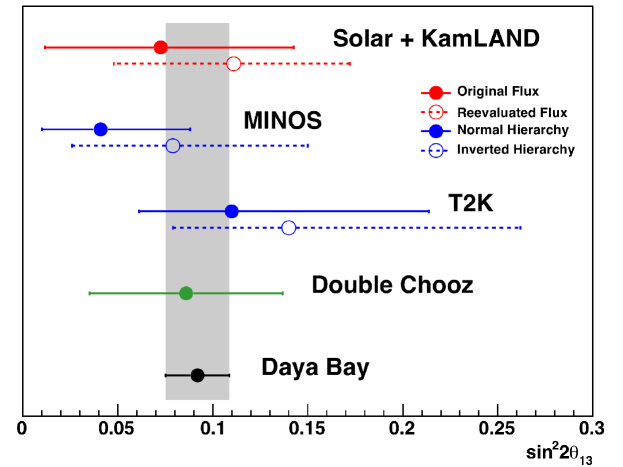
Figure 1–1 compares the 1 allowed ranges of from recent measurements. Improved measurements for this mixing angle are expected in the near future.
Observations of oscillations of a beam (composed initially of muon neutrinos, ) over a long baseline are the key to determining the mass hierarchy (the sign of ) and exploring CP violation. In this case, the signature of CP violation is a difference in the probabilities for and transitions. The study of the disappearance of probes and ||.
In its 2008 report, the Particle Physics Project Prioritization Panel (P5) recommended a world-class neutrino-physics program as a core component of the U.S. particle-physics program[7]. Included in the report is the long-term vision of a large detector in the Sanford Underground Laboratory in Lead, S.D., the site of the formerly proposed Deep Underground Science and Engineering Laboratory (DUSEL), and a high-intensity neutrino source at Fermilab.
On January 8, 2010, the Department of Energy approved the Mission Need for a new long-baseline neutrino experiment that would enable this world-class program and firmly establish the U.S. as the leader in neutrino science. The LBNE Project is designed to meet this Mission Need. With the facilities provided by the LBNE Project, the LBNE Science Collaboration proposes to make unprecedentedly precise measurements of neutrino-oscillation parameters, including the sign of the neutrino mass hierarchy. The ultimate goal of the program will be to search for CP-violation in the neutrino sector. A configuration of the LBNE facility, in which a large neutrino detector is located deep underground, could also provide opportunities for research in other areas of physics, such as nucleon decay and neutrino astrophysics, including studies of neutrino bursts from locally occurring supernovae. The scientific goals and capabilities of LBNE are summarized in Chapter 1.2 and fully described in the LBNE Case Study Report (200 kTon Water Cherenkov Far Detector)[8].
1.1 Science Objectives
The LBNE water Cherenkov detector has a broad range of scientific objectives, listed below.
-
1.
Measurements of the parameters that govern oscillations as discussed above. This includes measurement of the CP violating phase and determination of the mass ordering (the sign of ).
-
2.
Precision measurements of and || in the -disappearance channel.
-
3.
Search for proton decay, yielding measurement of the partial lifetime of the proton (/BR) in one or more important candidate decay modes, e.g. or , or significant improvement in limits on it.
-
4.
Detection and measurement of the neutrino flux from a core-collapse supernova within our galaxy or a nearby galaxy, should one occur during the lifetime of the detector.
-
5.
Other accelerator-based neutrino oscillation measurements.
-
6.
Measurements of neutrino oscillation phenomena using atmospheric neutrinos.
-
7.
Measurement of other astrophysical phenomena using medium-energy neutrinos.
-
8.
Detection and measurement of the diffuse supernova neutrino flux.
-
9.
Measurements of neutrino oscillation phenomena and solar physics with solar neutrinos.
-
10.
Measurements of astrophysical and geophysical neutrinos of low energy.
Objectives (9) and (10) may require upgrades beyond the baseline design.
1.2 Experimental Capabilities
The LBNE Case Study Report for a water Cherenkov detector[8] details the experimental capabilities and performance metrics. Here we present a high-level summary.
1.2.1 Accelerator-based Neutrino Oscillations
Observation of oscillations will allow us to determine the neutrino mass hierarchy and measure leptonic CP violation through the measurement of . In five years of neutrino (antineutrino) running, assuming , , and normal mass hierarchy, we expect 1068 (382) selected or signal events and 502 (237) background events in a 200 kTon water Cherenkov detector with a 700 kW beam.
Figure 1–2
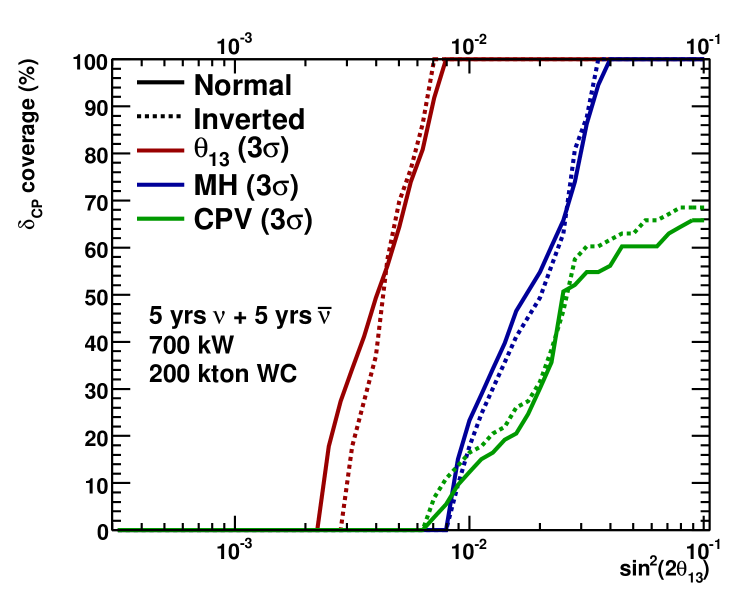
shows the fraction of possible values covered at the 3 level for determining , the mass hierarchy, and CP violation as a function of for a 200 kTon detector in a 700 kW beam running for five years in neutrino mode and five years in antineutrino mode. At a value of (the measured value from Daya Bay), the mass hierarchy can be resolved at 3 for 100% of . For CP violation, a 3 determination can be made for 65% of values.
In addition, a water Cherenkov detector of this size can achieve 1% precision on measurements of and through muon-neutrino and antineutrino disappearance. There is also the potential to resolve the octant degeneracy and improve model-independent bounds on non-standard interactions.
1.2.2 Proton Decay
We will study two key modes of proton decay with the water Cherenkov detector: and . Figure 1–3
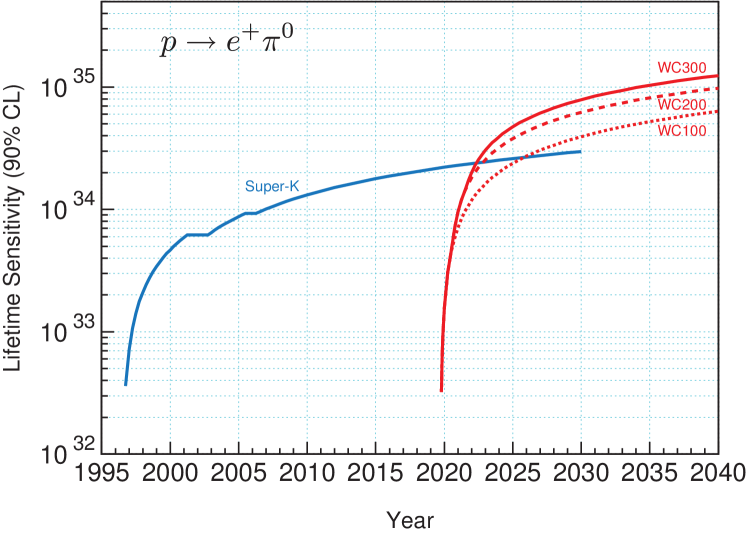
shows the 90% C.L. sensitivity for as a function of time. The leftmost curve is for Super–Kamiokande. The curves on the right show the sensitivity for a 100, 200, or 300 kTon fiducial mass WCD. The efficiencies and background rates for the curves were taken to be identical to those for Super–Kamiokande, namely detection efficiency of 45% and background rate of 0.2 events/100 kTon-years. According to this calculation, a 200 kTon detector with a ten-year exposure could set a limit of years. For the mode, we could expect to improve upon the Super–Kamiokande limits by roughly a factor of two with a 200 kTon water Cherenkov detector.
1.2.3 Supernova Neutrinos
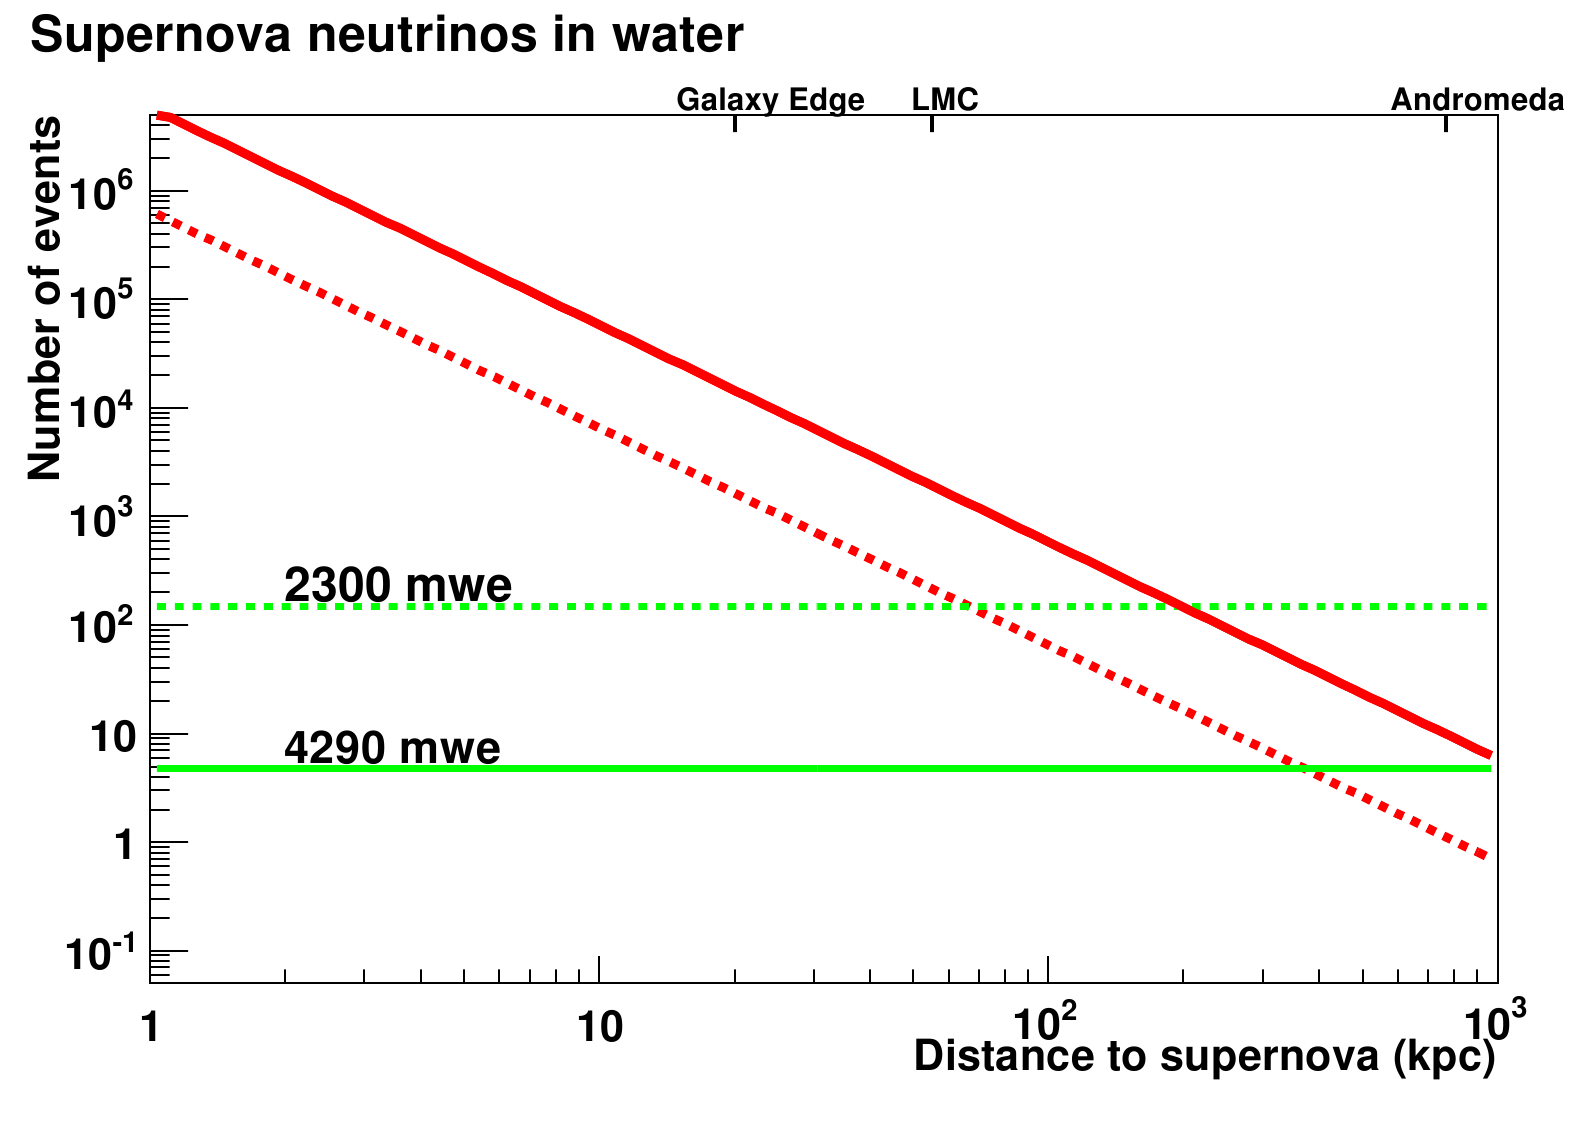
Figure 1–4 shows the number of expected events in 30 seconds from a supernova burst for Super–Kamiokande or a 200 kTon WCD as a function of the distance to the supernova. At a distance of 10 kpc, a burst would produce a few hundred events per kiloton of water within a few tens of seconds. Such a high-statistics signal from a supernova would provide valuable information on a variety of physics and astrophysics topics, including neutrino oscillations. In one particular flux model, it would take roughly 3,500 events in the WCD to distinguish the neutrino mass hierarchy at 3. A core-collapse supernova within the Milky Way galaxy would produce at least this many events in a 200 kTon WCD.
Electron antineutrinos interacting with protons result in a positron and a neutron. The positron gives a prompt Cherenkov signal while the neutron capture results in a delayed signal. Adding gadolinium to the water would enhance the detection of these neutrons. Gadolinium has a large neutron capture cross section and results in the emission of gamma rays with a total energy of 8 MeV. The gadolinium has two effects, (1) the time delay between the prompt positron signal and the delayed neutron is significantly shortened due to the reduced neutron capture time, resulting in a reduced rate of accidental backgrounds, and (2) the large gamma ray energy emission increases the detection probability of these neutrons while further reducing background triggers. Gadolinium has been used in numerous liquid scintillator neutrino detectors (for example, Daya Bay, Double Chooz, RENO).
Enhancement of the WCD baseline design with higher photocathode coverage and gadolinium loading would make possible an observation of supernova relic neutrinos at 3 in only a couple of years, even assuming the most pessimistic of current predictions for the flux. The enhancement would also greatly increase the number of observed events from a supernova burst.
1.2.4 Other Physics Topics
A 200 kTon WCD will be able to collect an atmospheric-neutrino sample with high enough statistics to provide a measurement of the oscillation parameters that is complementary to the measurement made using accelerator neutrinos.
Enhanced photocathode coverage would also make accessible an observation of the Day-Night effect from solar neutrinos, for which the flux asymmetry is growing above 5 MeV but begins to fall above about 8 MeV. Enhanced coverage would lower the energy threshold, allowing a larger window for measuring this phenomenon.
1.3 Project Scope
1.3.1 Project Scope
The DOE Mission Need for the LBNE Project proposes the following major elements:
-
An intense neutrino beam aimed at a distant site
-
A near-detector complex located near the neutrino source
-
A massive neutrino detector located at the far site
The LBNE Project scope includes construction of experimental systems and facilities at two separate geographical locations. We present a reference design to achieve the Project’s mission in which a proton beam extracted from the Fermilab Main Injector (MI) is used to produce a neutrino beam. The neutrino beam traverses a near detector a few hundred meters downstream before traveling through the Earth’s mantle to a far detector located 1,300 km away in the Sanford Underground Laboratory, the site of the former Homestake Mine in Lead, South Dakota. The 1,300-km separation between the sites presents an optimal baseline for LBNE’s neutrino-oscillation physics goals.
The main scope elements on the Fermilab site, also referred to as the Near Site, include:
-
Magnets and support equipment to transport the extracted protons to the target (where approximately 85% of them interact, producing pions and kaons)
-
A target and target hall
-
Magnetic focusing horns to direct pions and kaons into a decay tunnel
-
A decay tunnel where these particles decay into neutrinos
-
A beam absorber at the end of the decay tunnel to absorb the residual secondary particles
-
Near detectors to make beamline measurements and neutrino-flux and spectrum measurements
-
Conventional facilities at Fermilab to support the technical components of the primary proton beam, the neutrino beam and the near detectors
The main scope elements at the Sanford Laboratory site, the Far Site, include:
-
The massive far detector, located underground
-
Infrastructure required for the far detector, both above- and below-ground
-
Conventional facilities at Sanford Laboratory to house and support the technical components of the far detector
The following sections summarize the beamline, near and far detectors, and near and far site conventional facilities.
1.3.2 Beamline at the Near Site
The LBNE beamline complex at Fermilab will be designed to provide a neutrino beam of sufficient intensity and energy to meet the goals of the LBNE experiment with respect to long-baseline neutrino-oscillation physics. The design is that of a conventional, horn-focused neutrino beamline. The components of the beamline will be designed to extract a proton beam from the Fermilab Main Injector and transport it to a target area where the collisions generate a beam of charged particles. This secondary beam, aimed toward the far detector, is followed by a decay-pipe tunnel where the particles of the secondary beam decay to generate the neutrino beam. At the end of the decay pipe, an absorber pile removes the residual particles.
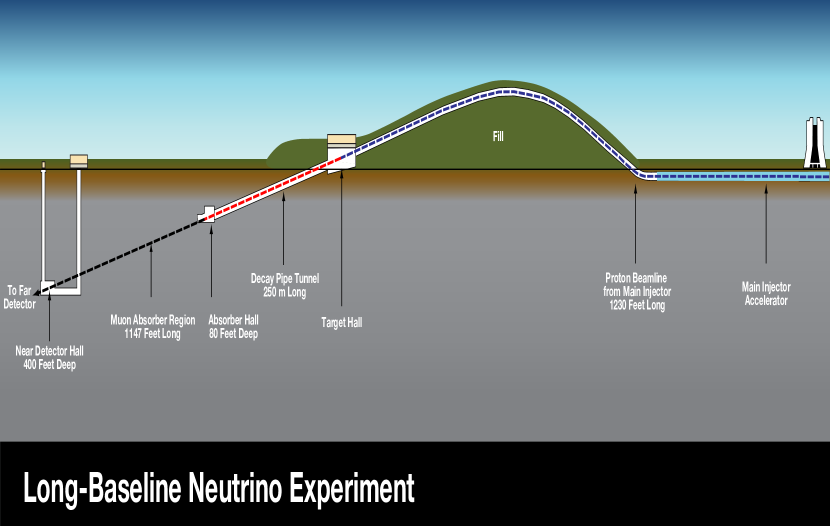
The facility is designed for initial operation at proton beam power of 700 kW, with the capability to support an upgrade to 2.3 MW. In our reference design, extraction of the proton beam occurs at MI-10, a new installation. After extraction, this primary beam follows a straight compass heading to the far detector, but will be bent vertically upward for approximately 700 feet before being bent vertically downward at the appropriate angle, 0.1 radian (5.6∘), as shown in Figure 1–5. The primary beam will be above grade for most of its length.
The target marks the transition from the intense, narrowly directed proton beam to the more diffuse, secondary beam of particles that in turn decay to produce the neutrino beam. The interaction of a single proton in the target creates, on average, four charged particles consisting mostly of pions and kaons. These secondary particles are short-lived. Each secondary particle decay generates a muon, which penetrates deep into the surrounding rock and a neutrino that continues on toward the near and far detectors.
After collection and focusing, the pions and kaons need a long, unobstructed volume in which to decay. This decay volume in the LBNE reference design is a pipe of circular cross section with its diameter and length optimized such that decays of the pions and kaons result in neutrinos in the energy range useful for the experiment.
1.3.3 Near Detector Complex
The LBNE Near Detector Complex (NDC), located downstream of the target, consists of two detector systems, one for making measurements of muons in the beamline and the other to measure the neutrino flux and spectrum. The NDC primary purpose is to maximize the oscillation physics potential of the far detector. The scope and design of the ND are therefore driven by the overall experiment’s requirements for neutrino-oscillation analysis, which will not yet be known precisely by CD-1.
The Beamline Measurements system will be placed in the region of the absorber at the downstream end of the decay region. Three detector systems will be deployed to measure (a) the muon-beam profile (with a grid of ion chambers), (b) the muon-beam energy spectrum (using variable-pressure threshold gas Cherenkov detectors), and (c) the muon flux (by counting the number of muon-decay Michel electrons in “stopped-muon detectors”).
The Neutrino Measurements system will be placed underground in the Near Detector Hall 450 m downstream of the target. The reference design consists of a a fine-grained tracker with water as the target material. Based on the NOMAD detector, the upstream portion of the detector consists of planes of straw tubes interspersed with planes of water targets and the downstream portion consists of planes of radiators. The tracker is surrounded by an electromagnetic calorimeter and the whole assembly is enclosed in a wide-aperture magnet similar to the UA-1 design. Interspersed in the magnet yoke and surrounding the magnet coils is a muon-identification system based on resistive-plate chambers (RPCs).
1.3.4 Conventional Facilities at the Near Site
The baseline design for the LBNE Project at the Near Site incorporates extraction of a proton beam from the MI-10 point of the Main Injector, which then determines the location of the NDC and supporting Near Site Conventional Facilities. The Near Site Conventional Facilities not only provide the support buildings for the underground facilities, but also provide the infrastructure to direct the beamline from the below-grade extraction point to the above-grade target. See Figure 1–5 for a schematic of the experimental and conventional Near Site facilities.
Figure 1–6 shows a schematic longitudinal section of the entire Near Site, with an exaggerated vertical scale to show the entire Project alignment in one illustration.
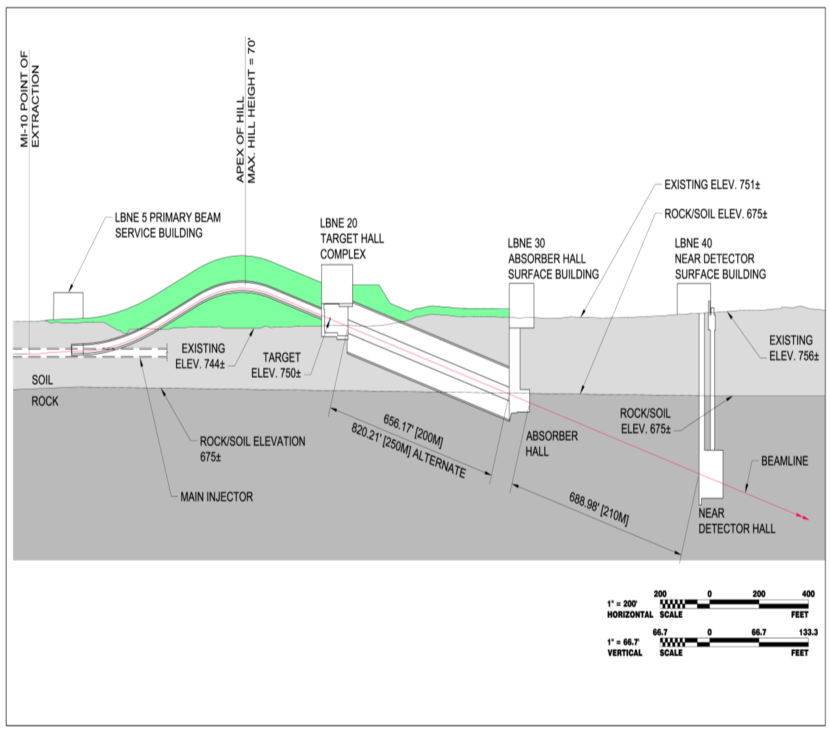
The beam will travel approximately 1,200 ft (366 m) through the proposed Primary Beamline Enclosure to the Target Hall and through focusing horns and a target to create an intense neutrino beam that will be directed through a 656-ft (200-m) long decay pipe through a hadron absorber where the beam will then leave the Absorber Hall and travel 689 ft (210 m) through bedrock to the NDC, to range out (absorb) muons, before reaching the Near Detector Hall. The neutrino beam will then pass through the NDC before continuing through the Earth’s mantle to the Far Site.
The Near Site Conventional Facilities LBNE Project layout at Fermilab, the “Near Site”, is shown in Figure 1–7.

Following the beam from east to west, or from right to left in this figure, is the underground Primary Beamline Extraction Enclosure, the underground Primary Beamline Enclosure/Pre-target Tunnel and its accompanying surface based Service Building (LBNE 5), the in-the-berm Target Complex (LBNE 20), the Decay Pipe, the underground Absorber Hall and its surface Service Building (LBNE 30), and the underground Near Detector Hall and its surface Service Building (LBNE 40). The Project limits are bounded by Giese Road to the north, Kautz Road to the east, Main Injector Road to the south, and Kirk Road to the west.
1.3.5 Water Cherenkov Detector at the Far Site
The signal in water Cherenkov detectors (WCDs) is well understood. When charged particles travel faster than the speed of light in a transparent medium such as water, they emit Cherenkov light. The Cherenkov radiation emitted by particles traversing the detector and interacting in the fiducial volume of the WCD are detected by an array of photomultiplier tubes (PMTs) that surround the fiducial volume of the WCD. The photons radiate out in a cone, the angle of which, relative to the track direction, is related to their velocity (); in water the angle is about 41∘. The emitted photons thus project a ring pattern on the opposite side of the detector (distorted somewhat, due to the cylindrical geometry). The projected ring pattern has a finite width dependent upon the length of the track (i.e., emissions from the vertex end of the track project a ring of higher radius than those from the near end). Ignoring scattering, all hits at a particular radius effectively correspond to the same segment of track.
Accurate and precise timing of the PMT hits is of paramount importance in reconstructing the signal for analysis. For a given radius (or track segment), the Cherenkov photons will hit some parts of the distorted ring before others, depending on the angle of the track (and the emitted photons) relative to the detector geometry and PMT placement. Thus the hit times at a given radius correspond to the locations of the corresponding track segment in the water volume. For very short tracks the ring structure is not as well defined, due to the low number of PMTs hit. However, from the emission angle, the spatial extent and the timing of the “cluster” of hits, the vertex can be reconstructed, albeit less accurately.
The performance of the PMTs and the quality of the signal path to the data acquisition system, discussed in Chapter 3, directly affect the energy and position resolution, particle identification and background rejection, which in turn determine the physics reach of the experiment. Other important parameters driving the physics potential of this detector include the volume, the PMT coverage as a fraction of the surface area, the number of photosensors (i.e., the granularity of coverage), and the detector depth.
Large water Cherenkov detector volumes are very cost effective since the detector medium, water, is inexpensive. The number of signal detectors (PMTs), which is one of the main cost drivers, increases as the surface area of the detector rather than the volume, that is as (Volume)2/3. The natural limits of detector diameter are determined by the size of the excavation permitted by the rock strength parameters while the detector height is limited by the water-pressure tolerance of the PMTs. The attenuation length of the light in pure water is on the order of 80–100 m at the relevant wavelength, so it is not a limiting factor. This leads us to the design of a 200 kTon fiducial mass detector at the Homestake 4850 level (4850L).
1.3.5.1 Historical Precedents
There are a number of precedents for the construction and operation of large underground water Cherenkov detectors. The first of these to use hemispherical photomultiplier tubes was a 300-ton detector constructed in 1978 in the water shield that surrounded the Homestake chlorine solar-neutrino detector. This was followed in 1982 by the 8-kTon Irvine-Michigan-Brookhaven (IMB) detector in the Morton Salt Mine in Fairport Harbor, OH and in 1983 by the 3-kTon Kamiokande detector in Japan. In 1996 the 22.5-kTon fiducial volume (50-kTon total mass) Super–Kamiokande detector began operation in Japan followed in 1998 by the Sudbury Neutrino Observatory (SNO) in Sudbury, Canada with 1 kTon of heavy water and 1.7 kTon of light water.
The successful operation of previous underground water Cherenkov detectors as well as the successful detection of neutrinos at sites distant from the initiating accelerators have demonstrated the feasibility of this experimental effort. The recent announcement[2] by the T2K collaboration that the Super–Kamiokande detector has successfully detected electron neutrinos in a muon neutrino beam from the J-PARC accelerator is a clear demonstration that massive water Cherenkov detectors can successfully carry out the desired physics program. The four times longer LBNE baseline and the order of magnitude larger fiducial volume of the LBNE WCD over that of the Super–Kamiokande detector will permit far more sensitive probes of the parameters of neutrino oscillations. The larger mass will also allow farther reaches of other non-accelerator scientific issues.
Our proposed WCD is an enlarged and improved version of the highly successful Super–Kamiokande detector, with a fiducial mass about nine times that of Super–Kamiokande, a much deeper location resulting in a smaller cosmic ray flux, and improved response photomultipliers. The singular negative aspect of massive underground water Cherenkov detectors was the chain reaction photomultiplier implosion that occurred at Super–Kamiokande in November 2001 following a drain of the detector and replacement of a number of the photomultipliers. This event was carefully studied by the Super–Kamiokande group and photomultiplier housings to prevent recurrence were installed. We have considered this occurrence very carefully and have made provisions to prevent such an event in our photomultiplier system.
1.3.5.2 Scientific Requirements
The scientific requirements for a water Cherenkov far detector for LBNE include:
-
Total fiducial mass of at least 200 kTon
-
4000 meters-water-equivalent (m.w.e) of overburden to reduce the cosmic background rate to the 0.1-Hz level
-
PMT coverage, efficiency, and a low radioactivity environment adequate to detect 5-MeV electrons
-
Water-purification system to maintain an attenuation length of 90 m at a wavelength of 420 nm
A detailed study of depth requirements for the main physics topics of interest is described in reference[9]. Table 1–1 summarizes the results of the study for a water Cherenkov detector. The conclusion was that a water Cherenkov detector should be located on the main Homestake campus at 4850L.
| Physics | Depth (m.w.e) |
|---|---|
| Long-baseline accelerator | 1,000 |
| Proton Decay | 3,000 |
| Day/Night 8B Solar | 4,300 |
| Supernova burst | 3,500 |
| Relic supernova | 4,300 |
| Atmospheric | 2,400 |
Detecting neutrinos and antineutrinos from a variety of extra-terrestrial sources, such as the sun, prompt supernova bursts and ancient supernovae, involves the detection of neutrino secondaries in the 5 MeV and above energy range. In addition, nucleon decay in 16O results in the emission of a gamma or several gammas with a total energy of 6 MeV. Detection of astrophysical neutrinos and nuclear decay is enhanced by having our detector sensitive to 5 MeV secondaries.
1.3.5.3 Reference Design
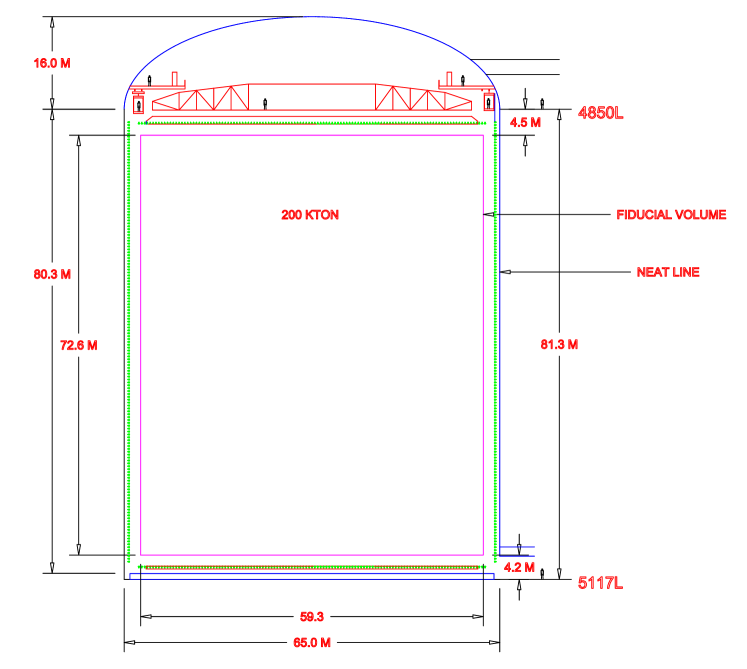
The LBNE water Cherenkov detector consists of a very large excavated cavity in a very strong and stable rock formation. The cylindrical cavity will be lined with a smooth liner and filled with extremely pure water. The reference design calls for a total water mass of 266 kTon and a fiducial mass of 200 kTon. PMTs will surround the fiducial volume on the top, bottom, and around the perimeter. The wall PMTs will be suspended by cables about half a meter from the inner surface of the liner. The top and floor PMTs will be mounted to the structural framework. Each PMT will be connected via cable to readout electronics on the balcony above the water detector. The baseline design includes a top veto region, which will consist of an array of horizontally-oriented PMTs optically separated from the rest of the detector. The veto will be used to tag cosmic ray muons that enter the detector from above that form a background for astrophysical neutrino measurements.
Provisions will be made to fill the detector with purified water and to recycle this water through the purification system and cool it. There will be provision to periodically calibrate the detector and monitor its status and performance. Finally, there will be provisions to prevent radon contamination of the detector water.
The optimum shape of the detector from excavation considerations at this site is a vertical circular cylinder. There are two limitations on the maximum diameter: the light attenuation length in water (90 meters) and the maximum rock excavation diameter that does not require extraordinary rock support. The studies of both the Large Cavity Advisory Board and Golder Associates concluded that an excavated cylindrical cavity with a diameter of 65 meters was completely feasible and cost efficient.
Table 1–2 summarizes the important detector parameters.
| Detector Design Parameter | Value |
|---|---|
| Fiducial Volume | 200 kTon (200,000 m3) |
| Location | Homestake 4850 ft level |
| Shape | Right circular cylinder |
| Cylinder Excavation Dimensions | 65.6 m diameter 81.3 m height |
| Dome Height | 16 m |
| Vessel Liner Dimensions | 65 m diameter 80.3 m height |
| Water Volume Dimensions | 65 m diameter 79.5 m height |
| Total Water Volume | 263,800 m3 |
| Distance from Neat Line to PMT Equator | 0.85 m |
| Dimensions of Instrumented Volume | 63.3 m diameter 76.6 m height |
| Instrumented Volume | 241,000 m3 |
| Fiducial Volume Cut | 2 m |
| Fiducial Volume Dimensions | 59.3 m diameter 72.6 m height |
| Number of PMTs | 29,000 |
| PMT Diameter | 12 in (304 mm) |
| Peak QE of PMTs (at 420 nm) | 30% |
| PMT Spectral Response | 300–650 nm |
| PMT Transit Time Spread | 2.7 ns |
| Light Gain from Light Collectors | 41% |
| Max Water Pressure on PMTs | 7.9 bar |
| Number/Type Veto PMTs | 200 12 in |
| Water Fill Rate | 250 gal/min (0.95 m3/min) |
| Detector Fill Time | 195 days |
| Water Circulation Rate | 1200 gal/min (4.5 m3/min) |
| Water Volume Exchange Time | 40 days |
| Water Temperature | 13∘C |
| Electronics Burst Capability | 1 M events in 10 s |
| Electronics Time Resolution | 1 ns |
| Electronics Dynamic Range | 1–1000 PE |
| Timing Calibration | 1 ns |
| PMT Pulse Height Calibration | 10% |
| Radon Content | mBq/m3 |
Table 1–3 shows the reliability and maintainability minimum lifetimes of LBNE excavations, construction and installed components.
| Component | Lifetime |
|---|---|
| Excavations | 30 years |
| Non-maintainable construction and components | 20 years |
| Upgradable components (shutdown required) | 10 years |
| Maintainable construction and components | by service life |
The major detector components are (1) the water containment system, (2) the photomultiplier mounting, housing and cable system, (3) the electronics readout and trigger system, (4) calibration procedures, (5) the water purification and cooling system, and (6) event reconstruction and data analysis. Each of these is described in detail in the following chapters. Here we will provide a summary of each of these systems with a few comments.
-
1.
Water Containment System The chamber excavation in the rock provides both space for the detector volume and the containment walls for the detector water. The finished excavation space is a vertical cylinder that has a diameter of 65 meters and height of 81.3 meters and is topped by a domed roof whose center rises 16 meters above the top of the vertical cylinder. The excavation is to provide a “smooth” cylindrical rock surface. Additional treatment of the rock surface is intended to (a) prevent seepage of water from the rock into the detector, (b) prevent leakage of water out of the detector, and (c) prevent leaching of minerals out of the rock into the detector water. These requirements are met by installing a drainage layer against the rock surface before covering the rock with shotcrete and then installing a polymer membrane over the shotcrete. These membrane liners are commonly used for waterproofing, roofing, or tank liner material.
-
2.
Photomultiplier System The photomultiplier system is the heart of the detector and so the most critical component. The reference design includes 29,000 PMTs, each of which has a 12-inch diameter hemispherical photocathode. The relative quantum efficiency of these PMTs is about 1.5 times that of the PMTs used in Super–Kamiokande. In addition, we are considering light collectors to increase the light collection of these PMTs. The light collection efficiency of the various schemes under consideration enhances the amount of light collected by a factor of 1.4 to 1.6.
The baseline configurations for the number of PMTs, quantum efficiency, and light collector performance have been set so the detector will have an effective PMT surface coverage of at least 20%. The Super–Kamiokande detector took data for several years in a configuration with 20% coverage, and thus it has been proven that a WCD with this coverage can successfully separate electrons and ’s. This is the minimum coverage for which the performance has been experimentally validated. Our risk registry and contingency include sufficient funds to maintain this coverage in the case where the light collectors do not work as expected.
The structural framework for mounting the photomultipliers is referred to as the PMT Installation Unit (PIU). The PMTs will be mounted onto vertical cables that run from the top of the detector to its base. This is a simple mounting system. The alternatives, which were rejected, were to either mount the PMTs to the rock walls of the excavation which involves multi-thousand holes through the water sealing polymer liner or to construct a massive 80 meter high internal structure to hold the PMTs.
The photomultiplier system consists of six parts, (a) the tube itself, (b) the light collectors, (c) the base circuitry, (d) the cable connecting the base to the surface, (e) the housing and (f) possibly a magnetic shield (as an alternative if magnetic compensation coils are not installed around the water containment vessel). The PMT, base, housing, and cable assembly is collectively referred to as a PMT assembly (PA).
Two types of light collectors are being considered. The first is a cone that extends beyond the photomultiplier tube diameter and directs light toward the tube photocathode that would otherwise miss that photocathode. The second type is a wavelength-shifting plate with a central hole that accommodates the PMT and and outside diameter about twice that of the photomultiplier. Light that impinges on the plate will be wavelength shifted and then piped through the plate to the edge region of the photomultiplier tube. The estimated increase in light collection is 40–60%.
Water transparency can be affected by all the materials in contact with the water. This includes the materials used for the PMT mount, the base, the housing, the cable cover, the light collectors, the magnetic field shield and the detector liner. These parts either should not leach undesirable materials into the water or should be coated with a material that prevents such leaching. Chapter 6 identifies material compatibility testing being performed to mitigate this issue.
An additional consideration for the photomultipliers is compensation for the Earth’s magnetic field. At the location of the Homestake Mine, the Earth’s magnetic field has a dip angle of about 70∘ and so is primarily downward with a small horizontal component. Without magnetic field compensation, there will be a distortion of the electron path from photocathode to first dynode and a resulting reduction of photoelectron collection efficiency that depends on the orientation of the photomultiplier tube. Two field compensation systems are being considered. One involves a set of coils that completely surround the detector and cancel out most or all of the Earth’s magnetic field. The second, passive system involves a mu-metal shield around each photomultiplier tube.
-
3.
Electronic Readout and Trigger System The electronic readout and trigger system will be an updated version of that used by Super–Kamiokande and SNO using newer versions of electronic components and computer systems. Fortunately, members of the LBNE collaboration were involved in the development of both the Super–Kamiokande and SNO electronics and so we have the necessary expertise on hand. The large number of photomultipliers means that there will be a very large number of cables running from the photomultiplier tubes to the front end electronics. The plan is to locate the front end electronics on a balcony inside the detector chamber above the water level of the detector. The farthest photomultiplier tubes will then have a cable length of about 150 meters. The trigger system reference design is for a software trigger in which all single-PMT-hit data gets forwarded to processors that look for correlations. A hardware trigger is also included in the design as both a backup to the software trigger and a diagnostic tool.
-
4.
Calibration Systems The WCD calibration system will have five largely independent subsystems: water transparency, PMT calibration, energy calibration, vertex resolution and particle identification efficiency, and detector environmental monitoring. Water transparency will be monitored by measuring the light attenuation length both in situ (using cosmic rays, light sources, and a portable commercial system) and externally by taking samples of the water. The PMT calibration system will consist of a pulsed laser light source, an optical fiber for a light guide, and a light-diffusing ball located near the center of the water volume. The PMT calibration will be run along with regular data-taking at a low rate. Energy and vertex calibration will be performed using naturally occurring events in the detector (cosmic muons, Michel electrons, etc) and radioactive sources. The use of a high-energy electron accelerator is also being considered for energy calibration. Finally, the detector environmental monitoring system will constantly monitor the temperature, pH, and resistivity of the water. Additionally, radon content and biologic activity in the water will be periodically checked.
-
5.
Water Purification and Cooling To maintain water transparency and avoid backgrounds from radioactive contaminants in the water, the water must be highly purified. Fortunately, numerous industrial systems require water purity at or above the level necessary for this detector and so such systems are readily available. The system required for this detector will purify and cool the water that is used to fill the detector and continuously recycle the detector water. This system will remove impurities in the water that have been leached from the detector materials in contact with the water, remove biological growth in the water and lower the temperature to compensate for the heat flow into the water from the surrounding rock and the PMT bases. The cooling of the detector below its natural steady state will reduce the potential for biological growth. Based on experience with other water Cherenkov detectors, notably Super–Kamiokande, the radon levels in the water can be held at the level of a few mBq/m3. At this level, triggers from radioactivity in the water will be negligible.
The water system was designed to minimize the amount of electrical power consumed, and provide for both disposal of waste water and later addition of extra features to the detector fill. One of these is the addition of gadolinium to the water to increase the sensitivity of the detector to anti-electron neutrino detection.
-
6.
Event Reconstruction and Data Analysis The computing effort provides and manages the systems and software required for the collaboration to perform detector simulations, to collect data from the DAQ, process it, transfer it, archive it and perform data analysis. In terms of event reconstruction, there is a strong similarity between reconstruction in the LBNE WCD and that which was and is being used by SNO, Super–Kamiokande, and MiniBooNE (an 800-ton mineral oil Cherenkov detector at Fermilab). The differences between these experiments and LBNE (the number and location of PMTs, the time resolution and spatial extent of each PMT, the larger detector diameter of the detector, choice of light collectors, etc.) will have an impact on reconstruction, but these issues are well understood. Our performance assumptions for event reconstruction have a firm basis in operating experiments.
Enhanced Physics Capabilities
The addition of gadolinium to the WCD allows the detection of low-energy neutrons, which would allow the tagging of electron antineutrinos. Such a capability would enhance physics sensitivity in the areas of supernovae, proton decay and cosmological neutrino measurements. Considering that the detector will run for 20 years or more, a detector with the broadest capability is desirable. The reference design preserves the option to add gadolinium either during initial installation or at a later date. This means we will require from the beginning that the water system and all materials used in the detector are compatible with gadolinium.
One important factor for achieving a low energy threshold is limiting backgrounds from radioactive impurities in the detector components. Limiting this contamination is particularly important in preserving the possibility of adding gadolinium. The reference design thus includes a plan for maintaining systematic cleanliness and radioactivity requirements throughout the manufacturing and construction processes, as contaminants are difficult to remove once introduced.
We are currently studying the cost of the gadolinium option. The cost will be dominated by the additional PMTs needed to ensure sensitivity to the gamma cascade following a neutron capture on gadolinium. Chapter 9 covers the additional requirements for implementing the gadolinium option, a phase not included in the present reference design.
Alternatives
There are other detector design alternatives that are still being considered. These are: 1) a free-standing PMT installation unit (PIU) instead of linear PIU deployment of the wall PMTs, 2) a concrete vessel formed against the cavity shotcrete to replace the liner mounted directly on the cavity walls and 3) a thin muon veto. These alternatives are discussed in Chapter 10.
A number of other alternatives considered as part of the value engineering process are discussed in Chapter 11.
1.3.5.4 Detector Performance
The Super–Kamiokande WCD has been successfully operating for more than 15 years. The performance assumptions we use to evaluate physics sensitivities for LBNE are based on Super–Kamiokande detector simulation and reconstruction algorithms. Super–Kamiokande simulation predictions have been validated against Super–Kamiokande data, including both astrophysical data and beam neutrino data.
A WCD simulation package (WCSim) has been developed for LBNE. The predictions of WCSim are currently being compared with the corresponding Super–Kamiokande simulation predictions. Event reconstruction tools for LBNE are also in development. Although tremendous progress has been made, these tools are not yet refined enough to produce reliable performance evaluations. Thus we rely on the experience of Super–Kamiokande to produce experimentally well-justified assumptions for our detector performance.
This section includes a description of the reconstruction performance achieved in Super–Kamiokande. Note that Super–Kamiokande has had several run periods with different detector configurations. In the SK-I period, the photocathode coverage was 40%. During the SK-II period, the coverage was reduced to 20%. We then summarize the main reconstruction performance requirements for the LBNE WCD.
Neutrino events are required to have a reconstructed event vertex inside the fiducial volume of the detector. Vertex resolution in Super–Kamiokande for fully contained, single-ring, electron-like events is 30 cm for sub-GeV rings and 50 cm for multi-GeV rings. For fully contained single ring muon-like events, the vertex resolution is 25–30 cm[10]. The vertex resolution is similar for SK-I and SK-II. While the vertex resolution does not strongly depend on the coverage, it will depend on granularity and PMT timing.
The neutrino energy for single-ring beam neutrino events can be reconstructed assuming the event was a charged-current quasi-elastic interaction, using the following formula:
| (1.1) |
where , , , and are the electron or muon energy, mass, momentum, and angle with respect to the beam direction and is the nucleon mass. (The binding energy of oxygen is ignored in this expression.) The momentum resolution is 3% (4.5%) for 1 GeV/c electrons in SK-I (SK-II) and the electron angular resolution is 3∘ (1.5∘) for sub-GeV rings (multi-GeV rings)[10] (similar for SK-I and SK-II). Taking into account these resolutions, the Fermi motion, and the effect of contamination from non-quasi-elastic events in the selected sample, the electron neutrino energy resolution is expected to be 10% at 1 GeV[11]. The momentum resolution for 1 GeV/c muons is 2% (3%) in SK-I (SK-II). The muon angular resolution is 2∘ for sub-GeV rings and 1∘ for multi-GeV rings (in SK-I and SK-II).[10].
The Sun emits low energy electron neutrinos, and supernovae emit low energy neutrinos and anti-neutrinos. We anticipate a detection threshold of about 5 MeV. The electron energy resolution at 10 MeV is 14% (21%) for SK-I (SK-II). The vertex resolution (the precision with which the origin of single low-energy electron tracks can be determined) is 87 (110) cm for SK-I (SK-II), and the electron angular resolution is 26∘ (28∘) for SK-I (SK-II)[12].
The relationship between the photocathode coverage and the hardware threshold is shown in Figure 1–8. This plot was made based on observations from Super–Kamiokande [13, 14] and SNO[15].
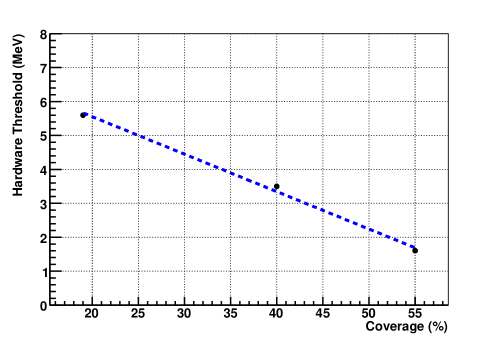
The larger the photocathode coverage, the lower the energy threshold, though the threshold is limited by the rate of natural background radiation.
The requirements on the reconstruction depend on the physical processes being studied. High-energy events (like beam neutrinos) have different requirements than low-energy events (like solar neutrinos). Overall requirements have been collected and documented[16], and a select few that mostly pertain to reconstruction of beam events are given here along with the expectation based on the achievements of Super–Kamiokande.
- Position:
-
The event vertex position is important for correcting the recorded light by the PMTs for the effect of light attenuation in water. It is also important to determine if an event is incoming or contained. The vertex reconstruction resolution and precision must be significantly less than one meter for all event types. The vertex resolution for single muons or electrons should be better than 30 cm.
- Timing:
-
The absolute time of the interaction must be reconstructed with resolution and precision significantly less than the 10 s pulse from the accelerator. Based on the position requirement the relative timing resolution from vertex fitting is expected to be better than 1 ns. The absolute time of the event is required to be recorded with an accuracy of less than 10 ns.
- Direction:
-
The angular resolution of electrons and muons will range from to at 1 sigma over the energy range of 100 MeV to several GeV.
- Energy:
-
The energy resolution is driven largely by the number of PMTs but, as stated above, vertex resolution enters into energy resolution through corrections for light attenuation in water. The measured energies of single muons and single electrons will have a precision better than .
- Pattern Recognition:
-
The reconstruction must be able to determine with 90% efficiency that an event has two rings when there are two trajectories above Cherenkov threshold from a common vertex and the angle between them is greater than 20∘ .
- Particle Separation:
-
Separation between single-ring, electromagnetic showers and track-like events ( and charged ) should be achieved with 90% efficiency and a factor of 100 background rejection at 1 GeV.
1.3.6 Conventional Facilities at the Far Site
The main civil construction required for the WCD is the excavation of the large cavity that will house the vessel and water-tight liner on the inside of the cavity. This excavation must remain stable for considerably longer than thirty years. The civil construction is discussed in more detail in Appendix A. Although this excavation is extremely large, the largest at these depths, it does not present extraordinary challenges. Studies of the rock characteristics have been going on for several years. The DUSEL Project engineering team, together with world-renowned mining engineers, the Large Cavity Advisory Board, concluded that this excavation is feasible and represents neither unusual risks nor unusual technical challenges.
The civil construction also involves several access and service tunnels of fairly conventional design. One of these will house the water purification system and will require water piping to the surface to bring in fresh water and provide for transfer of the detector fill water to the surface in case the detector needs to be emptied. The piping required in the shaft for these purposes is small compared to that previously used by the Homestake Mining Company and so presents no unusual demands. In addition, we plan to maintain the detector fill water at 13∘C, about 17∘C below ambient, and will have to operate a cooling facility as part of the water purification system. The cooling power required is modest, 100–200 kW and again does not involve any unusual requirements.
The civil construction will require large quantities of various construction materials. Since the underground environment has limited staging and storage space, careful planning will be required in the sequencing of transport of materials underground and in the availability of the hoists.
In summary, the civil construction does not present any unusual challenges, but will require careful evaluation, careful attention to details and carefully supervised execution.
2 Water Containment System (WBS 1.4.2)
This chapter describes a reference design for the WCD Water Containment System. This system will need to contain roughly 264 kTon of purified water in a single volume at 4850L, withstand the pressure of the water, support the Photon Detection System111The Photon Detection System is described in Chapter 3. inside the water volume.
The scope of the Water Containment System includes these four principal components:
-
1.
A vessel-and-liner system that contains the water, called the Water Cherenkov Vessel (WCV)
-
2.
A deck on top of the vessel that closes the detector and houses the electronics and services
-
3.
A support system for the photon detectors and their cables
-
4.
Ancillary equipment, including in-vessel water distribution, water-collection and magnetic-compensation systems
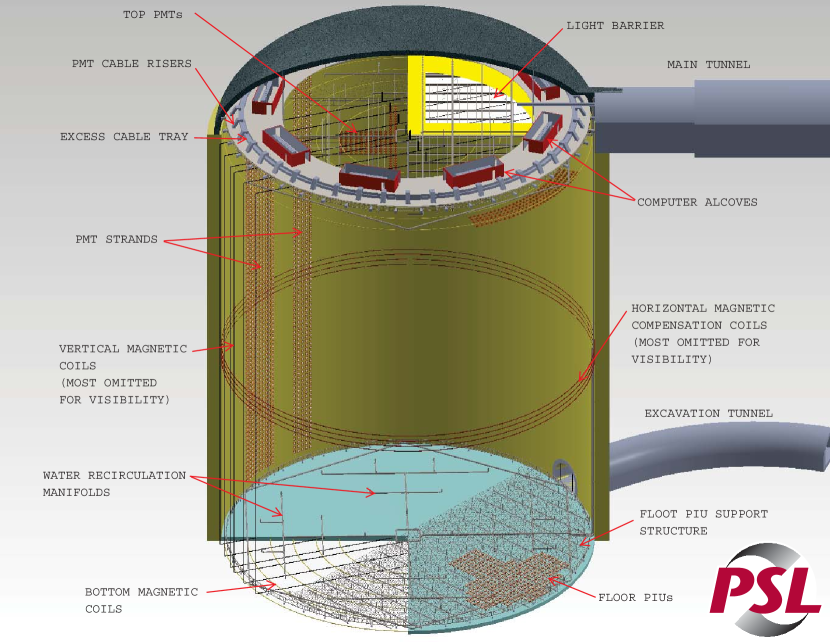
Figure 2–1 shows a simplified, conceptual model of the water containment system, consistent with the cavity design. The model is fully 3-dimensional.
2.1 Water Containment Reference Design Overview
We have selected a vertical, right-cylinder geometry for the detector based on geotechnical studies. We have defined a series of cylindrical volumes within the containment vessel representing regions of interest, as follows.
2.1.1 Main Detector Configuration (WBS 1.4.2.1)
-
The fiducial volume, defined for oscillation-physics studies, is 200 kTon (as discussed in Section 1.3.5.3).
-
The PMT apex region is the cylindrical surface defined by the apex of the glass domes of the installed photon detection devices, called PMTs. This cylinder has engineering significance in positioning of PMTs.
-
The sensitive volume extends to the virtual surface touching the equators (maximum-diameter circumference) of the installed PMTs, defining the volume of PMT light collection. A thin, opaque sheet will be placed at the boundary of this volume.
-
The water volume is the total water in the detector.
-
The vessel volume is the total volume enclosed by the liner and the enclosure at 4850L.
| Region | Description | Diameter (m) | Height (m) | Volume (m3) |
|---|---|---|---|---|
| Fiducial | Detector fiducial volume | 59.3 | 72.6 | 200,510 |
| PMT Apex | Volume to apex of PMTs | 63.1 | 76.4 | 238,530 |
| Sensitive | Volume to equator of PMTs | 63.3 | 76.6 | 241,060 |
| Water | Water volume | 65.0 | 79.5 | 263,800 |
| Vessel | Vessel volume | 65.0 | 80.3 | 266,460 |
We have designed a freeboard (vertical distance within which the water height is allowed to vary) of 0.2 m above the water level to ensure that water does not overflow the vessel, and an additional 0.6 m to accommodate structural components of the deck. This provides 0.6 to 0.8 m of head space above the water which we seal and fill with radon-free gas regulated to remain at a pressure slightly above local air pressure. The water pressure at the bottom of the vessel will be 786 kPa (114 psi) (gauge pressure).
A dome area over the detector houses the main deck of the detector and most equipment for detector operations. It is a semi-ellipsoid with a circular base, and has a major (horizontal) axis of 65 m and and a minor (vertical) axis of 32 m. (Dome height above detector is 16 m)
Figure 2–2 shows the overall size and approximate configuration of the vessel and deck inside the large cavity. The inner-most region is the fiducial volume.
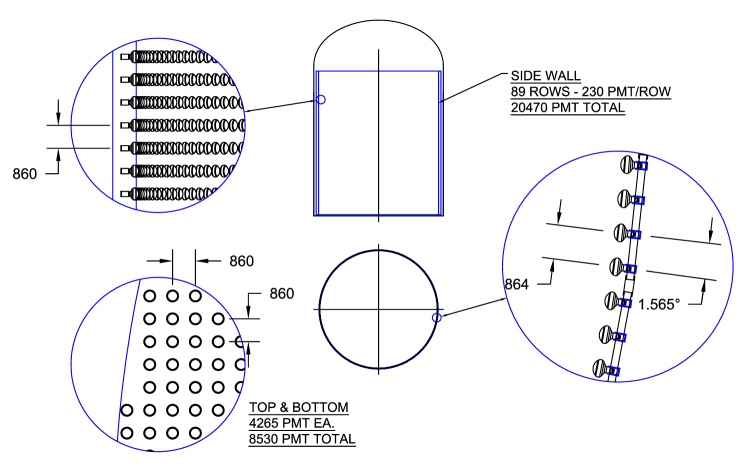
The reference design must allow for 29,000 PMTs placed around the “apex” cylindrical perimeter and top and bottom of the vessel. The approximate distribution is shown in Table 2–2. Figure 2–3 shows the approximate layout of the PMTs on the perimeter wall, floor and deck. The spacing between adjacent PMTs is approximately 0.9 m.
| Top | 4,265 |
|---|---|
| Bottom | 4,265 |
| Cylinder perimeter | 20,470 |
| Total | 29,000 |
2.1.2 Top Veto Region (WBS 1.4.2.10)
The baseline design of the water Cherenkov detector (WCD) for LBNE includes a “top veto” system to tag cosmic muons entering the fiducial volume of the WCD, a potential background to atmospheric neutrino measurements. A system is under design consisting of an array of horizontally oriented PMTs mounted within the PMT support framework in the approximately 1.8 m space between the deck and the light barrier (Figure 2–4).

A cosmic muon is tagged when one or more of the veto PMTs detects the Cherenkov light it generates when it passes through the “top veto region” of water depth. The depth of this region will be optimized for the muon to have a sufficiently long path length for the cosmic muon to be detected with a specified efficiency.
The number and spacing of the PMTs in the top veto system have not been fully determined. Previous studies and simulations[17, 18] suggest that a PMT spacing of 4 m or less provides complete geometrical coverage for cosmic muons entering the fiducial volume from the top. The present design of the PMT framework beneath the deck indicates a spacing of 86 cm for the downward-facing PMTs. This suggests a preliminary design of one veto PMT per 44 unit of downward-facing PMTs for a total of approximately 200 top veto PMTs. The baseline design for the top veto uses 12-inch PMTs that are identical to the PMTs used throughout the detector. To increase reflectivity, support structures and services in the veto region will likely be covered with reflective material such as Tyvek®. A timing calibration system will also be required, perhaps consisting of strings of LEDs or laser light delivered by optical fibers.
The results of trade studies, simulations, and tests performed on elements of the top veto system will inform the final design. Cost savings might be achieved if a less expensive PMT is used or if the PMTs used in the veto system were recycled from another experiment such as MiniBooNE. The re-used PMTs would all have to be tested and potted to be waterproof, which would require significant development cost.
2.2 Vessel-Cavern Interface
The excavation of the cavity will be studied and optimized, as described in Volume 6, in parallel with the water-vessel design process to ensure full compatibility of design between the two. A close working relationship between the vessel and conventional facilities groups has been established and will be essential in optimizing cost and schedule for the overall far-site development.
The separation of responsibility between the cavern and the vessel occurs at the neat line (see Figure 2–2), defined as a virtual surface, ideally right along the wall-vessel interface, but due to surface unevenness, slightly inward toward the open space such that no point of the cavern rock or ground stabilization system crosses it.
The diameter of the neat line is 65.38 m. The inner diameter of the vessel is 65 m. The height of the cylindrical surface defined by the neat line is 81.3 m, the difference between 4850L and 5117L. This height allows for the 80.3 m vessel inside-height plus 1 m allowance for structural, waterproofing, and other components of the vessel floor.
The circular base of the dome sits directly on top of the neat-line virtual cylinder and is shown in Figure 2–2. The dome forms the upper part of the neat-line virtual surface.
The ground-water and vessel leak-water collection systems are also part of the of vessel and cavern interface. These are explained in later sections.
2.3 Vessel and Liner (WBS 1.4.2.2)
The vessel-and-liner consists of two main components integrated into one system:
-
1.
Vessel: defined as all components required to contain the water and collect the leakage
-
2.
Liner: defined as the water-proofing components required to seal the water within the vessel.
This system interfaces with the PMTs and water on the inside and to the cavern on the outside. The top of this system interfaces with the deck.
2.3.1 Design Considerations
The vessel wall and floor, as well as liner, are very challenging aspects of the overall vessel design. They must withstand the hydrostatic pressure of the water with minimal structural impact. They must also allow for groundwater and leak water collection without pressure buildup on the outside of the liner. Long-term stability of the cavern rock walls is critical to the longevity of the vessel walls.
The liner layer will be applied over the entire vessel wall and floor and prevents purified water leakage through the vessel. The liner just rests on the floor, but it requires attachment to the wall. The liner thickness depends on the material and on the manufacturing and joining techniques.
The wall and floor will have structural anchors, appropriately sealed to the liner, for attachment of the detector components.
Four factors determine the requirements for the liner layer:
-
Effects of liner on ultra-pure water.
-
Long-term effects of ultra-pure water on the liner.
-
Long-term strength and durability.
-
Leak rate within collection and top-off capacities.
2.3.2 Vessel and Liner Conceptual Design Contract
The conceptual design of vessel and liner have been contracted to a consortium of firms with appropriate expertise and experience in the field of underground geotechnical engineering and construction. Suitability of contractors was based on the following qualifications:
-
Demonstrated civil engineering expertise and large underground construction experience
-
A successful record of accuracy in previous scheduling and estimating work with similar projects
-
Professional engineers on staff for review and approval of work
-
Experience working with U.S. Department of Energy (DOE), or other government agencies.
The firms provided qualified personnel to evaluate civil engineering and constructibility, as well as to estimate the cost and schedule of vessel and liner construction.
CNA Consulting Engineers, a firm with both NSF and DOE experience, was chosen as the primary consultant. This firm will be responsible for technical coordination within the design team, coordination with LBNE, coordination with Sanford Laboratory cavity designers, sealing and lining of rock excavations, sealing and lining of free-standing water containment vessel, WBS development and maintenance, concept evaluation criteria, constructibility review, and report preparation.
Hatch Mott MacDonald, a firm with underground science experience was a subcontractor and for risk assessment, construction cost, construction schedule, material handling, and constructibility.
Simpson Gumpertz & Heger, a subcontractor with DOE experience was chosen to handle structural analysis, seismic analysis, sloshing, sealing and lining.
2.3.3 Design Methodology
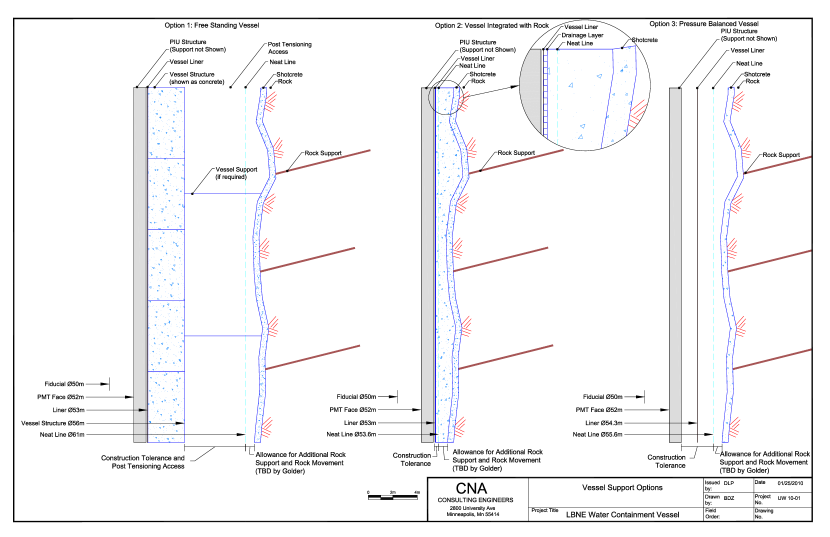
The design methodology involved evaluation of three concepts:
-
1.
Vessel wall not supported on the rock wall In this method the vessel wall is independent from the rock wall and has the necessary strength to resist the internal water pressure. It also has sufficient stability and rigidity to stand alone with or without internal water pressure. The motivation for this option is to decouple the rock wall from the vessel wall in order that possible instability of the rock wall does not impact the vessel wall.
-
2.
Vessel wall supported directly on the rock wall The motivation for this choice is to take full advantage of the rock around the vessel to resist the internal pressure of the water. This could result in the most efficient design in terms of cost and schedule. The stability of the rock wall is critical to and directly influences the design of the vessel wall.
-
3.
Vessel wall pressure balanced by water In this method the internal water pressure is balanced by external water pressure. The motivation for this option is to reduce the required strength of the vessel wall and thereby optimize cost and schedule.
These three options are shown schematically in Figure 2–5.
Construction schedule for the vessel is one of the most critical aspects of the overall project schedule. There are two basic approaches for vessel construction:
-
1.
The entire cavern is excavated before the vessel construction starts.
-
2.
The vessel construction is concurrent, in part or in whole, with cavern excavation.
Each of the construction methods has been studied within this context. Reference and alternate designs have been chosen and a brief summary of the reference design is included here. A conceptual design report has been submitted by the consortium of firms listed in Section 2.3.2 and included as a reference for this document[19].
2.3.4 Reference Design for Vessel
The reference design is a vessel supported directly on the rock wall as shown in Figure 2–6.

The vessel structure takes full advantage of the stabilized rock wall. This is for two main reasons:
-
1.
Geotechnical studies indicate that the rock wall is very stable and an additional concrete vessel is not required.
-
2.
Minimizing cost is a critical consideration and with this option the cost of a separate vessel is avoided.
The sequence of the construction is planned as follows:
-
1.
As the cavern is excavated the ground water collection system, rock stabilization with steel reinforcing mesh and first layer of shotcrete are installed. The ground water collection layer consists of drainage strips placed as needed with collection pipes to channel the water to the collection system at the bottom of the cavern.
-
2.
Magnetic compensation coils are installed on the shotcrete surface. Connection and junction boxes are also installed and tested.
-
3.
Another layer of shotcrete is installed to cover the magnetic compensation coils and junction boxes and to smooth out the surface for installation of the liner.
-
4.
A detector leak-water collection layer is installed on the second shotcrete layer. This collection layer is continuous under the entire liner on the wall and on the floor.
-
5.
A final liner layer is installed and leak tested. Attachments and anchors are also installed and leak tested at this time.
The precise division of responsibilities between cavern excavation and liner construction, and the scope of work for each, will be determined during later phases in the project.
2.3.5 Reference Design for Liner
The liner will provide the sealing layer between the water and the vessel. In addition, the liner has a layer for collection of leak water from within the detector.
The liner is the primary water containment layer and it must limit leakage out of the vessel while preventing impurities from the vessel to enter the water. In addition, it must be resistant to long-term damage from the ultra-pure water. Three general categories of liner material have been evaluated.
-
1.
Polymer Sheet Liners These are flexible sheet membranes commonly used as a waterproofing, roofing, or tank-liner material. Typical membrane thickness is about 2 mm or less. Polymer sheets will be heat-welded or bonded in the vessel. This is the baseline choice for the liner material.
-
2.
Cold Fluid-Applied Membranes These are usually one- or two-component liquids that cure after application. The thickness varies depending on the particular membrane system. Typical uses are industrial coatings for corrosion protection, below-grade structure waterproofing, potable and wastewater structures, chemical containment and cooling towers.
-
3.
Stainless Steel This is an appropriate liner material and was used at Super–Kamiokande. Type 304 stainless steel sheet is an alternate material in the current concept and cost estimates. Thickness is 3 mm (1/8 in). The sheets will be welded in the vessel.
Candidate materials from manufacturers are being tested with ultrapure water for the appropriate length of time to ensure no contamination of the water or damage to the material. Actual samples from manufacturers are tested because the exact formulation of the liner material and reinforcing areas are critical to suitability for long-term use.
The preferred material for the conceptual design is a polymeric sheet welded in situ. The exact material has not been chosen yet. However, several commonly used polyethylene sheet samples have performed well up to now.
Several considerations are important in selection of the liner grade and thickness:
-
Final unevenness and finish of the shotcrete surface. It is our estimation at this time that a unevenness of about 1 unit in radial direction per 10–15 units of circumferential or vertical dimension on the wall will be appropriate.
-
Size and weight of raw material rolls with respect to limitations of transport into the cavern and the practical limits of sheet sizes that can be lifted and unrolled on the wall.
-
Weldability, leak checking and overall QA in situ on horizontal and vertical surfaces.
-
Attachment to the wall surface with respect to load-carrying capacity of the liner and number of attachment points per unit area.
Different grades and thickness of these sheets are available. The thickness we are considering at this time is about 1.5 mm. The grade and additives, if any, will be determined in collaboration with the liner designers, manufacturers and installers.
2.3.6 Mounting Points on Vessel
Many of the subsystems within the vessel require mounting points on the vessel. The reference design for penetrations calls for studs to be permanently installed in the vessel. They may be installed at the time of vessel placement or after vessel construction. The studs will need to be sealed. The reference design calls for a boot, made from the same material as the liner, that will be heat-sealed to the liner and clamped to the stud. This is shown schematically in Figure 2–7.
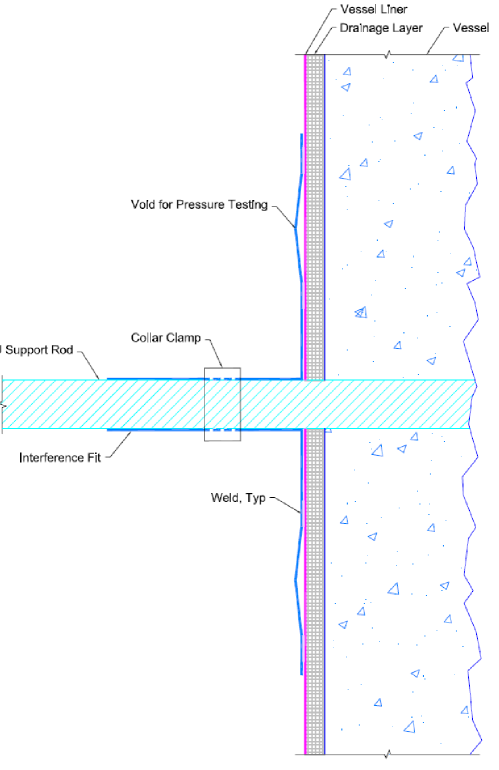
An alternate method with a threaded insert is also under study. This is particularly suitable to temporary anchors, such as those for installation equipment, which can be covered and sealed to the liner.
2.3.7 Drainage Layer under Liner
It is anticipated that leaks will exist in the liner and water will migrate outside the liner. Leaks may result from several sources:
-
1.
Imperfections in the liner material due to manufacturing
-
2.
Defects in the welds and other joints in the liner
-
3.
Damage caused during liner installation
-
4.
Leak due to penetrations required for mounting of inner detector components
-
5.
Damage caused during PIU installation
-
6.
Deterioration over time
There will be a leak collection system directly under the liner to collect and channel the leak water. There are two concepts under study at this time.
2.3.7.1 Unrestricted Flow Concept
In this concept a material that provides minimal resistance to flow is installed under the liner. Such material is typically fabricated in the shape of egg crates and provides channels for water to flow freely. They are used routinely in construction for this purpose. In this concept, leak water flows freely to a collection manifold at the bottom of the vessel. The main advantage of this system is that it allows good leak water collection and prevents external pressure buildup on the liner in the event the vessel is emptied.
2.3.7.2 Restricted Flow Concept
In this concept the polymeric liner is installed on a low-permeability layer that will help reduce flow through the leak as compared to the free flowing concept. The low-permeability layer may be any of several types used in the industry known as geosynthetic clay liners. They typically are a composite of geosynthetic materials and a bentonite layer. The advantage of this method is that it can help reduce flow through a defect by several orders of magnitude. The main disadvantage is that it does not allow for free collection of leak water which may have ramifications in the event gadolinium is used in the detector. However, since it has the potential of minimizing the leaks, it may be the better overall solution.
2.3.8 Liner Material Testing
As part of the conceptual design phase, material testing for liner began in early 2010. The testing is carried out at Brookhaven National Laboratory. Two classes of material have been tested and long term tests are continuing. The first class of materials are polymeric liners in sheet form. The second class are coatings applied to a substrate. We chose 316 stainless steel as a substrate. These tests are for compatibility of liner material with ultra-pure water only. Additional testing of material will be performed after CD-1.
A supply of 1 inch 3 inch coupons were fabricated for each sample and cleaned. CNA Consulting Engineers had sent an initial list of candidate materials and corresponding manufacturer contacts. From those contacts, we obtained samples of sheet polymers from Cooley Group and Carlisle Coatings, and spray-on products (applied to our SS coupons) from Sherwin Williams and C.I.M. Industries. Four samples of sheet polymers and four sprayed-on materials that were applied by the manufacturer to the SS coupons were sent to BNL. Additionally, CNA solicited six samples of various high density and linear low density polyethylene (HDPE & LLDPE, respectively) from GSE Lining Technology, and another sheet sample of pure HDPE from Green Plastics. They were also forwarded to BNL. These latter seven polyethylene materials all performed well in the testing, better than any of the first eight materials. One more sample of a spray-on polyurea coating (from Spray On Plastics, LTD) that had been used in SNO was also sent to BNL.
All tests so far have shown that various grades of polyethylene perform well. These materials are our baseline choice at this time. Exact grade, manufacturer and thickness has not been chosen. Material will be chosen after final testing and qualification is carried out by LBNE on materials recommended by the liner contractor.
2.3.9 Leak Rate from within the Vessel
The WCD leak rate has been estimated in several studies. Each study was done at a different time with different assumptions. A summary and comparison are given below.
2.3.9.1 CNA Estimates
CNA Consulting Engineers, Inc. made an estimate of the leak rate based on one defect per acre of liner surface at two different water head heights (3 and 30 m) for three different defect sizes (0.1, 2 and 11 mm). This estimate was based on the free flowing drainage concept as described earlier.
One defect per acre is an assumption of defects that may not be detected. The size of the defect is hard to estimate. The leak rate through a 0.1 mm defect is very small and can be ignored. An 11 mm defect is quite large and will most likely be detected and repaired.
The detector wetted surface is about 5 acres. Therefore, we can assume a total of five defects may go undetected. If we further assume that all five defects are 2 mm and are at 30 m depth, we obtain a total leak rate of about 19 m3 per day. Detector cross sectional areas is about 3,300 m2. Therefore, water level will lower by approximately 1 cm per day. This is quite small and can be compensated by the filling system quite easily.
In contrast if all defects are about 11 mm and at 30 m depth, the leak rate will be about 583 m3 per day, and the level drop will be about 18 cm per day. This is a large leak and would require nearly constant refilling. Defect diameters of this size will need to be repaired.
2.3.9.2 Benson Estimates
Craig Benson of University of Wisconsin-Madison also made an estimate. This estimate was based on 5 defects per hectare and was done for a 100 kTon detector. Two defect sizes of 1 mm and 10 mm were considered. The estimates were 8 and 700 m3 per day respectively. As with the CNA estimate, this estimate is based on the free flowing drainage concept.
To estimate for 200 kTon, we scale the results by square root of height ratio and wetted surface ratio, which take into account increases in pressure and number of defects, we obtain 14 and 1352 m3 per day respectively for defects of 1 mm and 10 mm.
The total wetted surface area of the 200 kTon liner is about 20000 m2 (2 hectares). So the total number of defects is 10 instead of 5 in the CNA estimate.
2.3.9.3 Golder Estimates
Golder Associates reviewed the leak rate estimates by CNA and Benson, which were both done for a 100 kTon. Golder also estimated the leak rate for 200 kTon using the same method as Benson with 10 total defect, 8 near the mid-height of wall and 2 at the bottom. This is for a good quality assurance of the liner with 2 defects per acre of liner surface. Results were 30 and 2900 m3 per day for defects of 1 mm and 10 mm respectively.
More significantly, Golder estimated that the leakage rate will be reduced by a factor of 10-4 to 10-5 if restricted flow concept is used by placing a geosynthetic clay liner directly behind the geomembrane liner. According to estimate the leak rate would be negligible. All Golder liner designs use this design.
2.3.9.4 Summary and Discussion
The leak rate estimates from studies as explained above are shown in Table 2–3.
| No. of | Defect dia | Defect depth | Leakage | Level drop | Drainage type | |
|---|---|---|---|---|---|---|
| defects | (mm) | (m) | (m3/day) | (m/day) | ||
| CNA | 5 | 2 | all at 30 | 19 | 0.01 | Free flow |
| CNA | 5 | 11.3 | all at 30 | 583 | 0.18 | Free flow |
| Benson | 10 | 1 | 2 at 80, 8 at 40 | 14 | 0.00 | Free flow |
| Benson | 10 | 10 | 2 at 80, 8 at 40 | 1352 | 0.41 | Free flow |
| Golder | 10 | 1 | 2 at 80, 8 at 40 | 30 | 0.01 | Free flow |
| Golder | 10 | 10 | 2 at 80, 8 at 40 | 2900 | 0.87 | Free flow |
| Golder | 10 | 1 | 2 at 80, 8 at 40 | 0.003 | 0.00 | Restricted flow |
| Golder | 10 | 10 | 2 at 80, 8 at 40 | 0.29 | 0.00 | Restricted flow |
As the above studies were done with different assumptions of quantities and sizes of leaks, a direct comparison is not evident. However, there is generally good agreement as can be expected from such estimates.
A separate estimate of leak rates has been performed by LBNE that is based on method used by Benson. The results are listed in Table 2–4.
| No. of | Defect dia | Defect depth | Leakage | Level drop | Drainage type | |
|---|---|---|---|---|---|---|
| defects | (mm) | (m) | (m3/day) | (m/day) | ||
| Median Rate | 6 | 1 | 5 at 40, 1 at 80 | 7.4 | 0.002 | Free flow |
| Median Rate | 6 | 2 | 5 at 40, 1 at 80 | 29.8 | 0.009 | Free flow |
| Maximum Rate | 12 | 1 | all at bottom | 19.7 | 0.006 | Free flow |
| Maximum Rate | 12 | 2 | all at bottom | 78.7 | 0.024 | Free flow |
| Best Estimate | 12 | 1 | Distributed | 14.1 | 0.004 | Free flow |
| Best Estimate | 12 | 2 | Distributed | 56.3 | 0.017 | Free flow |
| Best Estimate | 12 | 1 | Distributed | 0.001 | 0.000 | Restricted flow |
| Best Estimate | 12 | 2 | Distributed | 0.006 | 0.000 | Restricted flow |
The number of defects have been assumed at 2 per acre. Rounding up, this results in about 12 total defects. A median value will be if there are five defects on the wall at mid-height and one on the floor. Maximum leak rate will result if all defects are at the base or near the bottom. A reasonable assumption is to have 12 defects with two on the floor and 10 distributed on the wall.
It is clear that number and size of defects are critical in the leak rate. A total of 12 defects is achievable with very good quality control of liner. Defect sizes of 1 or 2 mm are certainly possible. However, a large defect of about 10 mm must be detected and repaired. Therefore, leakage rates of about 14 to 56 m3 per day are possible. These rates result in about 4 to 17 mm drop in water level per day.
An essentially zero-leak system may be possible using the restricted flow concept. This concept, and the free flowing concept, need further development and testing. In both concepts penetrations in the liner are the main sources of possible leaks. Development and testing of penetrations will be carried out during the preliminary design phase.
The closest detector to WCD is the Super–Kamiokande detector. However, Super–Kamiokande has a cast-in-place concrete vessel and a welded stainless-steel liner. Therefore, the details of the construction are quite different than the WCD reference design. The LBNE liner wetted surface area is approximately three times that of the Super–Kamiokande liner and the height is about twice. Super–Kamiokande has reported a leak rate of 2 m3/day. Scaling by the wetted surface area and height difference, an estimated leak rate of 8.5 m3/day for WCD is obtained. This is near the lowest end of all LBNE estimates. The other major difference is that Super–Kamiokande essentially has a pressure balanced wall, as ground water is nearly as high as the detector water. This limits the leak rate. LBNE will be in a dry environment.
2.3.10 Wall and Floor Interface
The floor and wall interface is a very critical area. The lower truss assembly which provides the anchor point for the wall PIUs is at this location. In addition, water pumping wells and leak collection systems are also concentrated in this area.
Figure 2–8 shows the schematic of this area.

There are several considerations that have been identified at this time:
-
The placement of the magnetic compensation coils below the floor slab must be done before the slab is poured. The wall coils are installed at a later date. A series of junction boxes will be required at this location,
-
Two separate drainage manifolds are shown for the ground water and detector leak water collection. They may be combined at the sump.
-
The lower truss assembly section is shown with approximate location tolerances required. The tolerances will be achieved via adjustment in the mounting system and survey.
-
The lower truss assembly must resist the entire buoyancy force of all wall PMTs. This will result in large upward forces distributed along the perimeter of the floor slab. This may require special rock bolts through the slab and into the cavern floor. These are not shown.
-
The wall PMTs are very close to the liner wall. This radial space needs to accommodate the water distribution system and other infrastructure. This is under study.
2.4 Deck Assembly (WBS 1.4.2.3)
The deck assembly forms the roof of the vessel at or near 4850L. It provides the separation between the water volume of the detector and the habitable space of the cavity dome in which a variety of activities will need to be supported. It will include provisions for equipment both below and above the deck surface. The deck assembly is divided into three WBS categories.
-
1.
The deck structure itself
-
2.
The volume for the gas blanket and its components over the water volume
-
3.
The access ports for calibration, diagnostics, and personnel used during detector construction and operation.
2.4.1 Design Considerations
The deck assembly must provide a human-habitable surface above the detector at 4850L able to support or provide the following:
-
Structures to which the PMT assemblies and cables located in the water region can securely attach. This also includes any veto PMTs
-
Cable feed throughs and storage for all PMTs in the vessel
-
All electronics racks on the deck surfaces, including any enclosures, environmental-control and monitoring equipment
-
Support for the ultra-pure-water distribution manifolds
-
A sealed boundary between the headspace over the water region and the ambient air in the cavity dome
-
Support for gas-blanket piping and associated equipment
-
A light boundary between the vessel water region and the cavity dome
-
An array of ports into the vessel region for calibration
-
Access to the vessel region for maintenance and repair
-
Support for under-deck magnetic compensation coils and associated equipment
-
Support for wall PIU support cables
-
Support for material handling and personnel access equipment under the balcony.
The design of the deck assembly must take into consideration all static and line load conditions during both detector construction and operation. Since there are more than 4000 PMTs mounted to the bottom side of the deck assembly, deflections must be limited to reduce movement of the PMTs after their final positional survey is taken. The design must conform to all appropriate codes and regulations for construction, safety, seismic activity, and occupancy at Sanford Laboratory. The appropriate loading and occupancy categories for this structure will be identified in order to conform to building standards and codes. All materials must be tested and approved for use in and around ultra-pure water. Components used in construction must be sized for efficient transport from the surface to 4850L.
2.4.2 Description
The deck assembly will consist of a raised annular balcony section (level 2) and inner deck section (level 1). This allows the two sections to be designed for different loading values, and for staged construction. The final design will be optimized in accordance with other detector construction and installation activities, costs and schedules. A schematic of the deck configuration is shown in Figure 2–9.
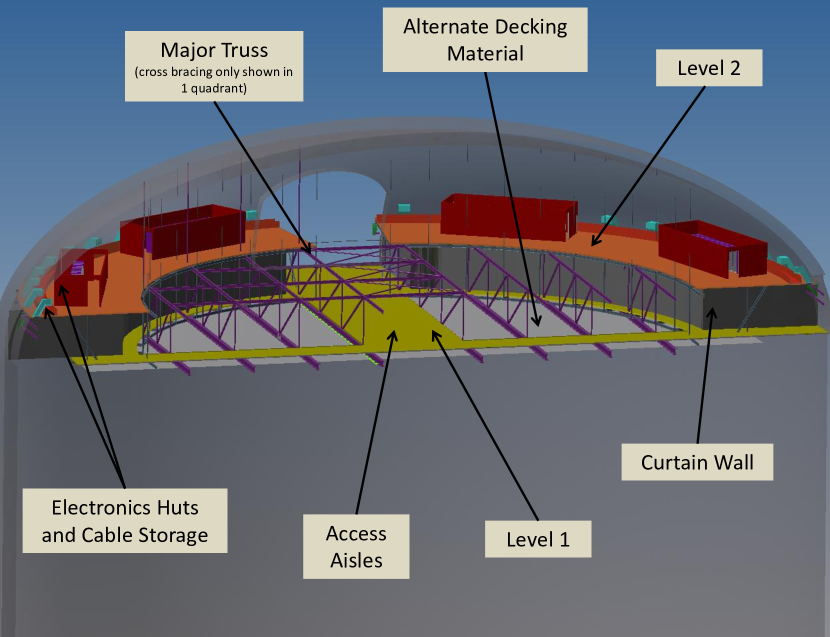
The cavity rock will support level 1 and the live loads on it. It is unclear at this point how much of the overhead dome space will be unobstructed. The current baseline calls for an overhead crane, which will be used for deck construction and potentially for cavity excavation. This crane will be supported from the native rock above. Any deck support needed will be carefully integrated with the overhead crane supports.
We are assuming that we will be able to interface with native rock in the dome in multiple locations. Level 2 will be supported in two ways. At the outer diameter, it will be supported using 46 corbels built into the cavity wall that are equally spaced around the circumference. Near the inner diameter of level 2, it will be supported by rigid members that are attached to the cavity dome. These will be located at a diameter of approximately 45 m. The exact quantity of supports will be determined after all of the final loads are identified. These members may pass through level 2 and also support level 1, but this is a detail that will be evaluated in the next design stage. Level 2 may be designed with a higher loading capacity than level 1 to allow for the electronics, electronic huts, and associated cable loads.
Level 1 will be constructed from major truss elements connected to the cavity rock for support. We expect to have eight to 10 major trusses above the surface parallel to the main aisle and the utility drift. It has been estimated that these trusses will have a height of 4 m. These major trusses will be supported, at a minimum, at each end to the native rock above. The exact locations and load ratings will be determined based on final truss spacing, stresses in the native rock of the dome, and the combined live and dead loads of the structure. Level 1 will be designed to have sufficient load capacity for normal activities according to the minimum allowable live loads. We are assuming that these support points in the cavity rock can support a minimum of 50 tons at each connection point, but we are not limiting the design to this. There will also be minor trusses under these major trusses from which the working surface will be constructed and supported. We expect the minor truss work to be approximately 1–1.5 m in height and run perpendicular to the major trusses above. In our reference design the working surface will be welded stainless steel, however we are evaluating other materials, including precast concrete slabs.
Personnel and equipment can travel around the top of the detector on the various working surfaces. Underneath these surfaces we will install the gas- and light-sealing layer. Decoupling these layers allows for use of more cost effective materials in the working surface since they would not need to be compatible with ultra-pure water. It also allows us to reduce the area — and thus the cost — of the working surface. The sealing layer may be constructed of thin stainless steel, textile fabric, or polymeric membrane similar to that used on the rock surface for the main vessel liner. We plan to construct small prototypes to test the feasibility of all of the various layers and structure being considered.
A PIU-mounting structure, similar in form to that planned for the floor PIUs, will be installed under the minor trusses. This is described in Section 2.7.1.2.
We are evaluating two construction methods for the deck assembly, (1) building the structures at height during the cavity excavation and (2) constructing level 2 at height during the excavation followed by construction of level 1 on the floor of the cavity after excavation is complete and then raising to 4850L. The methods would have different impacts on the overall excavation and installation schedule. We will determine which method to use in coordination with the conventional facilities group and Sanford Laboratory personnel after all the factors are considered.
2.4.3 Gas Blanket (WBS 1.4.2.3.2)
The radioactivity from naturally occurring Radon (Rn) in the mine contributes too much to the background for certain types of physics that will be performed at LBNE. background at a minimum. We wish to reduce the current levels of Rn 250–300 Bq/m3 to 2–10 mBq/m3. It is unrealistic to try and do this for the entire dome area of the cavity. However, it is possible to do for the water region below the deck surface by introducing a blanket of Rn-reduced gas.
The gas blanket is expected to be approximately 0.6 to 0.8 m in thickness, with a volume of approximately 2300 m3. The precise volume will be determined after the deck design and the water level variation are determined. To ensure that the proper Rn level is maintained, we expect that we will need to continuously pump between 150 and 300 m3/hr of Rn-reduced gas into this volume. In order to reduce contamination of this sealed volume from the dome air, we plan to keep the head space at a slight overpressure. At Super–Kamiokande, this overpressure is approximately 30 mm of water. Equipment will be needed to both monitor this overpressure for safety reasons and to monitor the Rn levels in the head space to ensure proper functioning of the system.
We are evaluating both Rn-free air and high-quality nitrogen for use as the gas in the head space. Commercial equipment is available to produce both of these in the quantities desired and the installation and implementation costs are essentially equal for the two systems. The potential risks involved with each are also being studied. Nitrogen may be better in reducing the potential for bacterial growth in the water but it carries an asphyxiation hazard. Rn-free air has no asphyxiation hazard, but will not discourage bacterial growth in the water as effectively.
All penetrations through the sealing layer described in Section 2.4.2 will need to have seals and gaskets that minimize leaks from the gas blanket. The gas will be piped into the head space around the perimeter of the cavity and will be vented near the center. This is to promote the proper exchange of gas in the volume.
2.4.4 Access for Equipment and Personnel (WBS 1.4.2.3.4)
During detector operations and maintenance periods, it will be necessary to insert calibration and other equipment into the detector volume. The working and sealing surfaces of the deck assembly will therefore need to have ports that when closed are gas- and light-tight.
Preliminary layouts place these ports on the two main aisles of level 1 surface. We expect to need about 32 ports, although additional ones through level 2 may be required.
The port design consists of a flange through the working surface with a large pipe extending into the water volume to prevent contamination of the gas below. A removable lid will mate to the flange to seal the opening. We plan to recess the flange and lid to be level with the working surface as to not cause a safety hazard.
Personnel access into the volume will be much less frequent. For this purpose, access hatches are planned through the vertical curtain wall between level 1 and level 2. Special precautions will be needed, for instance proper PPE and other appropriate measures depending on the gas used in the gas blanket. The personnel access system is at a very conceptual level at this time. The requirements for personnel access and methods for it will be addressed at a later date.
2.5 Floor (WBS 1.4.2.4)
The containment-vessel floor consists of:
-
Structural components
-
Sealing layer or liner
-
Components specific to PMT mounting on the floor and access to them
-
Components specific to water collection and to interface to lower drift
The vessel floor design must be compatible with the geological conditions of the cavity floor and must withstand the total load of the water with an appropriate safety margin. It is presumed that the underlying load-bearing floor will be constructed from cast-in-place, reinforced concrete. The design and thickness of the floor must be such that the upper surface of the floor is stable to within the requirements of the detector.
A sealing layer, or liner, described in Section 2.3, will be applied over the floor. This floor will need to transfer the full compressive load of the water and the PMT system. However, since it will be fully supported on the rock floor, the required thickness of this layer is not great.
The floor will have anchor points for attachment of the floor PMT mounts. The anchors will be incorporated into the floor through the liner with appropriate seals. Other anchors for services and cables will also be incorporated.
It is possible that the vessel will be completely drained for a small number of maintenance periods during its lifetime. A shallow floor slope (0.4%) toward the perimeter will accommodate complete draining.
2.5.1 Lower Drift Interface
The lower drift interface is a set of components between the vessel floor and the lower drift of the cavity:
-
1.
A plug that will allow closure of the lower drift from vessel interior. The plug will consist of structural and sealing components.
-
2.
There may be a removable hatch to allow for access to interior of vessel.
Design of above components will start during the preliminary design phase. A conceptual drawing is shown in Figure A–29.
2.6 Water Distribution System (WBS 1.4.2.5)
The water distribution system is responsible for ensuring proper distribution of the flow in the vessel such that the temperature and quality specifications for the water in the vessel are met. The system design is based on several principles from the Super–Kamiokande design which successfully maintains water clarity at about 100 m. Scaling up appropriately, the total water recirculation flow through the WCD vessel will be 275 tons/hr (1200 gpm), resulting in one vessel volume change per six-week period.
The reference design for the water distribution system includes:
-
Piping manifolds to supply chilled, ultrapure water to the detector vessel
-
Piping manifolds to collect water for return to the water recirculation system located at 4850L
-
Piping to allow for water supply at the bottom of the vessel and return at the top or vice versa
-
Fill mode recirculation system piping to allow for recirculation during vessel fill
-
Drain system piping to allow for draining of the vessel
-
Piping manifolds with an adequate number and distribution of ports such that the specifications for water temperature and quality in the vessel are met
-
Manifold piping to interface with the water recirculation system at 4850L
-
Piping with leak tight penetration through the deck system at 4850L:
-
Lines for supply and return manifolds
-
Lines for Fill and Recirculation Modes and Draining Mode
-
-
Piping supports attached to the vessel wall, floor, and deck
-
Instrumentation for sampling and monitoring the water inside the vessel at various depths
The piping will need to be compatible with ultra-pure water and sized to be suitable to transfer 1200 gpm and maintain reasonable pressure drops.
The WCD vessel water volume is considered to have two zones, inner and outer, separated by the light barrier installed at the equator of the PMTs located around the sides and at the top and bottom of the vessel. The vessel inner zone, equivalent to the sensitive volume, extends from the center of the vessel out to the light barrier surface in 3D. The vessel outer zone is the annular shell plus the disk-shaped regions at the top and bottom, outside the inner zone.
Water-distribution manifolds will be installed to ensure that both the inner and outer zones meet the temperature and purity specifications. Modeled on the Super–Kamiokande system, a set of seven ports, designated A through G as shown in Figure 2–10, supplies water to the outer zone.
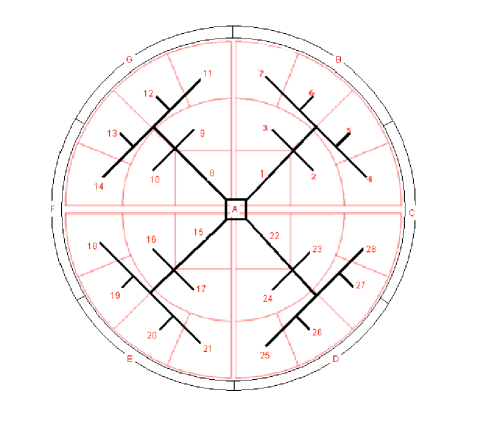
The flow through each of these ports is 2.4 tons/hr (11 gpm). The inner zone is supplied by 28 ports, numbered one through 28 in Figure 2–10, each of which supplies flow at 9.3 T/hr (40 gpm). The return manifold is a mirror image of the supply manifold, allowing for the top and bottom manifolds to function as the supply or return, as desired for operations.
Figure 2–11 illustrates the water-distribution piping in the vessel and the required penetrations.
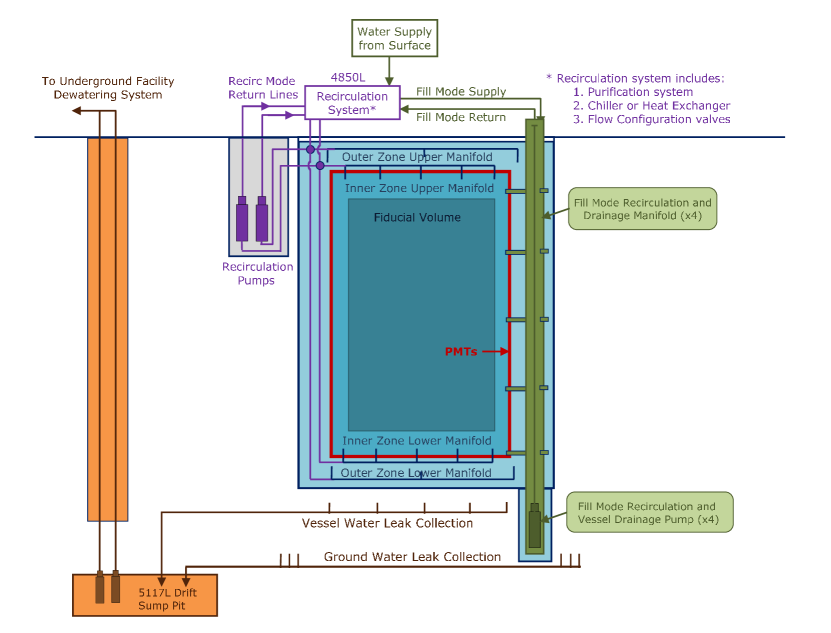
Piping that must penetrate through the deck structure include the supply and return pipes to the recirculation system and the piping associated with the fill and recirculation mode and the detector-drain mode. Piping for collection of the ground water and vessel-water leaks remains outside of the vessel.
2.6.1 Thermal Modeling of the Water Volume
The water in the fiducial volume must be maintained at a sufficiently low temperature to prevent the growth of biological contaminants and to reduce noise in the output of the PMTs. After an examination of available PMT test data, we have chosen the nominal set-point temperature to be 13∘C. The water volume will have heat load from a variety of sources, and thus will require a cooling mechanism and possibly insulation. The surrounding rock far from the water volume, at 33∘C, is one heat source. Heat generated within the PMTs, the Joule heating from the cables in the magnetic compensation system (see Section 2.8.1.3) and heat from the deck above the water volume are others. The heat loads from the various sources are summarized in Table 2–5.
| T = 13 C | Heat Load | Heat Load | Heat Load | Heat Load | Heat Load | Total Heat | Total Heat |
|---|---|---|---|---|---|---|---|
| Rock | Deck — No | Deck — | PMTs | Magnetic | Load w/o | Load w/ | |
| Insulation | Insulated | Coils | Insulation | Insulation | |||
| 200 kTon | 38.9 kW | 50.1 kW | 10.4 kW | 8.6 kW | 46.6 kW | 144.2 kW | 104.5 kW |
| Vessel |
Using available rock properties, an early finite-element simulation of heat conduction into the 200 kTon water vessel produced an estimated heat load value of 144 kW for the case with no thermal insulation at the deck. An isotherm plot of the 200 kTon design generated using the commercial code COMSOL is shown in Figure 2–12.
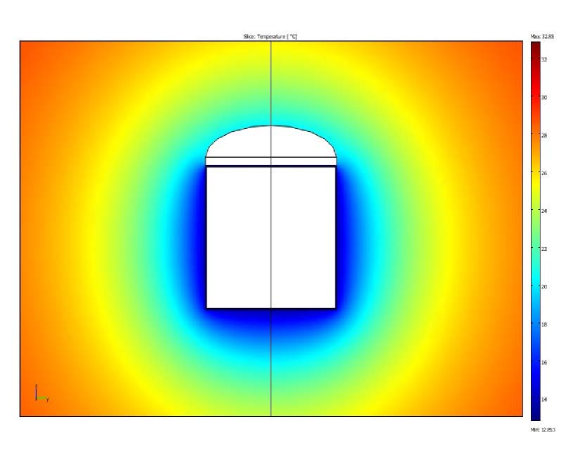
Introducing a layer of sprayed-foam thermal insulation on the deck surface will reduce total heat load by 25–30%. A smaller chiller will be required in the water-purification system, saving in both capital and operating expenses.
In addition to the baseline case of 13∘C, we performed calculations for water at 4∘C. The lower temperature may be needed to combat the growth of organisms or to allow more sensitive PMT measurements. At 4∘C, the heat load and the corresponding required chiller size increases by 35–40% (without insulation on the deck). However, the larger chiller will allow for faster response time to set points in temperature.
Because of the very large size of the water volume, thermal transients will be long at any temperature. We formulated a model of temperature changes with time for the water volume in which the tank was considered isothermal and well-stirred. This is a reasonable assumption given that the temperature difference within the tank is on the order of 1∘C. We used the principle of conservation of energy for an open system with a constant chiller power to estimate time constants. For the 144 kW chiller, 66 days are required to reduce the water temperature from 14∘C to approximately 13∘C. As the design of the detector elements progresses, further refinements will be included in the thermal model.
Another ongoing aspect of the thermal modeling is the numerical simulation of water flow and thermal transport within the water vessel. For this purpose, we solve the conservation equations for mass, momentum, and energy of the water simultaneously. Various turbulence models are be tested for validity. We have employed two different computational fluid dynamics (CFD) codes, the commercial code COMSOL and the research code PHASTA. The extreme scale of the solution domain renders the numerical CFD model challenging. We expect the flow to be 3D and transient. The Richardson number (the ratio of natural convection to forced convection) is high, so that buoyancy rather than forced flow is expected to dominate. Although water-recirculation flow rates are very low in the tank, the Peclet number, which expresses the ratio of advection to diffusion, is still very high, indicating that the advection terms must be retained in the energy equation. This work will continue in the preliminary phase.
2.6.2 Temperature, Pressure and Flow Monitoring
The flow rates and temperatures at various locations in the water volume will be continuously monitored. In addition, some diagnostic tests will be run in order to identify and correct very low-velocity zones, blocked passages, and any other evidence of improper distribution. The measuring devices can be inserted in the cooling water inlets and outlets, of which there will be about 30 per manifold, and inserted in vertical partitions along the side of the vessel wall.
To collect data at various points within the volume of the tank, we will lower a small, weighted probe, installed on the lower surface of the deck. The probe will be equipped with thermistors and pressure transducers, and also with an LED, thereby allowing the PMTs to measure the position of the device. This allows us to correlate the data with a physical position in the tank. We plan for six such sinking probes, one at the center and five distributed circumferentially around the tank. Pressure transducers and thermistors will also be required near the sidewalls. To measure the flow rate of the water as it enters and leaves the tank, simple paddlewheel sensors, such as the OMEGA FP-5300, could be used.
Thermal insulation may also be needed below the deck since this area is expected to allow the greatest amount of heat transfer into the vessel. Analysis for a qualified thermal insulation is still being performed to see if the benefits outweigh the costs.
2.7 PMT Installation Units (WBS 1.4.2.6)
This section discusses the PMT Installation Units (PIUs), the structural frameworks for mounting, positioning and aligning the PMT Assemblies (PAs), signal cables, and light barriers. It also describes the overall signal cable management scheme from the floor, wall, and deck PIU and throughout the vessel.
-
1.
Provide secure and reliable mechanical connection for the PAs.
-
2.
Maintain specified positional and directional tolerances of PMT over lifetime of experiment.
-
3.
Support with appropriate safety factor the forces expected (gravitational and buoyant forces of PA and signal cables, dry and wet self-weight, PMT implosion event, geological and seismic events, temperature fluctuations and installation).
-
4.
Minimize the number of penetrations through the vessel liner required for mechanical support.
-
5.
Provide routing paths and supports for signal cable management.
-
6.
Be compatible with ultra-pure water.
-
7.
Be made of components that are logistically feasible and cost effective for delivery to vessel.
-
8.
Provide for swift and safe installation.
2.7.1 Reference Design Description
There are three different types of PIU corresponding to the three distinct mounting regions in the detector:
-
1.
Linear PIU: Applies to all wall PAs.
-
2.
Floor and Deck PIU: Applies to both floor and deck PAs, with slight variation between them to accommodate different support points.
-
3.
Annular Deck PIU: Applies to the PAs along the outer annular ring at the Deck PA level, filling the space between the Deck PIU and Linear PIU.
2.7.1.1 Linear PIU for Wall PAs
All of the wall PAs will be supported by the Linear PIU scheme, in which a column (or “String”) of 88 PAs is supported by two support cables running between top and bottom anchor points, as shown in Figure 2–13.
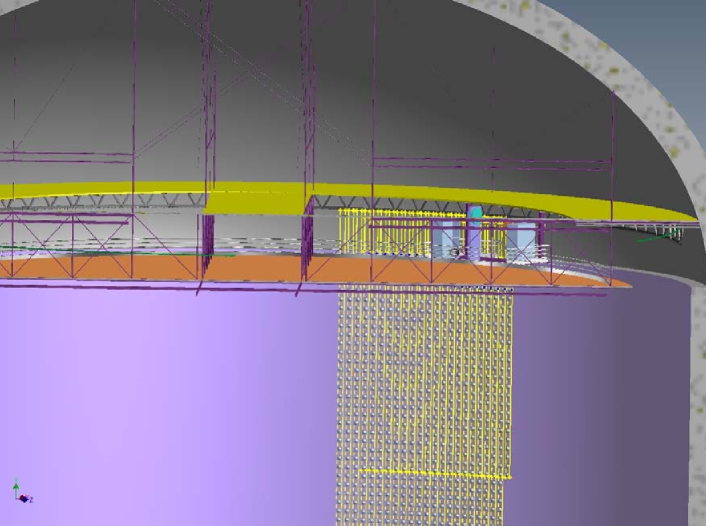
This eliminates the need for additional liner penetrations into the wall. Signal cables are routed up and secured to the support cables. Table 2–6 indicates the planned geometry associated with wall PIUs.
| Distribution of wall PAs | Quantity |
|---|---|
| Number of wall PAs | 20,470 |
| Number of horizontal rows | 89 |
| Number of vertical columns | 230 |
| Number of support cables | 460 |
Each Linear PIU column is made up of the following primary components (see Fig. 2–14).
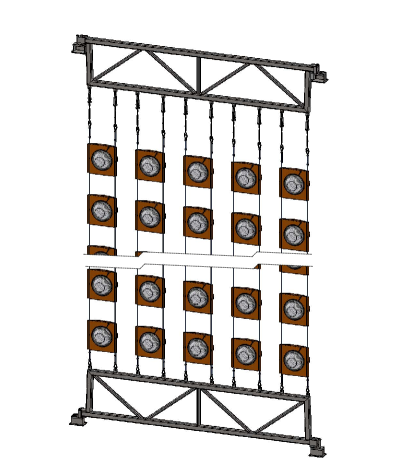
-
1.
Bottom Ring Truss: Distributes the net upward force from 460 support cables to 46 anchor penetrations into the vessel floor, and positions the support cables at the bottom.
-
2.
Support Cables and Rigging: The Linear PIU supports are composed of stainless steel cable, 3/8 inch to 1/2 inch diameter. The support cables will be tensioned on the order of 500 N and securely anchored at top and bottom. Tensioning will be accomplished by means of stainless-steel turnbuckles and springs attached to the top of the cables and the upper ring truss.
-
3.
Upper Ring Truss: Distributes the net downward load from tension in 460 cables to 46 support corbels at the balcony/rock interface, and positions the support cables at the top.
-
4.
PMT Assemblies (PAs): Each PA includes a PMT, encapsulated base, housing, and cable assembly. The PA is in WBS 1.4.3 and is described in Chapter 3.
-
5.
Signal Cables: The signal cables for all PAs on a column are divided between the two support cables and travel up to the balcony. All of the floor PA signal cables are also evenly distributed amongst the Linear PIU support cables. (Signal cables are in WBS 1.4.3)
-
6.
Light Barrier: Opaque barriers to fill the 2D space between PAs (at their widest circumference) to prevent detection of light generated outside the sensitive volume or reflections of extraneous light back into the detector from the support structure or vessel walls.
Each column of Linear PIU is deployed from the deck by successively attaching individual PAs, lowering the column into position for the next PA, and managing all of the signal cables throughout the process (see Section 2.7.2). PAs are located in the vertical direction by precisely positioned collars on the support cables, and each PA is vertically constrained by only one of the support cables (the support location alternates between successive PAs). The PA is fixed to the support cables in all other directions via retention pins. This is illustrated in Figure 2–15.
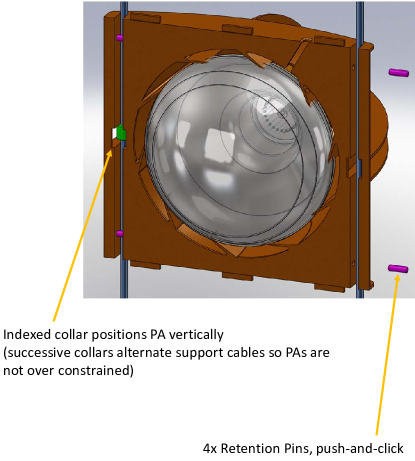
When the detector is full, the PAs will have a positive buoyancy and a small torque about the ropes. This buoyancy and torque will be used to help stabilize the positions of the PAs in the Linear PIU configuration. These forces and torques will be supported by tension in the support cables and by stabilizing bars (see Section 2.7.4). Expected overall static loads for the Linear PIU scheme are given in Table 2–7.
| Estimated Cable Pretension | 50 kgf (110 lbf) |
|---|---|
| Max Dry Cable Tension (at deck), each cable | 696 kgf (1534 lbf) |
| Max Wet Cable Tension (at floor), each cable | 309 kgf (681 lbf) |
| Dry Summed Tension (at deck) | 320,000 kgf (705,000 lbf) |
| Wet Summed Tension (at floor) | 142,000 kgf (313,000 lbf) |
| Requires additional study | |
To continue developing the Linear PIU conceptual design, some key questions and considerations are being studied:
-
1.
Can the specified positional tolerance be initially achieved, and can it be maintained over time?
-
2.
Can aging of components be reduced and compensated for as needed?
-
3.
Are the materials planned for the Linear PIU compatible with ultra-pure, de-ionized water?
-
4.
How does the Linear PIU react dynamically to an implosion event or to variations in water flow (e.g., caused by thermal currents in the detector water)?
-
5.
Handling of the signal cables needs to be studied both quantitatively and qualitatively.
-
6.
The ergonomics, safety issues, procedures and hardware associated with installation need to be studied.
To address these questions, we have developed a multi-phase R&D plan including engineering and prototype testing of Linear PIU concepts and materials testing. For example, we are developing a test stand for linear PIU installation, illustrated in Figure 2–16, in order to evaluate our basic concepts for the linear PIU, including PA attachment, positioning accuracy, and signal-cable handling.
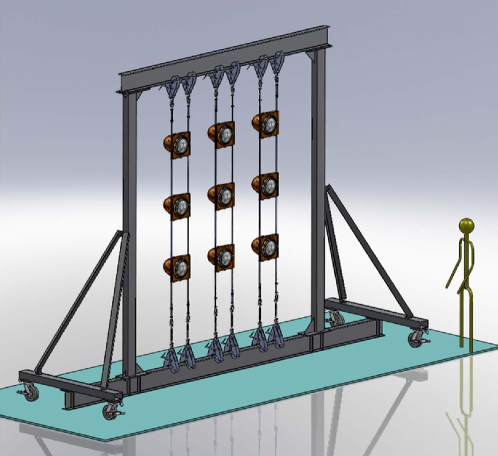
2.7.1.2 Floor and Deck PIU
The floor and deck regions of the detector are not conducive to using a linear PIU system for PA mounting. The circular cross-section of the regions, as well as the orientation of gravitational and buoyant forces perpendicular to support cables, makes them unfavorable to linear string support scheme.
Instead of support cables, the baseline design for the floor and deck regions envisions mounting the PAs to a frame structure pre-installed and surveyed in the detector prior to PA installation. This preserves the logistical and deployment advantages of the linear PIU system (minimizing dead area in shipped structures) while allowing the use of simple formed trays to support the PAs and provide for signal cable routing.
The floor and deck PIUs consist of 1950 formed stainless steel trays (975 in each region), each supporting four PAs in a 22 array separated by 0.86 m. In addition, the trays provide a cable organization and fixation channel to allow the floor and deck cables to be routed in an organized fashion.
Individual PAs are attached to the PIU trays utilizing mounting features molded into the PAs. The same PAs can be used in all positions (floor, wall & deck), simplifying installation logistics.
For the floor region, the PIU trays are supported on an open-web frame approximately 1 m above the floor, to allow room for routing of detector utilities beneath the PAs. (See Figure 2–17).
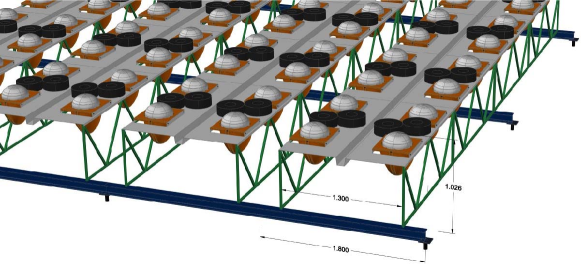
These frames are attached to an array of stainless steel I-beams attached to the detector floor by approximately 250 anchor points installed in the detector floor.
The Deck PIU is virtually the same design as the floor PIU installed upside down. The open-web frames supporting the PIU trays attach to the bottom chord of the lower stainless I-beams just below the gas barrier (see Figure 2–18).
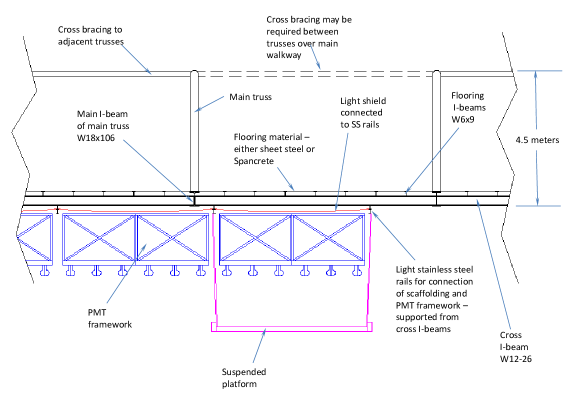
2.7.1.3 Annular Deck PIU
At the deck PA level, the outer annular ring of PIUs is the last to be put into position since access is needed through this space for installation throughout the rest of the vessel. Moreover, access needs to be maintained in this area for detector maintenance.
The Annular Deck PIU will be made of a series of hinged framework pieces (see Figure 2–19) that extend radially from the outer edge of the Deck PIU.
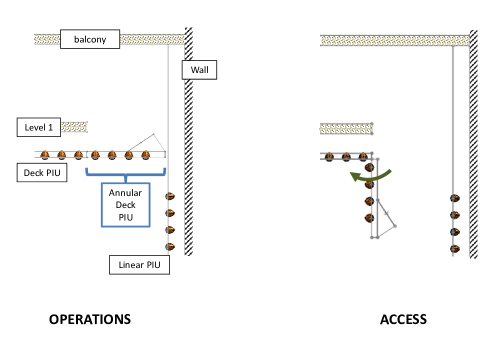
Each frame section will be required to be moved as needed to provide access through the annular space at that location.
It is required that the sections of the annular PIU support be able to be moved after deployment. The exact method of their motion is not yet determined. In addition to the downward hinging shown in Figure 2–19, we are considering other options such as hinging the panel to swing upwards or possibly fully-removable panels which could be lifted out of the annular section and set on the level one floor.
2.7.2 Order of Installation and Special Tooling/Fixturing
PA/PIU installation is currently planned to occur in the following sequence: The deck PAs are installed following deck assembly, but before it is raised into position. The deck is then raised into position.
Once the deck is in position at the top of the detector, Linear PIU installation platforms are put in place (see Figure 2–20).

The installation platforms are multiple work surfaces suspended from the annular deck balcony at the outside radius, and on the deck surface at the inner radius. Our current design envisions three such platforms.
These platforms can rotate around the central axis of the detector and contain all the equipment necessary to support PA handling and cable management during PIU installation. Each of the three platforms will support an independent installation team, allowing for installation of three PIU strings at once.
PAs are installed onto the support cables by inserting one cable into the PA guide slot & inserting the locking pins for that side, rotating the PA around the axis of the support cable until the other PA guide slot engages the second rope, and then locking into place with push pins.
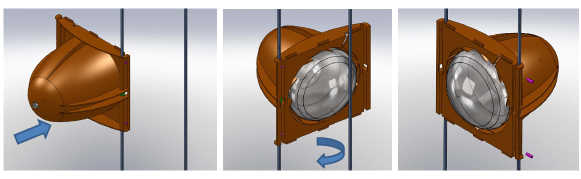
During installation the PA signal cables are cable tied to the support cables as they are lowered into the detector, and the signal cable spools are stored on racks on the installation platform. After the completion of the installation of a PIU string, the signal cable spools for that string are fed up to the deck balcony for routing and storage.
Following the wall installation, the floor PIUs are installed, and their cables routed through the PIU tray cable guides to the walls of the detector. A gondola (see Figure 2–22) is used to route the floor PA cables along the wall PA support cables to the deck.

The installation of the light barriers and Linear PIU stabilizing bars is also completed at this time from the gondola.
2.7.3 Light Barrier
Required performance of the detector dictates there be an optically opaque barrier, or light barrier, at or near the radial position of the PMT equators that fills the space between PMTs. This barrier separates the detector into an inner and outer region, the former comprising the sensitive volume of the detector.
The light barrier serves the following functions:
-
1.
It shields the sensitive volume from Cherenkov light created from low-level background radiation in the rock wall. The PMT horizon, and therefore the light barrier, has been specified to be a radial distance of 0.95 m from the rock wall. This 0.95 m annular ring is sized to attenuate most of the radioactivity from the rock wall, and any Cherenkov light produced in this region must be shielded from the sensitive volume.
-
2.
It provides the geometric border of the sensitive volume. A comparison is made between the reconstructed vertex position of a physics event and the barrier, and anything originating outside the sensitive volume is rejected.
-
3.
It provides a barrier between the sensitive volume and all of the hardware behind the PMT horizon (Linear PIU, signal cables, recirculation piping). Without a barrier, light could be absorbed and/or scattered by this hardware, complicating pattern recognition and event reconstruction.
Two designs are currently under investigation for the light barrier. One consists of a barrier comprised of individual overlapping tiles — one per PA — secured to the PA faces with press-lock mounting pins during a secondary installation phase using the gondola (see Figure 2–23).
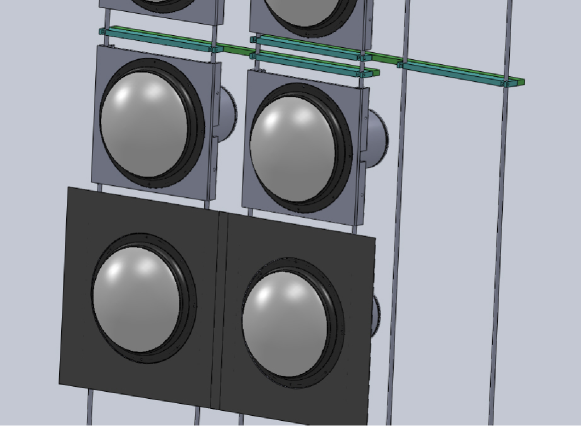
This installation phase might occur simultaneously with the routing of the floor PA signal cables, but in any case could not occur before the floor signal cable installation as the plates will block access to the support cables and thus prevent the signal cable routing. One advantage of this plan is that the semi-rigid tiles may prove useful in providing pointing accuracy for the PAs.
The alternate design under consideration uses continuous sheets of opaque plastic film, probably LDPE, for the light barrier, similar to the barrier used in the Super–Kamiokande detector. The film might be deployed simultaneously with the PIU strings, and attached to the PAs with mounting rings (see Figure 2–24).

The plastic film would have reinforcing strips sealed to it both around the PA mount points and at the edges, to prevent damage to the film in high-stress regions.
During deployment the strips of film would be folded back towards the center of the strip, leaving an open region between PIU strings to allow routing of the floor PA cables along the support cables and the installation of PIU alignment bars from the gondola once the floor PIUs are installed. Once the PA signal cables and alignment bars are installed, neighboring sheets of light barrier are clipped together. Light collectors or wavelength shifters, if chosen, will be integrated with light barrier design.
2.7.4 Linear PIU Stabilizing Bars
Linear PIU stabilizing bars will be installed as part of the light barrier installation regardless of the barrier technology chosen. These bars join two or more neighboring PIU strings, fixing their distance and angular orientation with respect to each other to ensure correct PA placement and alignment. Stabilizing bars are likely not required at each level. The number of stabilizing bars required will be investigated in PIU prototypes.
The stabilizing bars as currently designed consist of plastic bars which clip onto the PIU support cables using snap-in push pins (similar to those used to locate the PAs on the support cables). The bars restrict the relative angular orientation and spacing of the support cables, while not absolutely locating the PIUs. A complete ring of stabilizing bars defines an 88-sided polygon, which will assist in fixing the positions of the linear PIUs and resisting any motion of individual PIUs due to cable twisting or water currents.
2.7.5 Signal Cable Management
Signal cable routing and support are critical and time-consuming operations. Careful planning is required to ensure efficient installation. The following design assumptions are used in our plans at this time.
-
1.
The deck design is that of a raised balcony (Level 2 deck) with suspended inner deck (Level 1).
-
2.
Cavern height is 81.3 m from the rock floor to 4850L.
-
3.
Level 1 deck is at 4850L. Level 2 deck (balcony floor) is 4m above 4850L.
-
4.
All 12 inch PMTs are spaced 0.86 m apart in a rectangular array on floor, walls, and under the level 1 deck, with the exception of a polar array on the outer perimeter of the level 1 deck.
-
5.
Wall PMTs will be deployed according to the Linear PIU concept (see Section 2.7.1.1).
-
6.
There will be the same number of PMTs under the deck as on the floor.
-
7.
PMT signal cables will come in four fixed lengths: Floor, lower wall, upper wall, and deck.
-
8.
All PMT signal cables are routed from their respective PMT assembly (PA) to an electronics rack on the balcony.
2.7.5.1 Floor PA Signal Cable Routing and Cable Length
On the vessel floor, all signal cables will be routed along the floor PIU structure to a vertical support cable on the vessel perimeter. Each pair of vertical support cables holds up a column of wall PIUs (Linear PIU concept). Cables near the cavern center have the longest run and will be routed straight to the nearest support cable and upward to the nearest electronics rack. The length of these cables determines length for all floor cables.
In the current concept, floor PIUs are arranged in a rectangular array. There are about 1000 PIUs, each housing four PAs in a 22 array, plus individual PAs to fill in near the cavern wall (see Figure 2–17). Each PIU has an integral cable tray running in one direction through the PIU. The PIUs are installed in long rows, starting at floor midline and proceeding to the wall. They will be installed with the cable trays aligned so as to create a long cable tray extending to the wall.
All cables will be routed to the wall in the long trays. When the cables reach the wall, they may be routed straight up a nearby support cable or they may be routed along the wall in an annular tray to reach a support cable some distance away (see Figure 2–25).
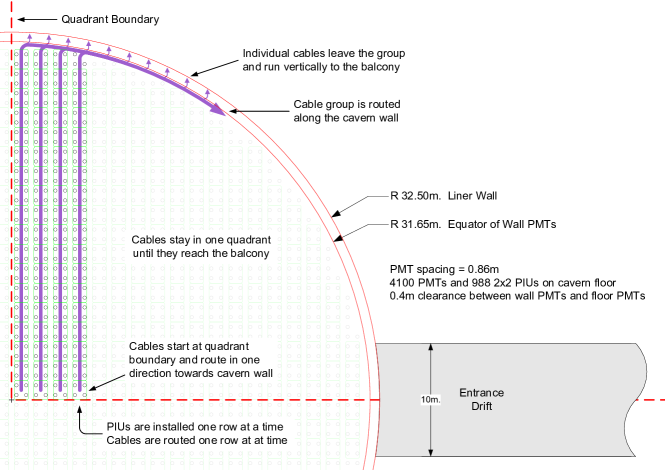
The floor cables share the support cable along with the previously installed wall PIU cables and will be distributed among the 230 pairs of support cable as evenly as is practical.
The exact route and final destination of each cable will be defined by the time detector design is complete, well before any cables are run. During cable installation time, workers will adhere to a prepared cable deployment script.
2.7.5.2 Wall PA Signal Cable Routing and Cable Clamping
In the Linear PIU concept, signal cables attach to a pair of support cables, alternating sequentially between the two supports. On the deployment platform there will be two cable guides, one for each support cable. As each PA is installed, a signal cable is added to the appropriate guide. Between every sequential PA, the two growing bundles of signal cables are fastened to their respective support cables as depicted in Figure 2–26.
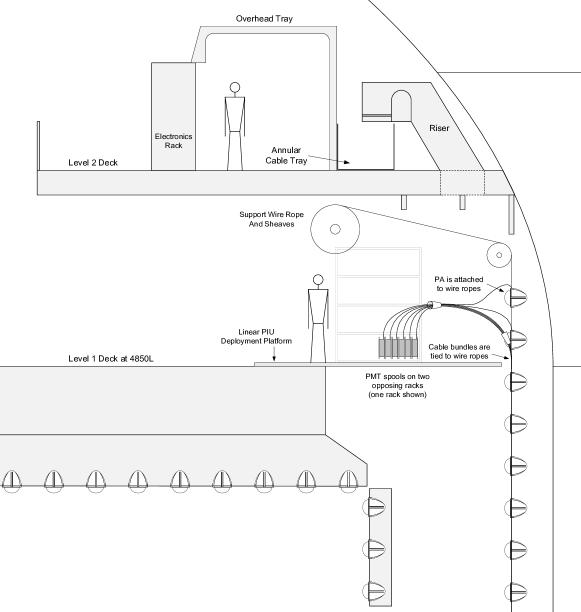
Each Linear PIU column supports 88 wall PAs, so each of the two support cables will anchor 44 wall signal cables at the top. There are 230 PIU columns and 460 support cables. The 4100 floor signal cables, if distributed evenly over 460 supports, will add an additional 9 signal cables to the 44, for a total of 53. This number will vary depending on routing constraints.
2.7.5.3 Deck PA Signal Cable Routing
Deck PMT cables will be run horizontally just above the deck PAs, with the cable tray system TBD. Cables will emerge all around the deck circumference from the space between rectangular and polar PAs. From there the cables will be routed upward to the underside of the balcony, then run laterally and radially to the closest riser. All PMT signal cables stay inside the gas barrier until they emerge from a riser on the balcony (see Figure 2–27).
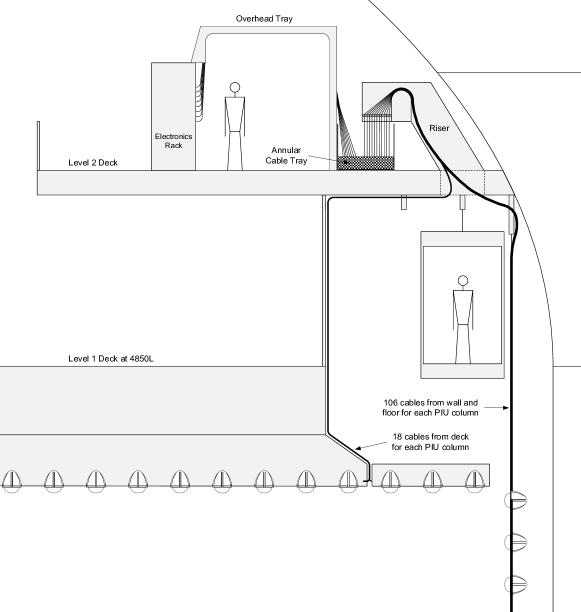
2.7.5.4 Signal cable risers and management on deck
Cable risers are the entry port in the Level 2 deck (balcony floor) for signal cables coming up from the vessel below as shown in Figure 2–27. The risers have three functions. They must provide:
-
1.
Strain relief for the cable weight. The cable length to be supported is the length from the last tie point on the vertical support cable.
-
2.
A gas-tight seal for the gas blanket below the deck.
-
3.
A light-tight seal to the detector volume.
The 200 kTon detector has 230 columns of 89 PMTs mounted on the wall (20,240 PMTs), plus about 8200 PMTs on floor and ceiling combined, for a total of 28440 PMTs. The exact number of risers has not yet been determined. If, for example, 46 risers are spaced around the deck (one riser for every 5 PIU columns), then each riser holds 620 PMT cables on average. This is comprised of 530 wall and floor cables plus 90 deck cables. The risers are designed to accommodate additional cables to allow for uneven distribution. The risers in front of the entrance and calibration drifts are moved to the sides of those drifts, and are more closely spaced.
Not shown in Figure 2–27 is the fact that most cables will have to travel laterally near the cavern wall to reach their designated riser. If there are 46 risers, cables need to travel laterally as much as 2.2 m to reach a riser. Fewer risers require more lateral travel.
The riser assembly shown in Figure 2–27, is a rectangular, duct-type structure that penetrates the balcony surface and extends through any balcony substructure.
The riser assembly has a 180∘ turn at the top to prevent light leaks by eliminating any line-of-sight between the detector and the deck. The riser assembly is open above the deck on front and top. To complete the light-tight design, a riser cover fits over the assembly completely covering deployment openings.
The cables are held in place by inserting them into a rubber-molded block with channels for 60 cables. Each row of 60 cables is clamped with a mating rubber-molded block and stainless clamp plate. All 60 are then firmly supported and sealed against light and gas. Another rubber-molded block may then be added, ready to grip another row of 60 cables, and so on. A closed-cell foam urethane block is placed over the last clamping bar to close the opening to the edge of the riser base. The light cover is then secured over the riser base. A preliminary design for a riser is shown in Figure 2–28.

Cable is stored on the deck in a floor level annular tray as shown in Figure 2–27. Cable is brought up through the riser, clamped, and run in the tray in a direction that takes it to its designated electronics rack with no coiling and minimum number of folds.
Cable is routed from the annular tray to electronics racks via an overhead tray as shown in Figure 2–27. This allows access to the rear of the electronics racks for connections and access to the risers for installation. These trays are also designed to be covered to form plenums if required.
2.8 Magnetic Compensation (WBS 1.4.2.8)
The PMTs used in the water Cherenkov detector have large (10 cm or more) drift distances from the photocathode to the first multiplication stage. This makes them particularly susceptible to magnetic fields on the order of 1 Gauss or less, given the inherent low energy of the photoelectrons, even with a several-hundred volt accelerating potential. This means that the Earth’s magnetic field can cause significant loss of efficiency. The size of this effect for the large PMTs that we are considering is typically 10–20. These numbers are the result of a series of measurements at testing facilities built by our collaborators.
This susceptibility leads to problems both in cost and in achieving the LBNE physics goals:
-
1.
A reduced PMT efficiency means that we need to install a proportionally larger number of PMTs for any particular light collection goal, leading to a large increase in overall cost.
-
2.
The inhomogeneous response of PMTs over their surface will also lead to a lower overall efficiency.
For these reasons, we plan to lower the magnetic field inside the PMTs by one or more methods.
The first method we considered is to use active magnetic-compensation coils to reduce the Earth’s field at the PMT locations. A passive system is also being investigated.
2.8.1 Active Magnetic-Compensation Coils
We have established the following requirements for the absolute magnitude of the residual magnetic field (B field) in defining the level of compensation:
-
Less than 50 mG on at least 75% of all PMT positions
-
Less than 100 mG on at least 95%
-
Less than 150 mG everywhere
2.8.1.1 Magnetic Compensation, Finite-Element Model for 100 kTon
A model has been developed based in part on the Super–Kamiokande design and modified to handle the LBNE WCD geometry. After considerable modifications to the types of coils, location of coils and currents, we have found a viable coil arrangement located external to the cylindrical vessel liner.
We have designed a coil system similar to that of Super–Kamiokande except that, due to the shorter distance between the compensating coils and the PMTs (1 m in LBNE versus 3 m in the Japanese model), more coils will be needed in order to provide a sufficiently uniform magnetic induction field.
This early model was for a 100 kTon detector. The basic geometry included 63 horizontal coils, 16 circular cap coils (eight in the floor, eight above the deck PMTs), six saddle coils, and 50 vertical coils.
Figure 2–29 represents a plot of the magnitude of the magnetic-induction field due only to the coils for a 100 kTon detector.
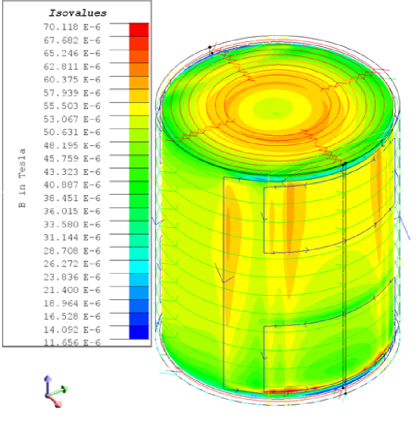
The plot represents the magnitude of the induction field at the location of the PMTs. Our main concern at this point was to find the proper coil arrangement which would produce as uniform a field as possible on the inside wall of the cylindrical vessel. Once this uniformity is established, we subtract out the axial and transverse components of the Earth’s field from the axial and transverse components of the induced field to check if we meet specifications.
The current detector size is 200 kTon, and all further discussion will pertain to it. A finite-element model has not yet been solved for this much larger detector, but is in process.
It should be noted that, in addition to changing from 100 kTon to 200 kTon, the poured concrete liner has been eliminated from the baseline design and the PMTs are now much closer to the compensation coils. They were 1.5 m away with the concrete liner, but are now approximately 0.85 m away. This will increase the non-uniformity of the compensation, and simulations or other calculations are needed to resolve the issue.
2.8.1.2 Implementation for 200 kTon Detector
Magnetic compensation of the Earth’s field will be implemented as sets of direct-current powered coils embedded in the cavern at the neat line outside the vertical vessel walls and beneath the vessel floor, and supported by deck structures near 4850L. Wall- and floor-coil segments will be embedded as close to the neat line as practical. Round, horizontal coils will be used to compensate the vertical field component. Vertical coils (mostly rectangular) will be used to partly compensate the lateral component. The overall configuration is shown in Figure 2–30.
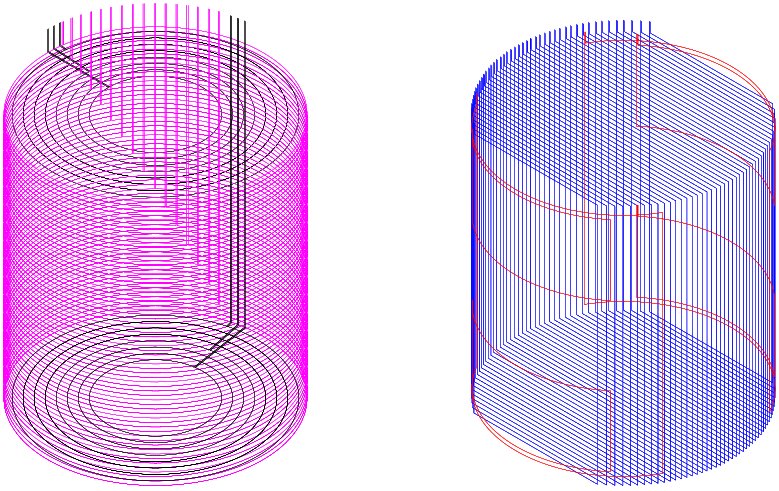
The compensation coils are divided into five types:
-
1.
Vessel Outer Diameter Horizontal Coils We will place 81 circular horizontal coils in the cavern at a radius of 32.5 m. They will be spaced 1 m apart from the floor slab to just below 4850L. Each of the 81 coils will have a feed cable extending to deck level.
-
2.
Vessel Concentric Floor and Deck Horizontal Coils 11 circular horizontal coils will be placed on the cavern floor. An identical set of 11 will be placed just below the deck. Each of the 22 coils will have a feed cable extending to a single power supply.
-
3.
Vertical Coils 58 vertical coils will be placed in the cavern, each with a rectangular cross-section and 1 m spacing. The rectangular cross-sections will be formed by running vertically along opposing wall neat lines, horizontally along the floor neat line, and horizontally some distance above the deck PIUs. The coil planes will be oriented parallel to each other and perpendicular to magnetic north. Each of the 58 coils will have a feed cable routed to a power supply on the deck.
-
4.
Saddle Coils Four or more saddle coils will be placed in the cavern, all along the wall neat line (=32.5 m). Saddle coils have two straight vertical legs, and two arcs in horizontal planes following the cavern circumference (neat line). The coils will be oriented so that the planes passing through the straight, vertical leg pairs of each coil are perpendicular to magnetic north. As above, each of the coils will have a feed cable routed to a power supply rack on the deck.
-
5.
Cross Coils There is no plan for vertical coils rotated 90∘ (around a vertical axis) from the 50 vertical coils described above. Initial modeling and calculation has indicated they will not be necessary during a 50-year cavern life to reach the compensation levels needed. Magnetic-north direction relative to true-north direction is somewhat a function of location and time. We will choose a pointing direction for the oriented vertical coils that provides a good fit over the planned detector useful lifetime. The total Earth field at Sanford Laboratory can vary by 10% or more per 100 years, or 1% in five years. The adjustable power supplies can be dialed up or down as needed to compensate for field-strength changes, in the active directions of the coil sets. Adjusting currents separately for horizontal and vertical coil sets will also accommodate changes in inclination angle.
2.8.1.3 Electrical and Thermal Considerations
Using DC currents from the simulation, calculations show that a considerable amount of heat is dissipated at the cavern walls by the compensation coils, even for large copper conductors.
To minimize the heat input, each horizontal compensation coil is constructed with four turns and two single-conductor feed lines are replaced with a single feed cable having two double-conductor feed lines inside it. This 4-conductor/4-turn configuration is shown in Figure 2–31.

In this configuration, the required magnetizing current is reduced by four while feed conductor resistance is increased by a factor of two, yielding an eight-fold reduction in feed conductor dissipation as compared to a one-conductor/one-turn configuration.
Table 2–8 shows calculated heat loads using the four-conductor/four-turn system.
| Compensation Coil Wire Gauge | Total Power |
|---|---|
| Horizontal Coils: 10 AWG, Vertical Coils: 4 AWG | 73 kW |
| Horizontal Coils: 8 AWG, Vertical Coils: 2 AWG | 46 kW |
| Horizontal Coils: 6 AWG, Vertical Coils: 0 AWG | 29 kW |
When laying out the feeds, we will calculate the asymmetric thermal load and evaluate it for impact on vessel lifetime, coil life, and detector water mechanics. It may be necessary to distribute the thermal load of the feeds and perhaps use more power-supply racks to aid in reducing lateral feed length, total power consumption and localized hot zones on the cavern or vessel wall that could be created by concentrating the feed lines.
2.8.1.4 Cables and Connections
Since some or all the compensation coils may be immersed in water that has diffused through the concrete or seeped through cracks, we require submersible cable. The cable should be water-blocked and free of air voids. High density polyethylene (HDPE) is a good candidate for an outer jacket.
Connections between individual conductors is a critical issue. With the four-conductor/four-turn system, each horizontal compensation coil requires five buried joints, two of which involve three conductors as shown in Figure 2–31. Each of these joints must be water-tight over the long run to prevent fouling, swelling, electrolysis, or opens due to corrosion. Rather than trying to make joints in a water-tight junction box, it may be simpler and more reliable to make each individual joint water-tight, then encase it inside a mechanically protective and water-tight enclosure. There are commercially available kits for making water-tight connections for direct burial using dual-wall shrink tubing.
2.8.1.5 Power Supplies
The compensation coils may require 46 kW or more (see Table 2–8), which calls for efficient switching supplies. For the 8 AWG four-conductor/four-turn configuration, individual coil voltages in the range of 3.5 V to 60 V are required to establish DC currents in the range of 10 A to 35 A. That current range, in turn, is required to establish adequate compensation fields in the vessel.
The supplies should be current-regulated to maintain stable magnetic fields. Coil inductance will help reduce switching supply ripple. There are many commercial power supplies available in this range, so specification and procurement should not be a problem.
The number of different current zones required in the various coils and perhaps the layout of feeds at deck level will determine the number of power supplies needed. We can minimize the number by connecting coils that require the same current in series. However, each supply must remain stable while driving its total inductive load, and each supply must have enough voltage compliance to deliver the required range of current into all its coils.
2.8.2 Passive Magnetic Shielding
Early on, we looked at mu-metal wire cage shields patterned after those used in IceCube and Antares. They were rejected because they could not lower the field to 50 mG as stated in our original requirements. It was felt that a wrap of magnetic foil, which would necessarily leave the photocathode uncovered, would also fail to reduce the field to 50 mG in the photocathode volume.
Since then, tests of magnetic field effects have been performed on a Hamamatsu R7081 10-in PMT by LBNE collaborators. These tests have shown that magnetic fields up to 150 mG, oriented in any direction, have little effect on PMT output as compared with the field-free case[20]. As a result, passive magnetic shielding becomes an attractive alternative.
We have studied several methods for local shielding of PMTs, and have carried out bench tests on most. Viable candidates include mu-metal wire cage, mu-metal foil wrap, Finemet®foil wrap, and electro-deposition of shielding material. Finemet®is a trademark of Hitachi Metals, Ltd. Figure 2–32 shows the mu-metal wire cage used to shield 10-in PMTs in IceCube and a conical wrap of Finemet®used on 8-in PMTs in Daya Bay.


2.8.2.1 Measurements and Simulations
Detailed PMT collection efficiency measurements were made at the UC-Davis Maglab for an IceCube mu-metal cage on a 10-in Hamamatsu R7081. Complementary magnetic simulations and field measurements were done at UW-Madison. The UC-Davis data clearly show a collection efficiency improvement with a transverse field of 427 mG, applied at various angles with respect to the first dynode[21]. With no shielding, the collection efficiency varies with angle from 79% to 93% with an average of 87%. With the mu-metal cage in place, collection efficiency varies from 98% to 100% with an average of 99%. The percent improvement varies with angle from 8% to 25%.
UC-Davis also measured the collection efficiency of a 10-in R7081 with various configurations of 4mil mu-metal foil and then of Hitachi Finemet®[22]. Measurements were all made at one angle. At the angle chosen, the unshielded efficiency was 92%. A cylinder of mu-metal foil was wrapped around the base, and the back of the PMT was wrapped with a cone of mu-metal reaching just to the PMT equator. This increased efficiency to 99%. A cylindrical hat was added, extending from the equator to the apex of the PMT. This yielded an efficiency of 100%. For the Finemet®, wrapping of base and cone increased efficiency from 92% to 94%. Adding a Finemet®hat increased efficiency to 98%, but this may drop when the experiment is re-run with the Finemet®hat blackened on the inside. Clearly, 4mil mu-metal foil offers better results. On the other hand, Finemet®is easier to work with — it has no sharp edges, may be bent and folded easily without harming magnetic qualities, and comes coated with PET.
2.8.3 Comparison of Passive Shields and Active Compensation Coils
Passive shields act locally to shunt the magnetic field around each individual PMT. Local shields have a number of advantages over compensation coils. The lightweight shields will be integrated into the PMT Assembly (PA), and will be installed in a controlled production environment. Magnetic compensation coils, by contrast, are very heavy and must be installed on 80 m high cavern walls. Over 1000 heavy gauge electrical connections are required, many of which will be immersed in groundwater for several decades and must be sealed to prevent corrosion. Further, compensation coils require 230 deck penetrations to bring feed cables through to several power supply farms in racks. The power supplies must be monitored and adjusted over the life of the detector.
Other than cost considerations there are no clear advantages to the active compensation coil approach over the passive shield approach, while there are several clear disadvantages. The only potential advantage of compensation coils is the possibility of lowering the field to 50 mG for the great majority of PMTs. This does not appear necessary — as stated above. Active coils do offer adjustability and are not placed in the corrosive ultra-high purity water. The passive system has disadvantages in both respects. A decision has not been reached at the time of this writing. Both systems are under study.
2.9 Installation Equipment (WBS 1.4.2.9)
This section describes equipment needed for material handling and personnel access during the construction, installation, operation and maintenance phases of the WCD project. This takes into consideration all periods after a stabilized cavity is excavated, through normal detector operation and maintenance. It will include both permanent and temporary equipment needed to complete these tasks. This section does not include general tools and equipment, safety systems section, or any specific personal protection equipment.
2.9.1 Overhead Crane
For the excavation, it is expected there will be a crane extending in from the main entrance drift. This will be left in place for use during construction and installation. The crane will extend approximately 20 m into the cavity and have a lifting capacity of 5–10 tons. It will be used to move any large items from 4850L to the floor of the vessel.
2.9.2 Mast Climbers
For work on the vessel wall, we plan to use mast climbers and gondolas. Mast climbers will be used for the large-scale work, because they can go from cavern floor to 4850L quickly, provide a large, stable work surface for six to ten workers, be erected up to 30 m in width, and provide a load capacity of more than 6 ton. Gondolas will be used for lighter work; they can transport two workers and small payloads to anywhere on the vessel wall. We expect to use gondolas for any repair, maintenance or adjustments needed after the main installation has been completed with the mast climbers, and for interventions during detector operations.
A mast climber is a self-erecting, motorized, vertical work platform (shown in Figure 2–33).
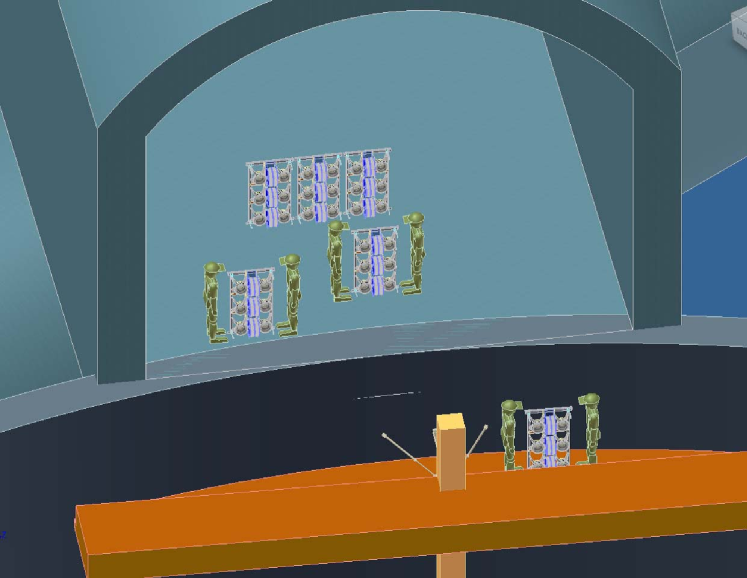
It consists of a ground base, vertical masts that are fixed at different heights on the vessel wall, and a moving platform from which to work. Mast climbers will be temporarily installed on the floor of the detector at set locations. Once the work for a given section of the vessel wall is complete, the mast climber will be disassembled and moved to another location, and the work repeated. We expect to have two mast climbers and each will be erected in three locations to cover the entire vessel wall.
2.9.3 Gondolas
A gondola system will be permanently implemented for installation and future maintenance work on the vessel wall (shown in Figure 2–34). A gondola consists of two monorails installed around the annulus of the cavity under the balcony, approximately 2–3 m inward from the cavern wall. One monorail will have multiple powered trolley hoists, with a lifting capacity of 2 tons, that will be used to raise and lower equipment and materials. The other monorail will have powered trolleys from which the gondolas, with cable hoists, will be operated. These will be used for moving personnel around for work on the vessel wall.
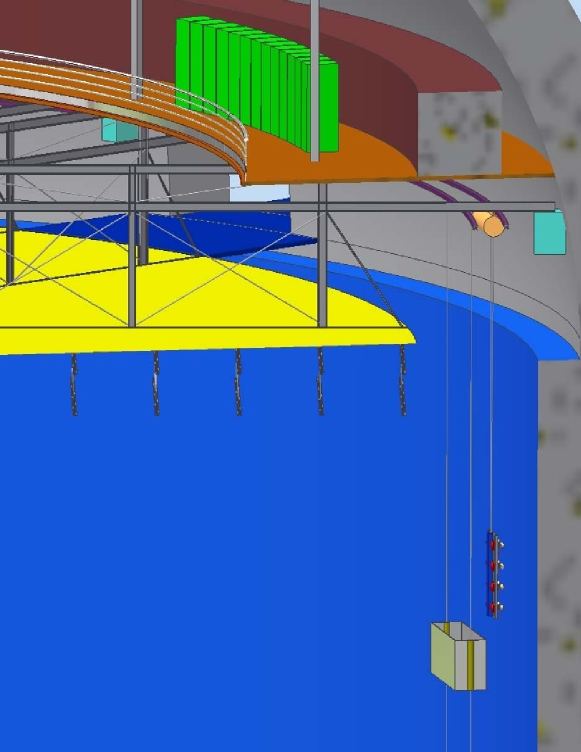
2.9.4 Ancillary Equipment
Smaller equipment will be needed to move equipment and materials around the cavern during construction and detector operation. This includes portable gantry and jib hoists, forklifts, pallet jacks, and hand trucks. It is also planned to have a scissor-lift table to move materials from 4850L to the balcony, approximately 4 m above.
3 Photon Detectors (WBS 1.4.3)
3.1 Introduction
The Photon Detector subsystem includes the design, procurement, fabrication, testing and delivery of approximately 29,000 photon detector assemblies that meet the required performance for light collection in the LBNE Water Cherenkov Detector (WCD). This chapter describes the reference design for the photon detector system that uses an array of large diameter photomultiplier tubes (PMTs) similar to that used in successful neutrino detectors including Super–Kamiokande, SNO and IMB.
The PMT coverage described in Chapter 1 derives from the benchmark requirement to have an effective coverage equivalent to that of SK-II. This effective coverage will allow us to detect events, reconstruct tracks, and identify particles, all of which are necessary to enable the WCD to achieve the LBNE Physics goals. The equivalent of the 20% coverage of SK-II is achieved by an array of 29,000 12-inch PMTs covering a surface area of 21,500 m2 surrounding a water volume of 241,000 m3, corresponding to a total PMT area of 9.8%. PMTs with high quantum efficiency photocathodes will raise the LBNE effective coverage from 9.8% to about 15%. Light collectors, assumed to increase the light collection by 40%, will extend the coverage to 20%. Because of the smaller PMT size relative to SK-II, the LBNE WCD granularity will be 30% finer.
The photon detector unit adopted for the reference design is referred to as a PMT Assembly (PA) and is shown in Figure 3–1.
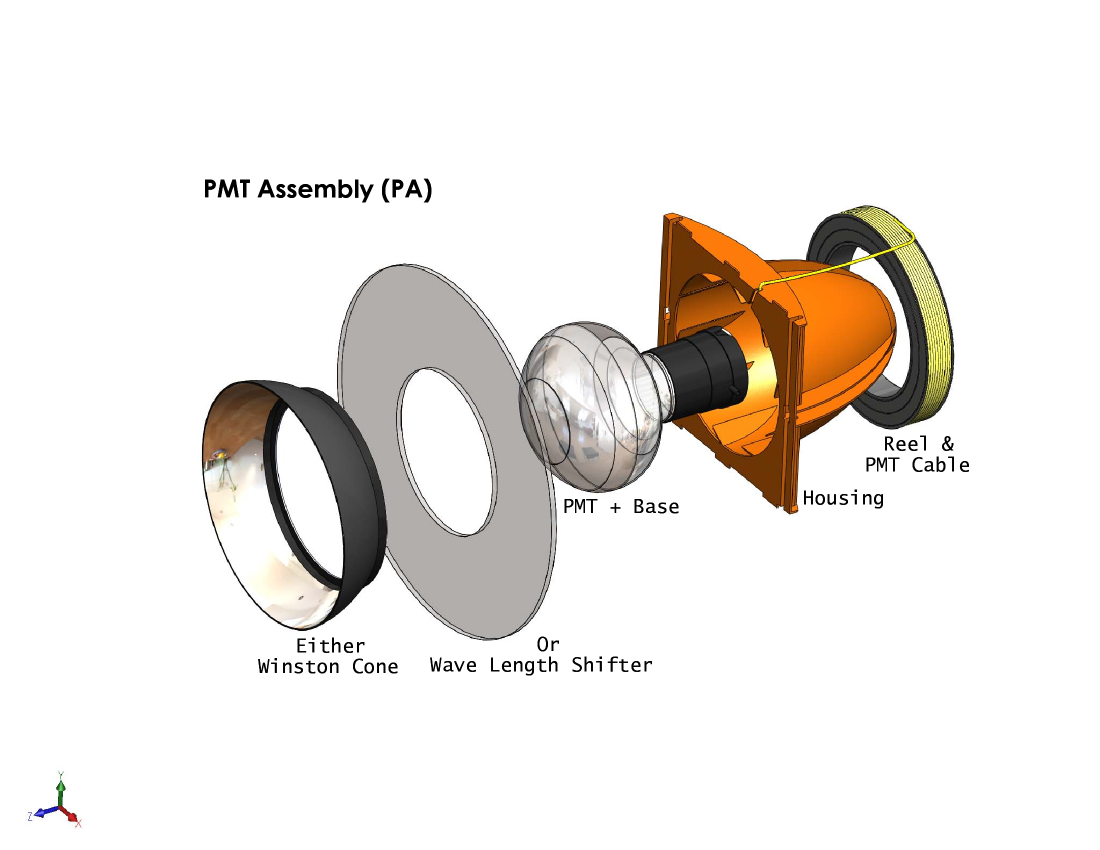
Each PA consists of a PMT, an encapsulated voltage divider base, housing and cable assembly. The PAs will be designed to mount individually to the wall and ends of the 200 kTon fiducial-volume containment vessel as described in Chapter 2.
The light collector will be attached after PA installation in the WCD. Two light collector designs are being considered: a Winston cone and a wavelength shifter plate. The final choice will be determined by laboratory prototype demonstrations and simulation studies.
3.1.1 PMT Reference Design and Selection Process
The PMT for the reference design, the 12-inch Hamamatsu HPK-R11780HQE, was selected based on its large size for overall cost reduction and for a mechanical design that can withstand high water pressures. LBNE expects to have a viable PMT candidate from ADIT/ETL with similar features.
LBNE is working with both vendors to further optimize these large diameter tubes (12-inch for Hamamatsu and 11-inch for ADIT/ETL) for photocathode efficiency, electron optics and robustness of the glass bulbs. Given the long experience with these vendors we expect that both will produce viable candidates.
The recent advances in PMT technology and these optimizations will result in tubes that are superior in all aspects to those used in SK-II.
A selection panel, whose members have expertise in the technical, scientific, and procurement aspects of PMTs, has been established to select the final vendor and PMT. The selection panel will develop the performance requirements and final specification with input from the simulations and the electronic/optical and mechanical characterization efforts. The panel will also develop vendor selection criteria to be included in the request for proposal. The vendor selection will be based on the criteria in addition to performance and cost.
The quantity of PMTs is larger than in previous experiments and production of so many PMTs presents a significant challenge even for a large manufacturer. To produce the required number of PMTs, vendors may require new facilities, equipment, personnel and processes. They are unlikely to make this investment without a substantial commitment from LBNE, perhaps 10,000 PMTs. Even with such a commitment, it will likely take a year for any vendor to be up to production capacity.
3.1.2 QA and ES&H
A comprehensive quality assurance plan will guide the development and assembly of the PMT assemblies from concept to installation. The QA program is intended to ensure a design that meets performance requirements, to track and minimize defects at procurement and fabrication, and to ensure that defects do not materially affect physics measurements.
Environment, safety and health considerations will be paramount in the design, fabrication and testing of the PMT assemblies. Two safety concerns deserve special mention. The PMTs have a glass envelope containing a high vacuum and require careful handling. An implosion results in bursts of flying glass and may cause serious injury. Another ES&H concern will be the safe and ergonomic setup of assembly and test facilities since the quantity of PAs to be assembled and tested will require many repetitive processes. ES&H concerns are treated in more detail in Chapter 12.
3.1.3 Outline of Remainder of Chapter
In remaining sections of this chapter, the individual components of the reference design are described. The PMT description is divided into two parts, the first covering the optical and electronic issues, and the second describing the mechanical issues of the PMT glass envelope. The base, cable assembly, housing, and light collectors sections follow. Finally the integration and testing plan is described.
3.2 PMT Optical and Electronic Characteristics (WBS 1.4.3.2.1)
The photomultiplier tubes (PMTs) are the only active element of the WCD. The quality of the PMTs—their efficiency and their charge and time response—ultimately determine the detector’s ability to measure energy and reconstruct position and direction, and to distinguish different particle species.
The most important characteristic of the PMTs is their photon-detection efficiency (meaning the product of quantum and collection efficiency). The more detected photons, the more precise reconstruction and particle ID will be. But the number of detected photons per MeV of deposited energy in the WCD depends on the product of the photon-detection efficiency, the overall photocathode coverage, the optical attenuation length of the water, the event location and the efficiencies and coverage of any light collector or light-enhancement device. Granularity, the number of independent angular measurements of photon times and directions, can also affect the measurements significantly, but this is driven primarily by cost. The optimal detection efficiency will likely be achieved at lowest cost for the largest-area photocathode devices that are determined to be mechanically robust. As discussed in Chapter 1.3.5.3, the reference design calls for roughly 29,000 12-inch high-quantum efficiency (HQE) PMTs, with light collectors that add roughly 40% to the overall photon detection efficiency. Such a configuration has the same light collection as Super–Kamiokande II.
Issues that go beyond efficiency and that impact the science include the timing and charge resolution, dark current, radioactivity and the possibility of spurious light emission (‘flasher PMTs’) that have plagued other water Cherenkov experiments. Clearly, we also want the PMTs to perform stably through the lifetime of the experiment and be robust to unexpected events (high light levels, etc.).
In the next sections we detail our desired PMT characteristics beyond coverage, efficiency and granularity. Unless explicitly stated, we assume a PMT gain of and a discriminator threshold of 0.25 of a photoelectron (PE). All of our desired optical and electronic characteristics are already available in modern PMTs, but we are aiming to select a device that best suits our needs within the constraints of cost. Table 3–1 summarizes all the PMT characteristics of interest and our PMT performance goals for each. For the characteristics we have measured to date, none of our goals exceed the performance of available modern PMTs. In the next section, 3.2.1, we start with a discussion of the relevance of PMT performance to event reconstruction, and then move to discuss the individual characteristics listed in Table 3–1. In the following section, 3.2.2, we then turn to our PMT evaluation and characterization plan, and some of the progress to date.
| Characteristic | Goal | Condition | Spec. |
|---|---|---|---|
| Transit Time Spread () | 1.6 ns | single pe | typical |
| Late Pulses (fraction) | 5% | single pe | typical |
| Afterpulsing (probability) | 5% | five years storage | average |
| Double Pulsing (prob.) | 5% | single pe | average |
| Pulse rise and fall time | 4 ns, 12 ns | gain | typical |
| Peak/Valley | 2 | gain | minimum |
| Charge resolution | 50% | single pe | typical |
| High charge tail | 1% | single pe | typical |
| Gain | , non-linearity 10% | 1–1000 pe | minimum |
| Dark current | 1500 Hz | C | average |
| Wavelength response | peak in 370–420 nm | in water | absolute |
| Spurious light (‘flashing’) | 1/month | after 1 month | average |
| Gain and efficiency drift | 3%/year | in situ | average |
| Late/After pulsing drift | 10% | rms variation | typical |
| Noise rate drift | 2 | monthly average | typical |
| Temperature hysteresis | 1% | excursion | typical |
| 10% | |||
| 10% | |||
| Illumination hysteresis | 1%, | 1000 lumens/m2 | typical |
| 10%, | |||
| 10% | |||
| Seismic hysteresis | 1%, | 1000 lumens/m2 | typical |
| 10%, | |||
| 10% |
3.2.1 Dependency of Response and Reconstruction upon the Optical and Electronic Characteristics of the PMT
The most general reconstruction algorithm for a water Cherenkov detector maximizes the following likelihood, as a function of position, time, momentum, and particle ID:
| (3.1) |
where is the position of the event, is its time, the event momentum (or, equivalently, energy and direction), and ID is the particle species, which can be a single particle such as an electron, muon, or , or can be many charged particles each creating its own Cherenkov cone. The are the normalized probability densities for each PMT to observe charge at time , given the hypothesized even position, momentum, etc. The and are our only observables. Thus the biggest challenge in reconstruction is to accurately generate the . The probability that a particular PMT measures charge at time depends on an enormous number of physical effects, such as the Cherenkov process, or the absorption, scattering, and dispersion of light by the water. But the also depend on the characteristics of the PMTs themselves: the distribution of charges and times that a single detected photon creates, the efficiency of photon detection as a function of wavelength or angle or position along the photocathode, the probability of a reflection by the dynode stack, etc. As a practical matter, one often integrates over many of these characteristics, to provide a tractable estimate of the .
As an example, perhaps the simplest algorithm (excepting “closed-form algorithms”) uses the following :
| (3.2) |
for any PMT for which and where the time residual is defined as
| (3.3) |
and is the width of the spread of transit times of photoelectrons in the PMT (the transit time “jitter”). In other words, any “hit” PMT is treated as if the probability of being hit at time is a Gaussian curve centered on the time-of-flight corrected time from the hypothesized vertex, for any direction and energy. In this case, the minimization of reduces to a least-squares fit, up to constant factors. While simple, the example does point out that the smaller is, the better the vertex reconstruction will be, and the more hits there are, the more information about the vertex there will be. So position resolution to first order scales like .
A real PMT has a distribution of hit times that is highly non-Gaussian, as shown in Figure 3–2, which is a measurement of 12-inch standard
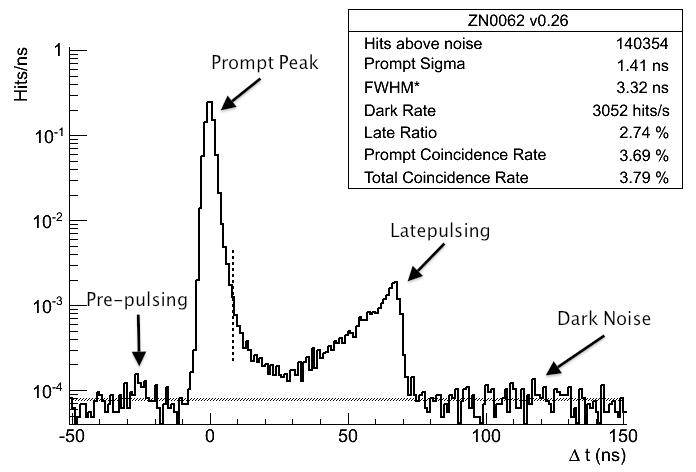
quantum efficiency PMTs made by Hamamatsu for LBNE. We see in this figure that there is significant non-Gaussian structure in this distribution. By the same token, the probability of observing charge in the -th PMT depends on both the number of photons that hit the tube, and on the shape of the charge distribution. In Figure 3–3 we show the distribution of detected
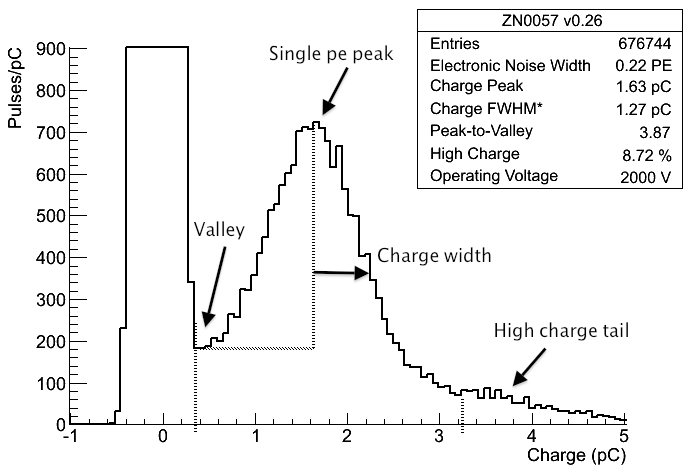
charges for the same 12-inch PMT for a single photon, and see here as well that its shape is very broad. Two photons hitting the PMT will be very hard to distinguish from one.
Our goal in PMT evaluation and characterization is to choose a PMT that has the simplest and narrowest charge and time distributions, to optimize the running conditions for the chosen PMT to further improve these distributions, and to provide precise and accurate measurements of the PMT response component of the to be used in simulation and reconstruction, including angular and position-dependent efficiencies.
Timing
The time distribution shown in Figure 3–2 has several clear features: a nearly-Gaussian prompt peak of width (manufacturers actually define this width using the full-width at half-maximum, which is roughly 2), a broad feature that peaks at roughly 60 ns, a small peak roughly 30 ns before the prompt peak, and a uniform distribution of hits across the entire window. The broad peak near 60 ns is PMT “latepulsing”, caused by elastic scatters of photoelectrons off of the first dynode. After scattering, the photoelectrons return to the first dynode roughly two cathode-to-dynode transit times later. We have found that there is a second, related phenomenon, called “double pulsing”, which appears to be caused by a photoelectron that inelastically scatters off of the first dynode. The inelastic scatter results in a prompt pulse followed by a second pulse and, because of the energy lost in the inelastic process, the second pulse arrives earlier than the typical latepulsing time scale. Figure 3–4 shows the transit time residual distribution of the second pulse in a double pulse, compared to the latepulsing distribution, and we see that indeed the inelastically scattered photoelectrons do appear earlier relative to the prompt peak than the elastically scattered electrons.
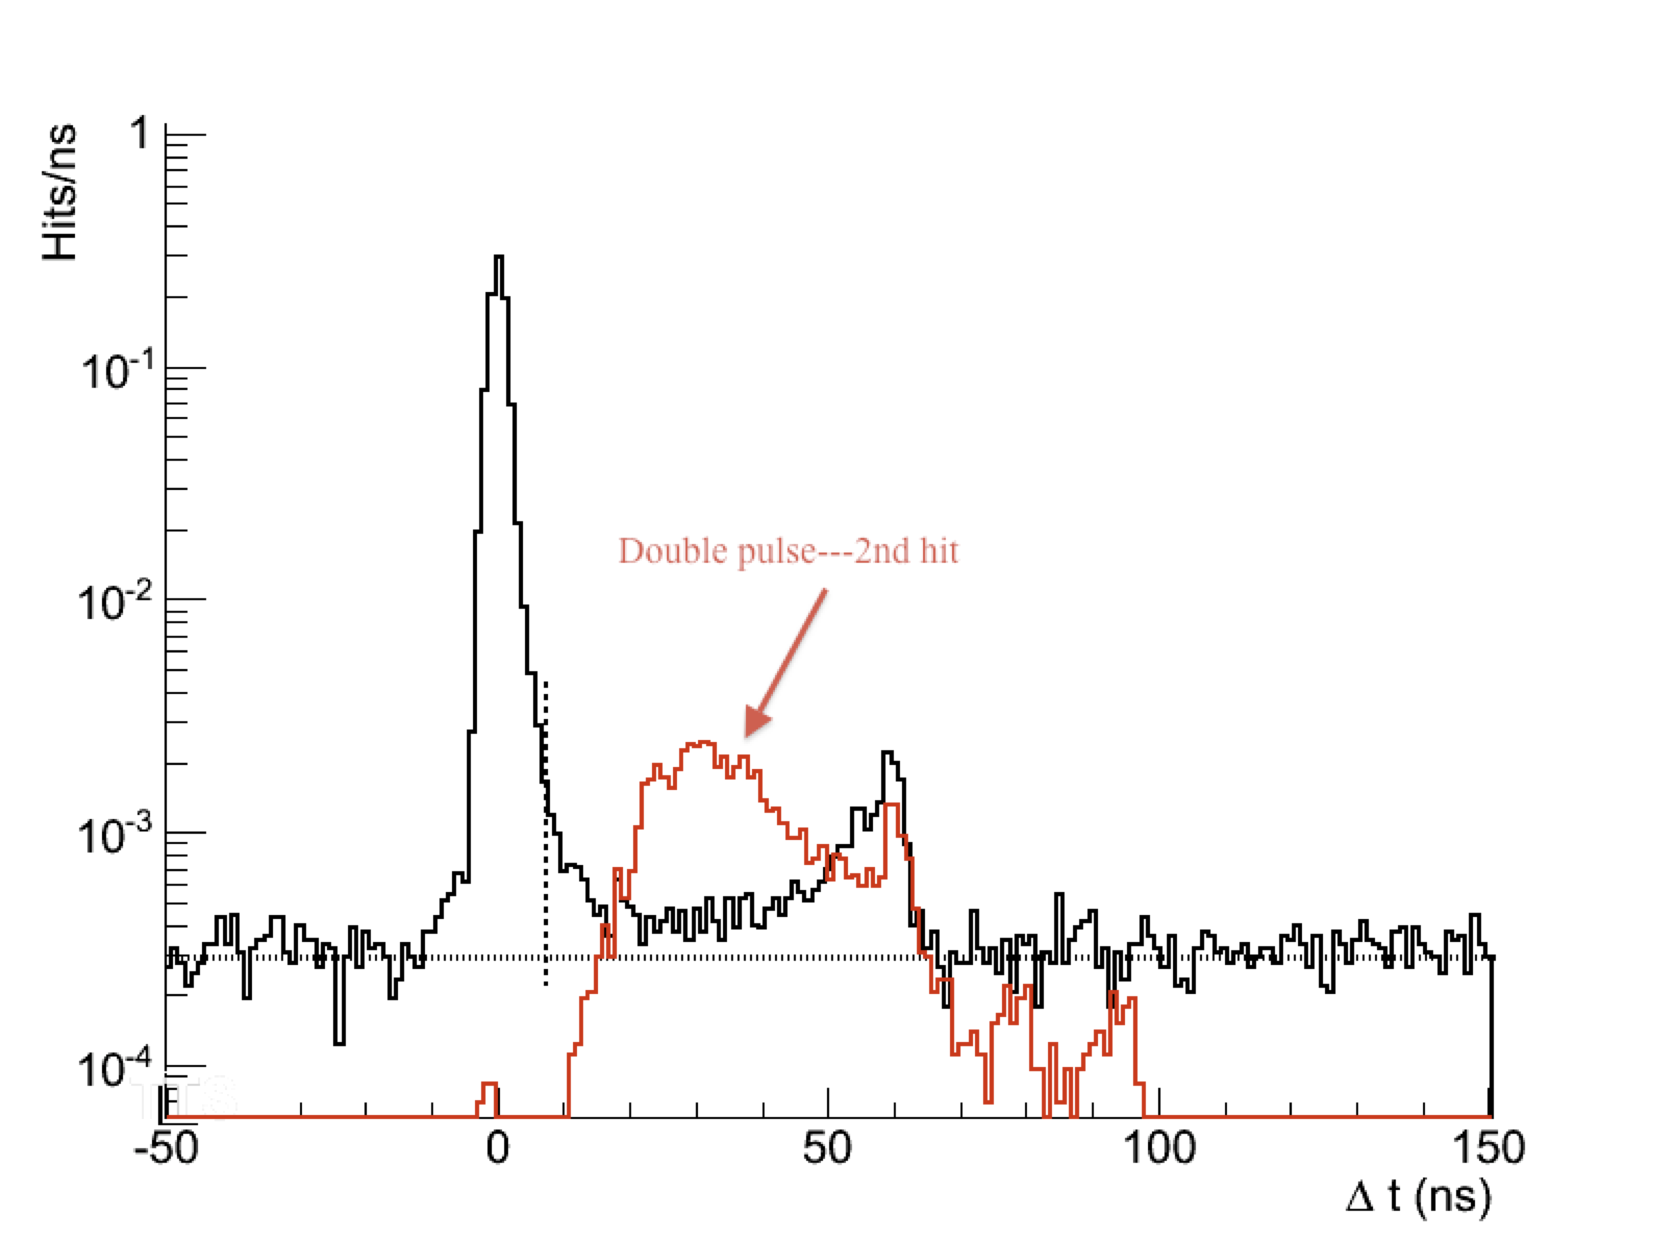
The very small early peak in Figure 3–2 represents pre-pulses, caused when a photon directly strikes the first dynode. The uniform distribution of hit times is the dark noise in the tube, caused primarily by thermal electron emission off of the photocathode.
All modern PMTs have transit-time distributions that are better than the PMTs in any existing large-scale Cherenkov detector, and we are therefore in the position of being able to choose a PMT that minimizes and has the smallest fraction of late and early hits.
Not shown in Figure 3–2 is the probability of afterpulsing. Afterpulsing is distinct from latepulsing, and is caused by ionization of residual gas in the PMT. The ions travel slowly, and thus the resulting afterpulses appear very late, often many microseconds after the prompt pulse. The biggest danger from afterpulses is the probability that they will pile up with other events, most notably Michel electrons from stopped muons. In a detector as large as LBNE, the probability that the same PMTs that are experiencing afterpulsing caused by an initial event will then be illuminated by a second event is low. Nevertheless, we would like the afterpulsing probability per photon to not exceed 5% or so, consistent with that of previous water Cherenkov detectors.
Charge
We have characterized the PMT single photoelectron charge distribution with three parameters: the ratio of the single photoelectron peak to the “valley” at low charge, the high-side width of charge spectrum as indicated in Figure 3–3, and the size of the tail of the charge distribution. A more physical model might use the first-dynode multiplicity (which in turn depends on the secondary emission characteristics of the first-dynode material) and the probability of low-gain paths, either through inelastic scattering as discussed above, or by photoelectrons that miss the first dynode (or other leakage along the dynode path). Modern tubes far exceed the photomultipliers used in detectors like SNO and Super–Kamiokande in their charge response and easily satisfy any requirement we might have. We are therefore left choosing the PMT that has the best overall charge response.
Our primary goal, as discussed in Section 3.2.1, is to pick the PMT that provides the most information in its charge response. Ideally, we are trying to find the tube that has the best ability to separate one photon from noise, two photons from one, etc. It is a common misconception that the ‘valley’ on the low-side of the single photoelectron charge distribution represents the point where the single photon response meets the tube “noise”. In fact, the valley in a modern tube represents the resolving power of the PMT normal-gain path and any possible low-gain paths. The deeper the valley, the more single photoelectrons take the primary normal gain path. The low-gain path (or paths) are difficult to use because as one lowers the threshold beneath the valley to catch these hits, one begins to encounter any electronic noise that may sit on the signal, thus increasing the apparent dark noise rate. We therefore want the PMT with the deepest valley.
The width of the charge distribution, and the size of its tail, help us to distinguish one photon from two, or three, etc. The dynamic range of the physics in LBNE extends from MeV to TeV energies. The MeV regime is overwhelmingly dominated by single photon hits, but by the time we are looking at GeV-scale events, the correlated nature of Cherenkov light leads to PMTs that are typically hit by two or more photons. Such multi-photon hits carry information about the energy of the event, as well as its timing (multi-photon hits have better timing due to the “second chance” of a prompt hit). In our choice of PMT, we are therefore looking for the tube that has the narrowest charge distribution and smallest tail. The high-charge region shown in Figure 3–3 appears to be larger than we would hope, but in fact this is a result of using a Cherenkov source, whose multi-photon tail is much larger than an equivalent isotropic source. In fact, as a demonstration for how good the charge resolution of this PMT is, there is a hint of a two-photoelectron peak in Figure 3–3, which is impressive for such a large PMT.
Pulse shape
The pulse shape of the PMTs will affect the timing, the ability to separate multiple photons (even in the most sophisticated electronics scenario) and the ability to see signal above possible pick-up and noise levels on the cable and within the electronics. Perhaps the most stringent requirement comes from the last item, given the dispersion of the PMT signal along the cable lengths expected for LBNE. As shown in Figure 3–5, the dispersion tends to stretch out the fall time of the pulse (blue trace compared to red trace), thus
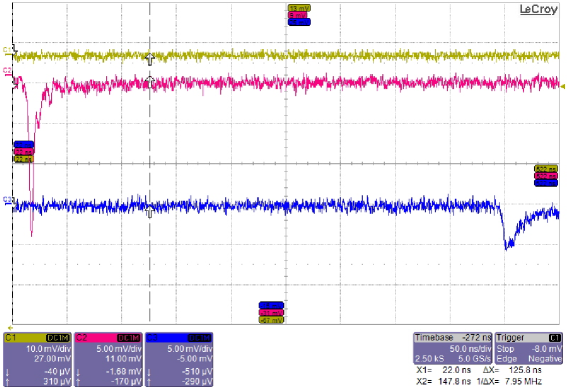
reducing its overall amplitude for a given amount of charge. Simple measurements on “LBNE-length” cables with no compensation showed that the fall time after passing through the cable can be as long as 40 ns or so, while the risetime is roughly 4 ns, not much longer than that of the PMT itself. Thus at a gain of , the peak amplitude of a pulse with 0.25 PE of charge is about 1 mV, just above where we might expect the noise level to be. A faster intrinsic pulse from the PMT will lead to a narrower (and higher amplitude) pulse at the end of the cable. Under the assumption that we will trigger on PMTs at 0.25 p.e. threshold, and a gain of , a reasonable requirement for the risetime at the PMT (measured with a cable whose length is m) is 4 ns with a fall time of 12 ns.
Uniformity of Response
The charge and time observables carry no information about the position on the photocathode that is struck nor the direction of the incident detected photon. Thus, in evaluating the of Eq. 3.1, we either need to assume that the response of the PMT is independent of these variables or integrate over them in assessing the hit probabilities. The downside in both of these cases is that it can lead to significant reconstruction biases, because the effective averaging over the response is a position- and direction-dependent thing: illuminating the PMT from the side, by an oblique, nearby event in the detector, yields a different response than one illuminating the PMT from the front.
The angular part of the response, for an unobstructed tube, comes from two sources: the optics of the glass, and the transmission and absorption of the semi-conducting photocathode layer itself. The former is typically included in simulation models via simple Fresnel optics, and can be included in reconstruction algorithms as well. The latter is more difficult because it requires detailed calibrations of the complex index of refraction of the photocathode layer and an assumption about the uniformity of its thickness. Nevertheless, we plan on evaluating all the optical parameters governing the PMT response, including the reflectivity of the dynode stack and aluminum backing.
The photocathode can also have a position-dependent response that arises either through variations in the electron optics (affects the collection efficiency, timing, and possible charge spectra), variations in the photocathode thickness (affects the PMT quantum efficiency) or variations in the glass thickness (affects the transmission to the photocathode layer). In Figure 3–6 we show our measurements on a 12-inch PMT of both the mean


transit time and the PMT efficiency as a function of position, both taken relative to the center of the tube. For these measurements, the face was illuminated point-by-point with an acrylic Cherenkov source at normal incidence in the single-photoelectron regime. We see from the figure that while the efficiency is reasonably uniform well out to the edge of the PMT, there are significant regions in which the mean transit time is dramatically shifted either late or early, with a total spread of about 4 ns, much larger than the inherent 1.3 ns transit time spread. Such a strong position-dependence could make reconstruction much poorer: an early hit on a tube could be taken as either a photon that illuminated the edge of the PMT (for example) or as due to an event that was closer to the tube by almost a meter, much larger than the 30 cm or so vertex resolution specified in our high-level requirements. Such an effect is mitigated by the many PMTs that are hit in an event (not all will be illuminated near the edge) but acts effectively like a much larger spread in transit times. One can “mask off” the edge of the PMT to avoid these regions, but that then looses area and, hence, photons. Thus we want to choose a PMT that has as uniform a response as possible across the face of the tube.
Gain
As discussed above, we would like to trigger on single-PE pulses at an equivalent threshold of 0.25 PE. This threshold requires that the peak of the single-PE pulse be above the electronic noise level, including sources of pickup. If we assume that this noise level is around 1 mV, and that a worst-case cable dispersion and attenuation effectively reduces the amplitude of the pulse by a factor of 3 or so (based on measurements with long cables), a gain of or more is required to trigger at the desired level.
Many of the events in LBNE will produce large numbers of photons, and very high-energy, through-going muons may lead to a thousand or more PEs in each PMT. To simplify the data analysis, we also want the response of the PMT be linear from 1 to at least 1000 PEs.
Dark Current
PMT dark current caused by thermal emission of electrons from the cathode and dynodes leads to pile-up of noise hits with hits due to Cherenkov light. Higher noise rates increase the rate of accidental coincidence events for a given trigger threshold, force the trigger threshold higher (with a consequent slow turn-on of the trigger efficiency curve), or degrade the energy and position resolution for high-energy events. At the detector ambient temperature, we would like the noise rates to be typically no higher than 1 kHz at the nominal threshold and gain chosen to run the experiment.
A secondary source of dark current is radioactive decays in the PMT glass. These represent the “floor” of the dark current rate, even when the tube is very cold, photons generated from these decays
Wavelength Response
The wavelength response of the PMT should cover the wavelengths that ultra-pure water will pass. The light attenuation of the water is near its minimum for wavelengths around 420 nm and some samples have been known to approach the Rayleigh scattering limit at that point (with an attenuation length of roughly 100 m). By 350 nm, however, the attenuation length (including both extinction and scattering) drops below 100 m and therefore for LBNE these wavelengths will be noticeably attenuated. Therefore we require the efficiency of the PMT as a function of wavelength to peak near 420 nm, with a width of at least 80 nm or so.
Spurious light emission
Nearly all water Cherenkov experiments have had problems with the spontaneous emission of light from PMTs. The behavior of flashing PMTs is very different for different PMT types, and it is likely that the sources of these events are different for the different models. In Super–Kamiokande, flasher PMTs ‘turn on’ for a while and become worse at which point the PMT needs to be turned off for some amount of time. In SNO, all PMTs exhibited the flashing behavior albeit at low rate: roughly 1 flash/week for each PMT, resulting in a detector-wide rate of about 1/minute. In SNO, a suite of cuts (including reconstruction) were developed to remove these events from the final solar-neutrino data set, to reach a level that was below one event in several years’ running. In LBNE, the number of PMTs will be much larger, so that for a given module perhaps 50,000 will be used, resulting in a flashing rate that for SNO-like flashers would be as high as once every 10 seconds. To keep the rate in the final data set as low as was achieved in SNO, under the assumption that a set of cuts can be developed as efficient as those SNO did, we require the PMTs to spontaneously emit light no more often than 1/month.
Stability
Systematic uncertainties on detector position and energy resolution will depend on how well changes to the detector’s behavior can be tracked by calibration sources. Although in principal PMT changes can be tracked very accurately, to do so continuously may create a high overhead on the overall data set. Experiments such as SNO have had variations in PMT gain and efficiency over year timescales at the 1% level, and we want PMTs that have roughly the same level of stability. We do not expect PMT timing to change (other than changes caused by power supply variations) but do not want the probability of afterpulsing to vary by more than 10% or so of its initial value. Noise rates can vary on short time scales due to temperature or power supply variations, but we would like these to remain stable over longer time scales, at roughly the level of a factor of two or so.
Robustness
The PMTs may be exposed to several events which may affect their efficiency. During storage or transport, while in the cavity before and after submersion, the PMTs may be exposed to temperature variations of as much as 40∘C. Similarly, the PMTs may be exposed to high light levels, for example during work inside the cavity or during assembly. During transport, construction, and after installation, the PMTs may be exposed to vibration due to seismic or construction activity in the mine. After such events, our chosen PMT should not show variations in its efficiency or gain of more than 1% and 10%, respectively, and no change to the PMT noise rate (after any necessary cool down period) or more than 10%.
3.2.2 Optical and Electronic Characterization R&D Program
Measurements of the PMT optical and electronic characteristics play three central roles for the WCD.
-
They will inform the selection of the PMT type for the experiment. The experimental physics program is likely to be enhanced by the PMT type that has the best timing or charge response, higher efficiency at the wavelengths expected to arrive at the phototube array through the transfer function of the water or possible intervening mechanical shield, or lower dark current. We refer to this phase of measurements the ‘PMT evaluation phase’ and it will primarily be funded through the NSF S4 grant.
-
The benchtop PMT measurements will help optimize the PMT operational parameters. Measurements of the effects of variations of response as a function of gain and high voltage, different base designs, and magnetic fields, for example, will be necessary to get the best performance out of our chosen PMT.
-
Lastly, a full characterization of the PMT, including all relevant optical parameters for the PMT itself and any associated light-enhancement assembly or mechanical support, will allow us to model the phototube detection process in great detail, thus minimizing systematic uncertainties in the full detector.
PMT Evaluation
The PMT evaluation phase is a near-term project that is already underway. During this phase, the parameters discussed in Section 3.2.1 will each be measured and their impact on the LBNE physics program assessed. These parameters will be measured both with Cherenkov sources at single-PE levels as well as with fast LEDs or lasers to help determine dynamic range and linearity. The effects of magnetic-field compensation on PMT efficiency and timing will also be determined, to help decide how much compensation the full detector will need. To date we have examined several candidate PMTs. Three of the candidates are manufactured by Hamamatsu: a 10-inch high quantum efficiency tube made by R7081HQE, a 12-inch standard quantum efficiency PMT (R11780), and 12-inch “enhanced” quantum efficiency (EQE) tubes. We have received and have begun testing of 12-inch HQE tubes, expected to have peak quantum efficiencies of better than 30%, consistent with our reference design. We have also tested 8-inch PMTs made by ADIT/ETL (9054KB) and are expecting to soon receive 11-inch PMTs from ETL in Spring 2012.
During the evaluation phase, we will examine several of the robustness criteria discussed in previous sections, such as the PMT behavior after high illumination (and any resultant permanent damage). We will also search for any spurious light emission from the PMTs, effects from temperature excursions or seismic vibrations. These studies will have implications for PMT storage and safe handling.
The evaluation phase will include some stability issues, for example determining gain stability over the given period of weeks or months, to ensure that the selected PMT will not require calibrations too frequently.
We have already shown earlier some of our single photoelectron spectra taken with the standard quantum efficiency R11780 12-inch PMTs in Figures 3–2 and 3–3. All of our candidate PMTs are tested at 3 gain settings, , , and . Table 3–2 summarizes the single photoelectron parameters we have measured with ten of these tubes at the lowest gain setting. These measurements were made with a Cherenkov source in air, at room temperature. The Cherenkov source leads to more multi-photon hits in the high-charge tail region, and so the large values in the table for the High Charge region are not a concern.
| Ave Value | Std Dev | min | max | |
|---|---|---|---|---|
| Voltage (V) | 1921 | 166 | 1780 | 2375 |
| Dark Hits (Hz) | 4530 | 1850 | 2630 | 8350 |
| Peak/Valley | 3.17 | 0.32 | 2.63 | 3.63 |
| Transit Time Spread width (ns) | 1.33 | 0.07 | 1.20 | 1.44 |
| Late Pulsing (%) | 3.63 | 0.34 | 3.21 | 4.09 |
| High Charge (%) | 7.97 | 0.90 | 6.67 | 9.68 |
We have also examined the efficiency of the 10-inch HQE R7081 compared to a Super–Kamiokande 20-inch PMT (R3600), illuminated by a Cherenkov source, as a way of verifying the scaling between Super–Kamiokande-II and LBNE. The set-up is shown in Figure 3–7, with each PMT inside a -metal box that brought the ambient magnetic field below 50 mG. Our measurements showed that the relative photon detection efficiency between the two PMTs was consistent with the ratio of the published quantum efficiency curves, averaged over the Cherenkov spectrum. This has allowed us to predict the number of PMTs needed to reproduce the Super–Kamiokande-II overall light collection levels.


As shown earlier in Figure 3–6, part of our evaluation process is to determine the relative efficiency across the photocathode and the position-dependent mean transit time. An efficiency that drops off well before the edge of the photocathode means the PMT has less usable area; transit times that vary widely across the photocathode face make reconstruction difficult. We have made these measurements with an automated scanning arm we have developed, shown in Fig. 3–8. The device positions the Cherenkov source (viewed through a pinhole mask) precisely along the photocathode face, at normal incidence, and can follow the contours of any PMT shape thus making it very useful for comparing different PMT candidates.
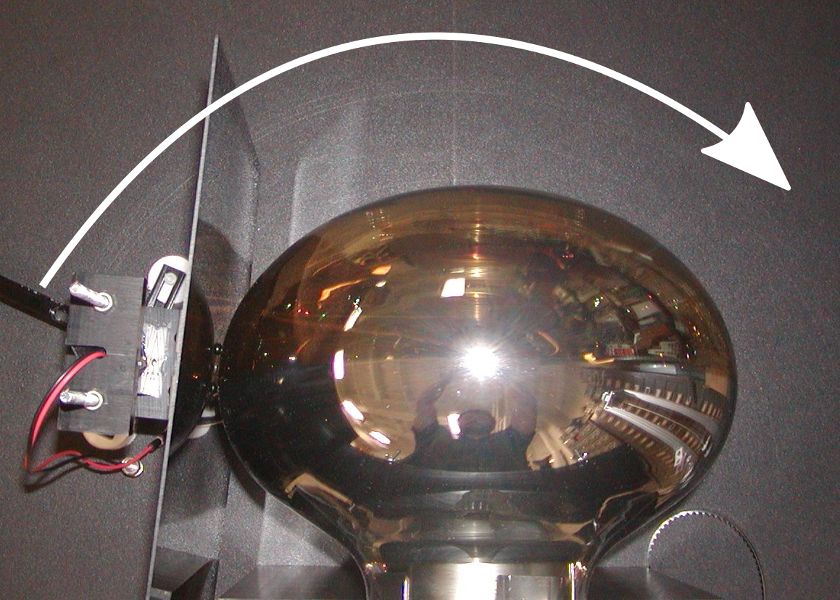
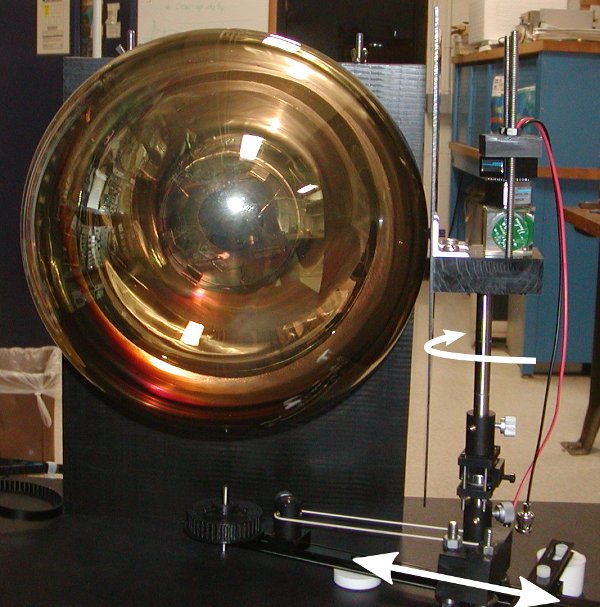
We have already given the data generated with our scanning arm to Hamamatsu, who has confirmed the shifts in mean transit time shown in Figure 3–6 and have already developed a new dynode design that they believe will make the transit time much more uniform. We expect to be testing these tubes in the coming year.
We have also begun measurements of the rate of PMT afterpulsing, using a high illumination from an LED source. As Figure 3–9 shows, for the 10-inch high quantum efficiency PMTs there are two and perhaps three afterpulsing timescales. The rates are in fact higher than we would like—a consequence, according to Hamamatsu, of the super-bialkali photocathode material. They believe that they will able to reduce the afterpulsing rates with changes to the design.
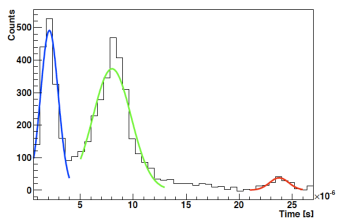
PMT Performance Optimization
The performance optimization program includes tasks intended to determine the effects of the light-enhancement assembly, the required magnetic field compensation, and the PMT gain and voltage distribution. The tasks will include measurements of PMT photon-detection efficiency as a function of position and angle across the photocathode face for Cherenkov light in water (and air). These measurements will determine the relative efficiency of different PMT candidate models and inform the design of possible light-enhancement assemblies. Studies of the PMT timing and efficiency as a function of magnetic-field compensation will determine how much the Earth’s field will need to be cancelled underground in the detector volume.
The operating gain of the PMT will also need to be optimized to ensure clean observation of signal pulses above noise after the cable dispersion and attenuation, to determine whether the PMT timing can be narrowed with higher voltages, and to ensure that dark current remains at reasonable levels. A further optimization of the voltage distribution across the PMT dynodes may involve fixing the cathode-to-first-dynode voltage for all PMT gains using zener diodes for the first two stages of the base circuit. This fixed voltage may improve both the peak/valley ratio for individual PMTs (because the voltage from cathode to first dynode can be made higher without raising gain) and also reduce PMT-to-PMT variations in charge and timing resolution. The effects of these different voltage-distribution schemes on other phenomena such as latepulsing and PMT ‘flashing’ will be studied during this phase.
A further optimization task during this time will be the determination of cable-transmission characteristics that will help minimize signal loss. In addition, cable compensation schemes may be investigated to remove the dispersion in the PMT signals in order to obtain better timing and charge resolution after the signals pass through the long cables.
Full Characterization of PMT Response
The longest-term program will be the full characterization of the PMT and its assembly, including any light-enhancement addition. Our goal is a complete optical model for the PMTs that can be used in the Monte Carlo simulation of the detector. Previous experiments, including SNO and Auger, have been able to measure and model not only the properties of the PMT glass, but the complex index of refraction of the photocathode material and optical properties behind it, such as the reflectivity of the dynode stack. This has the advantage that it provides a physical model for all incident wavelengths and angles of light. Correlations between photon timing from PMT reflections and PMT inefficiencies are naturally taken into account. Ultimately, such modeling reduces systematic uncertainties of the detector by correctly predicting the energy response and vertex accuracy of the detector as a function of position within the detector.
This PMT characterization program will require several light sources of different wavelengths and different incident angles on many PMT samples. It will need to be done across many PMT batches, as optical properties have been known to vary during the manufacturing process (sometimes intentionally). The optical parameters will be used to build a full PMT model that can then make predictions for Cherenkov sources and be tested against those sources to see the degree of agreement.
In addition to the optical model, the final timing and charge model, with the fully optimized PMT, will be done during this time and added to the simulation. The end result will be a complete PMT model that can be used in simulations up until the time the detector begins to take data. At that point, in-situ measurements will either confirm the ex-situ model or replace it, based upon the planned LBNE calibration suite.
3.3 PMT Mechanical Characteristics (WBS 1.4.3.2.2)
The PMT is going to be subjected to the harsh environment of the WCD. This environment includes being immersed in ultrahigh-purity water and being subjected to high hydrostatic pressures found within the WCD vessel. The challenges this places on both the glass material, and envelope shape of the PMT will be covered in Section 3.3.3. The primary objective, and the key challenge, of the mechanical characterization program is to minimize the risk of single-PMT implosion and eliminate the risk of a catastrophic chain reaction of PMT implosions.
There are multiple issues that impact the risk factor concerning the mechanical stability of the PMT assembly. We briefly list them here:
-
1.
The maximum absolute pressure at the bottom of the water Cherenkov detector will be 890 kPa (8.9 bar) at a water depth of 80 meters. This pressure will act on either the PMT or any enclosure that might protect the PMT.
-
2.
The water will be ultrapure to allow maximum transmission of Cherenkov photons from events. Deionized water (18 M-cm) of such high purity can be corrosive and the hydrolytic properties of the PMT glass and/or the enclosure over a long period need to be understood.
-
3.
Two options exist regarding placement of the PMT in the water. Our reference design places the PMTs with the glass bulb in contact with the water; they are therefore subjected to the full hydrostatic pressure. In this case, the PMT base must be encapsulated to be watertight. Alternatively, the PMT can be completely encased in a pressure housing that prevents contact between water and bulb; in this case the PMT itself does not need to withstand the full static load.
-
4.
The PMT glass bulb will be under compressive stress over most of the bulb, nevertheless the shape of the PMT glass bulb will impact local stress conditions in the glass. This shape will be studied to obtain optimum performance.
-
5.
External devices such as the base encapsulation could lower implosion risks and/or change the mode of implosion. A full pressure vessel would eliminate the implosion risk, but would introduce higher costs and other risk factors regarding the enclosure itself.
-
6.
Even after good quality control, there will be a finite probability for a single random PMT to implode and set off a pressure pulse that could cause nearby PMTs to implode. The characteristics of such a shock wave need to be understood. The characteristics will depend on the size of the glass bulb and the nature of the implosion.
-
7.
Along with understanding the shock wave a conceptual scheme for mitigating the effect of the shock wave will be created. There are multiple paths for such mitigation: the PMT glass bulbs could be strong enough by themselves to withstand the shock, or a partial enclosure of the PMT that leaves the light sensitive dome uncovered could slow the intensity of the shock wave and/or direct it away from its neighbors.
The program outlined below uses an existing knowledge base from previous experiments, expert information from the PMT vendors, new expertise from material sciences and engineering, computational modeling, and finally, actual testing to gain confidence in our approach to reach a robust, tested, and economical design. We have already completed a number of milestones. These will be summarized below.
3.3.1 Goals of the Program
-
1.
Ensure that the maximum failure rate by implosion does not exceed 0.5%/yr. The overall requirement for a single PMT channel including base and cable is a failure rate of less than 1% per year. This translates to 90% of the tubes remaining “alive” over the lifetime of the experiment, in accordance with the science goals.
-
2.
Ensure that, in case of a PMT implosion, neither the resulting inward motion of the water nor the following outward shock wave causes implosion failures of any neighboring PMTs. The total energy released in an implosion would be the product of the pressure and volume of the PMT, . For kPa and liters (for a typical 12-inch diameter PMT), the energy released will be about 11 kjoules. This energy will go mostly into the kinetic energy of the water around the PMT. It will first convert into inward motion of the water and then a shock wave transmitted outwards when the inward flow is interrupted by the impact of the water on itself.
-
3.
Study and eliminate risks of an individual PMT implosion introducing failures in neighboring support structures, active structures such as cables, or the water-containment liner.
It is clear that these goals can be easily achieved by simply placing the PMT in a pressure enclosure. But as we remarked earlier, one of the goals of the development program is to perform the same task in a more economical way that is also better suited to physics: namely place PMTs in contact with water without any additional windows between the PMT sensitive face and the detector for the best optical performance.
3.3.2 Previous Experience
The experience for placing glass in water Cherenkov detectors is mixed. However two previous experiments at a sufficiently large scale provide us valuable experience.
The SNO experiment had 9438 inward facing and 91 outward facing PMTs (8-inch diameter Hamamatsu R1408, average glass thickness 2 mm) made from Schott 8246 glass. These tubes were placed in ultrapure water at pressure depths ranging from 160 kPa to 310 kPa. The tubes were housed in an ABS plastic holder, which also formed a light-concentrator. In approximately 8 years of operation, SNO did not experience any PMT implosions and no chain reaction events.
The second example is Super–Kamiokande in which there are approximately 11,000 PMTs (20-inch diameter Hamamatsu R3600, average glass thickness 4 mm) and 1900 outward facing PMTs (Hamamatsu R1408) most of which were recycled from the IMB experiment. The tubes are in ultrapure water at a maximum pressure of 480 kPa. There are 1800 tubes at the bottom experiencing maximum pressure. The Super–Kamiokande detector ran from 1996 to 2001 (4.6 years) with high efficiency and no failures. In November 2001, during a refilling operation after some repairs, an apparent cascade of implosions triggered by a single PMT implosion (at 400 kPa of pressure) destroyed more than half the PMTs in the detector. Since that event the detector was refitted twice: once by redistributing the remaining tubes and later by rebuilding the entire detector, known as Super–Kamiokande-II. In the post chain reaction phase, the PMTs were covered by an acrylic shell that slowed down the in-flow of water to prevent a shock wave and the subsequent chain reactions. The Super–Kamiokande collaboration has kindly offered documentation and expertise gained due to this unfortunate accident.
In brief, the conclusion of the analysis of the Super–Kamiokande event is as follows: the single PMT that triggered the chain reaction was most likely damaged due to impact during the upgrade work at the neck. Computer modeling indicated that a shock wave was generated 10 ms later (due to the large size of the Super–Kamiokande tubes the time scale for implosion is long), and that the peak pressure on adjacent tubes was more than 10 MPa with a width of 50 s. Finally, testing showed that the shock wave itself was responsible for failures in adjacent tubes; it was not the movement of the PMTs or other collisions.
Super–Kamiokande has been rebuilt to have the original-design number of PMTs, except for the acrylic shells on each tube, and has been running since 2006 with no PMT implosions.
Table 3–3 compares the SNO and Super–Kamiokande experience with the water
| LBNE | SNO | Super–Kamiokande | |
|---|---|---|---|
| Tube | 11–12 inch | Ham-R1408 | Ham-R3600 |
| Dia (cm) | 28–30 cm | 20 cm | 50 cm |
| Thickness (mm) | 2–4 mm | 2 mm | 4 mm |
| Pressure (kPa) | 880 | 315 | 480 |
| Stress (MPa) | 17 | 7.8 | 15 |
| Number | 29000 | 9500 | 11000 |
| lifetime (yrs) | 20 | 10 | 5 |
Cherenkov counter for LBNE. The simple stress formula for a spherical bulb to compare the stress level experienced in the glass:
where is the static pressure, is the radius and is the thickness. The table shows that in fact the stress performance needed for LBNE is somewhat higher than Super–Kamiokande, but should be obtainable with careful design.
An example in which there were problems in the quality control of the PMT is with the DIRC detector in BABAR. Extensive analysis[23] showed that the glass used for some of the PMTs had an incorrect composition and became frosty after a few years of water immersion due to dissolution in the water. This report concludes that good care is needed in selection of the glass materials for the PMT, although the overall experience from previous projects is quite good.
3.3.3 Glass Strength
The static pressure performance of the PMT will depend on the stress level in the glass shell, whether the glass is in compression or tension, the surface characteristics of the glass bulb (including damage due to abrasion and handling), and finally the stress induced corrosion of the glass bulb over the lifetime of the experiment in the ultrapure water.
The typical glass used for the PMT bulbs is called borosilicate glass which has about 70% and 20% , with the rest made of various metal oxides. The exact chemical makeup of the glass varies for different suppliers. A single PMT vendor may use several glass suppliers. Moreover the properties of the glass depend on the annealing temperature and the cooling conditions used during the bulb-making process.
The theoretical strength of glass is known to be as much as 20 GPa[24]. But in normal circumstances glass strength falls short by as much as 3 orders of magnitude. The stress levels shown in Table 3–3 are within a factor of 2 of the breaking point of ordinary glass. The actual shape of the bulb will raise the stress level in the neck of the PMT bulb if the thickness is the same for the entire glass envelope. Therefore careful attention will be needed in the design of the bulb.
Considering that there will be 100 tons of glass in the form of PMTs, this is perhaps the most crucial component of the detector. As a result of this importance, the following program of activities will be carried out:
-
1.
We have sought glass expertise from the Inamori school of engineering at Alfred University in New York. Specifically they will test the glass supplied by our vendors and qualify it as suitable for the WCD PMT. An initial report based on measurements with rods and flat samples made of supplied glass is in preparation for CD1. They will in addition perform full static fatigue testing, accelerated testing, and advanced predictions on glass failure.
-
2.
We have identified specific industrial tests (ISO-719 and ISO-720) that are meant to characterize the hydrolytic capabilities of PMT glass. The hydrolytic rating for Schott glasses is well known and in fact can be calculated using previous data if the glass composition is known. We have performed these calculations and found that the glasses used by Hamamatsu and ETL fall in the hydrolytic class 1 with the lowest dissolution rate for the ISO-719 test. Nevertheless, we intend to perform the more stringent ISO-720 test.
-
3.
There has been on-going interaction with the PMT vendors specifically concerning the glass. The requirements on the mechanical and chemical aspects of the glass will be created in collaboration with Alfred University.
-
4.
Specifications on the handling of the PMTs will be created for both transport and storage since it is clear that surface damage to the glass can have impact on its pressure performance.
Time to failure of glass tubes
The PMTs will be submerged under ultra pure water up to a depth corresponding to 880 kPa of pressure for 20 yrs. It is well known in the glass material sciences that glass can undergo stress-induced corrosion. Detailed models for this corrosion vary, however the main mechanism is thought to be due to small surface cracks in glass. The cracks act as concentrators of stress. When they become sufficiently deep due to corrosion the concentrated stress will eventually exceed the strength of glass. Stress induced corrosion will eventually lead to failure.
It is required that the probability of failure vs. time not increase. If there are to be failures we prefer that they begin rapidly after a fixed period of time (infant mortality).
Since the measurement of the time to failure curve cannot be practically performed by measurements over very long periods of time, it is necessary to develop other methods to predict it.
The SNO collaboration used previous data on fracture stress versus time to arrive at a conservative accelerated testing protocol: testing at twice the pressure for 1 hour is equivalent to 20 yrs at normal pressure. If we follow this protocol, LBNE PMTs need to be able to withstand 1.9 MPa of pressure for 1 hour to be qualified.
Using recent data in the literature in the last 20 years since the development of SNO, our Alfred colleagues have suggested that we perform measurement of the pressure at failure (PAF) as a function of the rate at which the pressure is applied (loading rate). The PAF is expected to be lower at smaller loading rates. Ideally we prefer to have glass that has independent of the loading rate. A sufficiently large sample of bulbs will be used to perform measurements of PAF under different loading rates. The model of crack formation and propagation allows us to relate the measured curve to the time to failure. The method of Wiebull statistics will be employed to use the statistically limited data.
An illustration of static and dynamic fatigue curves is in Fig. 3–10.

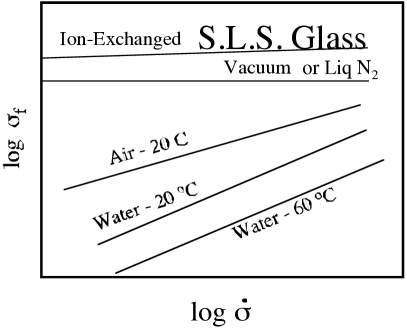
Testing and Modeling Studies
Pressure performance of the PMT bulbs will be tested in a dedicated pressure vessel at BNL. The pressure vessel is instrumented with both static and dynamic pressure sensors as well as a fast motion camera. Several tests have been carried out with a few samples of PMTs from three vendors. The pressure was raised hydrostatically in small increments until the bulb imploded (see Fig. 3–11).
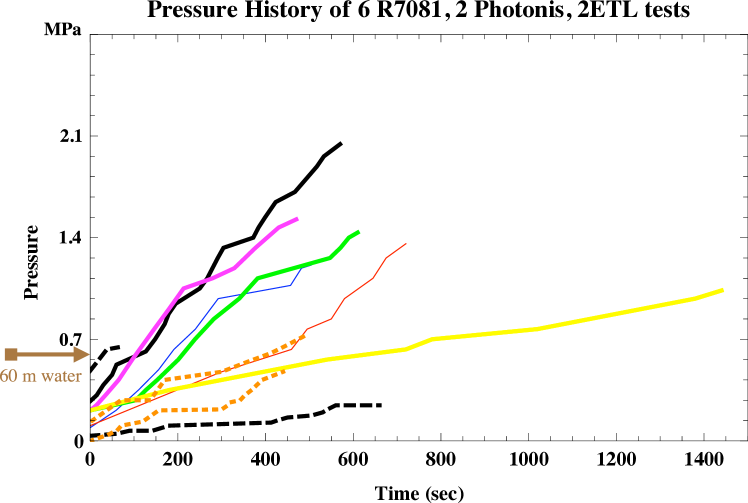
The video of the breakage and photographs of the remaining shards were used to understand the mode of failure. For each tube tested, an extensive database has been developed to record the thickness of the tube (with an ultrasonic gauge) at various locations, any dimensional irregularities, as well as surface imperfections such as bubbles in the glass or a layered appearance.
With these initial tests we have understood the basic parameters of a PMT implosion: the static pressure, the time scale of implosion, the instrumentation needed to measure the implosion, etc. We have also understood that the pressure rating supplied by Hamamatsu on the R7081 of 0.8 MPa is essentially correct since of the 6 tests no R7081 tube imploded below 1.0 MPa. Several more tubes were cycled up to 0.95 MPa several times with no failure. The BNL facility will now be used for higher statistics long term testing. Pressure control instrumentation is in development to allow variable loading rates for testing. The loading rates could vary from 0.1 MPa/min to 0.1 MPa/week.
This initial testing has resulted in several important outcomes:
-
We found that the weakest spot for the R7081 bulb is at the base where the glass is joined to allow penetration of the high voltage pins. All bulbs that were tested without potted base encapsulation failed at this point. For other vendor tubes the weak spots were in the neck.
-
We have calculated, using ANSYS finite element calculation, the stress level in the PMT bulb for the nominal thickness and the bulb geometry specified by the vendors. An example of such a calculation for the maximum principle stress is in Fig. 3–12. This calculation included the potted base encapsulation to prevent the failure at the neck. This calculation showed that even after protecting the weak spot, the R7081 bulb geometry appears to have high stress levels in the dome due to the squashed (non-spherical) geometry of the bulb.
-
A similar calculation for a 12 inch bulb with a more spherical bulb showed that the stress levels in the bulb could be lowered by optimization of the bulb shape.
-
As a result of our interactions with Hamamatsu and ETL, both vendors have produced new bulb shapes for 12 inch and 11 inch PMTs. A single 12 inch R11780 bulb with a potted base encapsulation has been tested at BNL to 2.1 MPa without implosion failure. This bulb was exercised for 1 hour at 0.86 MPa and for 1 hour at 1.61 MPa which satisfies the criteria derived by SNO for LBNE conditions.

We have already obtained or ordered several dozen mechanical samples of the Hamamatsu 12 inch R11780 and the ETL 11 inch bulbs. These will be systematically tested over long time periods in the BNL pressure vessel in the coming months.
Decision on Pressure Hull Housings
If the dynamic fatigue tests combined with the analysis of glass indicate that there is substantial probability of PMT failures before a 20 year lifetime, we will deploy pressure hull housings (see Section 3.4.3) on the PMT bulbs. In this case, the PMT bulbs will no longer be in contact with the ultra pure water. The effect of the pressure hull housings on the optical performance must also be understood.
Quality assurance plan during production
The time to failure data will be continuously improved during the PMT production period. We anticipate that we will obtain mechanical samples of bulbs during production. These bulbs could be bulbs that have failed the electrical tests. It is at this time unclear how many such bulbs will be available. We are planning to utilize these mechanical samples corresponding to 1% of all production for destructive testing at various loading rates. At present time, this sampling rate corresponds to approximately 100 to 300 bulbs per year as the production proceeds.
-
1.
The mechanical samples will be obtained uniformly during the production period.
-
2.
We will require that these samples correspond exactly to the final product in mechanical detail, but may have failed electrical tests.
-
3.
The BNL pressure tank or another similar pressure tank will be moved to the final production facility for these PMTs. Dedicated technical staff will test each of the mechanical samples at different loading rates.
-
4.
The data will be combined to obtain a high statistics dynamic fatigue curve.
-
5.
The testing will also determine uniformity of performance during the entire production period. If there is significant deviation in the performance of the bulbs there will be feedback to the vendor.
3.3.4 Mitigation of PMT Implosion Cascade
Description of the Problem
As we have remarked above the implosion of a 10–12 inch glass bulbs will take place over a 5 ms period. During this period water will rush inwards through the breakage in the glass. At the end of this period the water velocity will come to an abrupt halt and the kinetic energy of the water will be transformed into a shock wave propagating outwards.
The shock wave is characterized by the time at which the shock wave starts after the beginning of the collapse, the peak pressure in the shock wave, the width of the shock wave. The total impact energy in the shock wave is an integral over the shock wave width, and it will fall as where L is the distance from the tube.
A back of the envelope calculation of the peak pressure in the shock wave can be performed using some simplifications. We assume that it is an isothermal process, and about half of the released energy is converted to compressive energy. Using the bulk modulus of water of GPa, we obtain the following by dimensional analysis:
Here is the peak pressure, is the static load, is the volume of the PMT, and is the volume of the pressure pulse as it passes the neighboring PMT. We assume the pressure pulse volume to be , where is the radius of the tube. For m, m, , the peak pressure is calculated to be 8 MPa. This is an overestimate of the peak pressure because the approximation does not take several things into account. In particular, the speed of the implosion process, in which the glass might break at various places differently, has a big effect on the timescale of the process. Nevertheless, the formula shows two interesting effects: the peak pressure appears to rise as the square root of the static pressure, and the peak pressure drops as from the PMT. The actual situation will be more complex, but the lesson from the simple analysis is that the scaling with static load and distance will not be linear or as , respectively.
In the following we will describe that we have obtained the use of a facility where we can gain full understanding of the dynamics of the PMT implosion event. We have performed preliminary tests and carried out sophisticated simulations that perform well against experimental data. With the test facility described below we will be able to perform a complete final test using the fully designed PMT assembly and the actual pressure conditions in the detector.
Description of the Propulsion Noise Test Facility
We haven chosen to perform the dynamic PMT implosion testing in a facility of the U.S. Navy called the Propulsion Noise Test Facility (PNTF) located at the Naval Underwater Warfare Center (NUWC) in Newport RI (see Fig. 3–13).
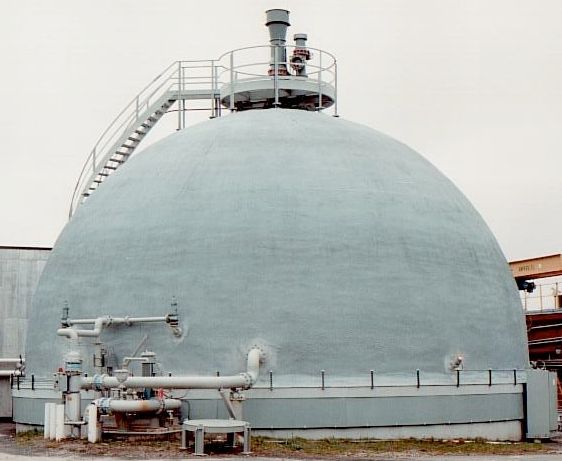
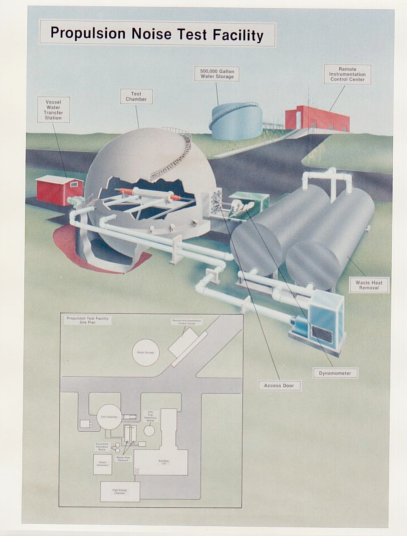
The facility consists of a 15 m diameter spherical steel vessel with capacity of 500,000 gallons of water. This vessel is certified to be pressured to 0.86 MPa at the top of the vessel. It is also certified for large explosive charges. By simulation we have established that the facility satisfies the requirement of both being large enough to cause a shock event and to allow measurement of the shock event up to 10 ms. The vessel has two ports for entry. One of them is 48 inch across. The port opens onto an inside deck which we can use to place the PMTs and other apparatus for testing.
BNL and NUWC have entered into a Cooperative Research and Development Agreement (CRADA) for the use of this facility.
Implosion testing at the PNTF
We have planned the PNTF testing in three phases:
-
1.
Phase I completed in December 2010[25]. The purpose of phase I at PNTF was to establish that the facility is indeed appropriate for our use. In this test, PMTs were imploded by using a hydraulic poker at static pressure of 0.71 MPa. The pressure field and motion of the water around the PMT were measured using blast sensors (model 138A01 by PCB piezoelectronics). The event was captured using fast motion cameras from two angles at a rate of 6000 frames per second.
Figure 3–14 shows the PMT setup structure and the sensors around the PMT.
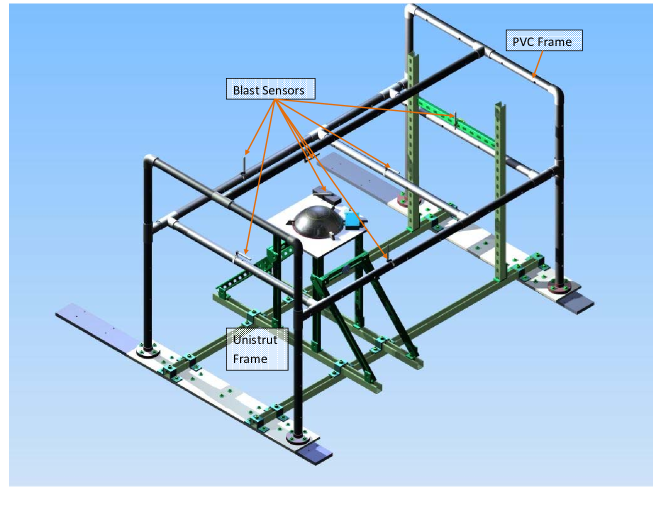
Figure 3–14: Test stand with PMT and instrumentation A plot of the pressure time history of one sensor (ACC5) is shown in Fig. 3–15.
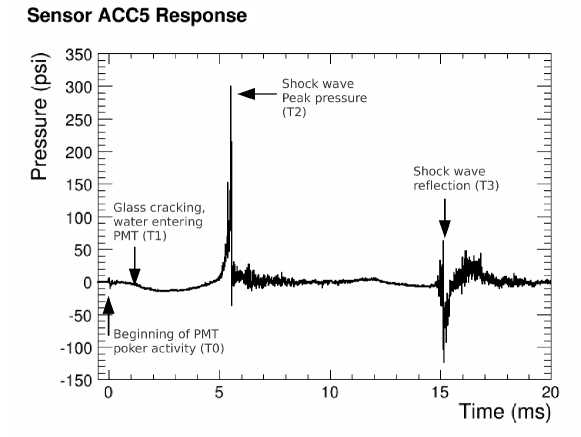
Figure 3–15: The pressure time history of the PMT R0249 implosion recorded by blast sensor ACC5. The vertical axis is the over pressure in the PNTF (100 psi700 kPa). At time “T0”, the sensor detected the hydraulic cylinder force as the glass started to crack. After about 1 ms and at time “T1”, the PMT collapsed, high pressure water started to rush in.The sensor detected the sudden drop of the water pressure as the collapse-phase ended.At that moment the velocity of the water became zero. The hydrostatic pressure used in these experiments caused the water to achieve a very high velocity during the collapse-phase. Upon closure of the PMT volume, the rapid change in water momentum caused compression of the water, and then a radial pressure wave (“T2”). The pressure wave propagated toward the pressure vessel wall and then was reflected back toward the center (“T3”).
Full details of the phase I test and the simulations have been documented[25].
-
2.
The purpose of the phase II tests will be to obtain first data on the response of nearby PMTs to an implosion event. This test is currently planned for the fall of 2011. A total of 3 tests will be conducted with 5 PMTs each. The PMTs chosen for this test are the R7081. It is clear that the final choice of PMT for LBNE will most likely not be the R7081, nevertheless we have gained considerable confidence in the modeling of the implosion event, and therefore with good data using the R7081 in a configuration that closely matches the LBNE design, we should be able to use the model to extrapolate to the final design. The assembly to be used in the phase-II trial is in Fig. 3–16.
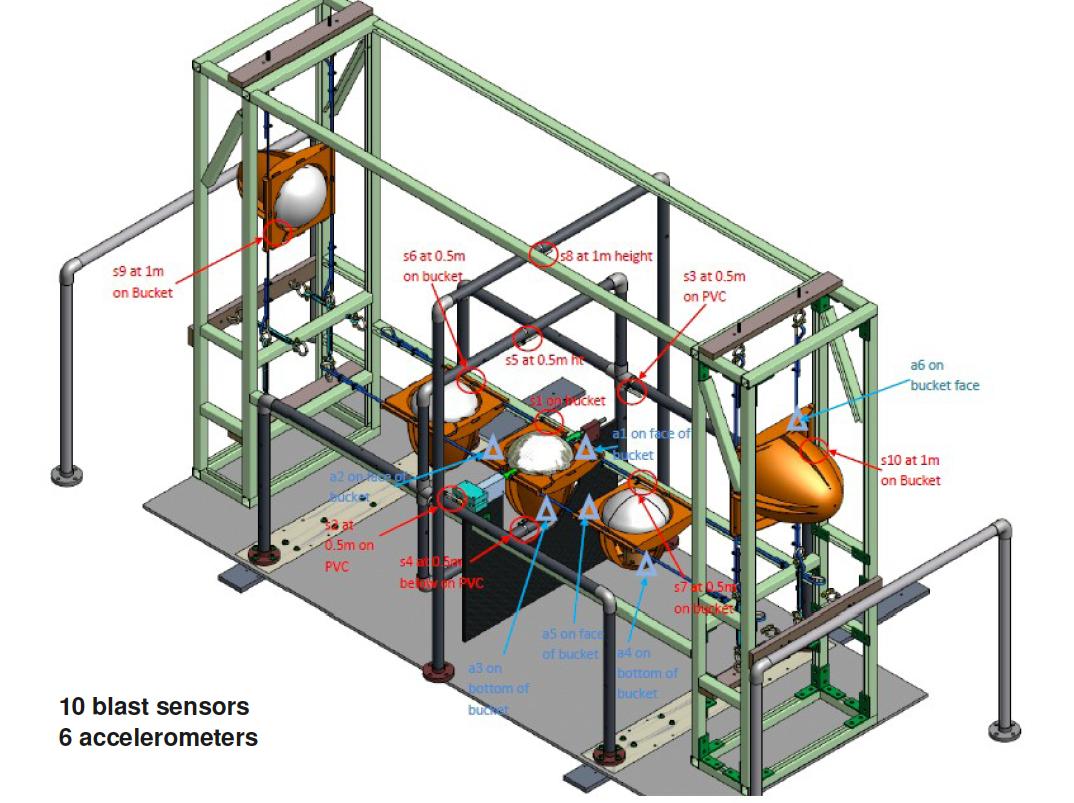
Figure 3–16: The 5 PMT assembly using PA housing design and wire rope assembly in horizontal configuration. The central tube will be imploded using a hydraulic poker system as for Phase-I. -
3.
The purpose of the phase III tests at NUWC will be to test the final PMT Installation Unit (PIU) assembly in a realistic environment. The PIUs will be assembled from PAs using candidate PMTs and with near complete design for the housings. One of the PMTs will be mechanically induced to implode and the resulting cascade, if there is a cascade, observed with fast motion cameras and blast sensors. It is expected that we will need two tests with some conditions varied to get good data. As an example, when the Super–Kamiokande incident was reproduced a total of three tests were performed. After the two initial tests in the spring of 2013, there will be two final tests with the final design of the PIUs for verification. It is anticipated that these final tests will also include other support structures such as the water-tight liner and cable assemblies.
Dynamic Simulations
The hydrodynamic simulations present a significant challenge because the implosion collapse and the shock pulse are a complex problem requiring details of the glass, the motion of water, a model of all the material that gets compressed as well as all the anisotropies present in the PMT. The relatively simple 2D simulations have given us a basic understanding of the process, but the numerical value of the peak pressure in the shock wave has a very large error. For example, the simulation performed for Super–Kamiokande after the accident over-predicted the peak pressure in the shock at 50 cm from the 20 inch tubes to be 13 MPa, but was measured to be 5.6 MPa. The time scale for the generation of the shock was, however correct.
The basis for the numerical models used in addressing the various experiments as well as appropriate sensitivity studies is the Arbitrary Lagrangian Eulerian (ALE) formulation provided by the LS-DYNA explicit code which enables the study of both fluid and solid parts and their interaction under highly non-linear processes associated with the PMT implosion. The capabilities of the TrueGrid software were utilized to generate an accurate 3-D description of the various test configurations. The analysis performed are considered “blind” predictions due to the fact that (a) they were all performed ahead of the experiments and (b) it was necessary to make certain assumptions regarding governing the PMT glass material. Specifically, the properties of float silica glass adopted into the Johnson-Holmquist constitutive model were used to describe the PMT glass wall in the implosion simulations.
Following the benchmarking of the numerical processes and the validation of the BNL small-scale hydrostatic tests, a numerical model was developed to analyze the PMT implosion tests within the large pressurized vessel at NUWC facility with a hydrostatic pressures of 88 psi and the implosion of the PMT was initiated with a mechanical device. By taking advantage of the symmetry plane a model consisting of a total of 2,240,000 elements representing the PMT glass structure (Lagrangian) and all the fluid volumes (Eulerian) was developed. To ensure that the pressure driver of the implosion is not lost following the fracture of the PMT wall, a large volume of the surrounding water was used along with radiating boundaries at the water volume edge. The implosion analysis consisted of an initialization phase establishing the state of stress in the PMT wall followed by a transient phase capturing the glass damage initiation and the subsequent implosion. The duration of the glass implosion was of primary interest, given the ambient pressure of 88 psi (600 kPa) and the subsequent pressure intensity and spatial attenuation. An Analysis time of 6 ms following the PMT fracture initiation was used. Figure 3–17 depicts the initiation of the shock within the volume of the PMT followed by the outward propagation.

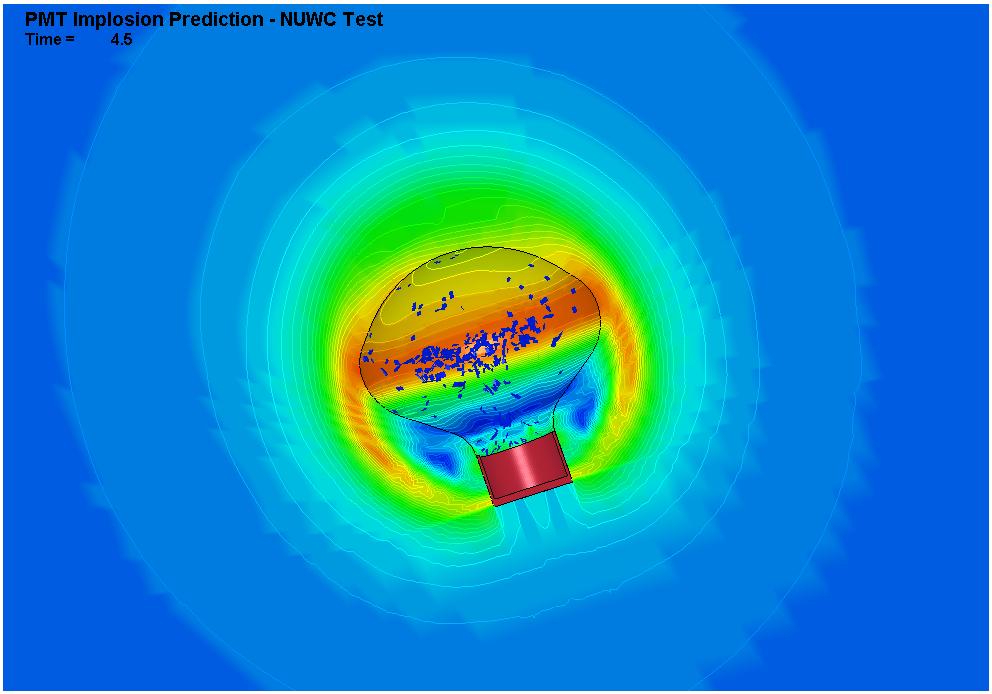
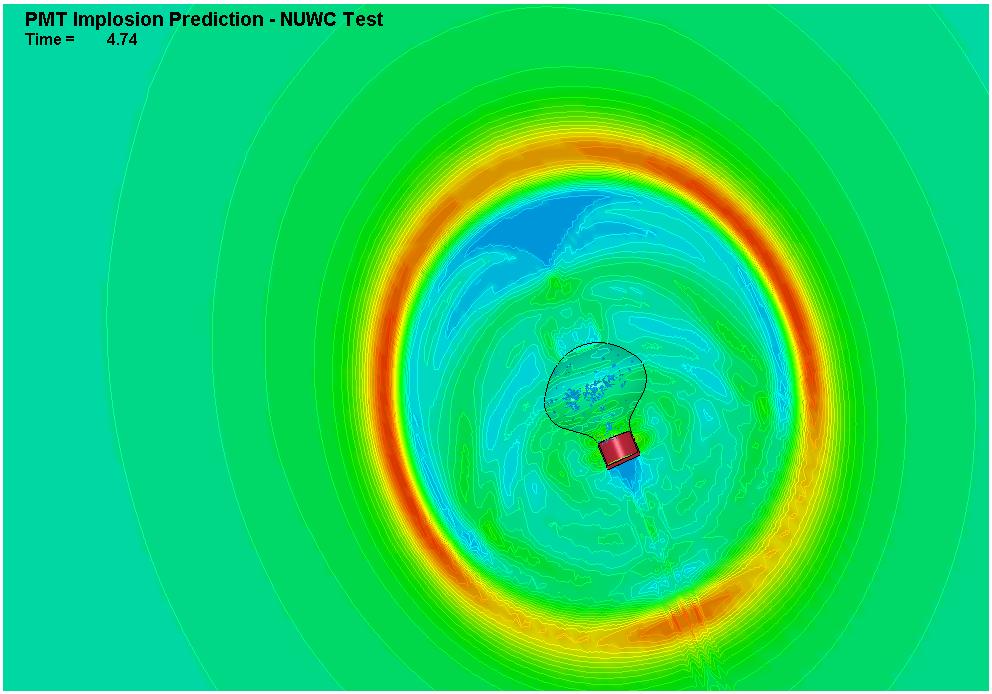
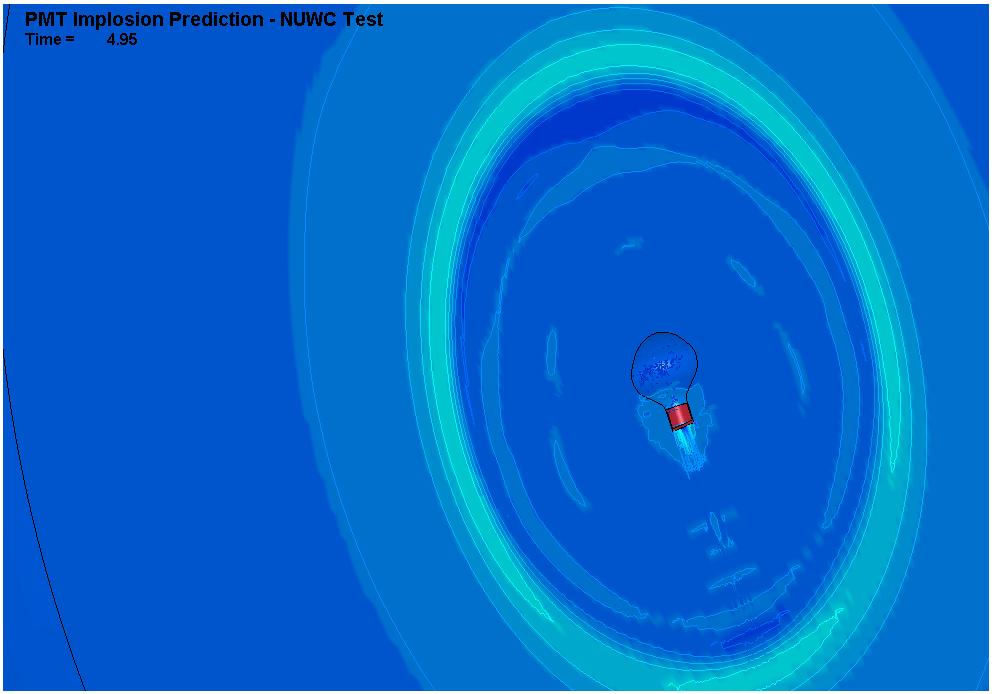
The analysis indicates that the collapse process for the 88 psi ambient pressure will take approximately 4.4 ms from the moment of wall fracture initiation.
The simulated pressure pulse intensities as well as their arrival at locations in the surrounding volume where pressure sensors were to be placed during the actual tests are compared with the real tests. Shown in Fig. 3–18 are pressures near the mechanical device used to initiate the fracture that is close to the PMT wall (ACC11) and at 0.5 m (ACC1, ACC2, ACC3 and ACC4) radial distances from the center of the PMT. The simulated pressure time histories agree with the real test data fairly well. There are some differences between the real tests and the simulation. In the simulation, sensors’ pressure readings drop dramatically at the beginning of the implosion, while it is quite smooth for the real data. And the duration of implosion for the simulation is always shorter than the actual tests by around 0.5 ms. These differences are most likely related to differences in the properties of the glass. Because of the lack of Borosilicate glass properties for the simulation, normal silica glass properties are used instead by the simulation. It seems that during the cracking phase of the actual Borosilicate glass, that the glass stays somewhat intact with the pressure not dropping dramatically. However normal silica glass cracking speed is very fast, so a big drop in pressure is shown in the simulation. Another main difference for the real tests and the simulation is in the peak pressure value. The simulated peak pressure is relatively smaller than the actual test data by about 90 psi. Since the peak pressure is also strongly correlated with the glass cracking, it may also related with the property of the glass. Generally speaking, current simulation describes the PMT implosion process fairly well, even when different glass properties are used.
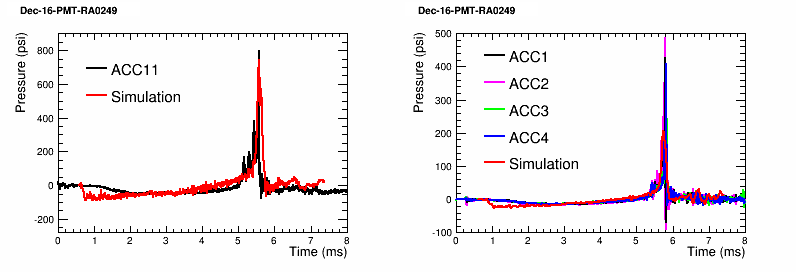
The description of the data and results of this simulation are in the paper[25]. Further details of the successful simulation program will be in another paper that is in preparation. The LS-DYNA based simulation is being extended for the much larger problem of multi-PMT chain reaction simulation. It will be validated by the phase-II campaign already underway at NUWC.
3.4 Other PA and Light Collector Components
3.4.1 Base (WBS 1.4.3.3)
The Base consists of printed circuit board (PCB) with a voltage divider network and its waterproof housing. The design of the voltage divider is discussed in Section 4.2. The actual assembly of the base components into a complete base, mounted on the PMT, can be found in the PA Integration Section 3.5.1.
Functionality
The primary functionality of the base is to provide the appropriate high voltages and impedances to the various pins (and hence, dynodes) of the PMT. The PCB provides this functionality. The reference electrical design consists of a simple, printed circuit board carrying only passive components. A prototype PCB of the same general design, showing the general shape, size, and connection to the PMT pins is shown in Figure 3–19.
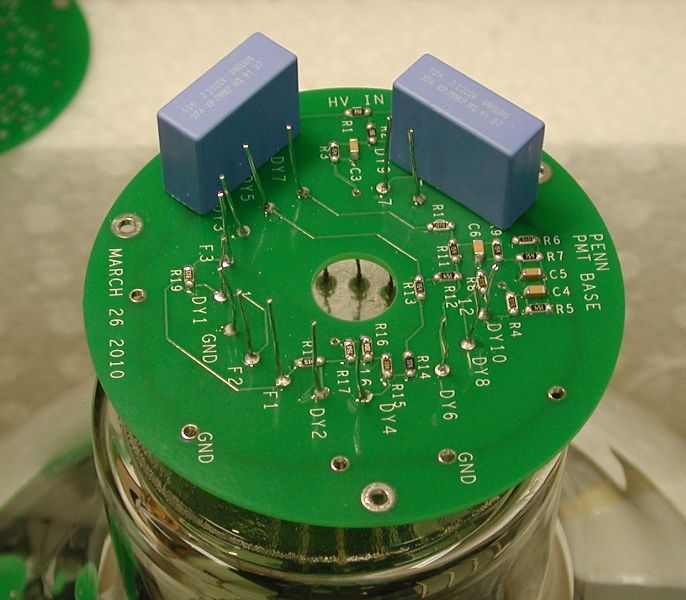
High Voltage and a signal path to the front end electronics are provided by a coaxial cable 3.4.2, one end that is soldered to the PCB and at the other end is connected to the front end electronics (Chapter 4).
Another primary functionality of the base is to provide a hermetic seal to the PMT neck and to the exiting coaxial cable, in order to prevent the water/moisture from entering the interior of the base. The waterproofing material is a dielectric insulator. It needs to withstand water at the depth of the PMT and provides mechanical support of the PMT and cable interface. Figure 3–20 shows the a reference design for the base as it is mounted on the PMT.

A third functionality of the base is to strengthen the “foot” region of the PMT. This region, where the pins penetrate the glass, has been found from our testing in Section 3.3 to be the weakest part of the PMT glass envelope. Our prototype bases have been able to transfer the stresses from the foot onto the neck area, successfully increasing the pressure resistance of the PMT.
The base waterproofing materials should be free of radioactivity to the extent possible to minimize background sources, must be compatible with the high purity water in the WCD vessel and with each other to achieve the purity requirements. They must also be compatible with the addition of Gadolinium, that may be added to the water.
The base material should dissipate the heat from the PCB to keep the it in the normal operating temperature range.
Failure of single PMT channels could be caused by the failure of the PMT, base, cable, or electronic channel. In order to keep the total in-water component failure rate less than the required 1% per operating year, the rate of failures due to the breakdown of the waterproof seal of the cup must be negligible compared to that total failure rate.
Base Reference Design
The conceptual design (refer to Figure 3–20) consists of the following components:
-
1.
Shell: A plastic shell interfaces with the PMT and the PMT cable, and contains potting compound.
-
2.
PCB: soldered to the PMT pins.
-
3.
End Cap: A plastic end cap, at the open end of the shell, sealed to the shell by an o-ring.
-
4.
Heat Shrink Tubing I (for PMT–shell interface): The heat shrink tubing I joins and holds the PMT and shell together and seals against moisture entering at this interface.
-
5.
Heat Shrink Tubing II (for Shell–Cable interface) The heat shrink tubing II serves as a moisture seal and it provides strain relief for the cable.
-
6.
Potting Material (not visible in Figure): A liquid compound when initially prepared. It is poured into the shell and flows over and around all components of the base within the shell. After curing, it becomes a solid dielectric material. It prevents moisture that has leaked through any of the interfaces from reaching the electrical components of the base.
The procedure for the assembly of the base is given in Section 3.5.1.
Base Testing
The protocol for ensuring the base will remain waterproof over the expected detector lifetime will be built on the following three components.
-
1.
Verify by design.
-
The materials selected for the base will be chosen to have good long term properties in aqueous environments.
-
The methods of sealing and joining will be chosen to have known to have good long term histories in aqueous environments.
-
The design will have at least two levels of “water barrier”, either of which should be sufficient to prevent water ingress.
-
-
2.
High Pressure. long term verification
-
The BNL pressure tank will be filled with as many PMTs with bases as will fit at full tank pressure. However the base will have an explicit “leak” in the outer base shell. The PMT will be run at HV and the current into the base will be monitored, watching for current spikes (breakdowns) and DC leakages. If possible somewhat elevate the temperature (e.g. 30∘F or 50∘F) and setup to run for two months.
-
The same setup as the previous bullet, but this time without the explicit “leak” in the outer shell. Also the same testing procedure and monitoring as before, with the added possibility of elevating the temperature (e.g. 300∘ or 50∘). This will be setup to run until the end of PMT production, giving a run of 4–5 years and another exposure factor of 4–16 due to accelerated aging from the elevated temperature.
-
-
3.
High temperature accelerated verification
-
The base and cable, with an explicit “leak” inserted into the outer base shell, will be sealed to a “dummy” PMT — e.g. a short glass or metal cylinder. This allows many such devices to be put in a modest size tank or pot of boiling water at atmospheric pressure. The current into the base will be monitored, again watching for changes in the base current or HV breakdowns. One month at 900∘C over nominal temp is a factor of 512 if one believes a factor of two per ten degrees so one month is equal to about 40 years at our operating temp.
-
The base (with no “leak”) but sealed to a “dummy” PMT. Otherwise the same conditions as the previous test. One expects the same 40 year equivalent exposure limit as previously stated.
-
3.4.2 Cable Assembly (WBS 1.4.3.4)
The ‘Cable Assembly’ is comprised of the PMT cable, a connector on one end, and a temporary storage reel (see Figure 3–1). It provides a complete electrical path for the PMT signal destined to arrive at the data acquisition system. The assembly is responsible for delivering power as well as providing a signal return path from the PMTs to the data acquisition electronics.
Functionality
Power Delivery: The cable will sustain a high voltage, (for example 2000 VDC), with a safety factor, and deliver current on the order of 0.1 mA.
Signal Propagation: The electrical cable characteristics directly impact the fidelity of the analog signal, and are discussed in more detail in Section 4.3.
Mechanical: The cable needs to be mechanically robust. Handling during PA Integration, and those operations specific to testing and deployment of the PA provide opportunities to damage the cable. Therefore the cable jacket and core materials must tolerate the handling without sustaining damage or degradation. The mechanical specifications will include but will not limited to: minimum bend radius, strength in tension, jacket diameter, and thickness. In the event that the cable jacket is accidentally damaged, a water block material to prevent water migration into the base will be specified.
Design Considerations
Over two million meters of PMT cable will be required for the detector. The cable specification will indicate four separate lengths. These differing lengths will target four zones within the detector. By this method the total length of cable required will be reduced by approximately 50%, while keeping the number of variations of PA type manageable. The data acquisition system will have a compensation method targeted to each length of cable. Reducing the cable length requirements will also reduce the cable mass which needs to be accounted for in the design of the deck.
A custom cable specification will include the specific requirements as they influence both electrical properties and the strength of materials. A robust cable jacket that easily tolerates handling and routing through obstructions is vital. There may be a trade off between the abrasion resistance of a jacket and the flexibility of the overall cable itself. The jacket must also be compatible with the ultra pure water and not introduce contaminants into the water. Two possible jacket materials are High Density Polyethylene (HDPE), or Polypropylene.
Reference Design
The reference design for the cable is coaxial 75 RG59 style construction:
-
Four lengths target to specific zones in the detector.
-
Double shielded construction with a copper plated steel center conductor.
-
High Density Polyethylene Jacket.
-
Polyethylene Wax water block.
-
The central dielectric material will be a solid Polyethylene.
-
The dielectric standoff voltage will exceed 5000 VDC.
Additional components make up the reference design to include:
-
A serial number label, (text and bar code), at the dry end of the cable.
-
A 75 SHV connector at the dry end of the cable.
-
A length of Heat Shrink tubing strain relief at the dry end of the cable.
Interface
A mechanical and electrical interface exists at the electronics end of the cable. A standard SHV connector provides a robust connection. The connector also provides a method to connect PMT Assemblies to test systems during the manufacturing process.
At the PMT end, the cable is soldered to the base PCB. A water proof seal prevents infiltration at the cable boundary. There will be a strain relief of the cable as it enters the PMT Assembly.
Both electrical connections match the electrical impedance of the cable to the associated circuits. The soldered connections will be dimensioned to sustain the high voltage standoff better than or equal to the cable dielectric withstand voltage.
3.4.3 Housing (WBS 1.4.3.5)
The housing provides a simple and efficient set of features which facilitate mounting the PMT/base/cable assembly to the PIU support structures.
Functionality
Major functions of the Housing include:
-
To hold the PMT in position with minimum constraint while remaining compliant against external forces.
-
To provide attachment features which allow the PA to be deployed on the wall, deck, and floor of the WCD vessel.
-
To provide attachment features for a Light Collector.
-
To provide compatibility with light barrier separating the active WCD volume from the water layer next to the wall.
-
To protect other PMTs in case the enclosed PMT were to implode, to avoid an implosion cascade such as experienced by Super–Kamiokande
Reference Design
The reference Housing design and associated parts are illustrated in Fig. 3–21.
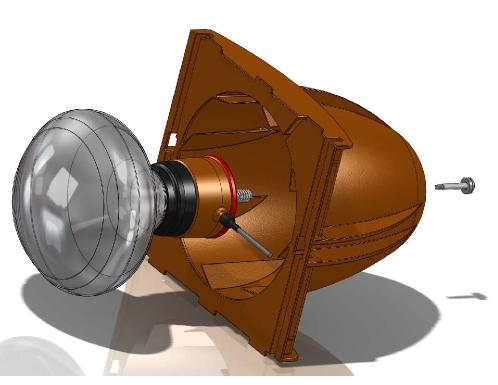
The square face frame includes slots on two edges designed for mounting on cables that support PAs on the sides of the cavern. Figure 3–22 shows the cables resting in these slots, being retained by the insertion of pins through the face frame.
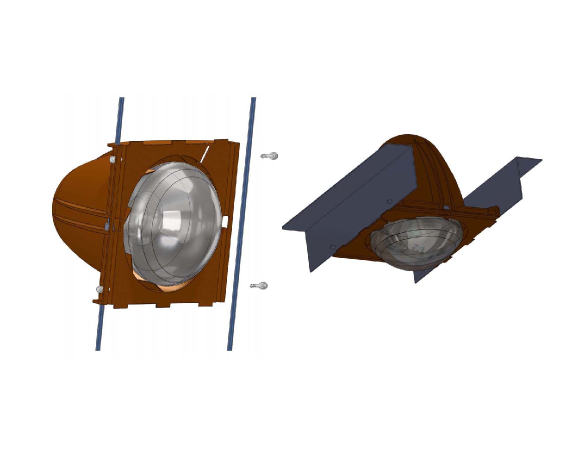
The vertical positioning is accomplished via a shaft collar previously attached to the support cable (shown on left side of wall mount method in Figure 3–22) . The other two edges of the frame are detailed for mounting to steel frameworks on the floor and deck of the cavern, so one PA design suffices for all deployment positions. The closed shell behind the PMT is designed to control the flow of water into the interior in case the PMT were ever to implode. We expect that the resulting asymmetrical flow would change the resulting pressure shockwave so it is spread over a longer time and is concentrated outward into the WCD volume, away from nearby PMTs, thereby lowering the shockwave intensity, and minimizing the possibility of inducing another collapse.
Angled plastic blades gently hold the PMT at the equatorwithout the risk of uncontrolled torques. Axial constraint of the PMT is provided by a spring loaded bolt at the base which still allows the PMT to rotate slightly about a center behind the assembly. Flexibility of these mounting points avoids stresses that might result from over-constraining the PMT, and reduces forces transmitted to the PMT in the unlikely event of a nearby implosion.
Approximately 29,000 PMTs are required to complete the WCD. Given this number of PMTs, design for simple assembly has been considered a priority. After attaching the base and cable, the PMT slides into the cavity and the bolt is secured. The signal cable exits the front of the housing through the diagonal slot shown on the face. A small number of parts are required which will limit inventory issues as well as minimizing the required assembly time and cost of parts. The shell, face frame and plastic blades are integrated as a single part that will be fabricated at low expense by conventional injection molded plastic technology.
Prototype and testing program
With a goal to insure the long term survivability of the PMTs, an experimental and simulation program is being pursued to test the candidate PMTs and housings. More details are given in Section 3.3.4. This program is designed to test the efficacy of the Housing Design in the prevention of cascade failures.
Alternate Housing Concepts
Several housing concepts are under consideration, each of which would provide a different degree of protection for the PMT. An alternative design would be indicated by one of the two following hypothetical scenarios:
-
1.
The PMT has been found to be resistant to collapse due to the hydrostatic pressure in the WCD vessel, save for the rare collapse of a weak “outlier” PMT. However it still is vulnerable to the extra pressure seen during a cascade failure.
-
2.
The PMT has been found unable to resist the hydrostatic pressures found near the bottom of the WCD vessel.
In the first case a modification to the reference design would be to mount a clear acrylic hemispherical dome over each PMT bulb. One or more holes in the dome (or in the housing) would allow water to interface directly with the PMT glass, but would provide a much larger impedance to water flow in case the PMT implodes. This is similar to what was developed by Super–Kamiokande to protect their PMTs (after their catastrophic cascade failure), and works by spreading the resulting acoustic energy over a longer time. Some light would be reflected off of the two additional interfaces between plastic and water, so more PMTs would be required to achieve the same overall light collection.
In the second case that the PMT cannot resist the hydrostatic pressure, the Pressure Hull Housing concept would completely isolate the PMT from the ultra pure water and the associated hydrostatic pressure. In this case the base would not be separately encapsulated. Some light would be lost by absorption in the thicker spherical shell (possibly acrylic) and optical coupling gel, which again would increase the overall number of PMTs required.
Figure 3–23 shows both the reference design (with the optional dome) and this alternate design.
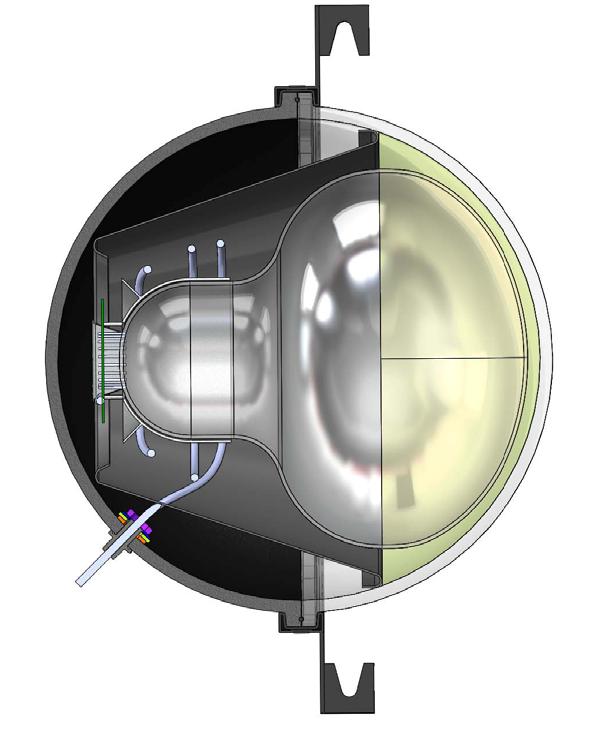
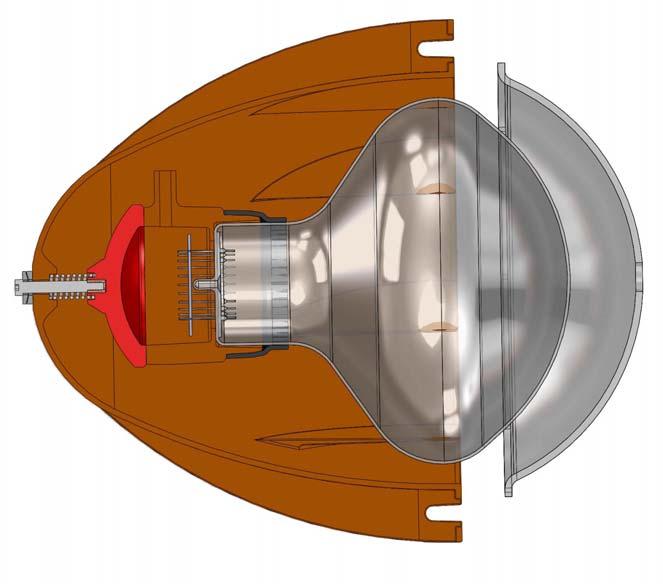
3.4.4 Light Collector (WBS 1.4.3.7)
Light collectors (LC) collect light that would otherwise miss the PMTs and direct it to the PMT photocathode. Thus, LCs effectively increase the light collection efficiency of the detector and consequently photo-coverage. This is particularly important in the low energy regime, where addition of LCs helps lower the energy threshold of the detector, increase detector sensitivity, and the particle ID and vertex reconstruction capabilities of the WCD. LCs are also much cheaper than the PMT modules, and therefore are effective in reducing the overall PMT cost.
The current design of the WCD includes 200 kTon detector with effective photo-coverage of approximately 15% with 12 inch HQE PMTs. While a higher value is desirable for low energy neutrino physics, the available funds for PMT procurement may be limited. Based on the experience from SNO and Borexino LCs, light collectors effectively increase photocathode coverage. Thus, the current plan for WCD includes LCs to increase the effective coverage by a factor of 1.4.
Two different types of LCs are under consideration in the baseline design.
-
A Winston Cone (WC) is a (roughly) ellipsoidal mirror mounted around the PMT face. It mounts slightly above the PMT equator and extends towards the front of the PMT face. The light is directed onto the the photocathode via specular reflections from the cone, to effectively increase the light collection area of the PMT. At the same time, depending on the specifics of the design it decreases the range of angles accepted by the PMT to some extent.
-
Wavelength shifter plates (WLSP) are flat, thin plates mounted just above the equator region of the PMT face. They absorb Cherenkov light and re-emit it at longer wavelength. Some of this light is transported by total internal reflection to the PMT, some is absorbed within the plate, while the rest is emitted back into the detector
Although not part of the baseline design, a thin wavelength shifting film may be added at the later time on the PMT face to increase PMT photo-detection efficiency. The increase in efficiency is between 10% and 15% which is significantly less than above WC or WLSP. The WLS film is still being evaluated to understand any outstanding issues (resistance to attack by the high purity water, scintillation decay time constant, permanence of attachment to the PMT face, etc.) that might negate the potential increase in light collection
The decision on the type of LC to be used in the detector will be based on the outcomes of the full detector simulation that is under development. The LC that effectively collects light without significant decline in the detector performance will be selected.
What follows is detailed description of the two LC types.
3.4.4.1 Winston cones
Winston cones are elliptical cones added around the PMT face. They have reflective mirror like surface and reflect the light that hits them toward the PMT, effectively increasing the amount of direct light collected by the PMT. They are mounted slightly above the PMT equator, roughly matching the edge of the photosensitive area of the PMT. Figure 3–24 shows the latest Winston cone prototype.

Some general guidance on the potential of Winston cones can be extracted from the light collection efficiency improvement obtained in SNO and Borexino with similar devices. In the SNO experiment, LCs increased the effective light collection efficiency from 31% with bare PMTs to 54% (the LCs reflectivity effect included)- a net increase of 74%. However, the different geometry of the LBNE WCD, the vicinity of the fiducial volume to the PMTs and the different physics goals would likely impact the effectiveness of these LCs for our purposes and must be addressed with simulation. However, based on the previous experience we expect to be able to achieve the minimal required 40% increase in effective light collection.
There are several parameters that can be varied with the goal of achieving the optimal performance in WCD: height above PMT face, opening angle, interface point with the PMT and choice of the coating material.
Design Considerations
Winston cones are made of plastic material coated with reflective metal surface. We have considered two plastic materials so far: acrylic and PETg. While the former is known to be compatible with ultra-pure water, the latter is known to be a stronger and less brittle material. Therefore PETg presents an attractive alternative. For the metal coating, we have considered aluminum and silver. Aluminum is pretty much the only metal that has very high reflectivity below 400 nm, but it is incompatible with pure water and protective coating is needed. An alternative considered is silver, since it is inert in the ultra-pure water. However silver has two reflection dips (high level of absorption) below 350 nm. In addition, silver is prone to tarnishing (perhaps an issue in the mine environment before the WCD vessel is filled) and anti-tarnish should be used with it.
The current prototype is made with aluminum coating. It has acceptance half-angle of 60∘. For a 12 inch PMT, its inner diameter is 30.5 cm, outer diameter is 47.0 cm and height of 17.5 cm. This prototype has a very large collection efficiency when viewed directly with Cherenkov source (3 times more light), but this number is lower in the actual detector geometry. This prototype is currently under study in the WCD simulation WCSim.
Prototypes
Three prototypes have been made for the Hamamatsu R7081 10-inch PMT. The first two prototypes interfaced with the PMT at the Hamamatsu guaranteed edge of the photosensitive surface but this resulted in a lower collection efficiency. Measurements at UPenn with these PMTs found that the photo-coverage surface extends almost to the equator. The second prototype has been made to interface closer to the 10 inch PMT equator. Figure 3–25 shows the prototype dimensions. The prototype has been implemented in the WCD simulation and shows the same acceptance half-angle of 60∘ .

The design parameters for the prototypes, mentioned in the previous section, mostly opening angle and height of the cone, must be studied not just in terms of light collection efficiency, but in terms of higher level physics (vertex resolution and particle ID). The design requirements will be driven by balancing two things, maximizing light collection while having the least possible angle non-uniformity in the detector. Simulation is needed to verify that the detector performs according to the requirements in the high energy range, while indeed collecting more light and improving the performance in the low energy range.
The next generation prototype will be based on the high level physics simulation output. The samples from the current prototype will be sent for material compatibility testing, since the current aluminum coated prototype came with a protective coating.
3.4.4.2 Wavelength-shifting plates
The use of wavelength-shifting plate (WLSP) light will allow a portion of the Cherenkov light not incident on the PMTs instrumenting the WCD to be redirected onto the PMTs. WLSP light collectors are mounted slightly forward of the plane of the PMT hemisphere as shown in Figure 3–26.
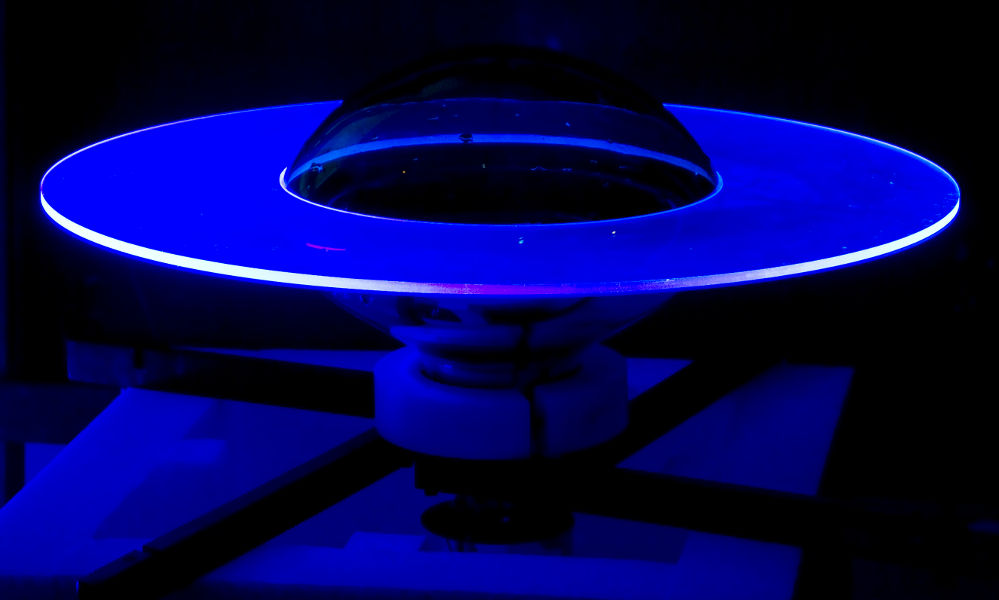
Based on the experience of the IMB collaboration, we expect to be able to achieve the required minimum of a 40% increase in effective light collection.
The WLSPs are quite configurable in that the radius, dopant level, and thickness to some degree, can be adjusted to increase the light collection efficiency to the desired level.
Design Considerations
The material selected for the WLSP design is BC-499-76 wavelength-shifting plastic distributed by Saint-Gobain Crystals, with a factor of 10 increase in dopant level to improve the photon absorption efficiency of the material. The plastic utilizes a polyvinyl toluene (PVT) base which has been used extensively in water-based detectors and should not provide insurmountable material issues when used in a large WCD. The BC-499 material was chosen as its decay constant is a fast 2.1 ns. In addition, the absorption and emission spectra are good matches for the water Cherenkov and PMT response spectra respectively. Table 3–4 contains all of the material properties of the prototype plastics.
| Item | Value |
|---|---|
| Base | PVT |
| Density | 1.04 g/cm3 |
| Index of refraction | 1.58 |
| Decay time | 2.1 ns |
| Mean absorption | 350 nm |
| Mean emission | 430 nm |
| Vendor | Saint-Gobain |
A circular (annular disc) shape was chosen to reduce the corner points that could behave as specular reflection points when illuminated, as well as to simplify the geometry for simulation. The WLSP that will give a 40% increase in collection efficiency for a 12” PMT is an annular disc with an inner diameter of 30.5 cm, and outer diameter of 69 cm’ and a thickness of 10 mm. The resulting WLSP has a mass of approximately 3 kg.
Prototypes
A prototype device (to fit an available Hamamatsu R708110-inch PMT) with an inner diameter of 25.4 cm, an outer diameter of 50.8 cm, and a thickness of 5 mm has been fabricated and tested. Device models based on the GEANT 4 package have been created and compared with the physical device, as well as a prototype device fabricated from another WLS plastic. Good agreement between the model and the light collection efficiency measurements of the devices has been achieved using various LEDs and further tests in a water Cherenkov facility are ongoing.
The design parameters described in the previous section were determined by using the GEANT 4 WLSP models. For example, the outer diameter of the device was adjusted in the model to give a 40% light collection increase. The same is true for the determination of the optimal doping level of the WLS plastic.
Based on the results of studies performed on the existing prototype a second generation prototype will be acquired. Samples of the second generation prototype material will be used to study aging properties and the effects of handling the material.
The production WLSPs for the WCD will be cast to shape in order to minimize wasted material and hence unit cost. Casting will also ensure that there are no cuts made to the material which can stress it and potentially cause defects such as surface crazing and cracks in general. The cast WLSPs will be also be annealed.
3.5 PMT Assembly Integration and Testing (WBS 1.4.3.7)
This section is concerned with the integration of the parts to produce each PMT Assembly (PA) ready for installation. Each PA consists of one PMT, a base, the cable assembly (PMT cable, temporary storage reel, and connector), and the housing. Since the Light Collector is planned to be mounted on the PA after the PA is installed in the WCD vessel, it is formally not considered as part of the PA, and consequently, not included in this section.
3.5.1 Production Plan
Once the design is finalized, a roadmap will be developed to organize the integration, testing and delivery of approximately 29,000 PAs to the WCD. The plan will be fully specified in a (future) document Production Plan for the PA Integration and Test, and will address the following points in order to reduce costs, improve predictability and control risks:
- Overall manufacturing strategy
-
Early in the Production Planning process, it will be necessary to choose the high-level manufacturing strategy for the PAs. The strategies can range from mostly or entirely in-house to mostly outsourced.
- Standardized steps and time
-
The plan will capture all steps needed to successfully integrate, test and ship PAs (Incoming materials, Integration, Testing, Inspections, Packaging and Shipping). Such a process mapping allows precise equipment and labor planning, which will improve process flow and minimize wasted time.
- Inventory control
-
A rigorous inventory system will be established. The system will follow and record process flow and location information according to serial numbers for finished items as well as major subcomponents like PMTs. Costs will be reduced by controlling inventory levels feeding the pipeline as well as work-in-process inventories.
- Allocation of equipment and human resources
-
The plan will determine and specify equipment and human resources needed for optimal production capacity. While recognizing the cost benefit from approaching full capacity, the plan will allow room for unexpected problems or priorities.
- Yield management system
-
An effective system will be specified to track yields, manage discrepant materials, and systematically improve product quality. Regular reports will ensure high level response to any unexpected issues and help maintain predictable deliveries.
3.5.2 Process Flow
A preliminary process flow has been established for the PA. This includes integration and test of the PA. The process flow for each PA will be detailed in a computer document called a Process Traveler. The Traveler lists the order in which the steps are performed, who performs the tasks required along with timestamps during the integration and test process. Serial numbers for major subcomponents, jig identifiers and key process parameters will also be recorded on the Traveler.
Integration and test of the PA begins after the receipt of appropriate inventory for all required components. The process steps and a brief description of each are as follows:
- Component sorting
-
PMTs will arrive with significant spread in supplier-measured HV/gain curves. In the detector, multiple PAs will share a common HV supply, so the PMTs will be sorted at the beginning into 5–10 ranges of HV values required for specified gain (e.g. ). There will also be four different PMT cable lengths, depending on intended destination in the detector. Thus similar PMTs and cables must be selected to be integrated and packed together.
- Base attachment to the PMT
-
The printed circuit board (pcb) will be soldered onto the PMT. A potting shell is then connected to the PMT using heat-shrink tubing.
- PMT cable attach to base
-
The PMT cable will be attached to the base. The cable-shell interface is sealed with heat-shrink tubing. The cable itself will be on a reel to make the handling of the unit easier.
- Base encapsulation
-
A potting material will be poured into the shell to surround the base. A end cap with an O-ring seal will then be fastened to the open end of the shell.
- Degas and cure
-
This is a placeholder step in case the potting material identified for use requires a vacuum-degassing procedure.
- PMT installation in Housing
-
The PMT, base and cable assembly will now be placed in the housing and secured.
- PA Packing into ship / test box
-
The PA is placed into a packing box along with others with similar PMT gain and cable length. The packing box is specially designed to hold and protect six PAs during storage and shipment, and to allow for 100% Acceptance Testing of the PAs inside.
- PA electrical and optical test
-
After the PA is packed into its packing box, it is tested electrically and optically to ensure it meets all required performance standards. This is detailed in Section 3.5.6.
- Shipment and storage
-
The PA is shipped to the Installation Warehouse for long term storage. A subset will undergo additional periodic tests (Section 3–6).
3.5.3 Procurement Plan
Procurement of PA subcomponents will be made in accordance with DOE Procurement rules. Each subcomponent will be evaluated to determine the most appropriate acquisition model. For complex, unique, or in any way non-standard components, the process of Request for Proposals (RFP) will be utilized. This would allow factors other than cost to be considered in the selection process. Possible factors would include supplier reliability, previous performance and technical expertise. For standard or off-the-shelf items, we will use the Request for Quotation (RFQ) process, which takes into account only cost.
The procurement process must also take into account known long-lead items. This will be reflected in the future PA Production Schedule.
3.5.4 Storage and Staging
Storage requirements will be a necessary part of the PA Production Plan. The plan must recognize the logistical issues with on-time delivery of 29,000 PAs to the installation site, including spaces for storage of incoming materials, work-in-process, and finished PA product. The PMT delivery will most likely be a bottleneck in the production of PAs. Therefore, PA production will be scheduled to match up with PMT delivery, and may begin up to five years prior to installation.
Three distinct space requirements have been identified in the current plan. The first need is for Incoming Materials Storage. Given the volume of incoming materials, it is projected that 6,000–8,000 square feet will be required for the storage of up to six months of integration materials near the integration center. PMTs will take up a majority of this space. Secondly, actual PA Integration will require space for up to four technicians working together to integrate and test up to 32 PAs per day. Preliminary space planning indicates approximately 6000 square feet of light industrial space will be required. This is the PA Integration Center and is available at the Physical Sciences Lab in Stoughton, Wisconsin. Finally, finished PAs will be shipped to the Installation Warehouse for long term storage. This space will also allow for sampling retests of the PAs while they are in their packing boxes to confirm there is no degradation during storage. More detail about the Installation Warehouse can be found in Section 8.2.
Production and storage of PAs crosses two WBS elements. Receipt and handling of materials and product prior to delivery of PAs at the Installation Warehouse will be the responsibility of WBS 1.4.3 — Photon Detector. Thereafter, long-term storage and associated monitoring of all components ready for installation will be the responsibility of WBS 1.4.8 — Installation.
Considerations for the long term storage space should include the following:
-
Temperature and humidity limits,
-
Proximity to the integration and testing sites,
-
Proximity to the installation site in Lead, South Dakota,
-
Proximity to transportation hubs,
-
Size of facility, and
-
Need for additional testing of units that are waiting installation.
3.5.5 Quality Assurance Plan
The WCD must be constructed to function properly throughout the experiment’s 20 year operational period. Once it is assembled and commissioned, repair of any failed components is expected to be prohibitively difficult. Therefore quality control is of paramount importance.
The key goals of the quality assurance and production testing program include
-
Minimize defects at procurement and fabrication,
-
Ensure that defects do not materially affect the physics measurements,
-
Manage and maximize component yield for efficiency of the production process, and
-
Reduce downstream risks by means of targeted, long-term reliability studies.
Fraction of Working Channels
The count of non-functional channels in the detector will reduce the quantity of usable physics data in a proportional way. Although the physics goals can still be achieved with a small fraction of bad channels, all such failures must be individually identified and accounted for in the data analysis chain, which can require major investments of time by hardware and software experts. The goal of the testing program is therefore to limit the number of installed bad channels to less than 0.1% at the outset. Based on past experiences with key components (PMT and base), this is considered to be realistic. In addition to improving and simplifying operation of the detector, setting a high standard implies a level of scrutiny that will help detect unexpected small quality issues before they have time to develop into significant ones.
Supplier and Yield Management
The production process will span multiple years. The plan must anticipate changes in process resulting from inconsistencies in the work force, input materials, and production facilities. Any developing weaknesses that might reduce production yield below 99% need to be quickly identified in order to avoid significant scrap or rework costs and schedule delays.
The Production Plan for the PA Integration and Test will define the quality steps for the integration and testing of the PAs. This part of the PMT QA plan will draw heavily on the highly successful QA procedures developed in the IceCube project.
Suppliers with the facilities, processes and experience to ensure delivery of 100% satisfactory components will be selected. Tests and other manufacturing process controls will be specified to ensure meeting requirements and specifications listed on engineering drawings or documents. Post-delivery tests of purchased items will be performed on a sampling basis as needed for monitoring and verification.
During integration, personnel will log process and process control steps on a Process Traveler document associated to each integrated assembly. The final assemblies will then undergo a prompt functional test, and will be independently certified for installation based on the test results and Process Traveler documentation.
Regular tracking of test results and overall process yields will ensure prompt response to issues detected.
The plan will therefore include the following required elements:
-
Full utilization of supplier-based test and QA opportunities,
-
Limitation of input component and subassembly inventories to required level,
-
Performance of unit acceptance test promptly after major integration operations,
-
Tracking of yields weekly and monthly, identification of issues at 1% level or greater
-
Preventive or corrective action on process and/or suppliers as needed to maintain yield
Recordkeeping
Records of each test are important to the yield-management plan. In addition, test results are a useful reference for later tracking of individual channels during the experiment, so they should be maintained in an organized way for long-term access. In particular, PMTs are expected to be delivered with individual sensitivity calibrations that can be directly used in detailed detector simulations. Therefore a database will be maintained with accumulated test results keyed to each PMT, including information from suppliers regarding subassembly tests and calibrations.
Reliability Studies All aspects of WCD design will be verified for long term reliability before production starts by means of tests and analysis. However, the subsequent period leading up to installation presents an opportunity for continued confirmation of this position, especially for effects that develop over long time scales that could not be explicitly tested beforehand.
Therefore long term studies will be included in the test plan, with an emphasis to search for instabilities or degradation in PA performance. While only a subset of PAs could be included in such tests, issues affecting significant numbers of PAs should be revealed in at least some sampled PAs.
Execution of these extra studies will be facilitated by designing the PA acceptance test setup for easy duplication in other contexts. Such a test design can then also be scaled naturally if needed to mitigate any unexpected issues that are discovered.
3.5.6 Test Processes Conceptual Design
Opportunities for testing exist at all stages of production, storage and installation. Figure 3–27 shows the chosen test framework, which provides for quick detection of production issues as well as holding the number of defective channels to an absolute minimum.
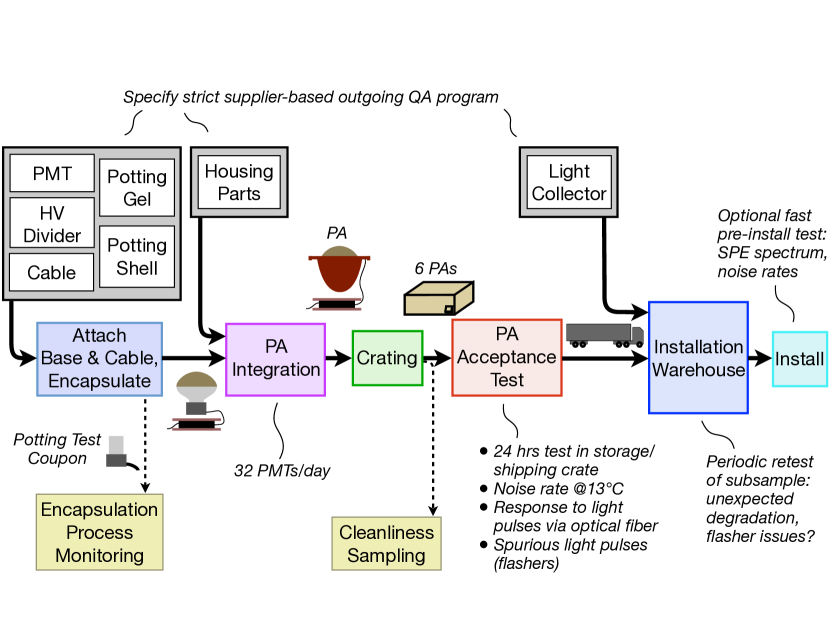
The plan strongly emphasizes testing of components and subassemblies at supplier facilities, avoiding the need for most incoming tests. Key stages of the integration process will be monitored by specialized tests performed on a sampling basis. Thorough operational tests will then be performed promptly on every integrated unit, as detailed below. Unit failure rates over 1% will be regarded as implying process failures or supplier-based quality issues, and appropriate corrective measures will be taken.
Additional tests are shown for smaller samples of assembled units before, during and after the storage period. These complement the per-unit acceptance test to reduce some foreseeable risks and thereby satisfy the overall testing requirements. Some of these can utilize the same test platform design.
The following sections provide explanations of processes shown in Figure 3–27.
Supplier Test Criteria
Tests will be performed on input materials and components on a sampling or per-unit basis, seeking to ensure that 99.9% of items forwarded to the assembly stage will meet specifications. Most of this testing will be specified to occur at supplier facilities, but some specialized tests may be best performed on a sampling basis after delivery at the PA Integration Center.
The light collector components are a special case. These are to be attached after deployment of PAs in the cavern, and therefore bypass the PA assembly stage and get delivered directly to the Installation Warehouse. However, the approach is the same as for other components and the PMT group will design suitable tests to guarantee their performance.
Table 3–5 lists the critical quality issues to be monitored for each input.
| All items | Mechanical dimensions |
| Compatibility with ultra-pure water | |
| Low radioactivity | |
| Structural items | Strength, mechanical integrity |
| Light collectors | Optical performance |
| Transparent shield | Optical transmittance |
| (if present) | |
| PMT | HV for nominal gain (per unit) |
| Dark noise rate | |
| Optical sensitivity | |
| Time resolution | |
| Single photon charge peak to valley ratio | |
| Afterpulses, late pulses, prepulses | |
| HV divider board | Environmental stress screening |
| In-circuit test | |
| Signal cable | Electrical performance |
| Water seal of jacket | |
| Integrity under tensile and bending loads | |
| Encapsulant | Cured hardness |
| Sealing components | Surface quality |
Integration process monitoring
The integration of each PA, including appropriate inspection or quick tests (e.g. electrical continuity), will be recorded by production personnel in Process Traveler documents, to be individually reviewed in a final QA step.
Certain critical requirements will be assured by sampling controls on the process itself, because individual tests on all units are not practical. Figure 3–27 shows two such examples related to performance in water.
In the case of base encapsulation, the permanent water seal will be verified by means of a “test coupon” that goes through exactly the same process steps as each batch of PMTs. This coupon is designed to mimic the part of the PMT assembly that is potted, and will be subjected to accelerated in-water testing as a way of monitoring process quality.
Another key issue is compatibility of the final assemblies with water purity and radioactivity requirements. Purchased parts and materials will be chosen to be robust against chemical degradation or surface contaminants, and the integration process itself will be carefully designed to not introduce contaminants. The effectiveness of this cleanliness program will be verified by periodic sampling and in-water testing of a small fraction of final assemblies.
PA Acceptance Test The per-unit acceptance test of PMTs will occur after integration into PAs, inside the same crates used for storage and shipping. Mobile test platforms will be connected to groups of PAs without any unpacking, which will then be operated for a period of 24 hours.
The equipment and time for these tests are dominated by the 12-hour monitoring of dark noise for all PMTs, which includes detection of any intermittent discharge or light emission phenomena. First, after PMT stabilization (also roughly 12 hours), a two-hour period is sufficient to illuminate the PMTs with light pulses and determine appropriate high voltage for standard gain, and to check expected response details including single-photon charge resolution, time resolution, and approximate optical sensitivity. Subsequently the 12-hour dark noise monitoring period begins and the sequence is complete after 24 hours. The scope of tests is shown in Table 3–6.
Acceptance testing will take place at the PA Integration Center in a dedicated room maintained at temperature where lights can be left off for most of the day. After each day of integrating and packaging PAs, technicians will move the accumulated PA crates into the test room and start the 24-hour test sequence. Units passing tests will be shipped to the Installation Warehouse for long term storage.
The same test equipment design and procedures can also be used for further sampling tests during storage and before installation.
| Procedure | Light source | Criteria tested |
|---|---|---|
| Base current | None | DC impedance; |
| during HV ramp | no discharges | |
| Gain vs HV scan | Pulsed diode | HV@1e7, 5e7 gain; |
| laser/LED | Slope of fit line | |
| Dark noise rate | None | Single photon detection rate; |
| (12 hours) | Gaussian distribution of counts/sec; | |
| No dropouts indicating discharge; | ||
| No coincidences from flashing PMT; | ||
| Rate of large pulses | ||
| Single photon | Pulsed diode | Charge spectrum; |
| prompt response | laser/LED | Time resolution; |
| Late and early pulse rate fractions; | ||
| Waveform shape: rise time, FWHM; | ||
| Optical sensitivity estimate | ||
| Afterpulses | Pulsed diode | Afterpulse rate vs time |
| laser/LED | ||
| Prepulses | Pulsed diode | Prepulse charge; |
| laser/LED | Prepulse rate fraction | |
| Wavelength scan | UV LEDs or | Relative sensitivity vs. wavelength |
| white light with | ||
| monochromator | ||
| Linearity | Pulsed LED | Linearity current limit |
| with optical | ||
| attenuators |
Long-Term Operational Testing
Procurement of PMTs and their integration into PAs will take place over a period of several years leading up to the installation phase. This time period provides an opportunity to look for any long-term performance degradation of PMTs, either from continuous operation or just from sitting in storage. Unexpected issues could include photocathode sensitivity loss, PMT gain changes, dark rate instability, increases in afterpulses, or light emission (flashing or glow). The test plan therefore designates subsamples of PA’s for additional testing.
In a study of long-term operation, an early batch of up to 100 integrated PA’s will be connected to test equipment and powered continuously at fixed high voltage as if they were installed in the detector. This study could utilize the prototype version of the acceptance test setup, once its effectiveness has been demonstrated and production versions are being made for use in the PA Integration Center. An automated test sequence similar to that used in acceptance testing will run repeatedly over a duration of several years and flag any suggestion of instability for follow up analysis. This is not shown in Figure 3–27 because it involves a smaller number of PA’s that are not part of the final production chain.
This continuous PMT operation test represents an extension of design verification process into the construction phase. Downstream risk will be reduced because of the opportunity to address any unexpected issues before installation. We envision that other critical design verification tests, such as PMT mechanical strength, water seal integrity and robustness of reflectors in ultra-pure water, may also be extended as appropriate.
Another sampling of PA’s will be tested during storage (Figure 3–27). This will consist of a subset of crates received at the Installation Warehouse, representing a weekly sampling throughout the production history that will be reserved in a dedicated room until final transport to the mine. Technicians will connect a mobile test platform to groups of crates, following a rotating schedule that repeats every three months. The periodic testing of each group will follow closely the original 24-hour acceptance test sequence and use the same test equipment design. However, analysis will focus on detecting any long-term changes in this significant sample of production PA’s. Figure 3–28 shows the follow-up test platform and a possible layout of storage racks.
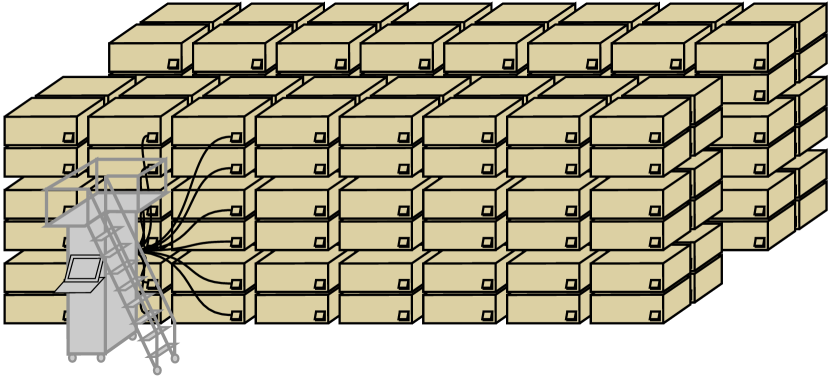
At installation time, PA crates will be transported to a staging area at the mine. Abbreviated testing of some deliveries will be feasible at this point, particularly at the beginning of the installation process, and would use the same equipment as before. Testing for noise rates and single photon charge response at ambient temperature will be sufficient to detect any significant damage from loading, transport, and unloading.
Although test equipment and analysis procedures will be supplied by the PMT group, the execution of follow-up PA tests associated with storage and installation will be the responsibility of the installation group.
4 Electronics and Readout (WBS 1.4.4)
This chapter describes the reference design for the electronics and data acquisition (DAQ) system. This system collects the electrical signals from the PMT bases and processes the signals through to the point at which they are ready for physics filtering and archiving.
The scope of the electronics and DAQ system includes collecting the electrical signals from the anode of each PMT, running the signals through a cable up to the DAQ, digitizing the charge and time values for the PMT pulses and recording event data onto disk. The scope also covers the provision of hardware and software triggers, the internal monitoring and control of the specialized electronics and DAQ hardware, and provision of the various support hardware such as power supplies and racks, and cooling. It should be noted that the production of the cable and PMT base circuit are not within the scope of the Electronics WBS.
The mechanical specification, procurement and installation of the PMT bases and cables are covered in WBS 1.4.3 and are described in Sections 3.4.1 and 3.4.2.
4.1 Reference Design Overview
The conceptual reference design is based generically on the previous, successful electronics and DAQ designs used at the Super–Kamiokande and SNO detectors. The actual “final” design adopted will undoubtedly take advantage of many improved commercial processes and devices, and as such will meet or exceed all the technical requirements identified.
The design of this system depends greatly on the performance of the PMTs, whose design follows from physics requirements, (e.g., the dead time is set by a requirement on supernova sensitivity) and on the requirement that this system not significantly degrade the detector performance.
For this reference design we make the following assumptions:
-
Each PMT is equipped with a passive voltage divider, and is operated with its photocathode at ground potential.
-
Each PMT has one coaxial cable routed from the PMT to an electronics rack located above the water. This cable carries the PMT bias voltage and anode signal.
-
These cables are assumed to be equal length within large regions of the detector but that there will be, roughly, four different lengths to cover the entire detector volume.
-
All electronics are mounted in standard 19-inch racks and cooling is via air transfer to the surrounding volume of cooled and conditioned air.
-
The system digitizes and reads out the time and amplitude of every PMT pulse via Ethernet to a computer farm using standard network hardware. This architecture is the basis for a software trigger as well as DAQ.
-
Provisions are also made for a hardware trigger (a hardware current sum formed from fixed time length unit currents from each fired discriminator and/or a similar sum made up from the instantaneous output signal from each PMT).
We assume the following arbitrary but reasonable modularity for purposes of estimating costs and schedule.
-
One high voltage (HV) generator (or one channel of a multi-channel supply) supplies 16 PMTs on a single HV circuit card
-
16 HV circuit cards mounted in a 19-in enclosure (called a “crate”)
-
16 PMTs per readout board
-
16 readout boards per crate (256 PMTs per crate), each board paired with an HV circuit card to service the same set of 16 PMTs
-
HV disable and voltage adjustment available per PMT (may be manual)
-
One Trigger/Timing board per crate
-
Two crates mounted in a rack (512 PMTs per rack)
The electronics racks will contain at least the following items:
-
A system for current-limiting and AC power distribution within the rack. Emergency shutdown and fire protection interlocks will be included as required by laboratory policy.
-
Commercial rack-mount network switch to provide Ethernet connectivity.
-
Commercial bulk DC power supplies for the electronics. At least control and monitoring should be provided on the front panel. The supplies themselves may be mounted in the rear of the rack.
-
Electronics crates to house vertically mounted electronics boards.
-
A fan tray beneath each crate to provide vertical forced-air cooling.
Crates are 9U high and comply more or less with Eurocard mechanics (as used in VME systems). There are 17 slots per crate (16 readout and one trigger/timing) and the slot spacing is one inch (as opposed to the 0.8 in spacing in VME systems) to allow for better cooling and HV component clearance.
For each readout slot, the coaxial cables from each set of 16 PMTs terminate on a connector panel at the rear of the crate. The connector panel remains fixed and the cabling is not disturbed during electronics maintenance except in the case of a connector problem. A pair of boards (readout, HV) in that slot provide power and signal processing for those 16 PMTs. Those two boards may both be removed from the front of the crate for servicing. A side view of one crate slot is shown in Figure 4–1.
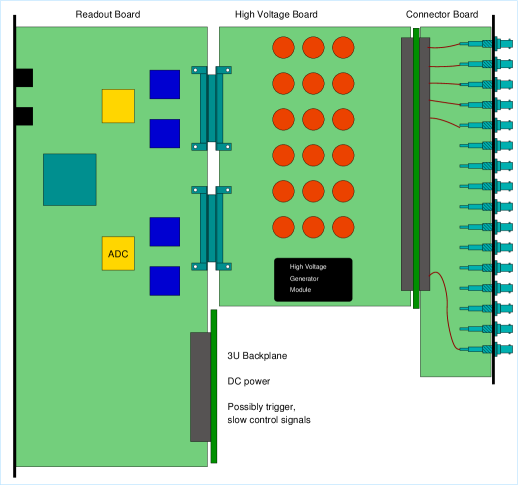
While the PMTs will see a relatively wide dynamic range of light pulses for the physics of interest, in general the most challenging electronics cases are either the single photo-electron (SPE) measurement or a very high-rate (i.e., nearby) supernova burst. In Table 4–1 we list the minimum expected electronics specifications for this design as well as the realized specifications for the Super–Kamiokande and SNO systems, for comparison.
| LBNE | Super–Kamiokande | SNO | |
|---|---|---|---|
| Global clock | 10 MHz ref. | — | 50 MHz ref. |
| Timing resolution (SPE) | 1 ns | 0.3 ns | 0.1 ns |
| Timing non-linearity | Few ns or less | 1 ns | 0.5 ns |
| Charge resolution | 10% | 10% | 5% |
| Charge non-linearity | 1% | 1% | 1% |
| Dynamic range | 1000 pe | 1000 pe | 3000 pe |
| Threshold | 0.25 pe | 0.1 pe | 0.1 pe |
| Integration gate | PMT dependent | 400 ns | 420 ns |
| Channel deadtime | 1 s | 500 ns | 450 ns |
We expect the final system to improve on all of the numbers in Table 4–1. We intend to rely on custom and semi-custom analog and digital integrated circuits to achieve the best possible system at the lowest possible cost. Table 4–2 lists the major hardware components that occupy the crates and racks — rounded up to 114 complete crates (29,184 channels).
| Description | Quantity |
|---|---|
| PMT bases and cables | 29,000 |
| High Voltage boards | 1,824 |
| Readout boards | 1,824 |
| Timing and Trigger boards | 114 |
| Analog ASICs | 7,296 |
| Discriminator ASICs | 7,296 |
| 16-port Ethernet switches (GbE out) | 114 |
| 24-port Ethernet switches (10GbE out) | 5 |
| DAQ server computers | 5 |
| Merger computers | 16–32 |
| Custom crates with backplanes | 114 |
| Racks with cooling | 60 |
| Bulk DC power supplies | 60 |
| 32-channel custom timing fanout modules | 60 |
| Global timing fanout modules | 5 |
The data rates in the detector and the data-bandwidth requirements govern the DAQ requirements, which in turn, the DAQ specifications must satisfy. Table 4–3 lists the major specifications for the DAQ as well as the equivalent Super–Kamiokande and SNO specifications. The actual raw data rates and equivalent network-bandwidth requirements are described in Section 4.6.
| LBNE | Super–Kamiokande | SNO | |
|---|---|---|---|
| Sustained trigger rate | 30 Hz | 100 Hz capable | 1 kHz capable |
| Deadtime per event | No deadtime | No deadtime | 120 ns |
| Event window | 500 ns | 45 s | 450 ns |
| Supernova burst | 1 M events/10 sec. | 1 M events/10 sec. | Burst 2 MHz |
| capability | (SK4 upgrade) |
4.2 Cables and PMT Bases (WBS 1.4.4.2)
The PMT base consists of printed circuit board (PCB) with a voltage divider network and its waterproof housing. The PCB in the base provides the appropriate DC high voltages and impedances to the dynodes of the PMT via a simple voltage divider. The reference electrical design consists of a simple PCB carrying only passive components. A prototype PCB of the same general design, showing the general shape, size and connection to the PMT pins is shown in Figure reffig:pmtbasepcb. Both the high voltage and a signal path to the front-end electronics are provided by a single coaxial cable, one end soldered to the PCB, the other connected to the front-end electronics. The mechanical aspects of the base and cable are described in Sections 3.4.1 and 3.4.2. Here we discuss their electrical aspects, functionality and specification of the cable and PMT base system.
Given the relatively high DC impedance of the divider chain, the cable’s DC requirements are trivial; the cable must transport a current of order 100 A. However, from an AC or pulse-transmission point of view, the cable is a complex transmission line that must also operate underwater.
Shielding is also an area of concern for long cables. The signal cable must be shielded against interference from outside electrical disturbances and broadcasts from very large signals in neighboring cables and be shielded against disturbing other cables from its own large signals. As PMT signals can range up to hundreds or even thousands of photo-electrons, crosstalk rejection from shielding must be 20 db in the 100 MHz region.
4.2.1 Cable Electrical Functionality
The cables will be of order 100 m (400 ns) long. Acting as a low-pass filter, the cable attenuates the high-frequency part of the signal. The attenuation is a function of the bandwidth of the transmitted signal, the details of the cable construction and the cable length. The loss of high-frequency signal strength does not, however, prevent us from getting the required pulse-timing accuracy since the signal from the PMT is quite large (pC). The PMTs under consideration have rise times of about 3 ns resulting in a signal bandwidth of about 100 MHz. At this frequency, common “broadband” cables such as the RG59, RG6, and RG11 family cables demonstrate attenuations over 100 m of about 9 db, 5 db and 4 db respectively, although this varies a good deal by manufacturer and construction details.
As an example, Figure 4–2 shows a single PE pulse (red) from a candidate PMT and then the same pulse (blue) after traveling 100 m on RG58 that has somewhat greater attenuation than any of the cables mentioned above.

The design must ensure that the signal cable is properly shielded. By simply placing a filter network that has characteristics that are the inverse of the cable at the preamp input, we can tolerate significant attenuation and recover full timing information.111This is normally known as “cable compensation” and works well until the signal-to-noise degrades below an acceptable level. So, while the cable needs to be characterized carefully in order to specify the ideal inverse filter, attenuation and signal dispersion over distances of 100 m is not a problem.
Measurements on a close-packed 100 m-long bundle of seven standard RG59 cables showed inductive crosstalk of over 20% amplitude. This indicates that we will need more complex cables (double or triple shielded) and/or a sufficient mechanical separation to avoid long, parallel, close-packed runs of cable.
Rejection of external interference from the general detector environment is harder to quantify. It is, in general, good practice to treat such interferences at the source if at all possible and simply insist that no nearby source of electrical interference should overwhelm a cable that satisfies the local crosstalk specification.
We will need to optimize the design in a multi-dimensional space including, at least, the cable mass, transmission quality, shielding efficiency, water resistance and cost.
4.2.2 Base Electrical Functionality
The PMT Base is a passive voltage divider circuit that provides appropriate high voltages and impedances to the various pins (and hence, dynodes) of the PMT, and it connects the signal and ground wires to the front-end electronics via the coaxial cable.
Each different PMT design requires a different voltage divider with the voltage ratios, tuning elements and standing current based upon the manufacturer’s suggestions and detailed testing of the particular PMT types. For costing and conceptual design purposes we use a reference design that includes a Zener diode Cathode to First Dynode voltage stabilization, no back termination and a standing current of order 100 A. Mechanically, the PCB will be constrained by the PMT pin circle on one hand and the detailed design of the waterproof housing on the other.
4.3 High Voltage (WBS 1.4.4.3)
Each PMT requires a precise and stable DC high voltage source to operate properly. High Voltage boards (HVB), as shown in Figure 4–3, will provide programmable DC HV to the PMTs. One HVB will supply appropriate voltages to the 16 PMTs associated with one slot in the crate. In more detail, these HVBs will provide:
-
Decoupling of the PMT HV supply and signal paths in the cable. This will be accomplished via an HV-decoupling capacitor matched to the corresponding capacitor in the PMT base and an HV-isolating resistor as shown in the left side of Figure 4–4.
-
An impedance-controlled signal path from the cable connector to the readout board.
-
Overvoltage protection for the readout board.
-
A programmable, modular DC-DC converter to provide to Volts (depending upon the actual PMT requirements) at slightly more than 16 times the required base current.
-
A resettable overcurrent trip on the DC-DC converter that can be monitored via a control interface to the readout board.
-
A manual method of tuning relative PMT gains and of disconnecting any given PMT (e.g., changing or removing a replaceable resistor).
-
Precision readback of the DC-DC outputs: voltage to better than 1 V, current to better than 10 A for the HVB.
-
Per-channel coarse readback of PMT current sufficient to verify current flow.
-
Test pulse with variable amplitude and time position, and with individual “channel enable” or “disable”.
-
Control interface to the readout board via or similar serial protocol.
4.3.1 Reference Design Description
As shown in Figure 4–1 a connector panel at right is mounted at the rear of a crate for each slot. For the reference design we assume that the cable is similar to RG-59/U coaxial cable, and that each cable has an SHV (Safe HV) connector installed. This connection panel, shown very schematically in the figure, holds 16 SHV chassis connectors on a semi-permanently mounted panel at the back of the crate. The center conductor and shield connection from each SHV connector is carried via a simple PC board to a multi-pin connector that interfaces to the HV board. This scheme allows the HV board to be easily serviced from the front of the crate without disturbing the array of PMT cables entering the crate from the rear via the connector panel. The connector panel is intended as a permanent installation, and replacement would occur only in the case of a connector or cabler failure.
The HV board shown in Figure 4–3 is installed from the front of the crate and mates with the connector panel.
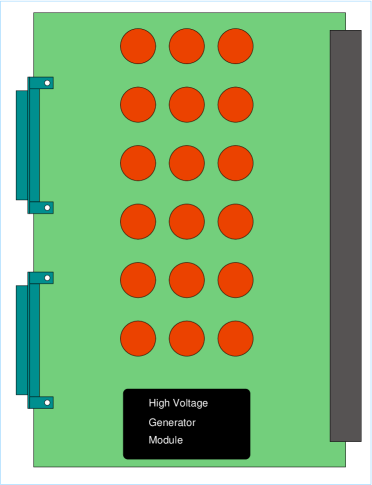
The HVB decouples signals from the cables and routes them through connectors to the associated readout board, and provides DC HV using an on-board HV generator (a commercial DC-DC converter module).
DC power for the HV generator is provided from the backplane either directly or via the readout board. Individual HV trim circuits, with voltage and current readback are provided. Control and monitoring circuits will be accessed from the readout board by or similar low-speed serial bus.
The HV board will contain a programmable test-pulse-generator circuit which may be enabled on a per-channel basis. This pulse generator will have a programmable amplitude range and time position suitable for (relative) calibration, verification and test of the entire readout chain.
4.4 Front-End Electronics (WBS 1.4.4.4)
The readout board shown in Figure 4–1 encompasses all the electronics needed to receive and digitize per-channel (per PMT) data, collect the data into packets, forward the packets to the software trigger farm, and provide control and monitoring. Most of the electronics details of the design will be buried in custom ASICs (Application-Specific Integrated Circuits) and complex FPGA (Field-Programmable Gate Array) code. These features are the subject of future detailed design effort.
4.4.1 Reference Design Specifications
The individual PMT front-end channels provide:
-
Termination for the PMT signal appropriate for the characteristic impedance of the long cable, in order to prevent back reflections and to retain the signal’s information value.
-
Preamplification and signal-shaping for optimal time and charge measurement.
-
Leading-edge discrimination of the signal with a minimum threshold less than 0.25 PE.
-
Integration of the signal charge.
-
Digitization of the charge amplitude and the leading- and trailing-edge times, for each input over threshold — coordinated with the experiment’s master clock to within 1 ns.
In addition, for its 16 channels, each readout board is required to:
-
Collect and forward data from the individual PMTs to the software trigger farm.
-
Set all initialization and control values.
-
Monitor all measured variables.
-
Distribute the master clock time to the channels and monitor the timekeeping.
-
Provide inputs to the ‘trigger and timing’ card for number of PMTs over threshold, and total instantaneous PMT pulse amplitude as a detector diagnostic and backup trigger system.
4.4.2 Description
For each PMT signal, the front-end system decouples HV from the signal, and digitizes pulse-arrival time and integrated charge. Please refer to Figure 4–4 for a block diagram of a single channel.
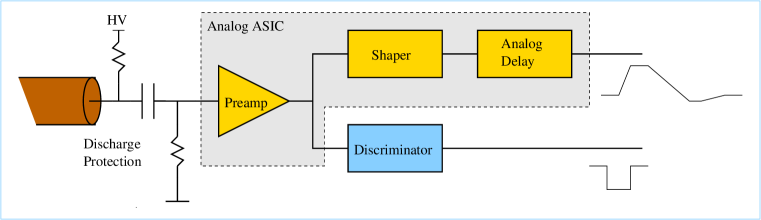
The signal is decoupled from the DC HV bias by a blocking capacitor. Following the capacitor we have discharge-protection circuitry that prevents damage to the readout electronics in the event of a sudden discharge of the blocking capacitor. The HV-bias supply for the PMT is coupled to the cable through a current-limiting resistor.
The preamplifier terminates the cable at the correct impedance, provides gain as required, and may include equalization circuitry to compensate for cable dispersion and attenuation. It has two analog outputs: one to drive the input of the shaper and another to drive the discriminator input. A third monitor output may be provided for diagnostic purposes (perhaps for only one channel per ASIC, to save pins.
The shaper provides baseline-restoration and charge-integration functions. A sample/hold function or gated integrator may be provided in this block, depending on the detailed design chosen. The output of the shaper is a relatively slow-buffered analog signal which may be sampled using an external ADC. The shaper may provide one or more monitoring outputs for diagnostic purposes.
The analog delay delays the shaped analog signal so that it may be sampled in response to the discriminator output. The analog-delay output may be immediately sent to a digitization stage, or perhaps to a pipelined analog memory for later digitization depending upon the results of queuing simulations. A copy of the analog signal is also forwarded to the trigger and diagnostic analog sum (Energy).
The discriminator performs two functions. First, it provides a low-threshold trigger to activate the digitizing and recording logic for a channel. Secondly, the time of the discriminator firing, coupled with the charge digitized for that channel, allows precision measurement of the arrival time of a light pulse. The discriminator also feeds a fixed-width unit current into an analog sum of discriminator outputs (the NHIT sum) for use in the hardware and diagnostic trigger. Logic triggered by the discriminator output will initiate digitization of the shaper output. Note that in this architecture the channel is “dead” to a second discriminator pulse within the integration time of the first pulse but ratios of total charge to Time Over Threshold should allow partial deconvolution of late arriving photons.
The four functions mentioned above will be accomplished, in the reference design, by two different custom designed multi-channel ASICs. The final design ASICs may well differ in detail from this reference design which is intended only as an initial cost model and the beginning of the conceptual design process. The first ASIC (the “Analog ASIC”) provides the pre-amplifier, shaper and analog-delay functions. The second ASIC provides the discriminator functions.
A time-to-digital converter (TDC) implemented in an FPGA provides time measurement. Multi-channel TDC implementations based on tapped delay lines exist today with time resolution near 50 ps, more than sufficient to meet LBNE requirement of 1 ns.
A single printed circuit board (PCB) processes 16 channels of PMT signals as described above. Each analog ASIC and each discriminator ASIC processes four channels, so four of each are mounted on each 16-channel readout board, as shown in Figure 4–5.

A logical block diagram of the readout board is shown in Figure 4–6.
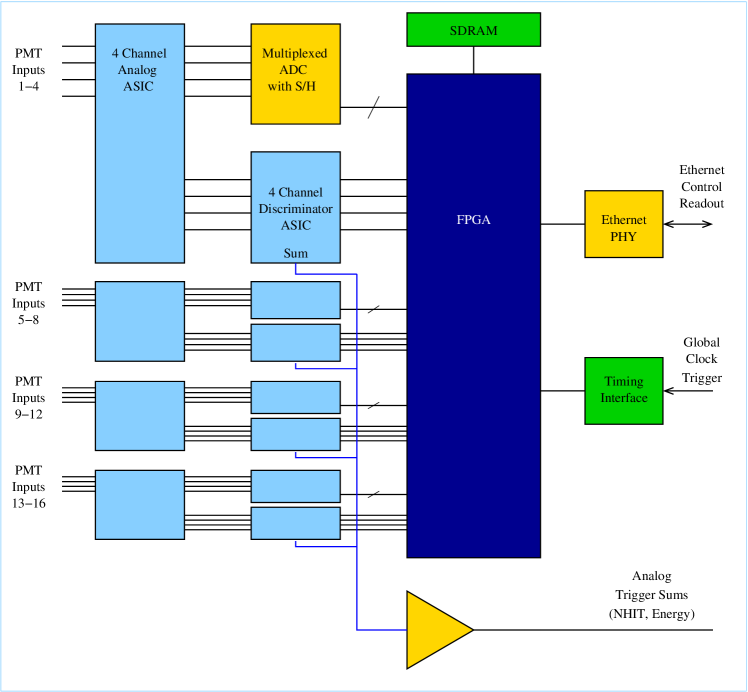
A multiplexed ADC with integrated sample/hold circuitry digitizes the shaped analog signals. The ADC may be either a commercial device, a third type of ASIC, or a combination of the two. An FPGA with attached SDRAM buffer memory provides controls.
A single Ethernet interface provides all control and readout for each 16-channel board. We plan to use a commercial IC coupled to a standard RJ45 connector for the Ethernet physical interface (known as PHY) where that PHY layer connects to four high-speed pins of the FPGA which will supply the MAC and other higher-level TCP/IP protocol functions.
In order to handle the burst of events expected from a possible nearby supernova (or from some event traceable to the instrument being used), each readout card requires a relatively large pipeline memory to buffer the ethernet connection. An inexpensive 128 MByte memory chip would provide sufficient storage for 106 events.
In the reference design global-clock and timing-distribution system, a standard 10 MHz GPS-derived reference clock 222Recent results from OPERA indicate that care will be required in selecting and calibrating the timing system to achieve ns level precision and accuracy relative to a distant source. Details of a suitable scheme are beyond the scope of this report, but nothing in this reference design should prevent the experiment from maintaining knowledge of the relative times to the required accuracy. and a 1 pulse per second time marker are distributed as differential signals on a Cat-6 class network cable to the time/trigger card in each crate. The timing signals are fanned out along the backplane to the individual readout boards. The time marker may be augmented by a coded time-of-day or synchronize signal to ensure synchronization between all elements of the DAQ.
A “tree” fanout system sends the timing signals to the individual crates. That same tree of boards and cables also carries the trigger signals (NHIT and energy) and serves as a fan-in of the hardware trigger. The same board layout used for the crate trigger/timing card, with different components installed, can be used for the higher level nodes of the “tree” system.
The same Ethernet path as that used for DAQ can handle “slow” controls of the electronics and DAQ hardware so that no specific “crate controller” modules are required. This “slow control” path covers initialization and monitoring of the custom hardware including monitoring of the internally measured voltages and temperatures. The monitoring’ covered in Section 4.7 is an entirely separate system that measures critical voltages and temperatures, and provides controls and alarms for the standard commercially obtained parts of the system — fans, power supplies, etc. Both sets of measurements and controls, the custom and commercial hardware, are merged at the DAQ level and presented as a unified set to the On-Line system for the operator interface functions. Separate DAQ-level code may be used for testing, commissioning, diagnosing, and repairing the hardware when it is off-line from the main experiment.
4.5 Trigger (WBS 1.4.4.5)
The detector trigger system serves to identify “events” of interest. An “event”, in this sense, is signaled by a clustering of in-time PMT hits from some local region of the fiducial volume — a time clustering that indicates a possible single physics instigator and the “event” data is then the charge and time information from all PMTs that were above threshold during a time window centered on that trigger time.
This reference design is based upon a software trigger similar to that used in the recent Super–Kamiokande upgrade. In this scheme all single-PMT-hit data gets forwarded to a processor (or set of processors) that examine the data for correlations. In this sort of trigger, complex trigger algorithms are relatively easy to implement — for instance, a “look-back” trigger algorithm that finds an early, very low-energy time cluster that was below the normal cluster threshold by using the time from a later larger-energy cluster and working backward through the raw data using a much lower threshold in a limited time window. The cost is a larger data-bandwidth requirement at the channel level and a requirement for more memory and processing power than would be required by the simple hardware NHIT333Previous large water Cherenkov counters have used a multiplicity trigger (a number of PMTs fired in a given time window) as a powerful way to avoid the radioactivity bias induced by a simple, energy-sum trigger. The NHIT trigger described below is just such a trigger and is listed partially as a backup for the software trigger but mostly for its ability to aid real time diagnosis of hardware or detector problems. triggers used in earlier experiments. As these costs have decreased markedly with time, many if not all modern, large experiments use some variant of this software trigger approach, at least for raw hardware trigger rates below some tens or hundreds of kHz. However, in the reference design we include a hardware NHIT trigger both as a backup for the software trigger and as an effective diagnostic tool.
4.5.1 Reference Design Specifications
The trigger system will:
-
Select and save interesting physics data above threshold with negligible inefficiency.
-
Reject most random PMT hits, where “most” is not yet determined.
-
Inject no bias into the data stream.
-
Allow changes to thresholds, time window widths, and other parameters.
4.5.2 Description
The primary trigger and data acquisition (DAQ) is implemented in software. Each readout module provides one 100BaseT or 1GbE (1 gigabit per second) Ethernet output. It is anticipated that the entire software trigger and DAQ system will be built using off-the-shelf network and computing hardware. We base the following tentative description on currently available technology.
Table 4–4 lists the assumptions for data rate and volume on which we base our estimates.
| Parameter | Value | Notes |
|---|---|---|
| Total PMT count | 29,000 | |
| PMTs per rack | 512 | |
| PMT Dark Noise Rate | 10 kHz | Very conservative |
| Bytes per hit | 8 bytes | 32 bits time, 16 bits channel no., 16 bits charge |
We assume sufficient local memory at the readout card (described in Section 4.4.2) to handle signal bursts. The negligible rate of neutrino and cosmic-ray events compared to PMT dark noise (signal in the absence of incident photons) plus the real physics signals from low-level radioactive background decays allows us to safely use the dark-noise rate to determine average bandwidth requirements. In this section we use a very conservative estimate of 10 kHz for average PMT single hit rate in order to understand the upper limits of the required bandwidth. This is a much higher rate than the PMT requirement specified in Chapter 3 and is also higher by factors of two to four than the sum of an acceptable dark rate plus the rate of hits caused by radioactivity from the cavern walls.
For one board (16 PMTs), we would then expect a data rate of MBytes/s. For the 16 boards (256 PMTs) in a crate, we thus expect sixteen times the single board rate or 20 MBytes/sec total — which fits comfortably in a single GbE channel. For 114 crates, that is a total bandwidth of 2-3 GBytes/sec into the low-level software trigger system. For a more realistic 3 kHz noise plus radioactivity PMT singles rate the DAQ input rate would be less than 1 GB/s while the DAQ output rate, after the low-level software trigger, into the On-Line system would depend upon the rejection achieved by the low-level trigger algorithm.
While detailed trigger studies have not yet been started, even very simple time clustering algorithms — e.g. sliding a 300 or 400 ns window through the data flow to look for local time clusters associated with Cherenkov rings striking the PMTs should be fairly effective data reducers. For instance a very loose 15 ns cluster width requirement would reduce the data volume by about a factor of 20. Simple space point reconstructions require more computing cycles but should be significantly more effective as filters. Full reconstructions, of course, would get very close to the actual physics event rates. The more complex filters are only appropriate for the higher-level triggering and filtering but it is not unreasonable to expect a low-level trigger-noise rejection factor in the range of 20 to 100. With rejection factors in that range, the On-line computing described in Section 7.2 will see something like 10-50 MBytes/sec of candidate “physics” data from the flood of uncorrelated noise hits.
Figure 4–7 illustrates one way to assemble a DAQ and software-trigger system.
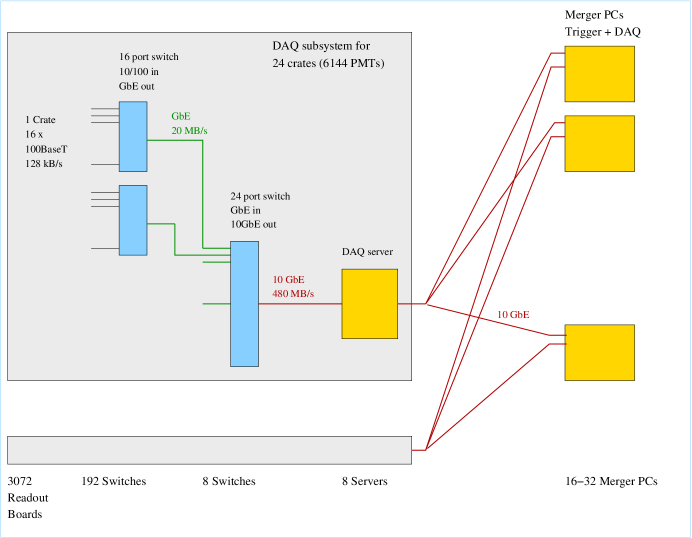
Output data from 16 readout boards (one crate) is merged in one 16-port Ethernet switch. The output of each switch is one GbE cable, carrying about 20 MB/s. Twenty-four such cables are further merged using a single switch with a single 10-GbE output carrying about 480 MB/sec. This data is received by a server PC, and routed to a farm of merger PCs. Each server routes hits to merger PCs by time-stamp, so that each merger PC receives all data within a specific time period (e.g., 1 ms). The merger PCs run a software-trigger algorithm, and forward event data to permanent storage for triggered events.
As a diagnostic aid and as a backup for the software trigger outlined above, we also include in the reference design the hardware necessary to provide classical NHIT and energy-sum triggers. Information from these sums is at least complementary to the software information, may provide a much faster method of doing some filtering, and has been exceptionally useful in the past to quickly diagnose some classes of hardware problems. However, experience with the new Super–Kamiokande software trigger may, in time, indicate that this small additional expense can be avoided.
From a hardware point of view, the NHIT and energy-sum triggers are simple fan-ins of current, and are almost a mirror image of the clock distribution — which is a fan-out, but of digital signals. In the reference design, a single board-per-crate fans-in the trigger from and fans-out the clock signals to the crate backplane. From that board, the clock and trigger form a simple tree structure of 16:1 fan with one additional fan-in/out board per eight racks and then a single central fan-in/out board that sources the clock and receives the NHIT and energy sums. As noted above, it is possible that the crate clock/trigger card could be designed to be used either in a crate or in the tree structure by stuffing more or less of a general design — this is the assumption used in the cost estimate.
4.6 Data Acquisition (WBS 1.4.4.6)
As noted in the previous section, the DAQ hardware is either similar or even largely identical to the trigger hardware. However, the DAQ task is to take triggered events from the software-trigger algorithms, package those events with appropriate headers and meta-data and then forward them to disk to be used by on-line and off-line monitoring and analysis routines as discussed in Section 7.2.
In Figure 4–7 we show one-layer of DAQ servers feeding one layer of “merger” PCs. The actual number of processors (or even layers of switches and processors) will be determined by the efficiency of the algorithms, on one hand, and the advance of computing platform capabilities on the other. The numbers indicated in the figure seem a plausible estimate at this time.
Not shown in the figure are the hardware interfaces to external GPS time receivers or to any calibration devices — all such interfaces are expected to be relatively inexpensive commercial devices and, as such, are not detailed in the reference design. A GPS receiver with trained rubidium clock is included in the cost estimate. The surface-to-cavern fiber connections are supplied as part of the conventional facilities.
We expect all the hardware associated with the trigger and DAQ systems to be off-the-shelf, commercial-grade computing machinery except for the fan-in / fan-out system used for the hardware trigger and clock.
4.6.1 Reference Design Specification
The DAQ system will:
-
Take triggered event data and package it into the appropriate event format.
-
Provide the data path and hardware for low-level monitoring, control and configuration of the front end as described in Section 4.7.
-
Provide the data path to the on-line system for the ongoing monitoring of the electronics.
4.6.2 Description
At the level indicated in Figure 4–7, all of the DAQ and Trigger hardware, including associated disk storage and a control server, would fit comfortably into two racks located either near the center of the deck (to save cable length) or near the main entrance to the cavern (to avoid cluttering the deck). These racks will be located adjacent to the On-Line racks described in Section 7.2.
4.7 Monitoring and Control (WBS 1.4.4.7)
The Monitoring and Control system consists of software that provides all the real-time monitoring and control of the electronics and DAQ plus some additional commercial hardware to make real time DC measurements. The system operates on the DAQ/trigger computing hardware. The system also includes the databases necessary to initialize the detector and keep track of operating conditions during runs.444These databases are either compatible with or identical to the on-line and run-control databases described in Section 7.2.6.3
4.7.1 Reference Design Specification
The Monitoring and Control system will provide direct control of:
-
Individual channel parameters (e.g., thresholds, times, test pulses)
-
Board level parameters (e.g., HV setting)
-
Crate- and rack-level parameters (e.g., LV settings, fan settings)
-
System-level parameters (e.g., Ethernet switch settings)
It will also provide real-time monitoring of:
-
Voltages, currents and temperatures
-
Data flow, buffer-queue lengths, and other related quantities
-
Event rates for different trigger types or classes
-
Processor loads, network loads and disk-space usage
And provide databases for:
-
Detector configuration and initialization.
-
Detector status (e.g., live channels) for analysis.
The system will need to provide a comfortable human interface for the control and display of all of the above — both as an integrated part of the on-line system and as a standalone interface used for commissioning and diagnostics.
The monitoring and control system may (but at this time is not required to) provide access to diagnostic and integration tools.
4.7.2 Description
Real-time monitoring and control of the custom electronics hardware parameters is via the Readout Board ethernet interface. We will use a system similar to that currently used in Super–Kamiokande to monitor and control, in real time, the parameters of the commercially supplied hardware at the crate- and rack-level. The system employs an Ethernet-based client-server architecture in which a Master Module (MM) connected to a LAN serves as the gateway to a cluster of up to 16 intelligent I/O Modules (IOMs) for measurement and control purposes. It is easily extensible by connecting virtually any number of additional MMs, with their attached IOMs, to the network. All of the essential standard network protocols are supported: IP, UDP, ICMP, and ARP. In addition, the MM firmware includes a multi-threaded server process that runs on top of UDP to enable it to provide I/O and communications services to one or more Ethernet clients. All modules are commercially available at low cost.
The monitoring hardware system consists of one 3U enclosure per rack to measure the temperatures and low-voltage power supplies for two crates (1 temperature and 6 DC voltages per crate). In addition, it allows for remote control of the low-voltage power supplies by means of a solid-state relay module. A block diagram of the system for one rack is shown in Fig. 4–8.
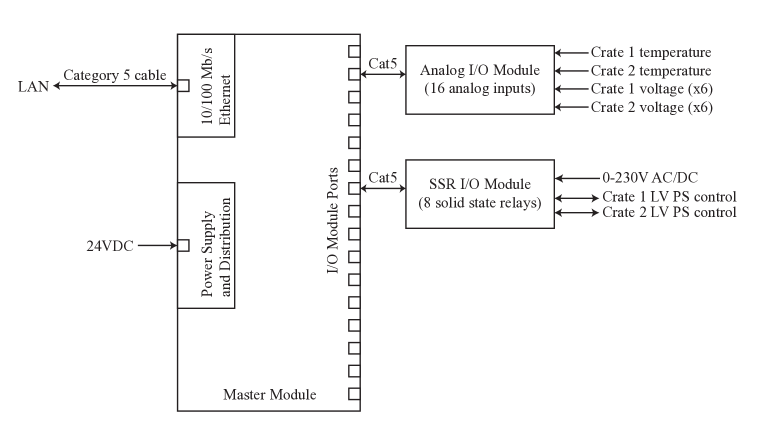
Fan trays will be monitored independently of this system. Low-cost, commercially available cooling units make use of the same low-speed serial bus that will be used on the HV boards described in Section 4.3.
4.8 Power, Racks and Cooling (WBS 1.4.4.8)
As noted at the beginning of this chapter, the reference design assumes 512 PMTs per rack in two separate, custom crates in each standard 19-in rack. For a 29,000-PMT detector we would need 57 such racks plus a few racks for DAQ and trigger hardware. Each of these racks will need appropriate power and cooling systems as well as the various standard mechanical devices (doors, slides, etc.) to complete the assembly.
The 57 electronics racks will be fairly basic as the heat load is expected to be 2 W per channel, but routing and supporting the PMT cables that enter the rack from the rear will likely require some specialized hardware — e.g. trays, cable support clamps, cable separators, etc.
The very small number of DAQ racks (also containing the hardware trigger and clock distribution) will have to support a much larger power load and therefore will come with complex access requirements for servicing processors. This is not a problem since such hardware is in widespread use in numerous small and large air-cooled computer arrays, and is readily available.
In the following discussion we will only consider the main electronics racks.
4.8.1 Reference Design Specification
The electronics racks and other supporting metal work will provide:
-
Two crates to support 16 sets each of readout boards, HV boards and connector panels, plus a single slot for a trigger/monitor board.
-
Cooling for the electronics via fan trays (or equivalent) and suitable ducting and airflow management (this may or may not require explicit filters per rack depending upon the final environmental conditions).
-
Low-voltage power to the crates.
-
Appropriate monitoring and safety systems (e.g., overtemperature and smoke).
-
Support for the PMT cables at the rear of the rack.
-
Space for two 16-port switches.
-
(Every 12th rack) Space for a 24-port switch and a 1-U DAQ server.
-
Cable management for the Ethernet, clock and hardware trigger cables coming out the front of each crate if the backplane is not used for such communications.
The rack power supplies will provide:
-
Regulated, low-noise, DC power at whatever voltages and currents turn out to be required in the actual design.
-
High efficiency and high power-factor conversion from the 120 V or 240 V single phase AC. The minimum efficiency and power factor will be set to laboratory standards.
-
Monitoring of voltage and current.
-
Distribution of AC power to the DAQ switches and processors.
-
Remote on/off control access to the Monitoring and Control software.
4.8.2 Description
As noted, the racks will be standard, commercial, 19-in models with side panels. The racks may or may not require front or rear doors depending upon the details of the environment and installation. For instance, if the electronics racks are grouped in “huts” as the Super–Kamiokande racks are and as our present baseline assumes, then doors may only be a nuisance, however, if the racks are arrayed around the periphery of the deck as they are in SNO (see Figure 4–9), then doors may help control airflow and prevent unintentional disturbance of the cables or controls.
 |
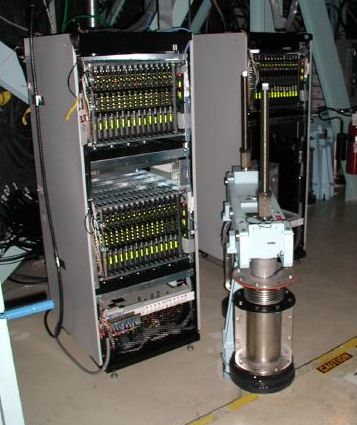 |
| (a) Super–Kamiokande | (b) SNO |
Crates will be bolted into the racks in a semi-permanent manner since the custom boards are the replaceable elements. The DAQ hardware must be easily removable and may require slides or trays to facilitate servicing.
Forced air from fan trays or equivalent will provide cooling for the crates. The total power per crate is relatively modest, less than 1 kW, and so the airflow can be similarly modest. The low-voltage power supplies dissipate some percentage of the crate power (efficiencies for a typical, modern power supply range between 85–90%) so they will need local fans. Air will enter at the bottom of the rack and will be expelled at the top. If rack-level filters are required, we will place them at the bottom front of each rack to facilitate servicing.
The cool and conditioned (i.e. humidity controlled) air that flows through the racks is provided from the external environment. In the baseline plan we assume eight “huts” spaced around the periphery of the balcony and each “hut” has its own local cooling and conditioning system — either heat exchangers running off the central chiller or wall mounted “air conditioners” using the dome air as a heat sink.
4.9 Electronics Installation (WBS 1.4.4.9)
We will install the electronics and DAQ hardware near the end of the installation cycle in the cavern, after much of the other equipment is in place but well before the cavern is ready to be sealed for data taking as described in Section 8.2.3
While still above-ground, each rack will undergo acceptance tests. These will include a full suite of time and charge ramps using the internal electronics pulser plus acquisition of pedestal values for the charge measurement.
The physical installation effort is relatively modest — we must move the 67 large, preassembled and tested racks underground and into their final positions on the deck, then plug or wire them into the already-installed power outlets or junction boxes.
We must attach the DAQ cabling before initial underground checkout can take place. As soon as an individual rack is powered and connected to the DAQ network and the central clock distribution, that rack is ready to undergo the same set of acceptance tests previously done above ground. Only after a rack is certified as fully operational will we install the PMT cables. If these cables are located close to the rack, the PMT cabling process will be straightforward although great care is still required to ensure correct attachment of each cable to its electronics channel. Bar-coded cable labels and connector boards will help to keep cables in proper order.
Actual checkout and commissioning of the PMTs requires a dark cavern. Whereas long dark periods may not be initially possible, we can exploit even short dark periods to check the hardware and software. Once the dark periods get longer, we will couple the electronics commissioning directly with the calibration system commissioning, since triggerable light sources will provide comprehensive early verification of proper operation of the PMTs and the electronics and DAQ.
5 Calibration (WBS 1.4.5)
This chapter describes a reference design for the WCD Calibration System, made up of five separate subsystems. The subsystems are designed to measure the attenuation length of Cherenkov light in the water, to calibrate the PMTs, the energy resolution, the vertex resolution and particle identification efficiency and to monitor the detector environment. The scope of the Calibration System encompasses, for each subsystem, the requirements specification, conceptual design, engineering development, fabrication, installation, integration and commissioning of all components in addition to the measurements and analyses required to convert instrument readings to physically useful quantities. In some cases the subsystems share components.
5.1 Reference Design
5.1.1 Water Transparency
Cherenkov light is scattered and absorbed before reaching the PMTs. The light attenuation length, related to the water transparency, is a critical quantity for many of the physics studies that LBNE wishes to pursue. We have designed a system to measure the absolute attenuation length as a function of wavelength in the visible and near-UV ranges. The design includes four approaches to providing calibration light: mounting fixed light sources at several elevations (to measure stratification of the water volume), lowering a movable light source within the volume’s interior, using naturally occurring muons, and using an external system.
5.1.2 PMT Calibration
The photomultiplier tube (PMT) calibration subsystem measures several quantities including the time-slewing and amplitude response of the PMT and electronics, the angular response of the PMTs, the wavelength-dependence of the PMT response, and the relative responses of each PMT to incident light (their relative quantum efficiencies). The different measurements will use different components, e.g., a fixed central light source will be used for time-slewing calibration and a movable light source will be used to measure the angular response.
5.1.3 Energy Calibration
To determine neutrino-oscillation parameters and reduce background, the energy response of the detector must be understood. This subsystem includes the calibration of the energy scale and linearity, energy resolution, directional dependencies of energy scale and resolution and the stability of the energy calibrations. The energy calibration can be subdivided to separately address low energies ( 50 MeV) for studies of SN neutrinos and high energies (hundreds of MeV to tens of GeV) applicable to the neutrino beam and atmospheric neutrino events. We are conducting studies to determine if we can rely solely on natural sources for the high-energy calibrations. For low-energy measurements we will use both natural sources (Michel electrons) and artificial sources based on designs used by other WC detectors.
5.1.4 Particle Identification and Vertex Resolution
The proper reconstruction of each event depends on the ability to determine the event vertex, the incoming angle of the event, and the nature of the primary particle. Understanding the accuracy of the particle identification as a function of energy is critical for minimizing the backgrounds in the WCD and to properly interpret the neutrino-oscillation signal.
The vertex and angular resolution functions will be determined using a combination of radioactive sources and muons (in conjunction with a top veto) and potentially an electron accelerator. Understanding the efficiency of the particle-identification algorithms will require a detailed understanding of the detector performance — including the propagation of light within the detector. Therefore the primary determination of the particle identification will use a complete Monte Carlo simulation of the WCD. To ensure that the simulation correctly characterizes the behavior of the detector, we will deploy a set of light pulsers capable of crudely mimicking the light pattern from Cherenkov radiation in the WCD to validate the Monte Carlo simulation.
5.1.5 WCD Environmental Monitoring System
The detector-environment monitoring system will monitor the water level, temperature, resistivity, radon content and pH within the detector volume during LBNE’s operational phase. With the exception of the radon-content measurements, commercially available systems with the needed precision exist and will be used. We expect to collaborate with scientists from Super–Kamiokande to develop a radon detector for LBNE similar to the one they have developed that will be sensitive enough to meet our needs.
5.1.6 Interfaces
-
All Calibration Systems interface with the Deck (WBS 1.4.2.3), access ports must be of sufficient number and size to allow for a complete calibration and characterization of the detector volume.
-
All Calibration Systems interface with the Computing (WBS 1.4.7.2 and 1.4.7.3) systems (Online and Offline). The Computing systems provide a framework for the control of the calibration sources and systems, a framework for capturing the state of these systems and a Database for storing the information for later use.
-
The PMT Calibration Systems interface with the Veto regions (WBS 1.4.2), to allow optical fibers from the PMT calibration system to enter the veto region.
-
The PMT Calibration, Energy Calibration, and Vertex/Particle ID Calibration Systems interface with the Electronics/Readout Systems (WBS 1.4.4) which shall accept triggers for these systems.
-
The PMT Calibration and the Water Transparency Systems interface with the PMT Installation Unit (PIU) systems (WBS 1.4.2.6), which shall provide a method for mounting optical fibers used by these systems.
-
The PMT Calibration and the Water Transparency Systems interface with the Floor systems (WBS 1.4.2.4), which shall provide a method for mounting optical fibers used by these systems.
-
The Environmental Monitoring Systems interface with the Water Volume (WBS 1.4.2.5) to ensure that there is no overlap of tasks and all needed tasks are covered.
-
The Environmental Monitoring Systems interface with the Magnetic Compensation System (WBS 1.4.2.8) to ensure that the magnetic field is measured with the accuracy and spatial resolution required.
-
The PMT Calibration System interfaces with the Photon Detector Systems (WBS 1.4.3) to ensure that the required suite of external and in-situ measurements of the PMT characteristics (timing, spatial and angular response, relative and absolute quantum efficiency, etc.) are performed.
5.2 Water Transparency Calibration (WBS 1.4.5.2)
Water transparency in a 200 kTon WCD is a critical quantity for many of the physics studies that LBNE wishes to pursue. As light propagates through the water it is subject to absorption and scattering. Since the light travels different distances to each PMT, the water transparency will affect the amount of light collected by each, and accurate knowledge of the absorption and scattering lengths is necessary for accurate measurement of the energy of a particle and the reconstruction of the track parameters (angle, length, and vertex position). At low incident particle energies (10s of MeV) the water transparency impacts the setting of the trigger threshold in order to observe relic supernovae and solar neutrinos.
We have designed a system to measure the absolute attenuation length as a function of wavelength in the visible and near-UV ranges. Monitors will provide attenuation length values integrated over the bulk of the detector volume, as well as local measurements at different depths and perhaps radii. The system will measure the scattering and absorption lengths independently, as much as possible. In practice, the two measurements are coupled and a complete separation may be impossible.
For any proposed detector configuration, we will need to construct a system or set of systems that can measure an attenuation length in water to near or beyond 100 m. We expect that a 2–5% measurement of the attenuation length will be sufficient, but the required accuracy is not yet completely understood. We require a detailed Monte Carlo study of the effect of errors in the attenuation length on the determination of the absolute energy scale of the detector. Due to the possibility of stratification within the detector volume, the system will need to be capable of measuring the attenuation length at three or four different elevations within the detector.
The measurement of large attenuation lengths is a difficult task. Systematic errors may dominate any given measurement technique and the attenuation length is dependent upon the wavelength of light. Therefore it is necessary to employ a number of independent techniques that cover the range of sensitive wavelengths. Figure 5–1 shows the attenuation length as a function of wavelength as measured by the Super–Kamiokande experiment[13].
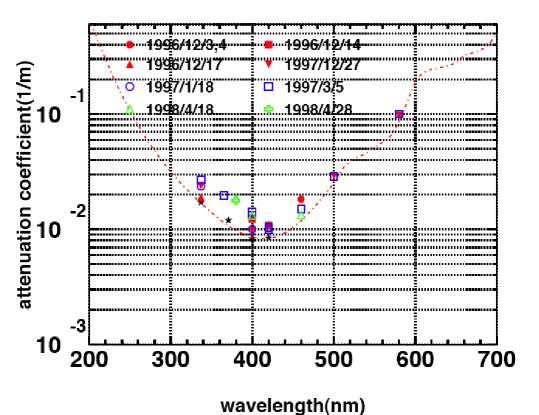
5.2.1 Reference Design
We will develop four approaches to measure the attenuation length of the water, three in situ and one external, based on experiences of collaborators at a number of institutions, including University of Hawaii, Iowa State University, LLNL, Rensselaer, and UC Irvine. The three types of in situ measurements include:
-
Directing a set of light sources across the detector at three or four different elevations. We will use this technique to detect any stratification within the detector volume and to separately measure the scattering and absorption lengths.
-
Utilizing naturally occurring muons that traverse the detector volume,
-
Moving a small, portable system within the detector volume to measure relative attenuation lengths throughout the detector
-
An external system capable of measuring the absorption lengths at multiple wavelengths.
The geometry of our system does not allow for separate measurements of the scattering and absorption lengths. Thus, we plan an additional external system to measure the attenuation length of the water. This system will provide an important cross-check under tightly controlled laboratory conditions. Because of the potential for contamination when moving water from the detector volume to the external system, we will need to locate the external system near the detector.
5.2.1.1 Laser-based in situ system
The Laser-based in situ system allows separate measurements of scattered and absorbed light. By injecting laser light into the detector, both absorption and scattering effects can be observed by PMTs in the injection direction, and scattered light can be observed by PMTs away from that direction. The total amount of light detected depends mainly on absorption length whereas the differences in detection time of scattered versus direct light (i.e., time structure of observed light) depends strongly on scattering length. This enables us to determine the two parameters reliably. Horizontal injection at several different depths will allow us to measure the water quality for several depths and observe any stratification within the detector volume.
We could in principle use a vertical injection system instead, similar to that used by the Super–Kamiokande detector[13] as shown in Fig. 5–2. However, if horizontal stratification exists within the detector volume, any abnormalities at the interfaces of the stratified regions may make interpretation of this data difficult. Therefore a horizontal injection system is preferable.
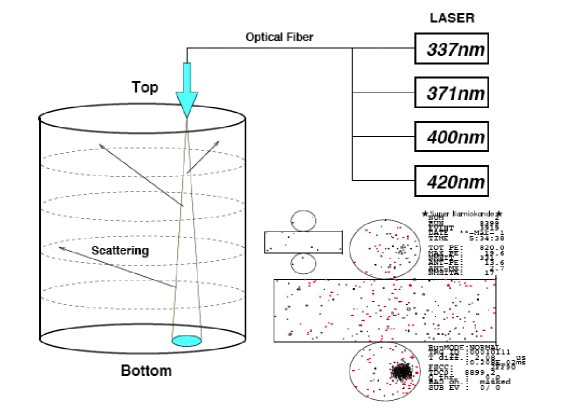
Another possible method is to use a movable light-diffusion ball in the detector. It is relatively easy to move the ball vertically without causing significant disturbance to normal data taking. By accumulating PMT data with different ball positions, it is straightforward to derive the light-attenuation length from the response of the PMTs directly above or below the ball, normalized to that of the wall PMTs. Figure 5–6 shows the possible position of the light-injection fibers for the water-transparency measurement and the movable ball.
This system is based on what is currently in use in Super–Kamiokande. We anticipate some improvements given emerging technologies. The use of a movable diffusion ball and associated controlling hardware and software represents the most significant advance from what already exists. All of the required technologies are known and well understood.
5.2.1.2 Cosmic-ray muon signals for in situ measurements
Cosmic-ray muon signals provide an important cross-check on other measurements, as well as a measurement that is integrated over the Cherenkov spectrum produced by real particle signals as shown in Fig. 5–3
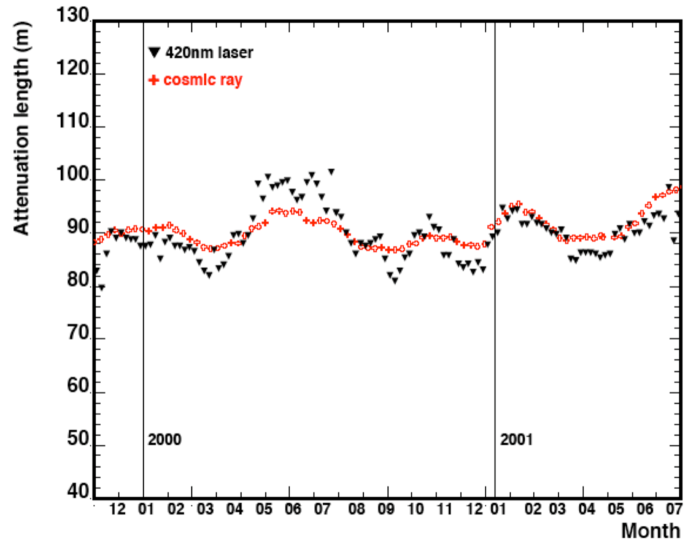
demonstrates the potential usefulness of this approach.
This approach is based on proven techniques developed in Super–Kamiokande. We can determine the attenuation length by fitting the muon sample and comparing the light-path length and deposited charge observed by a PMT. We correlate the observed changes with the optical quality of the water. While this provides (for Super–Kamiokande) one of the most effective ways of monitoring this quantity, the challenge for LBNE arises from a significantly lower cosmic-ray rate: 0.2–0.3 Hz, about a factor of 10 smaller than Super–Kamiokande. Simulations and reconstruction will be developed to determine the time granularity allowable at these rates.
5.2.1.3 Portable in situ measurement system
A small device, easily movable throughout the detector volume, that can monitor gross changes in water transparency may prove useful. The challenge, of course, is determining changes in an attenuation length nominally near 100 m with a device less than a meter in size. Nevertheless, commercial devices are available that might provide this capability.
To this end, we have purchased a C-Star Transmissometer from Western Environmental Technologies (WETLabs) Inc, and are working to understand its ability to continuously monitor the water clarity in blue light (see Fig. 5–4).
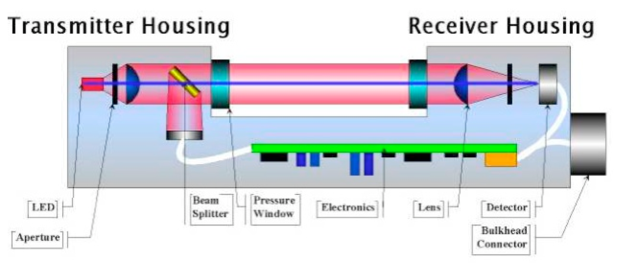


The device has only a 25-cm lever arm, but is very stable and should provide a measure of the water clarity, particularly if the attenuation length catastrophically drops below tens of meters. We have been working towards evaluation of this device as a continuous, online monitor of water clarity. The version we purchased is fitted with a 470-nm LED light source and was calibrated at the factory for the long (90-m[26]) attenuation lengths for ultra pure water at this wavelength.
Figure 5–4 also shows the present status of our tests. We used the device inside a 40-gallon stainless steel test vessel through which water can be circulated, either through a filtering and deionizing system or bypassing it. We cycle the water condition through alternate “purification” and “poisoning” phases. These cycles are clearly observed in the plot of conductivity versus time. We also measure the output of the (12 bit) C-Star photodiode sensor ADC. Comparing the three plots, we see a clear correlation of conductivity (hence reduced purity) with reduced light intensity at the ADC output. If an ADC value of 3820 corresponds to an attenuation length m (after subtraction of a small ADC offset), then a value of 3760, reached after 5 days of no purification, implies m (exponential attenuation).
The C-Star Transmissometer is an off-the-shelf item from a vendor with whom we have already established a relationship. Most of the cost associated with implementing it in our experiment, has to do with the logistics of engineering mechanical support and computer interface, all of which are straightforward. Our tests so far have been illuminating. We have demonstrated with the device that water of the same conductivity can have dramatically different attenuation lengths; in our test facility we have seen differences between 90 m and 40 m both at a resistivity of 2 M-cm. Indeed, it is the gross, local changes in transparency that we expect to monitor best with this device, after we have engineered a mechanism for inserting it and moving it through key areas of the detector.
For both C-Star and U. Hawaii Super–Kamiokande systems, probably the lasers present the most important safety issue. The C-Star is sealed and the beam runs only between the transmitter and receiver. Workers will be trained in the safe use of laser technology and all lasers will be operated in a light-tight enclosure. We do not anticipate the use of any dye lasers, hence eliminating chemical hazards.
5.2.1.4 External measurement system
An external device to measure attenuation length is needed to monitor and analyze each component of the water purification system. It should measure attenuation lengths at the same wavelengths as the in situ system to allow comparisons. In addition, this system provides precise information in controlled situations and will monitor long-term changes as well as the effects of various solutes such as Gd.
Three groups involved in LBNE have designed and operated sophisticated water-attenuation-length instruments.
Groups at UCI and BNL employ a vertically mounted tube with a laser at one end and a photo detector at the other. The water level determines the length over which the attenuation is tested, a significant parameter for the measurement. A fit to the measurement of light intensity as a function of height directly extracts the absolute attenuation lengths. It has been demonstrated that with 3 m to 6 m of height the attenuation length can be measured to the required level of 5% even if the attenuation length exceeds 100 m.
LLNL, on the other hand, has built a very long horizontal tube, limited only by the available horizontal space, which is typically greater than the available height. Since the tube is horizontal, it is much more difficult to change the length of the test medium. The measuring instruments are usually set to a particular length and are sensitive only to relative changes in transparency. However, by comparing a very short (15 cm) cell to the full length one, it may be possible to use such a system to make an absolute measurement of the attenuation length, assuming that the attenuation depends exponentially on the length of the water column.
Each of the devices at LLNL and UCI have been under development for several years. Deciding on a specific technology will take some time, but improvements in the devices and understanding their results are already well underway. Once we decide on a technology, it will be straightforward to interface with the engineering team for the cavity area on either the deck or in the cavern underneath, for placement of this device.
The LLNL and UCI devices are shown in Fig. 5–5.


Each is in the process of being upgraded for more automatic data-taking.
5.2.2 Interfaces
- Laser system
-
The internal system of lasers will need a small space for the laser and optical switches and fibers that penetrate into the detector volume, most likely mounted on the PMT support frame. The PMTs will serve as the light sensors.
- Portable System
-
This requires further study. It would be best to lower the C-Star(s) to various fixed positions as it seems impractical to move it continuously while monitoring its position in real time.
- External System
-
An external instrument would require a system of tubes to extract water from a range of locations. We would want to automate the system to make the extractions quick and be minimally disturbing to data taking. Water may also be taken from the water-filtration system inlets and outlets. This system will require a stable (low-vibration) environment, and if vertically oriented, a high-bay space of 9 m.
-
The Online Computing Systems (WBS 1.4.7.2) shall provide a framework for the control of the in-situ systems (both portable and fixed laser/LED systems).
-
The Online Computing Systems (WBS 1.4.7.2) shall provide a framework for capturing and storing the state of the in-situ systems.
-
The Offline Computing systems (WBS 1.4.7.3) shall provide a framework for storing data gathered by the water transparency systems.
5.3 Photomultiplier Calibration (WBS 1.4.5.3)
PMTs require a variety of calibrations, including the time-slewing and amplitude response of the PMT and electronics, the angular response of the PMTs, the wavelength-dependence of the PMT response, and the relative responses of each PMT to incident light (their relative quantum efficiencies). This section addresses these measurements, all of which are done in situ. The calibration of the PMTs in the top veto region is also addressed in this task.
The individual calibration measurements use different components. For example, a fixed, central light source will be used for time-slewing calibration and a movable light source will be used to measure the angular response. The central light source has a fixed position when inserted in the detector volume, but is moved out of the detector when not in use through the central calibration port of the deck. All of the“in water” light sources are generated using a common light source and external monitoring and control equipment. This is illustrated in Fig. 5–6
5.3.1 Design Considerations
The measured pulse height of a PMT signal depends on the amount of light incident on the PMT (therefore on the energy deposited in the detector, the event geometry, and the water quality) and the response of the individual PMT. For a PMT signal with a fixed rise time, the time it takes to reach a given voltage is shorter as the amplitude of the signal increases. This effect, known as electronic slewing, changes the measured arrival time of the light at the PMT depending on the amount of incident light. Both the time and the voltage must be measured and corrected for in the PMT data, channel-by-channel, before proceeding to more advanced calibration (e.g., of absolute energy, second-order vertex reconstruction, and so on).
The gain of a PMT is measured as the charge collected at the last dynode (in units of the electron charge) when a single PE is collected on the first dynode. The quantum efficiency of a PMT relates the number of incident photons (on the PMT active photocathode area) to the number of photo-electrons liberated from the photocathode. The collection efficiency (typically 90%) relates the number of liberated PEs to the number of PEs collected at the first dynode. Below we will refer to the quantum efficiency (QE) as the combination of quantum and collection efficiency.
PMT-to-PMT variations in QE are not negligible. In particular, the collection efficiency is affected by the magnetic field around the PMT. This is especially true for the larger PMTs typically used in a large water Cherenkov detectors. While geomagnetic field compensation coils (or passive magnetic shielding around each PMT) will be used, there will be a residual, spatially varying field within the WCD. Thus each PMT will have a somewhat different magnetic field environment. This will be exacerbated (relative to Super–Kamiokande) due to the proximity of the PMTs to the magnetic compensation coils.
While there is wavelength-dependence to the QE, it is a property of the photocathode material and therefore PMTs of a given type generally show little variation. The QE value near the wavelength of maximum sensitivity, around 410 nm, is usually taken as a reference point.
To determine the absolute gain of each PMT, its amplitude response is measured at very low light levels, where the signal is predominantly either zero or one PE (and mostly zero). Knowledge of the PMT gain at one PE coupled with ability to inject variable (known) levels of light up to very high PEs per PMT allows measurement of the non-linear response of the PMT throughout its useful range. If the light source is isotropic (or nearly so) and/or movable, it can be used to measure the relative QE of the PMTs.
Prior to installation, WBS 1.4.3 will conduct characterization studies of the PMTs in a laboratory setting (see Section 3.2.2). We are aware of considerations that can lead to a substantial change in the PMT response characteristics between the cavern and lab environments. First, it is important to test the PMTs in water, as the optical properties of a water-glass interface are substantially different from those of an air-glass interface. It may not be feasible to perform such measurements on all of the PMTs, but instead on only a sample. Secondly, the PMT response is affected by the magnetic field environment, and we know that the field in the cavern will be somewhat different from that in the testing laboratory. Thirdly, the response of a PMT is dependent upon the wavelength of the incident light; therefore, we need to measure the PMT response either over a range of wavelengths or at a wavelength consistent with the Cherenkov light detected in an event.
In general, once the initial calibration constants are established, the calibration does not require dedicated runs. Rather, it is intended to run along with regular data-taking, but at a low rate, of order a few Hz. The events acquired with this calibration trigger must be properly tagged as such, so they can be easily identified and sorted during data analysis.
5.3.2 Required Measurements
The PMT calibration system will determine the absolute gain of each PMT, but only relative QE of the PMTs. The absolute QE (including collection efficiency) will be measured in an integral fashion by the Energy Calibration task (WBS 1.4.5.4; see Section 5.4).
The PMT calibration will need to make measurements of the following quantities to the precisions given:
-
Timing: measure slewing-corrected PMT hit times to 1 ns over a pulse height range from 1–100 PE.
-
Charge: measure the number of PEs in each PMT to 10% over the same range.
-
Relative QE: measure the relative quantum efficiency of the PMTs to within 10%.
5.3.3 Reference Design
The PMT calibration system will consist of a pulsed-laser light source, an optical fiber for a light guide, and a light-diffusing ball located near the center of the water volume. Figure 5–6 shows a schematic diagram of the PMT calibration system. Note that several of the components will be designed such that they can be set to different “modes” and used by other calibration tasks, in addition to PMT calibrations.
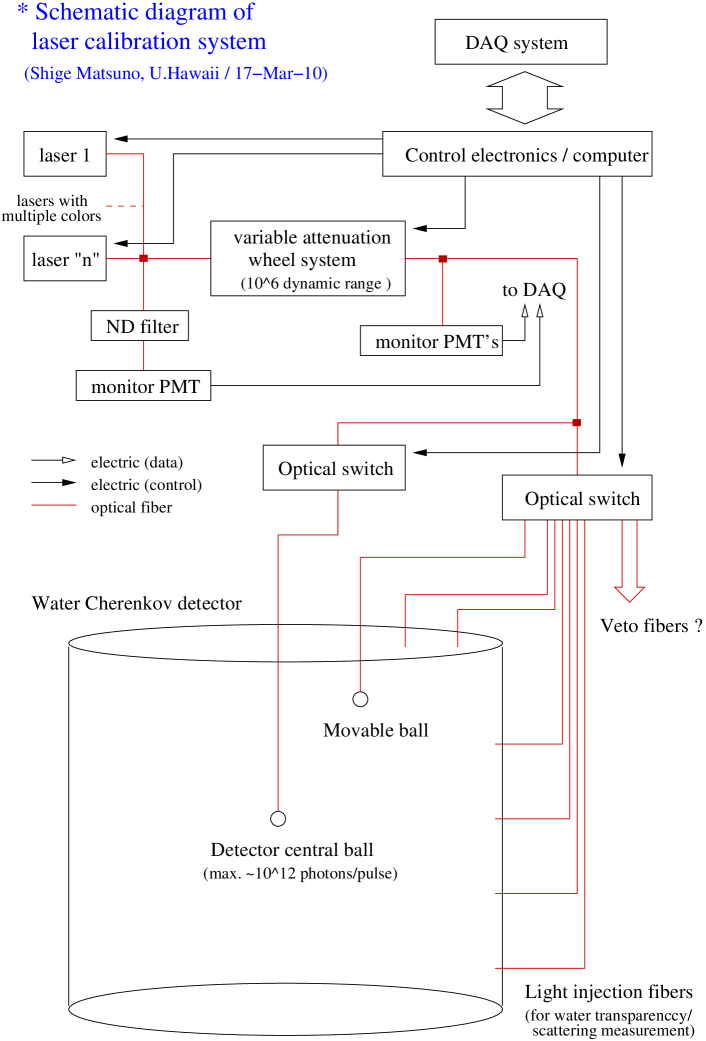
To measure the relative quantum efficiency of the PMTs and the response of the PMTs as a function of incident angle, we will need a reasonably isotropic light source. This is provided by the ball, “fed” by the lasers via the optical fiber. As a unit, these are called “the source”. We will need to map the source to correct for any non-uniformities in the angular distribution of its emitted light. The ball will be movable (in the direction) to enable a cross-check on the light-source uniformity and the angular response of the PMTs. Laboratory tests are underway to develop an isotropic light source. If a sufficiently isotropic source cannot be developed the distribution of light as a function of azimuthal angle will be measured and a mechanism for determining the orientation of the light source will be developed.
The source must generate light over a wide intensity range (also called dynamic range). It must provide sufficient light to saturate the most distant PMTs (1000 PEs) and still be able to deliver a small amount of light (0.1 PE) to the nearest PMTs. Given the difference in distance from the center of the tank to the nearest and farthest PMTs (a difference of a factor of 1.7), and a reasonable margin (10), the light-source system feeding the central diffusing ball requires a dynamic range of nearly and must be capable of delivering 1012 photons to the ball (for anticipated efficiencies through the entire calibration system). A variable-attenuation wheel system and neutral-density (ND) filters on the laser beam will distribute light with the required dynamic range to the ball, and thus to all the PMTs in the detector.
To meet the timing requirement, the laser must be pulsed, with a pulse duration of a few ns or less. We will use multiple lasers (see Fig. 5–6) to cover the range of wavelengths over which the PMT response will be measured. A set of monitoring PMTs will measure the pulse-to-pulse variation in the light generated by the lasers.
Before and after passing through a variable-light attenuator, an optical splitter sends a fraction of the light to monitor PMTs. The remainder is routed to an optical switch. Depending on the calibration mode, the optical switch (under computer control) will route the light to the central diffusing ball, the veto region fibers, or the in situ water transparency measurement system (see WBS 1.4.5.2). If a veto region is present it is advantageous to have two optical switches (shown in Fig. 5–6) to allow for simultaneous pulsing of the veto region and central detector.
The measured arrival time of each hit on the detector PMTs as a function of incident-light level will be used to generate a 2D histogram, known as a T-Q map. This information (arrival time as a function of signal amplitude) contains the time offset (or timing pedestal) and the spread in arrival times at a given amplitude, as a function of light level (or amplitude). This information will be used to correct for electronic and PMT-slewing effects in the data processing chain. This system will also be used to measure the gain of each PMT. Laser light of selectable intensity can be delivered to the light-diffuser ball and distributed to all the PMTs in the detector. Using Poisson statistics the occupancy of the PMT (the fraction of the time that the PMT detected 1 or more photo-electrons) can be related to the number of PEs detected. At low values of occupancy, this relation can used to determine the gain at 1 PE. By varying the incident light level (in a well measured fashion) the gain can then be measured at all light levels (limited by the brightness of the source).
With an isotropic light source this same system can be used to measure the relative QE of the PMTs. While the angular response of the diffuser ball may not be perfectly uniform, the light output will be a smooth function of angle, so the difference in the incident light level between adjacent PMTs will be small. Therefore, the relative quantum efficiency (including collection efficiency) between adjacent PMTs will be measured with reasonable accuracy, after appropriate geometrical corrections. Clearly, the more uniform the light source, the more accurate the determination of the relative QE of the PMTs will be. Development of a uniform light source and determination of the achievable accuracy in the measurement of the relative QE requires further work which is now underway.
5.3.4 Interfaces
The PMT calibration system requires the following access ports to the water volume:
-
A central access port on the deck to place a light-diffusing ball in a central position of the detector. Ideally this would be a dedicated port on the axis of cylindrical symmetry. This has been coordinated with the Deck Design (WBS 1.4.2.3).
-
A dedicated access port for a second (movable) light-diffusing ball. Preferably this port would be midway between the center and wall of the detector.
-
Access for vertical laser beams from the tank top for light-injection fibers.
-
Access for horizontal beams, prior to filling, for light-injection fibers (for water transparency measurement). These fibers will be installed with the PIUs (see WBS 1.4.2.8).
-
Multiple access ports within the veto region (geometry-dependent) if a veto exists
In terms of general lab equipment, the system will also require:
-
Protected cableways from the laser station to deck ports.
-
Cable guides for communications links to and from the central DAQ station.
-
One cabinet, one workbench, an electronics rack, about 10 m2 of space, and about 2 kW of available AC power, centrally located on the top of the detector, for the laser station.
The required interfaces to the DAQ include:
-
A trigger (or at a minimum, an event-type flag), provided by the calibration system to the DAQ.
-
A connection between the calibration system monitoring PMTs and the DAQ, for light-intensity and timing reference monitoring.
-
Additional communication lines to the DAQ and the slow-controls system, to supply calibration system settings to the data stream for later use.
Required interfaces to Computing:
-
Framework for control of calibration system (WBS 1.4.7.2).
-
Framework for capturing state of calibration system (light levels, filter positions, fiber switch position, etc.) (WBS 1.4.7.2).
-
Framework for storing calibration constants for Offline processing (WBS 1.4.7.3).
5.4 Energy Calibration (WBS 1.4.5.4)
The determination of the neutrino mixing angle and the CP violating phase depend on measuring the neutrino oscillation probability as a function of energy for neutrinos and anti-neutrinos and comparing that to the unoscillated neutrino spectrum extrapolated from the near detector measurement. Therefore the WCD must be capable of accurately measuring the neutrino energy spectrum in an absolute sense (for comparison to the near detector) with good resolution to determine the neutrino mixing parameters and the neutrino mass hierarchy. This requires a stringent calibration program to measure (in-situ) the energy response of the detector. The Energy Calibration task includes the calibration of the energy scale and linearity, energy resolution, directional dependencies of energy scale and resolution and the stability of the energy calibrations.
The energy calibration can be subdivided to separately address low energies ( 50 MeV) for studies of supernova neutrinos and high energies (hundreds of MeV to tens of GeV) applicable to the neutrino beam and atmospheric neutrino events. For nucleon-decay searches the relevant energy range reaches from several tens MeV to several GeV.
5.4.1 Energy Calibration Goals
Following the achievements of similar previous experiments, the calibration goal for the determination of the energy scale in all relevant energy regions is a 2% better[13]. The minimum energy resolution requirements are estimated to be 5%/ above 100 MeV, 50%/) have demonstrated energy stabilities of order 1%[13]. The above numbers serve as guideline only and may be modified once the studies to determine LBNE’s required energy resolutions and scale uncertainties to achieve its physics goals have been concluded.
We expect to conduct a comprehensive simulation-based study to determine energy calibration requirements as well as a calibration strategy. The strategy will identify which calibration sources and tools will be used to address the previously determined requirements. It will also identify the systematic limitations of each calibration device and a first estimate for the required frequency and duration of each source. Such a calibration strategy will aim to maximize the detector lifetime.
5.4.2 Energy Calibration Strategy
The PMT Calibration (Section 5.3) covers the conversion between measured pulse height in each PMT to incident photons on the PMT. That system will determine the single PE level and the linearity of the PMTs to 100 PEs. It is the task of the Energy Calibration to convert this incident light level to an energy deposited in the detector volume. This will be accomplished by tuning Monte Carlo simulations with measured detector parameters (water transparency, PMT coverage, PMT calibrations, effect of light collectors, etc.) and a “top-down” strategy based upon naturally occurring events of well-known energy (Michel electrons, stopping muons, neutral pion decay) and low-energy radioactive sources placed throughout the detector volume. Through-going muons will be used to verify the calibration at high energies. The difference between the tuned MC predictions and the verification data sets are a measure of the uncertainty in the energy scale of the WCD.
The frequency of calibrations will depend upon the timescale over which the detector parameters change. It is envisioned that early in the detector operations calibrations will be performed relatively frequently (of order 3–4 times in the first year). Based upon measured differences between these calibrations a long-term strategy will be developed. The detector will be calibrated as often as is necessary to maintain a calibration within the requirements established above.
The potential physics that a very large water Cherenkov detector may address spans more than two orders of magnitude in energy and hence at least one well understood calibration source per energy range is required to determine the absolute energy scale and determine linearity. Consequently, the energy calibration program will be split into a high- and low-energy program. We believe that the energy calibration can be accomplished by a combination of naturally occurring events inside the detector, such as through-going and stopping muons, Michel electrons and to some extent neutral pions as well as a series of dedicated radioactive sources. The latter will have to be deployed at various locations inside the detector volume. The following sections will detail the baseline options and discuss alternatives.
5.4.3 High-energy Calibration ( 100 MeV)
The goal of the high-energy calibration is to provide a good understanding of the energy scale and resolution in the hundreds of MeV to several GeV energy region in support of LBNE’s primary objective of detecting beam neutrinos in this range.
5.4.3.1 Design Considerations
Cosmic muons that stop inside the detector can serve as a primary calibration source at high energies (although the rate of stopping muons is expected to be less than 10% of the total muon rate) and through-going muons with a known track length can be used to quantify the uncertainty in the energy scale at high energies.
The first step in the development of a quantitative energy calibration strategy will be to perform a muon versus high-energy accelerator trade study to determine whether cosmic-ray muons (through-going and stopping) can satisfy the calibration requirements at high energies.
All proposed energy calibration sources except the GeV-scale electron accelerator have been used and deployed in past water Cherenkov experiments and serve as proof of concept. A remaining uncertainty with the design of these systems is the deployment mechanism and the geometry of the detector and detector access. For the GeV-scale accelerator, feasibility studies would need to be performed.
The other calibration sources such as stopping cosmic muons and neutral pions would then serve as cross checks of the MC predictions and a comparison between data and MC would allow determination of the uncertainties in scale and resolution at additional energies.
The naturally occurring muons are also needed for determining the angular resolution of the WCD and may be included even if an accelerator option is selected (though such a system may obviate the need for an accelerator). Given that the accelerator option has some degree of technical risk, our current approach to the baseline design is to exclude the conventional accelerator, with the understanding that we will investigate both options. We will make the decision on the need for an accelerator prior to CD-2 based on the following criteria:
-
1.
The average energy deposited in the detector for a well characterized class of events should be known to better than 5%.
-
2.
The systematic error in the energy deposited in the detector should be less than 1%.
-
3.
The system should be capable of depositing energy at various locations within the water volume. If possible, both vertical and horizontal track geometries should be created.
-
4.
The deposited energy should be variable between 500 MeV and 5 GeV.
-
5.
Stray radiation entering the water volume should be minimized.
-
6.
Radiation safety issues associated with the system should be understood and mitigated.
-
7.
The technical risk should be low at the time a decision is made.
In addition, we will consider the cost of the system (including the impact on conventional facilities cost), the schedule (i.e. complexity and time of installation) and the interface requirements and their impact on the overall project schedule.
5.4.3.2 Reference Design
It is conceivable that the energy calibration can be accomplished by a combination of naturally occurring events inside the detector, such as through-going and stopping muons and to some extent neutral pions if these events can be identified with good accuracy and occur sufficiently often. A study is currently underway to determine whether the naturally occurring sources will be sufficient to calibrate the WCD at high energies.
Natural Sources
Assuming the naturally occurring events are frequent enough and can be adequately identified, good reconstruction algorithms to identify muons entering into the detector are also required. Uncertainties in track length reconstruction have a critical impact on the ability to determine the energies of stopping muons. Although it is not possible to measure the energy of through-going muons, they can be used as a check on the established energy scale. For through-going muons the variation of energy loss in the WCD for a fixed track length can be obtained from MC simulations. If a class of events can be identified (excluding events with large bremsstrahlung energy loss interactions) where the rms of the energy-loss (for a fixed track length) is sufficiently small, these events can be used to measure the uncertainty in the energy scale at high energies.
At the foreseen detector depth of 4850 ft (4290 m.w.e.) the expected rate of muons is (2.3 0.7) 10-5 m-2s-1 and the expected average muon energy is around 320 GeV[9]. For a cylindrical detector with a 65 m diameter and 83 m height this translates roughly into a muon rate of 0.2–0.3 Hz. It is apparent that the low muon rate is a critical factor in determining a calibration strategy. Calibrations with cosmic muons require sufficient events which can be used to validate software algorithms to reconstruct, identify and select suitable events in larger quantities. Estimates on track-length reconstruction or energy-loss spread for a fixed track length are not yet available. These studies to estimate our ability to measure the energy resolution function and scale uncertainty as function of time (e.g. sample size) based on a number of reasonable assumptions for track reconstruction uncertainties and other parameters are currently underway. This study will also determine the amount of time required to acquire a statistically significant sample of Michel electrons.
Artificial Sources
If it is found that the muons are not a suitable calibration source then the collaboration will investigate the design of a conventional high-energy accelerator capable of delivering between 1 and 20 electrons per pulse, each with an energy of 100 MeV to the water volume. Because the cost of such a system would be high, including conventional facility requirements (additional large drift and power consumption) and previous experiments operated successfully without such a system, the baseline design for the WCD does not include a high-energy accelerator.
5.4.4 Low-energy Calibration ( 100 MeV)
A second physics baseline objective for the WCD is to characterize the detector response in the energy range relevant for solar and SN neutrinos as well as nucleon decay which ranges from a few MeV to hundreds of MeV and even a few GeV. For a megaton scale water Cherenkov detector to address solar neutrino physics questions it is critical that the energy response in the few to 20 MeV energy range be mapped out in detail such that spectral distortions can be measured accurately and backgrounds not be misinterpreted as neutrino signal.
5.4.4.1 Design Considerations
The addition of gadolinium to the water as a detector enhancement is discussed in Chapter 9. The addition of Gd serves primarily to increase the detector’s sensitivity to observing the diffuse neutrino background which originates from past supernovae. The relevant energies span the region around a few tens of MeV. Having a well defined energy response is necessary when searching for low-multiplicity event clusters while also trying to minimize accidental coincidences since the positron originating from the inverse beta decay reaction tends to have on average a higher energy compared to low background events. As a result the detector’s energy response in the region of 5–10 MeV needs to be well understood if this option is exercised.
5.4.4.2 Reference Design
Radioactive sources and Michel electrons will be used to calibrate the energy region from a few MeV to 50 MeV. In addition, a low-energy linear accelerator (LINAC) can provide accurate absolute energy-scale calibration at numerous positions inside the detector and at a few different energies below 20 MeV. It is a suitable choice for tuning any MC simulations in the low-energy range. All other sources listed below would serve as cross checks and would help extract uncertainties in energy scale and resolution by comparing data with MC predictions.
Michel Electrons
In the energy region from a few MeV to 50 MeV, Michel electrons are an excellent calibration source. However, due to the relatively low rate of stopped muons inside the detector, the achievable accuracy may be rather limited. The foreseen calibration study will determine the required amount of time to accumulate a statistically significant sample of Michel electrons. Depending on the outcome, Michel electrons could either be used as a primary calibration source or as a secondary addition to artificial sources.
Artificial Sources
We plan to use radioactive gamma and beta sources and a low-energy linear accelerator (LINAC) of energy 5–16 MeV as calibration sources. Specifically, the use of a 16N source (6 MeV)[27], a 8Li source (up to 14 MeV)[27], a Cf-Ni source[27, 13], and a pT source (19.8 MeV gamma rays from the reaction 3H(p,He)[27] are anticipated. All of these types of sources have been used successfully in other water Cherenkov detectors and it is expected that the designs will need only slight modifications to withstand the higher pressure of 6 atmospheres at the bottom of the vessel.
Deployment of Sources The deployment of radioactive sources involves the development and construction of specific source geometries and containers, and of a deployment system that can interface to and deploy a variety of different calibration sources with a positional accuracy of a few cm. Multiple calibration access ports are foreseen and hence it is possible to access various positions inside the detector with a wide range in radius, azimuthal angle and depth by means of a relatively simple single axis vertical deployment system which could be moved from one access port to another. If further studies reveal variations in the expected detector response (position dependence, angular dependence) to be large and the resulting requirements call for a more fine-grained calibration grid alternatives such as a movable arm with multiple sections will be considered.
All calibration devices must be able to enter the detector volume through one or multiple access ports on the detector deck and must be constructed in a way such that they are fully retractable so as not to interfere with detector operations during regular data taking. The deployment system can be subdivided into three components, 1) movable deployment hardware, 2) movement control and sensing, and 3) interfaces to the detector deck and sources.
5.4.5 Interfaces
The energy calibration system requires access to the detector volume by means of access ports. The detector deck around the access ports will have space for mounting fixtures for the deployment devices (see WBS 1.4.2.3). (Note the current deck design incorporates the needs of this Calibration WBS element. Proposed changes to the deck design are appropriately vetted through the Calibration group.) A nearby shielded accelerator enclosure may be required (not in baseline). The electronics should have provisions to allow triggers for some of the sources. Electronics and DAQ constraints must be understood when selecting source strengths. The PMT timing capabilities will dictate how accurately the deployment system must be able to position a given source. The Online Computing Systems (WBS 1.4.7.2) shall provide a framework for the control of calibration sources. The Online Computing Systems (WBS 1.4.7.2) shall provide a framework for capturing the state of calibration sources. The Offline Computing Systems (WBS 1.4.7.3) shall provide a database framework for storing calibration state information.
Generally speaking it will be beneficial to have a relatively large overhead space on the detector deck so as to be able to insert large sections (7 m) of the deployment device through the access holes and in order to be able to mount motion-control hardware.
5.5 Particle Vertex and ID Calibration (WBS 1.4.5.5)
The Particle Vertex and ID Calibration task includes investigation of known systems and development of new ones to calibrate the vertex and angular resolutions, vertex shifts and particle identification efficiency.
Calibration of the vertex reconstruction and improvement in particle identification is essential to reduce the major sources of background events that may be misidentified as events, for the appearance search in the neutrino beam. These include:
-
Neutral current (NC) neutrino-scattering events in which the produced decays asymmetrically decays into 2 photons where only one may be detected.
-
Charged current (CC) scattering events, that are mis-identified as charged current quasi-elastic (CCQE) events.
The particle vertex and ID calibration will be subdivided to address specific issues related to:
-
1.
Lower energies (50 MeV) for studies of supernovae, relic supernovae and solar neutrinos
-
2.
Higher energies for accelerator-neutrino and atmospheric neutrino studies (between 100 MeV and 1–2 GeV) and for nucleon decay (50 MeV to several GeV).
5.5.1 Design Considerations
Vertex and angular resolution along with the particle identification
efficiency vary as a function of energy and whether the event is e-like or
-like. Similar WCDs (mainly Super–Kamiokande), have achieved vertex resolution of 30–50 cm
(increasing to 90 cm in the solar neutrino
energy region of 20 MeV), angular resolutions better than 3∘ (up to 25∘ at
10 MeV) and particle misidentification of less than 10% for all particle
types in the energy range of primary interest (up to 1–2 GeV). While
these numbers should serve as a rough guideline for LBNE, other
factors may limit the resolution of LBNE.
Many of the calibration techniques we plan to use are similar to those used by Super–Kamiokande. The main differences between LBNE and Super–Kamiokande are the photocoverage, the granularity, and the addition of
light concentrators (either Winston cones or wavelength shifting plates) that will be placed on the PMTs.
Current LBNE baseline for photocoverage is to achieve the level of Super–Kamiokande-II 20% photocoverage. To attain this coverage with 29,000 12-inch HQE PMTs will require the use of light concentrators (LCs) to increase the light collection by at least 42%.
While light concentrators are very efficient in collecting more light, they also put more reflected light into
the detector and affect the timing profile of the detected light.
Winston cones also add a certain level of spatial asymmetry to the detector.
A detailed Monte Carlo study is required
to determine the resolution and its variation throughout the detector
volume to ensure that LBNE can meet its physics goals. These
MC studies play an essential role in understanding and properly calibrating and accounting for the
additional complexity in the photon optics that arise from the use of light concentrators.
The success of solar-neutrino studies with the LBNE WCD will depend on the photo-coverage (which affects the energy threshold), the vertex resolution, and the particle identification efficiency. Low-energy particles leave almost point-like tracks and emit very little light. Therefore, vertex resolution in this regime is based on timing information alone. Good vertex resolution is necessary for muon-track measurement. Muons represent the dominant source of background for solar neutrino oscillations through nuclear spallation. Calibration of the vertex resolution affects the number of neutrino events properly reconstructed within the fiducial volume. Together they will lead to proper identification of backgrounds and accurate solar-neutrino signal measurement.
5.5.1.1 Low Threshold with Gadolinium
The addition of Gd would primarily increase the detector’s sensitivity to the diffuse neutrino background from past supernovae. The identification of the inverse beta decay interaction of on Hydrogen over the backgrounds will depend on measuring a prompt positron in coincidence with a delayed neutron capture on Gd. Thus, calibration of the vertex resolution will play an important role in identifying neutron captures on Gd. High particle-ID efficiency is needed for accurate measurement of different -flavor fluxes from supernova explosions. The relevant neutrino energies span the region around a few tens of MeV.
5.5.2 Reference Design
The particle-vertex and ID calibration require a combination of:
-
A set of dedicated systems installed inside and outside of the detector,
-
Naturally occurring events inside the detector (e.g., Michel electrons) and
-
Radioactive sources deployed at various locations inside the detector volume.
Investigation of the potential benefits, feasibility, cost and effectiveness of several dedicated systems has been planned for both low- and high-energy options (WBS 1.4.5.4.). The potential dedicated systems include:
-
Cherenkov-simulating light pulsers (CSLP) are battery-operated light pulsers capable of producing single and multiple Cherenkov-like light cones in different directions with various opening angles. Simultaneous generation of two Cherenkov-like cones is particularly important for studying single neutral-pion identification inside the detector. The CSLP will allow verification of the algorithms used for finding Cherenkov-light rings under controlled conditions throughout the energy range of the detector. It will produce a distinct light-pulse signature to trigger the detector and mark the onset of each calibration event.
This option becomes especially attractive in order to properly address challenges imposed by the addition of light concentrators on the PMTs and their effect on the measured timing profile.
-
Low-Energy Electron Accelerator Injection of downward-going electrons of known energy and position will provide vertex-resolution calibration as a function of energy and position. A LINAC must be used in the low efficiency regime of about 1 electron/pulse. The main challenge in utilizing a LINAC (Electron Linear Accelerator) for calibration purposes is the reduction of beam intensity from 106 electrons/pulse to 1 electron/pulse. Such a LINAC was used in the Super–Kamiokande experiment to calibrate the detector in the low-energy range (5 MeV – 16 MeV). Details of a low-energy LINAC concepts are described in (WBS 1.4.5.4.).
-
Radioactive sources are described in detail in (WBS 1.4.5.4.). Gamma and beta sources will be designed and deployed to assess any vertex shift in the detector. Various radioactive sources will be used to calibrate the vertex resolution as a function of energy in the low-energy regime up to 20 MeV, where vertex resolution deteriorates quickly with decreasing energy.
Key uncertainties are the selection of LC technology (Winston cone or wavelength shifting plates) and the design details of the CSLP and its deployment mechanism. Input from the simulations is needed to quantify the effectiveness of using naturally occurring events in the detector for the vertex resolution. The impact of LC design on vertex/ID resolution must be addressed by simulations.
5.5.2.1 Interface Requirements
-
The Online Computing Systems (WBS 1.4.7.2) shall provide a framework for the control of the the Cherenkov-simulating light pulser (CSLP).
-
The Online Computing Systems (WBS 1.4.7.2) shall provide a framework for capturing the state of the CSLP.
-
The Offline Computing Systems (WBS 1.4.7.3) shall provide a database for storing the state of the CSLP.
-
The CSLP will enter the water volume via access ports in the deck (WBS 1.4.2.3). The requirements for the CSLP are satisfied by the requirements for the Energy Calibration (size and number of access ports) — WBS 1.4.5.4.
-
The Electronics Trigger system (WBS 1.4.4.5) shall provide a mechanism for accepting triggers from the Calibration system.
-
Electronics and DAQ constraints (WBS 1.4.4) must be taken into account when designing CSLP triggering rates and the strength of the radioactive sources.
5.5.2.2 Physical Requirements
Particle-vertex and ID calibration hardware shares its physical requirements (WBS 1.4.5.4.1), since a number of devices will be used for both calibration purposes. In addition, CSLP will need to a very modest storage space.
5.5.2.3 Safety Requirements
Any radioactive sources that are used for calibration of the vertex resolution will be the primary responsibility of the energy calibration task (WBS element 1.4.5.4). The safety considerations for these sources will be the the responsibility of the WCD safety officer and the WBS element 1.4.5.4.
5.6 Detector-Environment Monitoring (WBS 1.4.5.7)
The purpose of this calibration task is to monitor parameters within the WCD volume that may affect the detector’s performance and long-term stability, and to develop and implement corrective actions should the environment deteriorate. Changes in some environmental parameters (e.g., radon content) could cause an immediate decrease in detector performance, while others (e.g., temperature or water level) could lead to a long-term problem. Temperature sensors deployed along the PMT structure are the responsibility (cost and installation) of the Water Containment WBS (1.4.2.5).
The parameters this task will monitor within the water volume include:
-
Biologic activity and temperature dependence of growth rate;
-
Radon content and distribution, to a sensitivity near 1 mBq/m3;
-
Water characterization: temperature, pH, resistivity, water level;
-
Flow pattern and rate within the WCD volume;
-
The magnetic field before and after installation of the compensating coils
With the exception of the Radon content measurements, commercially available systems with the needed precision exist.
5.6.1 Biologic Activity
We define biologics as anything biological that can grow within the environment of the detector. This includes microbes, algae, molds, viruses, and other biofilms. Some water Cherenkov experiments have had issues with biologics while others have not. In general lower water temperatures slow biologic growth[28]. If present, biologics can reduce water transparency or form a film on the PMTs, thus affecting the sensitivity of the experiment.
The water treatment system is the primary means for restricting biologic activity (see Chapter 6). New or recycled water entering the tank will be irradiated by UV, deionized, cooled, and degasified. Establishing a suitable flow pattern within the detector can avoid dead zones where water can stagnate and permit microbial growth.
Anaerobic chemoheterotrophs that need organic carbon and an energy source have been identified at Homestake Lab[29]. Such microbes could grow within the WCD despite degasification of the water. In addition, chemicals that outgas from materials introduced underwater may affect the water chemistry and provide an energy source for sulfur and iron reducing bacteria that have been found at Homestake. Information on the temperature dependence of the growth rate of these Homestake specific organisms is not known. While not funded by the project, we are seeking alternate funding to carry out a program to understand the temperature dependence of the growth rate of these biologics.
Once the detector is operational we will sample water from the detector at various locations (via the calibration ports) to measure any biologic activity within the water volume. We envision sending these samples to a biological testing facility for measurement and characterization. If biologic activity is found, we will develop treatment regimes to reduce the presence of biological agents.
5.6.2 Radon Detector
The radon (Rn) level in the detector volume has a significant impact on the minimum attainable energy threshold of LBNE. 222Rn decays via a 5.48 MeV alpha to 218Po with a half-life of 3.8 days. 218Po subsequently decays to 214Pb via a 6 MeV alpha with a half-life of 3.1 minutes. The alpha particles themselves from these decays are far below the Cherenkov threshold in water and hence do not present a significant source of background. However, 214Pb beta-decays (1 MeV, half-life 26.8 minutes) to 214Bi and most problematic is the subsequent beta decay of 214Bi to 214Po, with a 3.4 MeV beta particle released. The last decay occurs roughly 18% of the time.
Therefore, a level of radon in the detector of 1 mBq/m3 will result in the production of roughly 100 Hz of 3.4 MeV electrons in a 100-kTon detector. For low-energy physics studies, such as relic supernova and solar neutrinos, this will affect the energy threshold of the detector. The Kamiokande-III detector had radon levels of about 0.5 Bq/m3. The Super–Kamiokande experiment desired a lower energy threshold and designed a water purification system to remove radon from the water, with a buffer region of radon-reduced air above the water. Super–Kamiokande achieved radon levels of 0.5–5 mBq/m3 in water, with the higher levels measured near the detector walls[30]. Monte Carlo studies are underway to understand the fluctuations of the energy deposited and its affect on the low-energy sensitivity of LBNE. Figure 5–7 shows the radon levels in the Super–Kamiokande water volume and the resulting event rate[30].
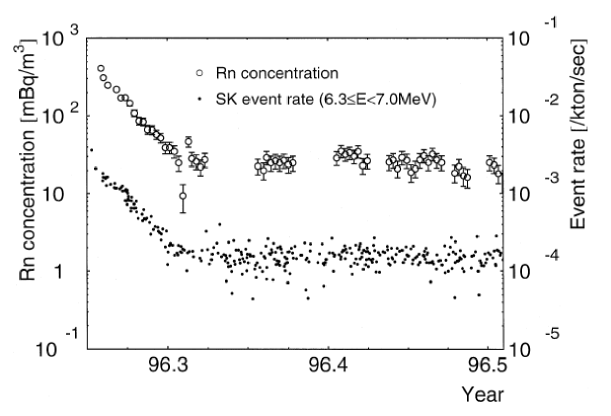
Based upon the experience of Super–Kamiokande and the design of the WCD water treatment plant, we expect the Radon level in the WCD to be quite low. There will be barriers to radon emanating from the rock (see Section 2.3) and the water will remain in the tank much longer than the half-life of Radon. We expect the Radon content of the water volume to be comparable to that of Super–Kamiokande, 0.5–5 mBq/m3.
While there are commercially available Radon detectors (for example RnScientific has a Radon-in-water probe that can attain a sensitivity as low as 48 mBq/m3 over a few hours), they do not have the required sensitivity of 1 mBq/m3). Super–Kamiokande has developed a high sensitivity radon detector that can reach a sensitivity of 0.1 mBq/m3[31]. This system extracts water samples from the detector for external measurement. We will collaborate with scientists from Super–Kamiokande to develop a similar Radon detector for LBNE.
5.6.3 Water Characterization
Instrumentation is needed within the detector to monitor water levels and provide feedback to the flow-rate controls. Water levels should not change dramatically over the experiment; abnormal drops in the water level may signal the presence of a leak.
The water temperature and its variation within the detector volume can have a long-term effect on the detector performance by affecting biological growth and the performance of PMTs (see section 6.3).
We will use an array of commercially available, sealed sensors to monitor the temperature to 0.1∘C precision. Temperature sensors permanently installed along the PMT superstructure are the responsibility of the Water Containment WBS (1.4.2.5). Additional sensors will be deployed via calibration ports within the detector volume and are the responsibility of this WBS element. These shall be easy to remove temporarily, e.g., for calibration runs with radioactive sources, and to replace if needed. Coordination with the Water Containment system is necessary to ensure uniformity of instrument response.
The resistivity and pH of the water are related to the water transparency. (Pure water has a resistivity of 18 M-cm.) Sensors at the intake and outflow ports of the water treatment system will monitor these parameters. If needed, additional sensors may be deployed via the calibration ports.
5.6.4 Flow Pattern within the Water Volume
The total flow rate is measured by the water treatment system, which will provide flow rates of 900 or 1200 gallons/minute in the reference design (see Section 6). Commercial flow meters with electronic readout are readily available for the intakes or outtakes. Assuming a uniform flow throughout the detector volume, the expected flow rate at any given location would be between 0.7 and 2.8 liters-cm-2-s-1, though convection within the volume could significantly affect the flow within the water volume. Measuring such low flow rates will be difficult. The Super–Kamiokande detector injected radon into the detector volume and used the PMT signals to observe its movement through the detector volume.
5.6.5 Magnetic Fields
Magnetic fields will be assayed prior to and after construction of the PMT support structure. The first measurement will be used to design the field compensating coils. The target magnetic field for the water Cherenkov detector has been determined to be 0.05 Gauss or less. Magnetic fields will be directly measurable in the tank with a Gauss meter through an instrumentation port.
5.6.6 Interfaces
The detector-environment monitoring system (EMS) will require an interface to the PMT structure to attach sensors such as thermocouples. EMS data will be incorporated into the Offline data structures (see WBS 1.4.7.3).
6 Water System (WBS 1.4.6)
This chapter describes the reference design for the WCD Water System. This system will maintain the purity and temperature of the water in the vessel such that Cherenkov light from interactions throughout the active volume reach the PMTs on the opposite surface with minimum absorption and scattering.
The scope of the Water System includes the design, procurement, fabrication, testing, delivery, and installation oversight of the independent systems, water-fill and water-recirculation, the shaft piping system, and the sump and drainage system.
6.1 Design Considerations
We have based our reference design for the Water System on extensive experience from the construction and operation of the IMB, Super–Kamiokande and K2K experiments. Our requirements[32] derive in large measure from the Super–Kamiokande detector, scaled up as appropriate. The operation of a large WCD depends upon the ability of the emitted light to reach all parts of the detector, and therefore the target attenuation length for Cherenkov light (350–450 nm) in the water depends on the size of the detector. Our geometry and dimensions require an attenuation length of 80–100 m.
Maintaining this high transparency requires ultra-pure water — a challenge given the unavoidable release of contaminants by all materials in contact with the water. A consequence of the techniques used to maintain ultra-pure water is that the uranium and thorium concentrations are kept below and , respectively. These levels have been demonstrated by Super–Kamiokande to limit low energy background sufficiently to enable physics topics such as the observation of solar neutrinos.
To achieve the desired water purity and radioactive background limits we can use commercially available equipment to perform a combination of deionization, reverse osmosis (R.O.), degasification, and filtration. These techniques are in active use for other applications such as the production of water for injection in the pharmaceutical industry. Deionization uses ion exchange resins to remove ions from the water and produces very high-purity water. However, when the supply water is very poor and/or untreated, it requires large quantities of these resins and other chemicals for this process. Electronic deionization will be evaluated later in the project as a possible cost reduction. This will require studies to determine if the mine ventilation is adequate. The R.O. technique rejects total dissolved solids (TDS) with an efficiency of about 95% and reduces the particulate size to under 0.001 m. R.O., however, requires a large amount of electrical power for the high pressures needed to pump the water through the membranes and rejects a small fraction of the processed water, which then goes to waste or can be used for processes with less stringent purity requirements. The final filtration stages, use size exclusion to remove any remaining particles in the water.
Previous Water Cherenkov detectors[33, 34, 35], have demonstrated that ASTM Type I water produced by commercially available equipment and filtration techniques, supplemented with oxygen (0.6 mg/L), U and Th removal, satisfies the requirements we’re adopting. Our water-purification system will require a much larger throughput, however, than that used in previous experiments.
Temperature control is another crucial element, both for preventing the growth of biological organisms and to minimize the noise rate of the PMTs. A temperature of 13∘C, that was used at Super–Kamiokande and K2K, has been shown to lead to an acceptably low level of biological activity and PMT noise.
The design will accommodate the following possible future enhancements:
-
Addition of a dissolved gadolinium salt to enable more efficient detection of neutrons from inverse beta decay reactions; in this case the system will need to recirculate the water continuously to remove the impurities that affect light transmission while maintaining the gadolinium concentration. We discuss this topic in Chapter 9.
-
Addition of another vessel and concurrent construction and operation of the two individual detectors
The functional requirements of the water system[32] derive largely from the performance of the Super–Kamiokande detector, scaled to the size of the WCD reference design.
The components of the baseline water system are shown conceptually in Fig. 6–1 along with their associated WBS number.
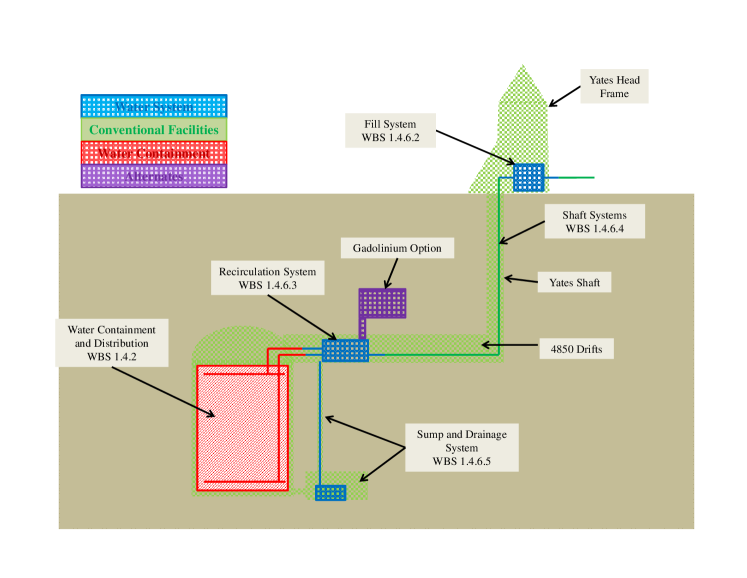
The fill system (WBS 1.4.6.2) resides on the surface. Treated, chilled water is directed down a single pipe in the shaft (WBS 1.4.6.4) to provide fill and make-up water to the detector. A recirculation system (WBS 1.4.6.3) resides at the 4850L maintaining the purity and temperature of the water in the detector. A sump and drainage system (WBS 1.4.6.5) collects both water that leaks out of the detector and any native underground water from around the detector. The water from the sump, drains, and waste water from the R.O. system is piped to the Ross mine dewatering system where it is comingled with the native water and eventually pumped to the surface for treatment, if needed.
In order to conserve expensive underground space, reduce the need to discharge water to the surface, and provide convenient access to the large amount of chemicals and resin necessary for the initial fill, the filling system will be located entirely above-ground and the water will be piped to the underground detector. The recirculation system will be located underground, adjacent to the detector.
Limitations on the amount of water available for filling, flushing, and other uses on-site constrain the fill rate to 250 gallons per minute (gpm). Scaling up the current recirculation rate of the Super–Kamiokande detector by the ratio of its mass to the mass of our reference design yields a desired recirculation rate of around 1200 gpm. At these rates it will take about 180 days to fill the detector and 36–40 days to recirculate one vessel volume.
6.2 Primary Filling System (WBS 1.4.6.2)
The primary filling system resides above ground. It treats and purifies the industrial water from the municipality for the WCD. The system is shown Figure 6–2 and Figure 6–3. Its components will be described in the following sections.
The Lead industrial water supply will provide about 300 gpm of water to the above-ground purification system (see Fig. 6–2). This allows for delivery of 250 gpm to the underground detector. This rate will fill the detector in approximately 6 months. Approximately 50 gpm of water is rejected as waste during the treatment process.

Depth filters, carbon filters, a water softener, and pre-filters will remove silt, micro-organisms and particulates to the 5-m level in preparation for the reverse osmosis (R.O.) membranes. The output of the R.O. unit will go to a UV-oxidizer unit (called a TOC — for total organic carbon unit) — followed by a sodium-exchange anion resin to remove uranium and thorium, followed then by a mixed-bed deionizer (see Fig. 6–3). This is followed by more filtration, UV sterilization, a de-gasifier to remove dissolved gases such as oxygen, carbon dioxide and radon, and a chiller, if necessary, before the water is piped down to the detector.
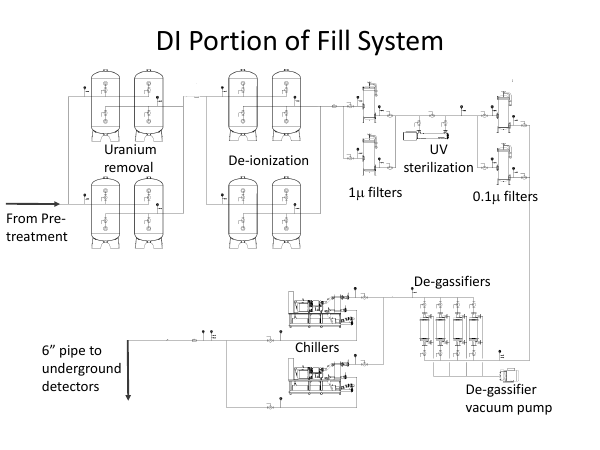
The filling system will also be used for additional water to make up for underground R.O. waste water and any losses due to leaks or evaporation in the detector. Scaling the expected leakage rate from the Super–Kamiokande detector, we expect to lose 14–56 m3 per day or 3,700–15,000 gallons per day. These leak rates are discussed in detail in Section 2.3.9. At these rates, the water level would drop 4–17 mm per day. Since the fill-system capacity is 250 gpm, this would only require the operation of the fill system in make-up mode less than 1 hour per day. If operation of the R.O. unit during recirculation is required, it would require more frequent make-up. Sensors in the detector will monitor the water level. Make-up could be automatic or under operator control (see Sections 2.6).
6.2.1 Requirements
The water fill system will require a building with a 28 m 28 m footprint that is 8 m high. It will also need an external area for a brine tank (3 m diameter 3 m high ) and access for truck delivery of salt to the brine tank.
Since a portion of the fill-system pre-treatment must be flushed each day for a total of about six hours, an additional 300 gpm is needed during periods of simultaneous filling and flushing. Thus, the surface fill system requires a water supply of 600 gpm to enable concurrent detector filling at 250 gpm, waste-water removal from the R.O. unit at 50 gpm and periodic backwashing of the pre-treatment portion of the system at 300 gpm.
A fill requires about 400,000 lbs of water-softener salt, 800 ft3 of U/Th-exchange resin, 5000 ft3 of deionizer-exchange resin and a number of filters, UV lamps, etc. We estimate 600 man-hours of shift operation for this procedure.
6.2.2 Environmental Issues
We have investigated the potential environmental issues associated with the water systems. Although there are still discussions relating to the details, we understand that there are no restrictions on R.O. waste. The depth filter produces higher suspended solids but they are still within allowed limits. The softener produces waste sodium but there are no restrictions in South Dakota at this time. The large amount of resin that will be used can be sold back to the resin supplier where it is regenerated.
6.3 Water Transport (WBS 1.4.6.4)
Clean water from the fill system will be transported underground through a 4 inch pipe in the Yates shaft. The pressure head in going 4850 feet underground is about 2,200 psi. We will need to reduce this pressure to a convenient level (about 50 psi) before piping it to the detector.
This could be done with a single pressure reduction station at the bottom, or with several intermediate pressure reduction stations in the vertical shaft. Our current baseline is to have five pressure reduction stations at 900 feet increments down the shaft. This will be optimized during the preliminary and final design stages. A further requirement is that the intermediate stations must maintain the water quality and have adequate controls to operate safely.
We plan to use this same pipe when we have to empty the tank for maintenance if the Gadolinium option is chosen. In this case, we will add pumps and buffer tanks at each of the pressure reduction levels. Provisions and space are planned for these in the baseline design. In all scenarios, the installation of the pipe and associated infrastructure is planned during the shaft refurbishment and upgrade.
6.4 Recirculation System (WBS 1.4.6.3)
It is crucial to continuously recirculate the water in the detector through a purification system due to the constant leaching-out of substances that reduce the light-attenuation length. In addition, a sterilization procedure is necessary to inhibit the growth of micro-organisms during recirculation. The water removed from the detector for re-purification will be of high purity — much higher than that of the original supply — therefore the recirculation process will be less demanding than the initial fill. This will remove the need for a pretreatment stage, as is in the surface fill system.
At 1200 gpm, the 265 kTon of water in the vessel will be completely recirculated in 36 to 40 days (see Fig. 6–4).
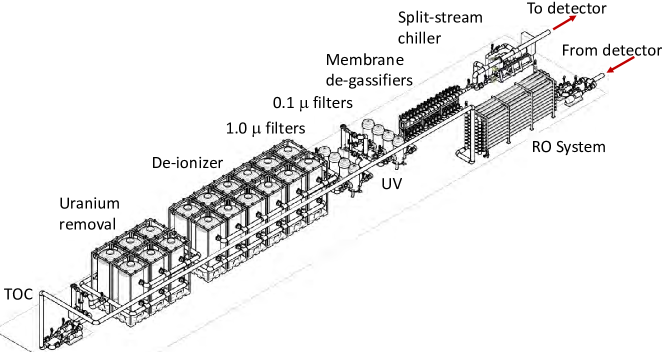
The recirculation system will be located in the utility drift adjacent to the detector at the 4850L. Similar to the surface fill system, the recirculation system will consist of a UV-oxidizer unit which charges organics so that they can be removed by the D.I. resins, resins for uranium and thorium removal, deionizers, sub-micron filters, UV sterilization units, membrane de-gasifiers and chillers. If necessary, to further remove particulates to the R.O. level, this throughput will periodically go through a multi-stage R.O. system. The R.O. system is designed to minimize underground waste water by recycling.
Chilling the water inhibits the growth of micro-organisms within it. Minimizing bacterial growth is very important for maintaining adequate water purity in the detector. We will use sterilization as a first step, but during recirculation, the detector water will pass through a chiller unit designed to maintain the water temperature at C. It has been demonstrated from the operation of the Super–Kamiokande and K2K detectors that this temperature sufficiently inhibits bacterial growth. Experience with the earlier IMB detector has shown that even if the detector water is turned over every month, organism growth will occur if the temperature is too high. IMB was not cooled and reached an equilibrium temperature of C.
As an additional benefit, chilling the water will reduce PMT noise. It has been shown in other experiments that the dark rate, or noise, from a PMT is strongly proportional to the temperature. This has not yet been characterized for the LBNE PMTs, but will be done in the preliminary and final design stages of design. Thermal modeling and water-flow patterns are discussed in Section 2.6.
The underground chiller for maintaining the water temperature will be located along with the other recirculation equipment. This will either be air or water cooled. If water cooled, we will use mine water to reject the heat. If an air cooled chiller is employed, we will reject the heat downstream of the experiment in the mine air recirculation flow pattern.
We intend to begin the recirculation of the detector water as soon as filling begins. This will maintain the required water quality and detector temperature during the fill. The fill and recirculation pumps are located at the bottom of the detector vessel to enable this and are discussed in Section 2.6. These pumps are only used during the fill portion of operation and are separate from the pumps at 4850L.
The underground 1200 gpm recirculation system requires an excavation about 65 m long by 10 m wide. We have minimized the chamber height requirement to about 4.8 m by our plan to pump resin into the deionization and U/Th removal vessels rather than using overhead loading. An additional 250 m2 of space is needed if gadolinium is added to the water.
During each year of operation, the recirculation system will require 2,400 cubic feet of both U/Th and mixed bed deionization resin. In addition we will use about 400 forty-inch filters and 80 UV lamps.
6.5 Water Sump and Drainage System (WBS 1.4.6.5)
It is likely that despite all our engineering efforts the detector will leak small amounts of water. Based on studies to estimate this rate, detailed in Section 2.3, a detector that holds 265 kTon of water is expected to leak approximately 14–56 m3 per day. Of course, this is only an estimate, so we must be conservative in the capacity of the system we design to handle potential leaks. In addition to detector leakage, mine water from sources in the surrounding rock and periodic usage of the underground reverse osmosis unit might contribute to this waste-water load.
The sump system must collect all waste water and pump it to the Ross mine dewatering system. The purity of this water is either much better or equivalent to the normal ground water that the cavern disposal system is designed to handle. To ensure against intermittent pump or electrical failure, and to be very conservative in this purely estimated leakage rate, we plan for a sump pit with temporary storage capacity of 1000 m3 or approximately twenty days worth of projected maximum leakage.
In the case of catastrophic failure of the clean liner system, the exterior rock-wall cavity itself will serve as a container and will fill with water and slowly leak for mine disposal.
Our design calls for two sump pumps in the sump pit. One pump will operate automatically when the water level in the pit exceeds some level while the other pump is in standby mode. The pumping capacity of each pump is designed to be approximately 25 times the projected maximum leakage rate.
During the projected several-decades-long operation of the detector it may be necessary to drain the vessel for servicing or repair. The drainage system will consist of the pumps normally used for recirculation plus additional valves and piping to provide a mechanism for draining the tank and transporting the water to the Ross mine dewatering system.
To preserve the Gadolinium option, the sump system must be capable of handling water containing 0.1% Gd. In this case, we would need to treat the leakage water underground before rejecting the Gd-free water to the Ross mine dewatering system (see Chapter 9).
In the case of the Gadolinium option, the recirculation pumps will pump the water to the underground water recirculation system where the gadolinium stream would be concentrated by about a factor of three. The 1200-gpm recirculation stream would thus be split into an 800-gpm clean water stream to be sent to the Ross mine dewatering system and a 400-gpm gadolinium stream to be sent to the surface for treatment. In this case, we would use the same pipe in the shaft that was used for delivering the water from the surface fill system.
6.6 Water Waste Treatment System (WBS 1.4.6.6)
The reference design is not expected to produce water that needs significant treatment before being released into the environment. Instead, waste, drain, and leakage water will be transported to the Ross mine dewatering system. This WBS element contains funding for the pipes and valves that accomplish this.
6.7 Material Compatibility Testing (WBS 1.4.6.7)
Before building the WCD and potentially other LBNE subsystems, we will need to test many different types of materials for their stability in water over time. During the detector’s expected 10–30-year lifetime, the components must remain intact and the water attenuation length must remain at 80 m to meet LBNE’s physics requirements. We must therefore establish a material testing program to ensure that all materials used in the WCD last for this duration without degrading significantly. Given that most materials will deteriorate under certain environmental conditions and their lifetimes can vary depending on their exposure, we need to carefully evaluate all materials that will come in contact with the high-purity water.
We intend for the results of the material-compatibility program to provide general guidelines to the WCD and the whole of LBNE, as needed, for choosing stable materials. This program is on the critical path, particularly in the phase prior to the start of construction.
This program requires on-line water purification and monitoring, careful testing of all materials that will be in long-term contact with the high-purity water, and selection of hardware constructed of materials that are found to be acceptable.
6.7.1 Evaluation Criteria
We will evaluate in-water hardware based on the following criteria:
-
How the water affects the materials with which it will be in contact Will the water cause deterioration of any material? If so, can the purification system adequately rid the water of the contaminants, and can it do so long-term?
-
How the materials in contact with the water affect the water purity Assuming some unavoidable material-leaching into the water (independent of material deterioration), how will this affect the optical transparency of the liquid by inorganics, e.g., Fe, Co and Ni (leading to absorption in UV-visual regions), and organics, e.g., UV blocks or additive, fire retardant, etc. (which often absorb in the UV, tailing into the visible region)? Will there be fine particles that can scatter the light? What is the chance of introducing radioactive isotopes into the liquid?
6.7.2 Accelerated Material Aging to Reduce Test Time
Running material compatibility tests at the detector’s proposed 13∘C water temperature would require a time span similar to the anticipated detector lifetime (10 years) to achieve trustworthy results. We must therefore accelerate the material-aging process to obtain results in a timely manner. Testing at temperatures higher than the detector’s ambient temperature will shorten the testing time and allow us to select appropriate materials within a few-year timespan. This is critical for the success of material selection.
The aging technique we propose is designed to predict in a relatively short period of time (see Equation 6.3), what will happen to a material or a liquid over a much longer period of years in storage. The chemical reaction rate of the material can be described by the Arrhenius rate function:
| (6.1) |
where is the chemical reaction rate, is the material deterioration constant, ( is the activation energy (eV), is Boltzmann’s constant (0.8617 eV/K), and is the absolute temperature (K).
Based on the assumption that any tested materials follow the first-order Arrhenius behavior, a simplified expression of the chemical reaction rate can be derived as:
| (6.2) |
where is 2, indicating a doubling of the reaction rate for every 10∘C increase in the temperature over the storage temperature. For any pair of temperatures T selected ( for the accelerated-aging and for long-term storage), the relationship of aging time (taging) to real lifetime (textrapolated) is then defined as follows:
| (6.3) |
The equation can be further modified where (%) is the deterioration rate of the material
| (6.4) |
or
| (6.5) |
Once the surface to volume (S/V) ratios of aging testing and the temperature are corrected with respect to the experimental conditions, the impact of the leaching for LBNE water can be estimated. A leaching model incorporated with the purification scheme (800–1200 gpm) is being developed.
In order to minimize the testing time, we want to maximize the test temperature without causing heat-distortion in the material or reaching its melting point. Assuming Q10 = 2 and an LBNE lifetime of 10-year, we propose the following temperatures/test times:
-
Polymers at Taging = 0∘C will need 1 yr (23=8)
-
Steels, ceramics or other solids at Taging = 70∘C will need 6 months (245)
6.7.3 Compatibility Testing Criteria by Category
The experimental procedures and accelerated-aging time are different for the various sub-categories of the detector.
-
1.
Calibration materials:
-
(a)
Most of the materials used for calibration will be in contact with the water for short time periods depending on its use only, thus their interactions with liquid are minimum. Some may only contact the vapor. Thus a short time direct test in the liquid without deterioration is considered sufficient.
-
(b)
Some materials, such as calibration sources, will be immersed in the water periodically; these materials require a direct test in the liquid for a slightly longer time than the scheduled calibration period at aging temperature.
-
(c)
Other calibration sources may be used for as-yet-unknown time periods during the data-taking. We will evaluate the contact time for the materials used in these sources, and thus their testing time, on a case-by-case basis.
-
(a)
-
2.
Detector or system materials:
-
(a)
Materials used in detector components or used for storage will be monitored continuously until reaching the maximum data-taking time.
-
(b)
Monitoring time for materials to be used for liquid filling or transport will be evaluated on a case-by-case basis.
-
(a)
-
3.
Materials that will be used in PMT bases, cables, mounting hardware, or surface coatings will be monitored continuously until reaching the maximum data-taking time.
-
4.
Materials used in components or parts of calibration units or for piping will be evaluated on a case-by-case basis
6.7.4 Testing Program
The proposed material compatibility program aims to:
-
1.
Measure activation coefficient, : the assumption of the value 2, which is a general constant derived from the chemical kinetics, is only valid for some materials. could be different for different material compositions. To extrapolate the aging results, a more precise measurement of activation coefficient is necessary.
-
2.
Develop new procedures for cleaning materials prior to installation; proper cleaning appears to not only greatly improve a material’s lifetime in water, but also to reduce the purification load.
-
3.
Identify the leaching sources from the material compatibility test can provide a pre-screen step for reducing testing materials time.
-
4.
Maximize Taging for the different materials to check their stability at various temperatures and to save material testing time.
-
5.
Set up the pre-cleaning procedure, such as pickling effect, for some of the materials; this could be very useful in bringing down the accelerated-aging time.
-
6.
Eventually all the leaching data will be incorporated with the purification scheme (600 gpm vs 1200 gpm) for the final assessment.
A testing program that can accommodate several materials simultaneously is essential; testing each sample serially would take too long.
We propose the following procedure for material compatibility testing:
-
1.
Clean material using an ultrasonic bath.
-
2.
Soak material in water (from a few hundredths of a ml to a liter of 18 M-cm water) at the desired aging temperatures.
-
3.
Perform optical scans weekly for the first month using 10-cm UV-visible spectroscopy (UV) cells.
-
4.
Use UV and then X-ray fluorescence spectroscopy (XRF), inductively coupled plasma mass spectroscopy (ICP-MS), gas chromatography-mass spectrometry (GC-MS) and finally fluorescence to detect and identify any leaching from material.
-
5.
Conduct further analysis of the liquid bi-weekly or monthly depending on the amount, rate and severity of the leaching material.
-
6.
Analyze physical changes of the material using a digital microscope and ASTM stress tests.
-
7.
Use a long-optical-pathlength system to measure the final attenuation length of the water under the impact of the materials.
-
8.
Eventually establish a QA/QC program for material procurements.
6.7.5 LBNE Facilities for Materials Compatibility Testing
-
BNL BNL Chemistry neutrino group has both experienced staff and excellent facilities for this testing. This group has been playing a crucial role in the material-compatibility program for SNO/SNO+, Daya Bay and LENS. The group is now compiling material-compatibility data from past experience, as well as water-attenuation-length data from the literature and from two-meter measurements at BNL. A material-compatibility database with the list of acceptable materials is under construction and will be available for the LBNE experiment. The BNL group is well-equipped with many instruments, such as XRF, UV-vis, IR microscope, GC-MS, karl-fisher, autotitrator and aging chambers and has access to AA and ICP-MS that are essential for the material testing. Plus, a 2-m optical-pathlength vertical system with a sensitivity of 1% can measure water-attenuation lengths at 60 m. BNL has the capability of measuring many samples simultaneously at variable temperatures for activation-coefficient measurement.
Although implementation of the gadolinium option is not in the baseline, some material tests have already been started with gadolinium sulfate. Currently selected materials (stainless steel, polypropylene and polyvinyl chloride) have been soaked in a 0.1% gadolinium sulfate solution in water at elevated temperature. Future work will include the study of the concentration proportionality to the surface volume ratio, deterioration of the sample and material effects on the liquid. BNL has extensive experience in gadolinium-aging testing from past neutrino experiments.
-
LLNL Currently the Livermore group can measure one sample at a time at a single temperature; LBNE may require an upgrade of the system. This group has a horizontal, 8 m-attenuation arm with 15-liter polypropylene drums, which could be used to soak material samples in sufficient water for long-pathlength measurements. Consequently, the water from the 15-liter drum could be used to measure the degradation and leaching of the material (not absolute attenuation length) over a period of time.
-
UC-Irvine UC Irvine has a vertical 6.5 m-attenuation unit that can measure the absolute attenuation length of water at high precision. Once all material leaching has been identified and removed from the water, we will use it for a final assessment.
BNL, the designated institute for the material compatibility program, will conduct the in-lab scale testing and LLNL or UC-Irvine will work (at least for first 2 years) on the long-pathlength measurement. A cross check to verify the aging results from in-lab measurements with long attenuation measurements is necessary.
Collaborators working on different systems will select materials from the database of acceptable materials and request samples from vendors for testing. A good book-keeping of sample test results from each vendor is essential since material properties can vary by vendor source, production scheme, and even by production batch. The Gd-option has not been included in this program. It will require extra testing for pure-water-qualified materials if it is pursued.
6.8 Water System Installation (WBS 1.4.6.8)
We expect the system supplier to deliver the components of the underground water system to the shaft head and to modularize them for transport down the laboratory shaft. The installation crew will mount all vessels under or in the cage for lowering and, once in the mine, will transfer to the installation site in the utility drift (see Section 8.2). We will attempt to purchase the pumps and valves “mine certified” so that they will not have to be tested above ground. The equipment will be transported down the shaft and to the installation site by the installation crew. The surface filling system will be delivered to the surface site.
The water system contractor is responsible for installing the equipment at both the underground and surface sites. Installation includes piping between components, connection to piping to and from the detector, electrical connections, monitoring sensors and PLC control of all the equipment. The piping will be made of stainless steel and PVDF. The contractor is also responsible for performing start-up checks and demonstrating correct operation of all systems. The specified mechanical, electrical, and plumbing infrastructure going to the equipment will be provided by the experiment and conventional facilities
7 Computing (WBS 1.4.7)
This chapter describes a reference design for the Computing systems and the responsibilities of the overall computing effort. The computing effort provides and manages the systems and software required for the collaboration to perform detector simulations, to collect data from the DAQ, process it, transfer it, archive it and support data analysis. In the WBS, this effort is broken into three three distinct areas of responsibility: Online, Offline and Infrastructure. Required interfaces will be implemented by joint task forces, some internal to this WBS element, others comprising members of this and interfacing WBS elements.
7.1 Organization of Computing Effort
-
Online is responsible for receiving, from the DAQ system (covered in Chapter 4), the raw data that passes low-level software triggers. With that data, it will perform prompt data processing, apply higher-level software triggers and then provide the results for off-site archival storage. It is also responsible for run control, detector monitoring and notification systems (i.e.,“slow control”).
-
Offline is responsible for simulating the detector, electronics and trigger, developing reconstruction software and managing official production-data processing.
-
Infrastructure is responsible for supporting Online and Offline efforts by providing a software framework, data-archiving and production-processing hardware, assuring adequate network connectivity and providing applications needed for collaborative development.
There are several required inter- and intra-group interfaces, where a “group” refers to people working under a given WBS element. Each interface will be implemented by a joint task force.
Within the Computing effort (i.e., “intra-group”) a number of responsibilities must be bridged. In all case a single individual will be identified to assume the responsibility that the interface is satisfied.
-
Online and Infrastructure must assure that raw data and any needed slow-control information will be safely archived in the BNL computing center and made available to Offline in a useful manner.
-
Infrastructure must supply and support the software framework for use by Online and Offline.
-
Infrastructure must provide adequate network connectivity, which is largely driven by the data rates that Online expects to see.
-
Offline must work with Infrastructure to set up the mechanisms for production running.
Several efforts involve Computing and other WBS Level 3 systems.
-
DAQ and Electronics systems supply raw data to the Online group.
-
The Calibration System supplies constants for use by Online and Offline; they are stored in databases managed by Infrastructure.
-
Infrastructure must accept and consider input from the entire collaboration regarding choice of collaborative applications.
-
The Offline Production and Infrastructure groups must ensure that data, simulation and reconstruction results are available to the collaboration.
7.2 Online Computing (WBS 1.4.7.2)
The responsibility for online processing and handling of the raw data begins at the point just after DAQ has read out the data from the electronics and transmitted it to the online systems. It ends with the hand-off of data to the Infrastructure group for off-site archival.
The functions of the online system can be summarized in these six points:
-
Collection and buffering of raw physics data in real-time from the DAQ at an anticipated data rate of up to 50 MByte/sec
-
Processing and filtering of raw data in near-real-time down to a subset of interesting events (at lower data rate and volume)
-
Storing and transmitting data to the central production processing system at BNL.
-
Providing the software system for near-real-time monitoring of detector systems and data quality
-
Providing a generalized run-control system for setting up and controlling the various detector systems in a coordinated manner
-
Providing an event-display system to show detector events in real time in the detector control room.
Figure 7–1 is a schematic of the online system showing the logical design of data flow from the DAQ through the online computing system and ending with data output to the offline system.
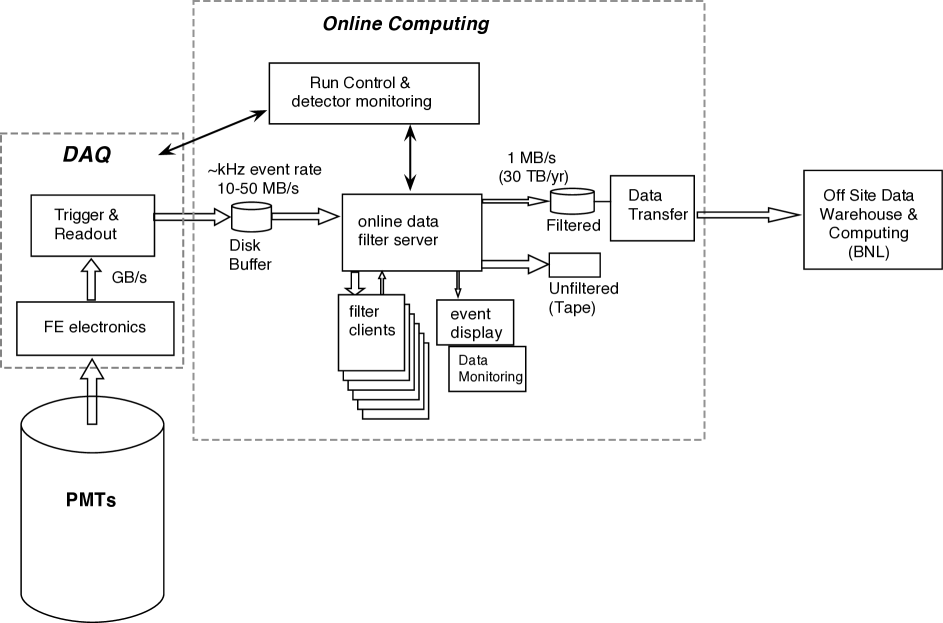
For purposes of describing the Online system, we break it into four logical areas. The above functions are performed by portions and/or combinations of these areas.
-
1.
Raw data handling
-
2.
Prompt processing
-
3.
Data quality monitoring
-
4.
Run control
7.2.1 Description of Online System Reference Design
The DAQ will send events to the online system when a basic low-level trigger condition has been satisfied within the DAQ system itself (i.e. “low-level software trigger”) as discussed in Section 4.6. The online system first buffers the data to disk, then subjects it to “prompt processing” by the online data-filter server, which formats the data for the offline system and distributes the events to a farm of filtering clients. The filtering clients apply fast reconstructions using the analysis framework software and select a subset of filtered events to be transferred via the Internet to the offsite data warehouse (see section 7.4.3). This filtering of data by online is called “high-level software trigger.” It is a second stage of triggering, after that done by the DAQ, that is characterized by its ability to use offline-like reconstructions of vertex position, timing, and energy that cannot be implemented in the DAQ “low-level software trigger.” It is used to lower the effective energy threshold, retain useful events while limiting the data rate. Optionally, the unfiltered data can also be recorded to local media for archival storage during the commissioning phase when “high-level triggering software” is being validated in the online system. The real-time event display and the online data-quality monitoring systems observe and monitor the event stream in real time, allowing for rapid detection and response to problems in detector operations.
A unified, detector-wide run-control system controls and monitors the overall operation of the data taking.
Figure 7–2 shows the online system computing components at the surface facility and underground at the detector.

More detailed descriptions of the conceptual design for these systems follow in the sections below.
7.2.2 Data-Rate Expectations
We have performed some simple calculations of noise and data rates for the detector to help clarify the nature of the design issues we face and the conceptual design options we plan to consider for the different computing subsystems. The study of PMT noise rates (a combination of PMT dark noise and radioactive decays in the PMT glass, rock wall and water), expected DAQ trigger rates and data volumes will help illuminate potential tradeoffs between the low-level trigger in the DAQ, and the high-level trigger in the Online systems. The rate studies here assume the PMT noise is random and uncorrelated. The driving factors to consider are the physics requirements for the low-energy physics topics such as supernova detection (both burst and relic), and low-energy signatures in some proton-decay channels.
Figure 7–3 shows the ‘hit rate’ as a function of the PMT noise rate for 29,000 PMTs in the detector.
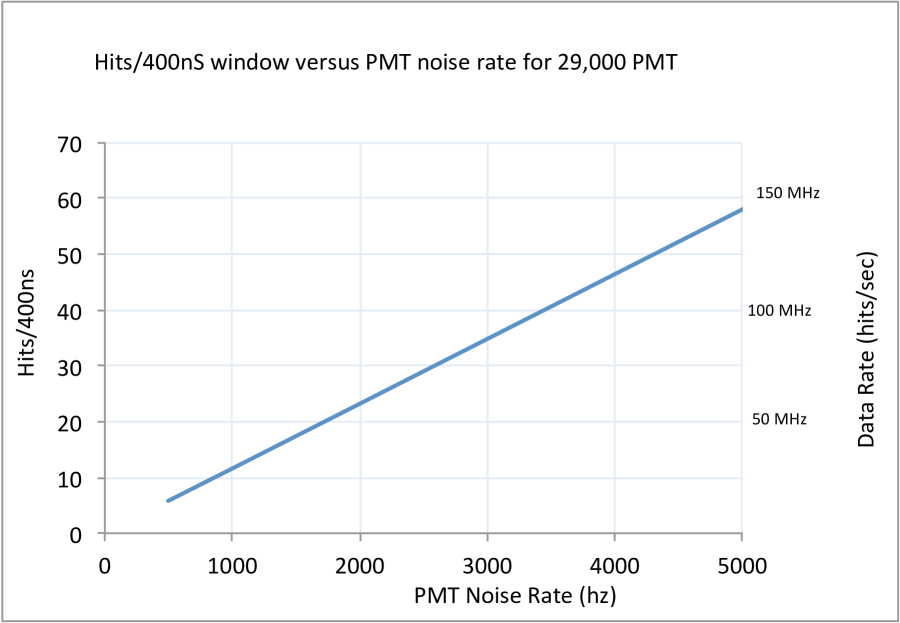
The y-axis (left scale) shows the number of hits in a 400-ns trigger window, which is chosen conservatively and could be reduced to a smaller value or made variable depending on the trigger type (e.g., low-energy versus high-energy). In any case, the 400-ns window sets a basic scale. Also, note the total hit rate per second (right scale). The figure shows, for example, that for a detector with 29,000 PMTs and single PMT noise rate of 2 kHz that the average number of noise hits in the 400-ns trigger window is 23, and would yield a total hit rate of 60 Mhits/sec leading to an unacceptable data rate on the order of a 48–60 MByte/sec assuming no waveform (i.e., 8–10 Bytes per hit) and low overhead in the event data structure.
In order to reduce this data rate, a low-level trigger system in the DAQ will be used to read out events that meet particular criteria. At a minimum, a simple multiplicity trigger (i.e., requiring a fixed number of hits above the mean noise rate) will be available, while more sophisticated triggers with geometric and spatial clustering software algorithms are anticipated. To set the basic scale for the expected rates to the online system we use Fig. 7–4, which assumes 29,000 PMTs and uses the noise rates shown above to make a simple first-order calculation of trigger rate versus multiplicity above the mean noise rate.
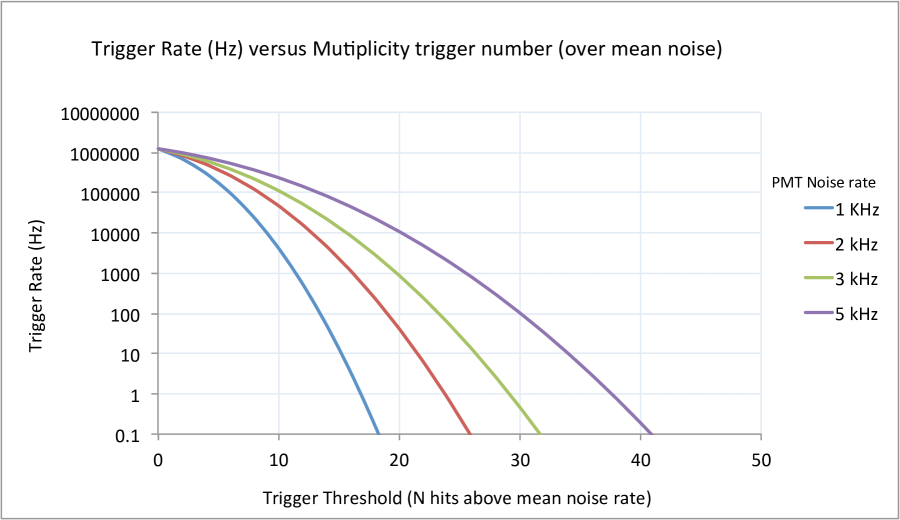
This indicates that multiplicity triggers (above the mean background noise rate of 23 hits per 400 ns window) in the range of 14–16 hit PMTs would give trigger rates on the order of a few kHz for 2 kHz PMT noise rates. The study indicates that DAQ-event trigger rates on the order of kHz are attainable with a conservative, low-level, simple multiplicity trigger. Data rates from the DAQ-event trigger and into online computing system of 10s of MByte/sec should be easily achievable with such a trigger, with a corresponding soft energy threshold on the order of 7 MeV (scaling from Super–Kamiokande).
7.2.3 Raw-Data Handling
The raw-data handling system functions include:
-
Collecting event data from the Online system in response to a high-level software trigger
-
Performing necessary data formatting and subsequently providing data to a long-term data archival system
-
Providing data-rate and system-monitoring information to the run-control and data-quality-monitoring systems.
This system will be logically located at the output of the prompt processing system (essentially the right-hand side of the online computing box in Fig. 7–1) Some logical functions, e.g., data-rate monitoring and event formatting, will occur within the prompt processing system. Beyond that, the raw-data handling system will handle the transfer of data to the data warehouse.
7.2.4 Prompt Processing
The prompt processing system will collect high-rate raw event data from the DAQ system in response to a low-level software trigger in the DAQ. After it formats the data into the analysis framework data structure, it immediately applies preliminary calibrations, online reconstruction and background rejection algorithms to provide a reduced-rate, physics-rich data set that we can archive on spinning disk for rapid analysis. This high-level software trigger will make use of offline-like reconstructions to make cuts based on such things as fast vertex finding, fast energy reconstruction, etc. This event selection will be determined by the analysis needs of physics working groups in the science collaboration. Prompt processing will also provide data-rate and system-monitoring information to the run-control and data-quality monitoring systems. One application of the prompt processing system will provide a supernova alarm which is expected to participate in the Supernova Early Warning System[36].
Figure 7–5 shows the overall prompt-processing system.
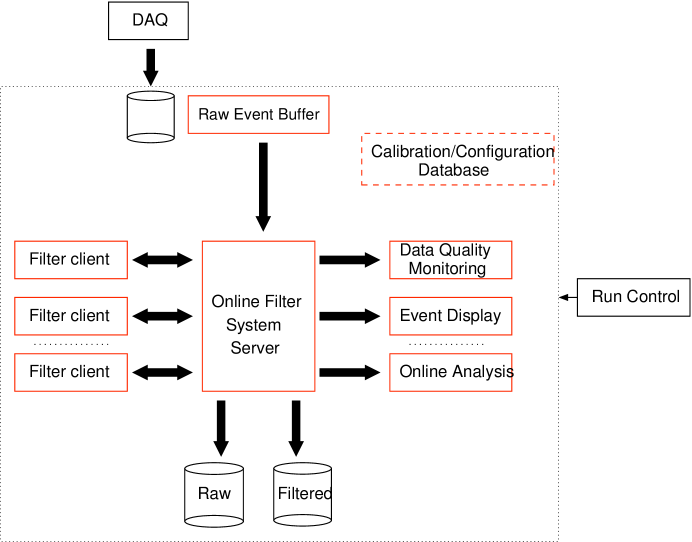
The system will consist of several subcomponents:
-
A single process that reads low-level software DAQ-triggered events, forwards data to the online-filter system server and manages the raw-event buffer.
-
The filter-system server distributes events to one of many filter clients for parallel processing. Each event returns a filter decision, and, if present, any reconstruction results or special, per-event information that should be saved with the event.
-
The filter server adds this information to the event, and produces output files. The filtered data sample will consist of events selected by the high-level software trigger (i.e. online filter selection), which would include a sample of minimum bias events.
We will determine the number of filter clients needed according to the complexity of the reconstructions performed on each event and the overall low-level software-trigger rate from the DAQ. We expect support for several hundred filtering cores/processes in the surface computing center (see Fig. 7–2). The filter clients will be developed with the standard software framework (see section 7.4.1), allowing for direct plug-in of modules developed in simulation and offline computing environments.
In addition to file output, the online filter server will make the filtered (and portions of the raw) event output available to a suite of online analysis clients, including a data-quality monitoring system, online event displays, and near-real-time analysis systems. These systems will be designed to generate or respond to alerts of potentially interesting events, such as a supernova, sending information to the collaboration or the wider physics community.
The centralized Run Control system will control the entire prompt-processing system, including all clients, and display the real-time monitoring of data flow and filter passing rates, trigger-rate information and event-quality information.
The bulk of detailed processing will be done at computing centers (see sections below). This is in order to leverage existing resources rather than building a new, large computing facility at the far site.
7.2.5 Data-Quality Monitoring and Event Display
The data-quality monitoring system is responsible for providing the framework and infrastructure to collect, analyze and display various low-level and high-level system data to provide near-real-time monitoring of the detector performance and data quality. Related work under this topic includes an online, near-real-time event display system for the detector data.
Our conception of system data-quality monitoring encompasses two “levels” of monitoring:
-
1.
Basic subsystem- and detector-status monitoring, and
-
2.
Both low-level and high-level data-stream and data-quality monitoring.
Status monitoring is handled by the overall run-control system (see Section 7.2.6), while data stream/quality monitoring is done as part of the data-quality monitoring system The system will include a small amount of computer hardware along with a monitoring-system software infrastructure and framework. The design calls for a tightly coupled connection to the online filter server in order to economize on the processing; monitoring-software modules will run in the filter clients. The outputs will likely be distributions of low-level and high-level data quantities in a ROOT or HDF5 format for rapid display of data-quality histograms. We will make an online event display available in the control room (above- and/or below-ground), and remotely, for visual high-level monitoring of the detector status.
7.2.6 Run Control
The WCD run-control system will provide several functions:
-
Control and run-configuration information to the DAQ, the data-filtering system and other online systems
-
A unified interface to information about the current and past states of the detector through monitoring and logging
-
Control of detector-calibration system.
-
Multiple means of alerting shift operators and detector experts when exceptional conditions arise.
Figure 7–6 illustrates the design of the run-control system which includes the following features:
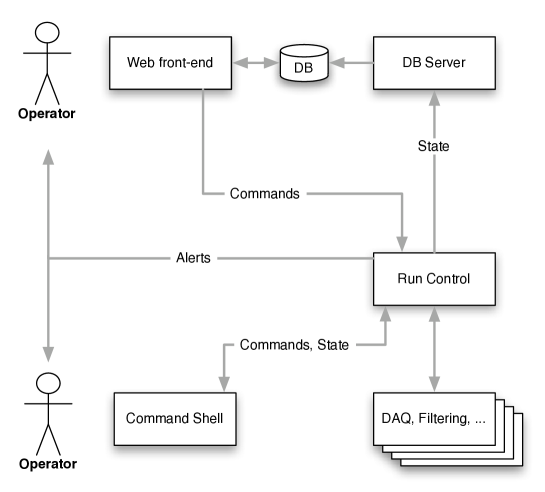
-
A run-control server, which runs inside the online-computing network in the detector cavity,
-
A command-shell utility, which can run on one or more machines inside the same network and be used to control and monitor detector systems, and
-
A Web-based, graphical user interface (GUI) running within the detector network and consisting of a database, a Web server, and a database-insertion process (dbserver).
This design is modeled somewhat on the IceCube Neutrino Observatory experiment-control system, known as IceCube Live[37]. The overall design presented here is simpler, since the geographical and networking constraints for LBNE are considerably more straightforward than for the extremely remote South Pole site.
The following sections describe the run-control components in further detail.
7.2.6.1 Control Server
The control server is the central control interface for the DAQ and various online subsystems. It runs continuously as a Unix dæmon, providing functionality for the following activities:
-
DAQ control, including run stop/start, specification of primary and failover run configurations as well as other operator-specified parameters, and automatic error recovery and restart after specified run durations. This also includes the ability to start and stop other processes synchronized with the DAQ, if appropriate.
-
Control of “standalone” components (running asynchronously to DAQ, such as the online data filtering system), including start, stop, and recover transitions.
-
Centralized collection of log messages and monitor data (either simple scalar quantities or information in a more complex, structured format). Transmission of same to the Web GUI on the surface.
-
Handling of alerts generated both within the DAQ and its subsystems and within the run-control system itself, based on the monitoring data received. Transmission of the alerts to responsible parties via email and available paging systems.
7.2.6.2 Command-Line Utility
A command-line utility provides an interface to the control server for any number of operators logged into the server, or for scripts run by those operators. This utility interacts with the control server via remote procedure calls, and displays returned results to the terminal, as appropriate, then exits. Examples of actions that operators can perform include:
-
Show a brief or detailed status summary of the current run,
-
Show a brief or detailed status summary of the components,
-
Start or stop a component,
-
Start or stop single or continuous series of DAQ runs,
-
Define a new alert on a monitored quantity,
-
Hold all further commands when needed (block, for example, when stopping a run), allowing scripted commands sets to run,
-
Operate a calibration source, and
-
Continuously display monitoring and logging information acquired by the control server (for troubleshooting and debugging).
7.2.6.3 Web GUI for Control and Display
The Web GUI provides a human-friendly, visually rich, interactive display of the current detector status and its history, as well as basic control functions for operators. It consists of three parts working together that we list then describe individually:
-
A relational database management system (RDBMS) product,
-
A process that handles incoming database insertions (dbserver), and
-
A Web server running application code.
Database
The database stores information received (via the control servers’ component-monitoring API) from the detector components, as well as users’ preferences, their browsing state, and their annotations and comments. The database typically is not accessed directly (e.g., using SQL commands), but using the Object Relational Model (ORM) of the Web application. The database can live either on the same machine as the Web server, or on any other machine on the same network.
Database Insertion Process
The Database Insertion Process (dbserver) receives status data from the detector and performs the inserts to the database. Though it would in principle be possible for the control server running in the cavern to execute SQL inserts directly, the dbserver abstracts away the underlying database details and provides a more flexible front end to the database. This affords, for example, the ability to switch to other RDBMS implementations without any change to the control server itself. It also allows us to take other, non-database actions on the surface in response to conditions in the detector. Finally, it provides a logical hook for the handling of data produced by sensors or other processes not otherwise integrated with the control server.
Web Application
The Web Application consists of software running in a Web server (such as Apache) that reacts to HTTP requests from users. It produces dynamic content (typically HTML) in response, typically involving database lookups. Different information, including in appropriate cases, control options, can be presented to users based on their established roles and privileges. Expected GUI pages include a high-level status and control page, historical information for each data collection run, detailed DAQ and other subsystem status pages for experts, and real-time event display. Customizable GUI pages are easily created based on the needs of the detector operators or collaboration.
7.2.6.4 Security
Security and authentication are important aspects of Run Control for large collaborations. Whereas SSH provides security for command-line tools ‘automatically’ for the server in question, setting the authentication requirements for the Web GUI will require guidance from the collaboration. Options include tunneling into the servers over SSH, the use of a VPN, or the development of a secure, external authentication mechanism on a public-facing site.
Usually at least two levels of privilege are implemented for authenticated users: one for detector operators who have permission to actually start and stop processes, and a lower level for collaborators who are merely allowed to browse the detector state and history.
7.2.7 Space, Power and Communications
We specify online computing power and space needs for both the underground detector site and a surface building. We plan to place as much of the computing as possible in the surface facility.
Underground detector site requirements:
-
1.
Space for two standard 19-in computer racks
-
2.
12 kW power delivered to the racks (in-rack UPS).
-
3.
Control-room space for six computer workstations.
-
4.
Local area network of minimum 1 Gbit/sec.
Surface building requirements:
-
1.
Server-room-quality space (humidity and temperature controlled) in a surface building. This space can be shared with other experiments, but we require 24 7 access.
-
2.
Server-room-quality uninterruptible power supply (UPS) power with 35 kW capacity.
-
3.
Contiguous space for three standard 19-in computer racks,
-
4.
A high-speed Internet connection to the outside world from the surface building server room.
Underground-to-surface communications requirements:
-
1.
Reliable, dedicated 10 Gbit/sec fiber for network communications between routers in the surface building server room and the underground control room.
7.3 Offline Computing (WBS 1.4.7.3)
The Offline Computing group is responsible for providing the software to simulate raw data in both content and format, to reconstruct kinematic event parameters, and to define and perform production processing. The group is also responsible for the releases of the offline code and its distribution to collaborating institutions. The offline group will maintain backup copies of the data and software. Periodic validation of the offline data quality will be performed.
Since a common framework will be shared with the online group, the necessary synchronization with online updates will be coordinated with the online group. The offline group provides documentation to help collaborators access and analyze the data. Subgroups of the offline group will be formed to perform these tasks — a simulation group, a reconstruction group, and a data-processing group. Data analysis is intended to be performed by collaborating institutions and is not a direct responsibility of the offline group, although feedback from data analyzers to the offline group and participation in it will help make the offline operations productive, efficient, and useful for collaborators.
7.3.1 Simulation
The simulation group develops software used to model the expected detector response. The modeling should be sufficiently accurate to drive and evaluate first the initial conceptual design of the detector, and later, the final baseline technical design.
The simulation will be validated based on comparisons of its predictions with existing WCD data, for example from Super–Kamiokande [13], and tuned simulations. It must be able to model the detector response to the expected signal and background processes for several detector designs. These designs are listed below.
The simulation software will be used to produce Monte Carlo samples, which are needed to interpret the production physics data collected by the detector, in order to extract physics results. As the detector begins to collect data, we will tune the simulation to match the observed detector response in order to improve the reliability of the simulation’s predictions. This is a long-term project, and we expect the software to evolve over time.
In the near term, the simulation program WCSim supports the conceptual and technical design efforts of the WCD. This program, based on GEANT4[38], simulates our chosen configuration and others, including several that we studied earlier and rejected. The WCSim program is designed to use water as the active medium. The program allows changes in the detector geometry or PMT characteristics easily, enhancing its utility as a tool to characterize different detector configurations.
WCSim makes use of the most recent modeling of nuclear interactions and light transport, and realistic models of PMT timing, energy resolution, noise, and crosstalk. The program accepts as input particle kinematics from such neutrino interaction generators as GENIE[39]. Neutrino-beam fluxes are provided by the GNUMI[40] simulation which has been validated[41] against data from the MINOS experiment.
7.3.1.1 Detector Simulations
We have studied the following configurations using WCSim:
-
1.
The Super–Kamiokande geometry and PMT configuration
-
2.
100-kTon cylinder, 40% PMT coverage with 10-in tubes, normal quantum efficiency
-
3.
100-kTon cylinder, 12% PMT coverage with 10-in tubes, high quantum efficiency
-
4.
100-kTon cylinder, 30% PMT coverage with 10-in tubes, high quantum efficiency
-
5.
150-kTon cylinder, 12% PMT coverage with 10-in tubes, high quantum efficiency
-
6.
200-kTon cylinder, 12% PMT coverage with 10-in tubes, high quantum efficiency
-
7.
200-kTon cylinder, 10% PMT coverage with 12-in tubes, high quantum efficiency
-
8.
200-kTon cylinder, 14% PMT coverage with 12-in tubes, high quantum efficiency
The geometries listed above also are simulated with one or more light-collecting devices — Winston Cones, wavelength-shifting films in contact with the PMT face, and wavelength-shifting plates in contact with the equator of the PMTs. For details, see Section 3.4.4. In addition, Gadolinium loaded water is simulated.
As an optimization, the results of these simulations can be reused by post-hoc masking PMT signals and randomly removing hits in order to simulate the case of lower coverage or quantum efficiencies. Detector designs with and without a veto will augment these options.
We validate the detector simulation by setting its parameters to model the Super–Kamiokande detector and by comparing its predictions with that experiment’s observed data.
7.3.1.2 Physics Simulations
We will need to simulate the following physics processes: neutrino interactions in the fiducial detector volume initiated by the beam, atmospheric neutrino interactions, supernova-burst neutrinos, solar neutrinos, and nucleon decay products. Background processes to simulate include cosmic rays, PMT noise and radioactivity in the rock, PMT glass, and water, as well as neutrino interactions in the rock and non-fiducial portions of the detector. We will also need to simulate the proposed calibration methods described in Chapter 5. These include movable light sources, movable radioactive sources, and a possible electron beam calibration system. Currently available software simulates beam neutrino interactions, atmospheric neutrino interactions, neutrino interactions in the rock, and cosmic-ray muons, and the simulation program accepts a flexible text-file-based input which can list an arbitrary collection of particles with arbitrary energies and directions, which allows full simulation of arbitrary physics processes with a minimum of software development.
We will also need to evaluate the impacts of the design choices and available resources on the physics sensitivity of the experiment. The simulation program must be efficient enough to simulate large samples of Monte Carlo data with the proposed production computing nodes described in Section 7.3.2.
7.3.2 Reconstruction
The physics reach of the WCD experiment relies critically on the ability to identify the particle type of the outgoing lepton in a neutrino interaction and to separate charged-current (CC) neutrino interactions from neutral-current (NC) interactions as well as other backgrounds such as incoming cosmic-ray muons, radioactive decays, and random noise in the PMTs.
High detection efficiency, CC/NC separation, and good resolution of the measured interaction-vertex location, the energy, and the direction of electrons and muons from charged-current scattering are imperative for meeting the physics goals of the detector. Separating single-ring electron events from backgrounds containing is particularly important for the measurement of the rate of appearance via CC events. The decays initiate two electromagnetic showers, one from each photon, but one of the showers may have a much lower energy than the other. Reconstruction of easily-separated events provides a sideband measurement of this background which, together with constraints from near-detector measurements, constrains the background in the signal region.
The design of the reconstruction depends on the physical processes being studied. The ability to meet the science requirements[42] depends strongly on the design of the detector, as well as the capabilities of the reconstruction algorithms. Overall requirements have been collected and documented[16, 43] and are listed in Section 1.3.5.4. We repeat here the important design considerations for meeting the physics goals of the experiment.
- Position:
-
The vertex resolution for single muons or electrons must be better than 30 cm.
- Timing:
-
The time of the interaction is expected to be reconstructed to better than 1 ns. The absolute time of the event must be recorded with an accuracy better than 10 ns.
- Direction:
-
The angular resolution of electrons and muons will range from to at 1 sigma over the energy range of 100 MeV to several GeV.
- Energy:
-
The energies of single muons and single electrons need to be measured with a precision of better than .
- Pattern Recognition:
-
The reconstruction must be able to determine that an event has two rings when there are two trajectories above Cherenkov threshold from a common vertex and with an angle between them greater than 20∘ with 90% efficiency.
- Particle Separation:
-
In single-ring events, the separation between electromagnetic showers and track-like events (single muons and charged pions generate track-like events) should be achieved with and a factor of rejection at 1 GeV.
The reconstruction algorithms initially are expected to use techniques already developed and tested by Super–Kamiokande [44] and MiniBooNE[45]. These involve a likelihood-based primary vertex fit, followed by ring identification via Hough transforms. Particles are fit with charge and timing likelihoods, and the process of searching for additional rings is repeated until a stable solution is identified. Particle identification likelihood function values are to be computed by testing the various particle ID hypotheses with the data and finding the best fit for each one. Likelihood ratios for the hypotheses vs. and vs. will be provided. Alternate algorithms under study include Chroma[46], a technique that simulates many events similar to the data event to find the underlying parameters that best fit the data event. This approach is CPU-intensive and relies on Compute Unified Device Architecture (CUDA) enabled graphics processing units. Prototypes of these algorithms applied to the LBNE WC geometry have been developed, and were applied to fully simulated events. These algorithms succeeded in reconstructing single particles and in identifying multiple rings in multiparticle events. The efficiencies, particle ID, and vertex and momentum reconstruction resolutions for the prototype algorithms were not yet final, however. The existing implementations of the algorithms on Super–Kamiokande and MiniBooNE which achieve the target efficiencies, particle ID rates, and resolutions gives confidence in their applicability to LBNE.
Different reconstruction algorithms are to be optimized for different physics processes. Separate algorithms are to be designed to identify and measure throughgoing cosmic rays, low-energy neutrino events, and nucleon decay events. Algorithms must be provided for analyses with different background tolerances, and background-enriched samples will be needed to help calibrate the background rates and detector responses to both backgrounds and signals. If the Gadolinium option 9.1 is selected, algorithms to identify the neutron capture signature will be required to be sufficiently efficient and have sufficiently low background in order to accomplish the physics goals enabled by the Gadolinium option. Nonetheless, the algorithms that are developed are to be designed to be as generally applicable as possible. It is valuable to be able to reconstruct a set of events that is rejected from a signal sample by an analysis requirement in order to measure the backgrounds for that analysis using the rejected data. An example of this is the use of atmospheric neutrino events as a control sample for the beam physics measurements. Atmospheric neutrinos help calibrate the detector acceptance and uniformity, and they also provide a sample of both electron-type and muon-type neutrinos. A reconstruction algorithm that relies upon the knowledge of the incident neutrino’s direction, for use in the beam-physics measurements, would not be as applicable for atmospheric neutrino measurements, nor would the control sample of atmospheric neutrinos be as valuable for this algorithm.
7.3.3 Production
The Offline group will manage large production runs. The production system will stream and distribute data for analysis, manage calibration runs, and support batch processing and event-display programs.
7.3.3.1 Design Considerations
In order to meet the physics goals of the experiment, the production activity will need to run several reconstruction algorithms on the events, each algorithm optimized to perform a task needed for a particular type of analysis.
Events depositing low amounts of energy in the detector must be treated differently from those depositing higher amounts, in order to improve the analysis throughput of the beam physics and atmospheric neutrino program while preserving the separate capabilities to search for nucleon decay and analyze solar-neutrino data. Further subdivisions will be considered as the analysis efforts mature.
The current CPU requirements, described in Section 7.4 are estimated based on known reconstruction techniques. If a significant algorithmic improvement becomes available some time during the detector’s lifetime, e.g., after accumulation of several years’ worth of data, the computing resources must be able to accommodate a potentially large reprocessing effort.
7.3.3.2 Responsibilities of Production System
Initially the production runs will produce simulated event samples to be used to test reduction and reconstruction algorithms. These algorithms will later be run on real data. The output of the production processing will go into permanent storage, quickly and easily accessible to all collaborators.
As events pass different levels of selection requirements, the system will distribute them as separate streams for use in analysis. The production system will apply appropriate algorithms to each stream to maximize both the physics output and the convenience for analyzers, within the constraints of the available resources. The offline group will maintain a calibration database to be used in the process of reconstruction of these events, and incorporate into it the results of dedicated calibration runs along with calibrations that can be performed with the physics data.
This activity will support user-initiated batch processing. Currently this is handled at Brookhaven and Fermilab through the Condor batch system[47]. Some effort is currently underway and will continue on unifying the local batch systems at the major computing centers under a global, GRID-authenticated batch system. This effort comes from the BNL Physics Application Software and uses PanDA[48].
Data quality monitoring is an important responsibility both of the offline group and of the physics analysis groups. Data quality assurance starts with online data quality monitoring by automatic tools checking distributions of events in newly collected data against expected distributions, and by visual checking of these distributions by the shift operators. Shift operators are expected to make entries in the online logbook of conditions that are expected to affect data quality. An online signoff form for each run reflecting the status of the detector and data acquisition components will be used to fill entries in a database of all runs collected by the detector. This database, together with historical slow controls data, will be used to make a list of runs that can be used for physics analyses. Specific examples of runs that are expected to be excluded from the list include calibration runs, DAQ and trigger test runs, and runs that are taken with non-nominal conditions. If an operations incident occurs such as temporary failure of the high-voltage system, water clarity degradation, or other incident that is addressed by repairs, then the runs acquired during this period should be flagged as not of analysis quality in this list. If the trigger conditions change, or Gadolinium is added partway through the lifetime of the detector, then multiple lists of analyzable runs will be produced, targeted at analyses that depend on the specific conditions. The final lists of analyzable runs will require analysis personpower to prepare, and must be approved by the physics analysis groups in regular meetings in which histograms comparing new data against old data and expected distributions are shown, discussed, and validated.
The production activity will also support event-display programs to assist collaborators in developing reconstruction algorithms, to characterize the performance of the simulation and reconstruction processing, and to prepare documentation and presentations. Such display programs will in turn need user interfaces that allow selection and display of events by run and event number. It is too early to specify the precise technology of the final event display, but existing 2D and 3D event displays from Super–Kamiokande and other large Cherenkov detectors serve as excellent starting examples. Several event display programs exist already to view the output of the simulation program described above in order to check the geometry description and the physics output.
7.4 Infrastructure (WBS 1.4.7.4)
The Infrastructure group provides technical support to the Online and and Offline groups. It is responsible for providing, maintaining and supporting a common software framework, a suite of applications for collaborative software development and for ensuring adequate data archive resources, production processing hardware and network connectivity.
7.4.1 Software Framework
Basing the software on a framework is an important design decision that has long-lasting repercussions. A framework-based design has been compared against a toolkit-based approach and with an ad-hoc design. Experience with all three approaches has shown that using a framework is best, based on several metrics. A framework manages complexity and hides it from the end user/programmer. It abstracts away much of the application and leaves just the few entry points needed to insert analysis code. A framework insists on modular user code. This gives all user/programmers a common language that greatly assists in sharing and understanding the codes.
The role of this group was to first select a software framework to provide the basis of both online and offline software, then to develop an automated installation mechanism and documentation and finally to provide ongoing support throughout the project. Although not required, other subprojects, in particular the Near Detector, may benefit from adopting the same framework, in which case this Infrastructure group would support them.
The software framework must satisfy the following requirements:
-
Support the major POSIX platforms expected to be used by the collaboration. Currently, this means GNU/Linux and Mac OS X.
-
Support installation from source by non-experts, including any required 3rd party packages not typically found on the supported platforms.
-
Manage complexity, allow modularity, support collaborative contribution from diverse developers.
-
Support integrated detector simulation and detector-geometry description.
Various members of the collaboration have had direct experience with the existing frameworks IceTray[49], RAT[50] and Gaudi[51]. After a survey and comparison, we selected Gaudi based on its large user base, community support and available features. We expect to take some important modules, such as those for kinematics generation, detector response and geometry modeling, from existing LHCb and Daya Bay implementations.
7.4.2 Collaborative Software Applications
Various software applications are needed to support collaborative effort. Additional ones are needed to support, specifically, computing related activities. They are listed below. This group will determine the requirements for a suite of applications that support this collaborative work. It will evaluate, select, install and maintain the selected instances.
The following suite of applications that support collaborative work is required and where a choice has been made, it is listed.
- Mailing lists
-
GNU Mailman mailing list server[52]. Many lists are already in use, including some for areas outside this level 3 subproject. They are maintained by BNL IT professionals.
- Version Control
-
Subversion[53]. Subversion has largely replaced the venerable CVS[54] for revision control based on a centralized model. It is near enough in usage to CVS to not require a large migration cost while still allowing for use of more advanced tools like git[55]. A central server has been set up and is maintained by BNL IT staff.
- Bug Tracking
-
Trac source code and project management software[56]. Trac is an extremely useful issue (bug) tracking and software-project-management system. It has a variety of extensions that will be evaluated including automatic testing of the code base triggered by recent revisions. An instance has been integrated with the Subversion repository and is maintained by BNL IT staff.
- Web Presence
-
MediaWiki[57]. Wikis in general have become one of the standards for collaborative web presence. MediaWiki has proved itself in both high-volume public installations (Wikipedia) and in various neutrino experiments including the near detector and beam groups of LBNE. An instance for WCD has been set up and is maintained by BNL IT staff.
- Databases
-
T.B.D. A central RDBMS master and a number of distributed slaves are needed for storing time-dependent or other random-access information about detectors in support of offline processing. In addition an on-site, online RDBMS will be needed for slow- and run-control and monitoring information. In addition these servers are expected to support some of the other applications listed here and in the online section above. The exact technology is still to be determined but the choice will likely be between MySQL[58] or PostgreSQL[59]. Expensive, proprietary databases are not required and will not be considered.
- Electronic Log Book
-
T.B.D. Logging of information during commissioning and operations should be handled in a way that allows for distribution to and contributions from all collaborators. The exact technology must still be selected or developed. Past experience with ELOG[60] shows it is a potential fall-back choice but alternatives will be explored. The Fermilab NUCOMP group is currently investigating implementing a new electronic log book based on requirements from the community. Members of this group are participating in that effort.
7.4.3 Data Archive
The Infrastructure group will provision archival storage sufficient to meet the experiment’s needs for the raw data and output of production runs.
The raw data archive must ensure that less than 0.1% of the data is ever irretrievably lost. This can be achieved by mass storage systems such as the HPSS[61] in the Brookhaven RHIC/ATLAS Computing Facility. It must handle the expected 48 TB per year of raw data and approximately 96 TB per year output from the simulation and the reduced, reconstructed data.
The full raw data set will be made available to all members of the collaboration. However, it is expected that the full data set will not, in practice, be distributed to all institutions and instead a smaller, reduced and reconstructed data set will be widely disseminated.
7.4.4 Production Processing Hardware
This group will provision adequate computing hardware for production running.
Computing hardware to simulate and process raw data needs to be procured periodically as needs increase. A single year’s requirement was estimated by scaling from Super–Kamiokande experience and configuration. The method[62] was applied to the design using 200 kTon, 28719 12-in PMTs. The per-year additional needs due to acquiring a year’s worth of new data was also considered[63]. Table 7–1 shows the estimated amount of CPUyears needed to simulate and process raw data for one (calendar) year including reprocessing and the yearly increase in data.
| Sample | Year 1 | Per-year Requirements |
|---|---|---|
| Data | ||
| Cosmic MC | none | |
| MC | ||
| Total CPU |
It is expected that the hardware will be housed in the Brookhaven RACF. This facility serves as an ATLAS Tier 1 for the United States and what could be called a Tier 0 center for the RHIC experiments. Our modest requirements have led to an agreement with the RACF director that until we require more than 10% of an FTE we need not pay labor overhead. We do not expect to cross this threshold until detector commissioning. In the meantime all services from RACF are at no cost to LBNE after the hardware is purchased. The CPU lifetime in the RACF is around three years and we have structured our purchases with this in mind.
7.4.5 Networking
This group must design, install, maintain and assure adequate end-to-end connectivity between detector DAQ electronics and major computing centers.
The WCD requires a LAN that is firewalled from the general underground network for security and data-throughput reasons. A dedicated 10-Gbit/sec fiber is required between these WCD LANs and the Online computing cluster. The data-rate output by the Online is of order 2 MByte/sec. Internet connectivity between the Online computing cluster and the data archive system must be adequate to sustain a bandwidth of at least a factor of two over this data rate. We note that this bandwidth is modest by current standards.
8 Installation and Integration (WBS 1.4.8)
This chapter describes the responsibilities of WCD Installation and Integration. Construction of WCD at Sanford Laboratory requires the coordinated effort of teams of scientists, engineers, technicians, trades and student labor from National Laboratories and universities throughout the U.S., as well as private contractors. The Installation and Integration group will coordinate these dispersed teams to ensure safe and efficient design and construction of the WCD.
The scope of the Installation and Integration group’s activities extends across the entire WCD project and also to the LBNE Conventional Facilities subproject. These activities include:
-
Identification and definition of boundaries between individual WCD subsystems and between the WCD subsystems and Conventional Facilities
-
Generation of requirements documents, interface control documents and subsystem reviews, definition of engineering and safety standards, document control and related activities
-
Interface to civil construction at the facility, including WCD equipment requirements as they pertain to space and utilities at the facility
-
Overall planning for final assembly of all WCD equipment, including scheduling, staging and work planning for final assembly both above- and below-ground at the facility
-
Coordination of receipt, storage and delivery of components to final location and inventory management
-
Assist LBNE project in the development, implementation and oversight of an integrated Environmental, Health & Safety and Security plan for the WCD subproject
-
Provide the overall planning, scheduling, staging and work planning for final assembly (installation) of all WCD equipment above and below ground at the facility
8.1 Integration (WBS 1.4.8.2)
The WCD Integration activities include management, engineering and design effort to assist each subsystem workgroup in developing, defining, and controlling the mechanical systems, electrical systems and experimental assembly requirements at the facility. Integration activities also include management of all the interfaces between subsystems. In addition, this group will document and provide Engineering Design Standards, Interface Control Documents, Hoisting and Rigging Practices and Engineering Document Control Systems to be used by all subsystems and their contractors.
Integration is responsible for providing liaisons between the subsystems to coordinate and document efforts in resolving all physical interface issues. Engineering and design effort must be devoted to ensuring that subsystem hardware can fit together, be assembled and serviced and minimize negative impact on other subsystems. To accomplish this requires communication on integration issues and their resolution, based on change-control policy, to subsystem managers, project management and the collaboration. Therefore Integration is the central group to receive, process and approve all Engineering Change Requests and Engineering Change Notices (ECR/ECN) dealing with subsystem interfaces, experimental assembly and physical envelope related issues. The Integration group’s activities are divided into several main categories described in the following sections.
The ability of the WCD to accomplish low energy neutrino physics is impeded by water turbidity and background events caused by radio impurities in the water. Limiting this contamination is most important for the preservation of the gadolinium option for low energy physics in which it is desirable to attain low energy thresholds of approximately 4 MeV (see Chapter 9). To avoid the impediments to low energy physics, systematic cleanliness and radioactivity requirements must be instituted throughout the manufacturing and construction processes. It is important to recognize that all efforts to attain the lowest possible threshold should be made during the component manufacturing and detector installation stages because contaminants, once introduced, are very difficult and time consuming to remove from the operating detector. It is worth noting that during the manufacture and construction of other water Cherenkov detectors, some were constructed with a very high degree of cleanliness and some very little. These two extremes attained low energy thresholds of 3.5 MeV and 5 MeV, respectively. Studies are currently active or in development to determine the optimum low energy threshold for low energy physics with gadolinium doping and correlate anticipated levels of contaminates in the WCD water to levels of background events that impede low energy physics. Integration is responsible for the establishment and continued coordination of cleanliness and radioactivity budgets for the detector. The requirements for these budgets will, in large part, be defined by the results of the studies mentioned above; therefore, the cost associated with significantly more stringent cleanliness requirements is to be estimated in the future within the cost of implementation of the gadolinium option. However, in the interest of not only preserving the gadolinium option but low energy physics in general, even without gadolinium, an air-lock/washdown space at the entrance to the large cavity is incorporated in the WCD conceptual design. The plan for use of this space during WCD installation is identified in Section 8.2.1.
8.1.1 Mechanical Systems Integration
Mechanical systems integration work provides hardware interface coordination and control. These activities assist the project and subsystems in defining and developing component envelope geometry to assure that hardware from the various subsystems will fit together. Interface boundaries of the physical components are defined so that each subsystem has defined limits to allow for hardware assembly, installation, operation and maintenance. To accomplish this goal, engineering and designer effort is required to develop and maintain integrated 3D models incorporating the subsystems’ models. These 3D models are used to determine component interference issues with adjoining systems in their operational configuration. Integration maintains configuration management through compiling, and keeping current, the 3D models into the Detector configuration.
8.1.2 Electrical Systems Integration
Electrical systems integration work assists in defining all experimental project electrical requirements for the installation and operation of the WCD. This should include both facility (conventional) power and experimental (isolated, or “clean”) power along with appropriate electrical-ground isolation. Power is divided into logical units according to function:
-
Conventional power: define experiment AC electrical power supply and distribution extending from the facility provided power stations to the WCD systems
-
Clean power and grounding: define an isolated power distribution network required to supply AC power for all subsystem experimental electronics. In addition, a grounding plan for all AC power systems must be developed and implemented to eliminate clean-power ground loops and minimize electrical noise on experimental system electronics.
-
Uninterruptible Power Supply (UPS) and Emergency Power: define UPS requirements for isolated clean-power electronics, and minimize operational downtime and loss of data caused by electrical utility power dips and short-term disruptions.
-
Tray Routing consists of engineering and designer effort in defining and documenting electrical-utilities (tray and conduit) routing for experimental needs through the complex.
8.1.3 Experimental Assembly Integration
Experimental assembly integration work assists in the development of an overall experiment installation plan. Although each subsystem is responsible for the delivery of component hardware for installation at the facility, the Installation group provides the resources needed for assembly and installation. Interface definition requires engineering effort to work with individual subsystems in defining and documenting a hand-off interface with the Installation group. This interface will specify the deliverable hardware configuration, quantity, timeline, access and initial staging of the hardware at the facility complex.
8.1.4 Engineering Standards
Engineering standards, reviews and document control systems are needed to provide common engineering design standards for both mechanical- and electrical-systems. These are developed by the Integration group. The Integration group will also develop and conduct Engineering Design Reviews of all WCD subsystem projects’ deliverables and will also assist the LBNE project with development of an Engineering Document Control System and database for storage of all related project documents.
8.1.5 Requirements Development
The Integration group assists the collaboration in the development of top-level LBNE and specific WCD physics requirements. Engineering and subsystems requirements flow from the physics requirements to engineer a detector that will accomplish the experiment goals. Safety requirements initiate the development of designs, specifications and procedures for assurance of safe personnel operations and environmental stewardship. Quality requirements define the parameters necessary to meet all the goals of the experiment. All of these requirements are written or facilitated by the Integration group with the appropriate subsystems personnel. After the initial set of requirements, interfaces between all systems and equipment are summarized. Interfaces between WCD workgroups, the detector project office and LBNE and the detector project office and Conventional Facilities group define boundaries between scientific, engineering, safety and quality efforts. It is then necessary to continuously resolve gaps and overlaps in interfaces to ensure that nothing is overlooked and duplication of effort is minimized. With interfaces defined, workgroups can define specifications that include interface-control data. Specifications for the detector systems and equipment require Integration workgroup oversight for interface control and configuration management.Comprehensive requirements serve as the backbone for development of the interfaces, specifications and engineering design that follow.
8.1.6 Civil Construction Interface
The Civil Construction Interface consists of management, engineering and designer effort to assist subsystems in defining the experimental requirements as they pertain to space and utility interface with civil construction of the facility. This includes activity such as the definition of the cavern/vessel interface as discussed in Section 2.2. The group will interact with WCD subsystems groups and the LBNE Conventional Facilities group in defining experimental and civil interfaces. They will incorporate as-built civil documentation into 3D models of the WCD project civil complex as required for subsystems design and installation planning. Integration incorporates mechanical utilities such as HVAC ducting, plumbing and piping, lighting, AC power distribution, gas and water systems, access shafts and drifts, fire and safety systems, communications and networking, materials handling and overhead cranes into WCD experiment documentation.
8.2 Installation (WBS 1.4.8.3)
The scope of the Installation group’s activity includes the overall planning, scheduling, staging, resources, execution and work controls process for the final assembly, installation and test of experimental hardware above and below ground at Sanford Laboratory.
The Installation group’s activity on-site at Sanford Laboratory begins with the construction of the water vessel immediately following Beneficial Occupancy of the underground site at Sanford Laboratory. The Installation group provides management oversight, engineering labor, installation labor, materials and general use equipment required to perform installation functions. Installation activities include experiment installation work at the surface facilities, underground facilities and the scheduling with Sanford Laboratory of shaft access. Installation activity ends with filling the detector with water and final closing of the gas and light barriers. Detector commissioning and related global testing will not be part of this group’s scope but will take place within the scope of pre-ops and operations.
The Installation group develops and implements a global Work Control System that captures all project-related work to be performed at WCD subproject facilities. This is to ensure that all project work is documented for installation-management review, meets OSHA and ES&H standards and is performed by trained, qualified and authorized workers. Installation planning and scheduling requires the development of a resource-loaded project installation schedule. This schedule details multi-level tasks, durations, start and finish dates and appropriate task constraints based on deliverables, logical sequence of events, access, and availability of resources. From this schedule a list of reportable installation milestones will be developed and maintained within project controls. The Installation group is responsible for gathering information from all of the subgroups and producing and maintaining an up-to-date master resource loaded installation schedule. Then the group monitors and tracks progress making adjustments in schedule and resources to meet project objectives. In the development of the WCD installation plan parallel efforts were and will continue to be explored. Due to ever-changing plans on the short-term scheduling, the project installation schedule will be non-reportable, but will provide information on major installation milestones. The Installation group tracks the major milestones of the project installation schedule and if the milestones are missed, this group reports the variances.
A stringent, consistent policy and training program is needed for Rigging and Hoisting Practices. The purpose of this activity is to develop and implement the procedures and practices for conducting ordinary, pre-engineered, and critical lifts that will be applied in the delivery, assembly, installation and experimental systems for the WCD Project at Sanford Laboratory. This document is based on the Brookhaven National Laboratory (BNL) Standards Based Management System(SBMS) for worker safety and health, subject area: Lifting Safety. Further reference is the DOE STD-1090 Hoisting and Rigging.
8.2.1 Installation Cleanliness
At designated times, after large cavity beneficial occupancy, cleaning of installed detector components with high purity water is required. After each cleaning operation the level of cleanliness for equipment and personnel entering the large cavity is to be increased. The WCD conventional facilities conceptual design includes an air-lock/washdown space at the entrance to the large cavity to accomplish this staged increase in cleanliness during installation. The highest level of cleanliness to be achieved is to be determined by results of studies described in Section 8.1.
8.2.2 Installation Storage Facility
A storage facility of sufficient space is required near Lead and the Yates shaft. Ideally, such a storage facility will be placed within 50 miles of the Yates shaft. Some components of the detector will be shipped to this central facility prior to installation. The facility will house components such as PMT assemblies, PMT Installation Unit (PIU) assemblies, electronic system racks, crates, and circuit boards and allow for long term storage, inventory management, and testing of these components. Because of the type of equipment being stored the storage facility will be climate-controlled. This facility will also be used to coordinate shipping of components and numerous subassemblies to the Sanford Lab Yates Headframe. To provide orderly tracking of these components, a Local Storage and Transport group within Installation is responsible for the receipt of all WCD subsystem deliverables to the Sanford Laboratory complex and their timely transport to the underground facilities for installation. Some components will have just-in-time deliveries based on the installation schedule, while many others, such as PMTs and their supports, will be multi-year procurements. The latter requirement implies a phased delivery in lots that results in the need for the Installation Storage Facility. The Installation group will be responsible for material handling and storage during WCD construction, coordination of delivery of components to their installation site, use of space during construction, and the number and activities of LBNE on-site personnel. The storage facility will NOT house components for vessel construction, deck/balcony construction, mast climbers, or other personnel lifts. It is expected that contracts will be written for these Installation activities that will include component and material delivery, handling, and storage that adhere to the WCD installation schedule.
8.2.3 WCD Installation Tasks and Sequence
The general Water Cherenkov Detector installation sequence is planned as follows:
-
1.
Site preparation
-
2.
Surface water fill system installation
-
3.
Mast climbers installation
-
4.
Magnetic-compensation coil installation
-
5.
Water containment smoothing shotcrete application
-
6.
Deck level 2 (balcony) construction
-
7.
Deck level 1 construction- concurrent with balcony
-
8.
Clean deck levels 1 and 2
-
9.
PIU installation on deck level 1
-
10.
Lift deck level 1 to 4850L
-
11.
Liner application and leak testing
-
12.
Clean liner
-
13.
Wall and floor infrastructure installation
-
14.
PMT cable feedthrough and deck infrastructure installation
-
15.
Electronics installation
-
16.
Wall and floor PIU installation
-
17.
Light barrier and light collector installation
-
18.
Deck annulus PIUs installation
-
19.
Dry survey
-
20.
On-line computing systems installation
-
21.
Water recirculation system installation
-
22.
Fill vessel and leak check
-
23.
Final systems checkout
-
24.
Closeout of gas and light barrier ready for commissioning
We expand on these below.
-
1.
Site Preparation Beneficial occupancy will take place after cavern excavation and rock stabilization is done by contractor of the LBNE Conventional Facilities group as discussed in Section 1.3.6 and Section 2.2. Adequate infrastructure will be installed to allow for occupancy by LBNE personnel. This will include, but not be limited to personnel lifts, electrical systems, lighting, HVAC and other air-quality devices. Some of this infrastructure will be in the final configuration and some is temporary. The main and secondary egress drifts at 4850L will be available for personnel access when LBNE takes beneficial occupancy.
-
2.
Surface Water System Installation The surface water system is to be installed within the Yates Headframe crusher room which is to be modified for installation of this equipment by LBNE Conventional Facilities. LBNE WCD Water Systems group is to contract the design, build and installation of this system in accordance with LBNE requirements. Installation group is responsible for installation planning and scheduling of the surface water system installation.
-
3.
Mast Climbers Installation The Water Containment subsystem group is responsible for design and procurement of much of its own installation equipment. Installation group is responsible for detector installation planning and scheduling of this equipment. See Section 2.9.1 for description and uses of mast climbers.
-
4.
Magnetic-Compensation Coils Installation The magnetic-compensation coils (see Section 2.8 and Fig. 2–30) will be installed on the stabilized cavern surface in order to optimize their effectiveness. However, before this is done, the surface diameter of the cavity will need to be made more uniform to within some known tolerance. Any extreme undercuts or breakouts in the cavern wall will be filled with concrete to bring them out to the neatline. Once this is complete, the magnetic-compensation coils can be installed. On the wall of the cavern, three types of coils: the vertical, the outer-diameter horizontal, and the saddle coils must be installed. The vertical cables will be cut to length and suspended down from near 4850L on the cavern walls at the proper spacing and position to the cavern floor. At approximately 1-m intervals, these cables will be fastened with J-hook type hangers to the cavern wall as the platform moves downward. We will also install the outer-diameter horizontal cables during this process and fix them to the cavern wall at 1-m intervals. At the appropriate levels, the horizontal arcs of the saddle coils will be fixed to the cavern wall. The vertical legs will be attached and extended downward to the second horizontal arc. For all of the outer-diameter horizontal and saddle cables, junction boxes will be installed and the cables connected using waterproof splices.
-
5.
Water containment smoothing shotcrete application The next WCD installation phase will be the vessel (see Section 2.3 and Fig. 2–6). Reference plan envisions that the vessel wall, consisting of a smoothing layer of shotcrete, is supported directly onto the shotcrete wall taking advantage of the support from the stabilized rock. All provisions for liner attachment and mounting points for equipment are installed at this time. (see Fig. 2–7).
-
6.
Deck level 2 (balcony) construction The balcony surface will be constructed at height during the LBNE Conventional Facilities cavern excavation.
-
7.
Deck level 1 construction - concurrent with balcony The center portion of the deck (see Section 2.4 and Fig. 2–9) will fill the center of the annulus at 4850L, roughly the same as the inner diameter of the balcony. It will be constructed on the floor of the cavern. A crane will lower materials from 4850L for deck construction. There will also be some temporary infrastructure installed below the deck for lighting units, needed for work below once the assembly has been lifted. Deck PIU support structure is also installed under the deck.
-
8.
Clean deck levels 1 and 2 Before the center portion of the deck is lifted into place both deck levels must be cleaned to cleanliness levels associated with this cleanliness transition.
-
9.
PIU installation on deck level 1 After the center portion of the deck assembly is constructed, it will be lifted 10 feet to allow for installation of PIUs on underside of the deck (see Figure 2–18). The required steps include:
-
(a)
Deck water manifolds are installed under the deck
-
(b)
Bring the sets of disassembled PIU structures into the vessel by lowering them using a crane to 5117L. The number of sets is determined by the available space and time needed to install them.
-
(c)
Take them to the desired place under the deck using material-handling equipment such as hand trucks or pallet jacks.
-
(d)
Install the PIU structures.
-
(e)
Install PAs to the frame structure built in previous step.
-
(f)
Place cables for the first set of PIUs into trays, tied at regular intervals ( 1 m), and route them to the edge of the deck surface.
-
(g)
Workers on the deck surface dress the cables around the edge and place them in the trays. Additional cable length will be stored on the deck surface until the center section of the deck assembly has been raised to 4850L.
-
(h)
Repeat process until all center-deck PIUs are installed and their cables are in place.
-
(i)
Install light barrier over all PIUs as explained in Section 2.7.3.
-
(a)
-
10.
Lift deck level 1 to 4850L Once the center portion of the deck assembly is fully constructed and all of the PIUs on its underside are installed, the deck will be lifted to 4850L. This will be completed using wire-strand lifting units. These units will be positioned on the balcony. Wire-strand cable will be routed through the lifting units down to the cavern floor, approximately 80 m below, and attached to the center portion of the deck. Preparation for this lift is expected to take one to two weeks. Once started, the assembly can be lifted at approximately 10 m/hr. Thus, the entire lift can be performed in one working day. Once the assembly reaches 4850L, it will take approximately one week to secure it to supports from the balcony and the dome. Once this is complete, the lifting units and wire-strand cable will be removed and returned to the surface.
-
11.
Liner application and leak testing Next the liner is installed, a thin polymeric membrane, on the inside of the vessel wall. Large sheets of this material will be positioned and fixed to the shotcrete surface using the mast climbers. Once a sheet is in position, the next (adjacent) sheet will be placed, and the two sheets will be welded together to form a leak-tight seal. The integrity of these welds will be tested continuously during installation. Mounting point sealing boots are installed at this time. The process is repeated until the surface accessible from the given mast position is covered. The mast is moved and the steps repeated until the entire liner is installed. The mast climbers are removed from the large cavity at this stage.
-
12.
Clean liner After liner installation is complete space within the large cavity must attain the next level of cleanliness. To achieve this the liner on the walls and floor are cleaned.
-
13.
Wall and floor infrastructure installation Using gondolas, the wall and floor infrastructure is installed. This includes water piping, calibration apparatus, water monitoring equipment, and any additional equipment.
-
14.
PMT cable feedthrough and deck infrastructure installation Installation of the cable plenums and feedthroughs, cable storage, electronics enclosures and other infrastructure will be installed on the deck surfaces at this time.
-
15.
Electronics installation Electronics-system components will be assembled and tested prior to shipment to a storage warehouse facility in Rapid City. Backplanes mounted in the racks will be attached with sufficient strength to survive shipping. Delicate components such as circuit boards and cards will be removed after the tests are complete and packaged separately. The racks for the electronics will be delivered directly to the Sanford Lab. After transport to 4850L, they will be unpackaged, assembled, positioned, and mounted in their predetermined location on the deck or balcony. All services will be installed to the racks as well as cable trays for both incoming and outgoing cables. The electronic crates will be delivered to 4850L, unpackaged and installed into the appropriate racks. The pretested boards and cards will then be remounted into the crates. The electronics group will conduct complete functionality tests at this point. Delivery and installation will be integrated into the overall installation schedule so as not to interrupt workflow of PMT installation work. The electronics group provides the skilled labor for detailed system-checkout.
-
16.
Wall and Floor PIU Installation PMT Installation is a complicated and time consuming task where time can be saved by performing tasks in parallel to each other. The following installation sequence shortens the installation schedule. The vessel wall and floor will be divided into six sectors (1,2,3,4,5 and 6) so that different tasks can be performed in individual sectors at the same time. We assume that 3 wall PMT installation platforms and 2 gondolas are available for installation. In general, three sectors of wall PMT cable deployment and three sectors of floor PIU installation are performed simultaneously. Then, the final three sectors of wall PMT cable deployment and floor PIU installation are performed.
-
(a)
Wall PMTs — Wall PMT installation is accomplished using cable deployment design. Three deployment stations, designed and built by the Water Containment group, are used for wall PMT installation with a crew of 7 workers. These mobile deployment stations will be free to move 360∘ around the deck. PAs are deployed one by one on a set of two parallel steel wire ropes.
-
(b)
Floor PMTs — Gondolas are required for floor PMT installation. In this case the gondola platform will be used for access to the vessel floor and later for PMT cable routing up the walls. The installation sequence for floor PMTs is:
-
i.
Install floor liner with sealing boots around the previously surveyed in attachment points and leak-test the joints
-
ii.
Install PIU structure on vessel floor
-
iii.
Use gondola to lower PIUs to the floor
-
iv.
Install PAs on to the PIU structures
-
v.
Route floor PMT cables to the wall
-
vi.
Put cable spools on the platform
-
vii.
Route PMT cables up the wall by tying them onto the wall PMT steel wire ropes. This will be done using gondolas.
-
viii.
Workers on top of deck pull the cables through openings in the deck and lay cables in trays.
-
ix.
Load next set of PIUs onto the platform and repeat procedure. The feed-through enclosures will be installed around cable bundles after all cables pass through the deck.
-
x.
Remove any equipment used for wall installation from the cavern.
-
i.
Details of PIU installation scheme can be found in section 2.8. Also refer to Fig. 2–13.
-
(a)
-
17.
Light barrier and light collector installation The vessel floor and wall are divided into 6 equal sectors as explained in PIU installation step. The floor light barrier and light collector installation for a sector takes place after the PIU and cable installation of that sector is done. Wall light barrier and light collector installation for a sector takes place after the floor PIU, cable, light barrier and light collector installation is finished for that sector. Wall light barrier installation will require use of the gondolas. Light barrier installation is shown in Fig 2–23.
-
18.
Deck annulus PIUs installation The deck-annulus PIUs will fill the gap between the center portion of the deck and the vessel as shown in Fig. 8–1.

Figure 8–1: Center and annular PIUs for the deck. The inner annular array (on the outside of the main deck radius) will be attached to the edge of the center portion of the deck by a hinging mechanism. Once attached, it will be swung outward until level with the other PMTs under the deck, then mechanically locked in place. This will fill half of the gap to the vessel. Utilizing the overhead hoist under the balcony, a temporary walk platform on the inner array, and the appropriate personal protection device, the second array will be moved via the hoist and connected to the exterior edge of the first array. Personnel will use the PPE and the temporary walk platform to attach the second array to mechanical hardware on the vessel wall.
-
19.
Dry survey Accurate reconstruction of events from the detector requires precise positioning of the PMTs inside the vessel. PMT installation mounting points including PIU mountings on the deck and floor and wire rope anchors, will be engineering surveyed routinely during all phases of construction. This will help establish positioning of all tubes for the detector to engineering tolerances. A flexible mounting arrangement will have to be designed to locate the PIUs to within the desired tolerance. It is required to locate PMTs both before and after filling the detector with water know the shifted position of PMTs under water due to the buoyant force. Two methods are under consideration for the final physics survey of the PMT locations, photogrammetry and 3D laser mapping. Photogrammetry is the use of photographic images to make position measurements. Modern methods use stereoscopic images and sophisticated software to precisely locate components. Laser imaging can also be used to develop images and locate components.
-
20.
On-line computing systems installation On-line computing systems, both above ground and underground, are installed and connected to the Electronics DAQ system.
-
21.
Water recirculation system installation The underground portion of the water system is to be designed, built and installed by contractor in accordance with requirements provide by LBNE. The Installation group is responsible for installation of any additional support structure required to install water-system components in the utilities drift. The Installation group will also make sure that contractor complies with safety regulations established for the experiment. The detailed installation procedure can be found in Section 6.8. Some tasks are performed in parallel to save time during water system installation. Water recirculation system and pumps are installed at same time. Sump and drain system and waste water system are installed at the same time.
-
22.
Final systems checkout
-
(a)
Final system checkout will be done to make sure all the PMTs are functioning correctly
-
(b)
A final survey will also be done to find our final positions of PMTs after vessel is full.
-
(c)
Final PMTs are installed to fill in empty spaces between X-Y array and annular polar arrayed PMTs.
-
(d)
All the ports and hatches are sealed.
-
(e)
Gas barrier installation is finished and gas barrier is tested.
-
(a)
-
23.
Closeout of gas and light barrier ready for commissioning A full check-list must be completed and action items dealt with one-by-one. The completion of this “punch-list” will assure the project team the Detector is ready for commissioning. Detector commissioning is to be performed in parallel to vessel filling operation.
8.3 Safety Systems (WBS 1.4.8.4)
Personnel safety is of primary importance during all phases of the WCD project, from Safety Reviews of components through final installation at the facility complex. The scope of this activity is the management and provision of resources needed for the development, implementation and oversight of an integrated Environmental, Safety, Security and Health plan for the WCD project. This group will interface with LBNE safety management and facility safety groups; will be responsible for the development and implementation of safety policies; review of experimental hardware; and protection of all WCD project workers and contractors at the facility complex. These safety policies will be developed to ensure that an integrated safety management system is implemented, and to provide the necessary guidelines, requirements, training and documentation to manage the ES&H program and to ensure that local environmental and safety regulations are met.
Procedures will be developed and implemented to ensure that all project work is reviewed for environmental and safety aspects, meets OSHA and ES&H standards and is performed by trained, qualified and authorized workers. The review procedures will provide clear responsibilities for conducting safety reviews, approving work plans, and scheduling work. The work documentation and review will be integrated with facility safety groups so that local environmental and safety standards are met throughout the construction and installation of the experiment.
The WCD safety group also has the responsibility to ensure that OSHA life-safety requirements are met, including emergency and evacuation plans. Training and underground access control procedures will be developed to meet facility requirements. Training, policies, and procedures will also be provided for supervisors and personnel who will be exposed to specific hazards during installation tasks and operation. The safety group will also establish the requirements and procedures for a program of self-inspection during construction and installation. The purpose is to provide oversight to ensure compliance with the safety and environmental policies that are established, and to identify and correct problems before they become serious issues.
9 Enhanced Physics Capabilities
This chapter presents two proposals that could enhance the physics performance of the WCD. The first is the addition of gadolinium to the water to increase neutron capture and the second is the development of high-resolution microchannel plates as an alternative to PMTs in the WCD.
9.1 Enhanced Neutron Capture by adding Gadolinium
The ability to detect neutrons would greatly expand the application and sensitivity of the WCD. Since the neutron-capture gamma cascade emitted by gadolinium (Gd) is almost four times higher in energy than that emitted by free protons in water, the addition of Gd to the detector water would allow the detector to realize this expanded capability. This would in turn increase the detector’s sensitivity for neutrinos in the energy region of a few tens of MeV, thus enhancing its physics capabilities in the observations of supernova bursts, and potentially enabling observation of the as-yet-unseen diffuse supernova neutrino background flux. The addition of Gd may also reduce backgrounds for proton decay searches and could potentially provide a handle for discerning neutrino flavor, but these ideas are not yet fully validated.
Without Gd, efficient observation of neutron capture in pure water would require PMT coverage approaching 100%, which is not feasible. The reference design calls for an effective 20% PMT coverage (see Section 3.1), which is insufficient to detect neutron capture in Gd-loaded water with adequate efficiency. A PMT coverage at least double that amount would be necessary to achieve the enhanced physics capability of the WCD that would be made possible by the addition of a Gd compound.
The reference design preserves the option to add Gd in the future. As such, the design choices that enable it have been discussed throughout this volume as they apply to the individual reference design systems and components.
In this section we address the motivation, strategy, and additional requirements that apply to the eventual implementation of a gadolinium option.
9.1.1 Enhanced neutron capture
In a pure water detector, an entering neutron first must scatter and thermalize. After thermalizing, it is captured by a free proton in the water, emitting a 2.2 MeV gamma; this is typically well below the trigger and analysis thresholds. The neutron-capture gamma cascade emitted by Gd, on the other hand, is significantly higher, with a total energy of 8.0 MeV. The neutron-capture cross section for Gd is very high. Whereas it is possible to increase the photon-collection efficiency for 2.2 MeV gammas by simply instrumenting the detector with more PMTs, this becomes prohibitively expensive.
Enriching the water in the detector with dissolved gadolinium would reduce the need for phototubes, push the signal up out of a region of high radioactive background, and greatly enhance neutron capture at a relatively low cost. We would add Gd in the form of a gadolinium compound, such as gadolinium sulfate or gadolinium chloride, the former being preferred owing to better material compatibility.
The gadolinium concentration inside the detector volume will affect the neutron-detection efficiency, although the dependency on the concentration is weak. By calculating the total neutron-capture cross section on gadolinium and free protons in the water (an average cross section of 48,900 b as compared to 0.86 b for pure water), and weighting by the concentration, we estimate that 0.1% gadolinium would be sufficient to generate a physical-capture fraction of 90% with a mean lifetime of around 30 s (as compared to around 200 s in pure water). Thus the combination of increased photon energy and reduced background due to shorter capture time makes gadolinium an excellent dopant.
The actual detected neutron-capture fraction may be somewhat lower than stated above due to inefficiencies in the trigger at low energy. Concentration uncertainties, on the other hand, have minimal effect on the efficiency. We estimate that a 10% uncertainty in the concentration will only affect the capture efficiency by approximately 1–2%. Since it is the capture efficiency that actually affects the physics, an uncertainty in this range is comparable with that expected from the statistical fluctuations in a supernova signal (1%) and is therefore acceptable.
Table 9–1 lists the stable isotopes of gadolinium and their thermal-neutron-capture cross sections and Q-values (the kinetic energy released in the decay of the particle at rest).
| Gd isotope | abundance (%) | cross section (b) | Q-value (MeV) |
|---|---|---|---|
| 152 | 0.20 | 735 | 6.247 |
| 154 | 2.18 | 85.0 | 6.435 |
| 155 | 14.80 | 60900 | 8.536 |
| 156 | 20.47 | 1.5 | 6.360 |
| 157 | 15.65 | 254000 | 7.937 |
| 158 | 24.84 | 2.2 | 5.943 |
| 160 | 21.86 | 0.77 | 5.635 |
| average | 100.00 | 48769 | 8.048 |
In many cases, it is not necessary to actually trigger on the neutron capture, but only detect it as a “delayed” event following an initial “prompt” event. This means that detection efficiency can be high even in a detector that is not designed for ultra-low background operation. This double-coincidence technique is routinely exploited by reactor-neutrino and stopped-pion-beam neutrino experiments. This is an important point, since even though 8 MeV of energy is typically released in a neutron capture on gadolinium (see Table 9–1), some of this energy will be in the form of sub-Cherenkov threshold electrons, and hence not be visible in a water detector. Figure 9–1 shows the visible energy distribution expected in a 200-kTon WCD from 5-MeV electrons and from neutron capture in water doped with 0.1% gadolinium concentration and 12% photomultiplier tube coverage.
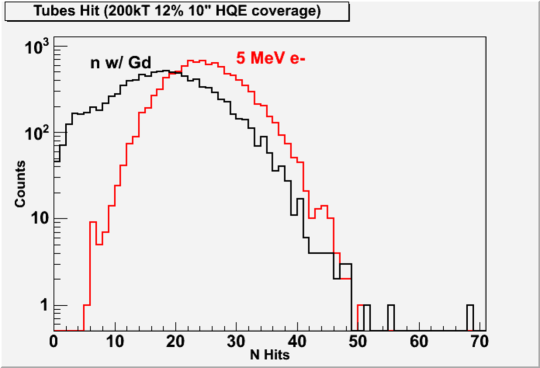
On average, only 4.5 MeV of the 8 MeV are detectable, with significant fluctuation above and below the mean. This is consistent with data from tests in Super–Kamiokande [64].
The trigger strategy involves triggering off the high-energy prompt event and temporarily reducing the detector energy threshold in software and/or hardware to look for the lower-energy, delayed capture event.
Backgrounds to the detection of the capture include (1) photomultiplier dark noise, (2) radioactivity from dissolved radon originating from U/Th decays in detector components, notably photomultiplier tube glass, (3) gamma rays directly from U/Th/K decays in detector components, and (4) gammas rays entering the detector from the outside. At the depth of the WCD and with the short capture times needed (0.1 ms), cosmic-ray muons are not a significant source of background for this process. Vertex resolution on the prompt event will be important for determining the timing and spatial cuts to reject such backgrounds. Much of this background reduction will be designed into the detector from the beginning, since it affects such diverse aspects of the detector as the selection of photomultiplier tube glass and the design of the deck to keep out the underground radon-laden air (Section 2.4.3). The Gadolinium-loaded water option has been simulated for low-energy detector performance studies (Section 7.3).
9.1.2 Design Considerations
To preserve the option to add Gd to the WCD, the following principal items are already included in the reference design:
The eventual implementation of the Gd option imposes the following additional requirements:
-
The design must ensure sufficient energy response in the region from 3–6 MeV to allow the detector to identify the Gd-capture events. This will require higher PMT coverage than in the reference design.
-
It is important to minimize random, non-gadolinium-capture coincidences from background events and dark noise. PMT coverage plays a crucial role in minimizing the statistical fluctuations of lower energy backgrounds into the capture energy range. For example, fluctuations in the number of photons collected from radioactive decays in PMT glass could surpass the threshold for identification of a neutron capture often enough to affect the ability of the detector to reliably detect actual interactions.
-
Because the Gd compound used must maintain a benign environment for the detector components it comes into contact with and also discourage biological growth, additional materials testing of these components may be necessary.
-
To maintain the light attenuation length at 100 m (within 5–10%), we require a water purification system capable of removing the impurities while maintaining the gadolinium concentration at 0.1%. This may impose enhanced cleanliness requirements and material screening.
-
While there is no established EPA requirement for disposal of Gd, regulations concerning the release of sulfates must be considered. Although the concentration is very small (0.1%), it is nonetheless desirable to discharge as little of the Gd into the environment as possible. Consequently, the requirements on vessel leakage may need to be more stringent.
-
The gadolinium concentration in the detector will need to be monitored throughout the lifetime of the experiment.
-
Enhanced radon control and monitoring may be necessary if, for example, it turns out that radon penetrates through the vessel liner at a rate higher than in Super–Kamiokande and becomes a more prominent background.
9.1.3 PMT Coverage
Simulation work is now underway to determine the required PMT coverage. It should be noted that the detector need not actually trigger on the (delayed) neutron capture (which deposits 4.5 MeV of visible energy in the mean), since in the case of supernovae, proton decay, and atmospheric neutrinos the prompt event is of higher energy—well above the expected threshold of 6 MeV with 20% photomultiplier tube coverage. Thus, in practice, one triggers on the prompt event then lowers the threshold temporarily for 100 s to look for a delayed capture. A coverage similar to Super–Kamiokande of 40% for which actual data has been taken with a balloon of gadolinium-loaded water and a neutron source, provides the upper limit on the required coverage.
9.1.4 Gadolinium-Capable Water System
We anticipate that addition of gadolinium would take place underground, and thus no changes are anticipated in the fill part of the water system (see Section 6.2). Several extra features are required, however, for the recirculation system:
-
Gadolinium addition to the water
-
Gadolinium removal from the water (for tank draining)
-
Water-leakage collection and disposal (to minimize discharge of Gd into the environment)
-
Gadolinium-compatible water cleaning
9.1.4.1 Gadolinium-Addition System
Gadolinium sulfate must be cleaned before it can be used in the detector. Cleaning it involves dissolving the chemical in pure water then circulating it through a staged set of filters (typically 5 m followed by 0.2 m) and UV sterilization units to remove dust, grit, and bacterial contamination. About 20 kTon of water will be needed to completely dissolve and clean the 600 tons of gadolinium sulfate needed to bring the dissolved Gd level to 0.1%. It is envisioned that this will be done in a 200-ton mixing tank (about 6 m in radius and 6 m high) in roughly 100 batches, and will require about three months to complete. The location of the mixing tank is not yet determined.
9.1.4.2 Gadolinium-Removal System
When it becomes necessary to drain the tank, we plan to concentrate the Gd into a small stream to send to the surface for recovery. It is desirable to recover the Gd for possible reuse, and also to minimize the amount discharged to the environment. Treatment will consist of elevating the pH until the Gd drops out of solution, and then filtering out the precipitate. To maintain the Gd concentration, the system will have to remove the Gd before the purifier and then re-dissolve the Gd into the water after purification.
9.1.4.3 Water-Leakage Collection and Disposal System
While there are no EPA requirements on Gd discharge, we prefer to take a conservative approach and discharge as little Gd into the environment as possible. We are designing a small, separate water treatment system to remove Gd from leakage sumps before transfer of the water to the underground waste system.
The sump system discussed in Section 6.5, must be Gd-capable from the start since it could not be easily added at a later time. Actual addition of gadolinium will require us to install a small water-purification system in the drain-pump system for this sump. The capacity for this system must be matched to the leakage rate, which can be measured before gadolinium addition.
9.1.4.4 Gadolinium-Compatible Water-Cleaning System
To remove impurities from the water while maintaining the Gd concentration, we are developing a water “band-pass filter”—a system capable of selectively filtering the water to keep the Gd while removing the impurities. To this end, a scaled-down version of a functional water-purification system has been built at UC Irvine that has been used to test new water-filtration technologies (e.g., nanofiltration). Figure 9–2 shows a block diagram of the basic system layout.
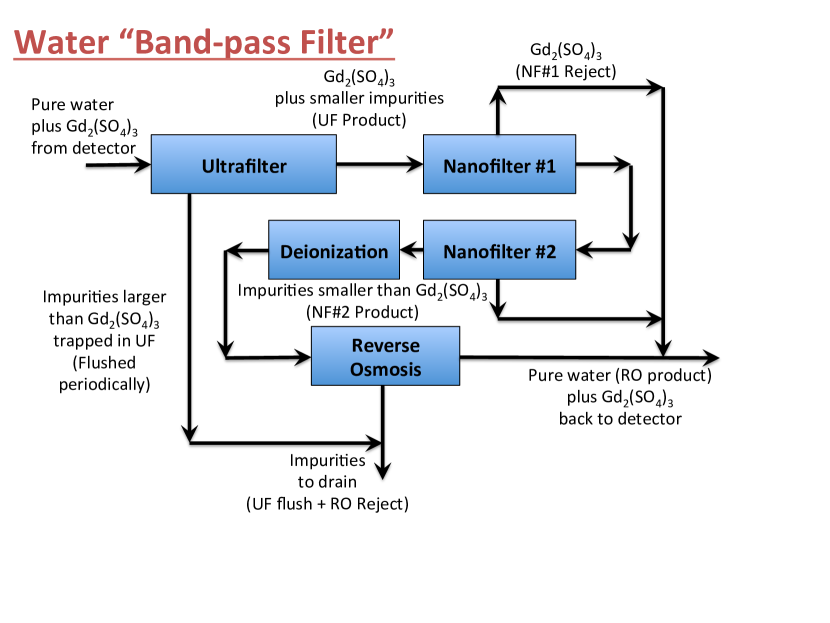
This system has been shown to work in principle: chemical analysis has shown that that a particular two-stage nanofilter separates all gadolinium and sulfate ions from a main water stream to allow deionization of the stream. Currently, work is ongoing to optimize this process by varying filter-pore sizes to maximize Gd removal while minimizing the transmission of impurities.
The current design calls for the WCD recirculation pumps to pump the water to the underground water-recirculation system that would increase the concentration of Gd in the stream by about a factor of three. This 1200-gpm recirculation stream would thus be split into an 800-gpm clean-water stream to be sent to Sanford Laboratory’s Underground Ground Waste Water Dump and a 400-gpm Gd stream to be sent to the surface for treatment. We would use the same pipe in the shaft as that used for delivering the water from the surface fill system.
9.1.5 Monitoring (WBS 1.4.5.6)
Eddies and regions of low flow within the detector may generate variations in the Gd concentration. We will need to monitor the gadolinium-capture efficiency at regular intervals in time and space. This section outlines the calibration group’s responsibilities and plans for monitoring the Gd concentration throughout the detector volume over the lifetime of the experiment.
9.1.5.1 Neutron Sources
Neutron sources will allow us to monitor and calibrate the neutron-capture efficiency of the detector. We may also be able to use naturally occurring neutrons via muon spallation.
To place the neutron sources for measurements, the reference design includes a grid of source hatches built into the deck, spaced every 8 m or so along the and axes. This should be sufficient to generate a grid of approximately 50 potential locations within the tank where measurements can be made to estimate the variation in Gd concentration. To cover the grid points, we will have one or more high-intensity sources that are physically small and easy to deploy.
Three devices are envisioned: a tagged americium beryllium (Am-Be) source, a californium (252Cf) source, and a deuterium tritium (DT) source. The concept is to employ methods that are each affected by an orthogonal set of systematic effects, advantages and disadvantages, so that results can be compared and cross checked with simulations to gain as full an understanding as possible of the one common element in each case (the neutron-capture efficiency). To understand and account for the associated systematics, Monte Carlo simulations will be needed to model each of the sources.
9.1.5.2 Positioning and Space Requirements for Calibration
Due to the potential for gadolinium-concentration variations from place to place within the detector and over time, the same capability for source placement will be required as for the energy calibration (see Section 5.4). Wherever possible, access holes will be placed over the deck at the top of the detector, allowing for a number of set positions in and . The coordinate will be selectable with a suitable cable/line length. Obviously, the greatest possible number and spacing of calibration ports over the deck will allow the greatest possible and position freedom, however the placement of other systems on the deck, such as electronics huts, cranes, cable trays, and so on, will have to be planned in advance in consultation with the calibration group. Some sources (such as the DT generator) will require more room around and above the calibration port.
9.1.5.3 Safety Considerations
The most important safety consideration of the gadolinium-monitoring group will be the use of radioactive sources. Like all federally operated national laboratories in the U.S., the Sanford lab in South Dakota will operate under a set of rules, procedures, and controls for the handling of radioactive materials. The LBNE experiment, as a user of the facility, will need to fulfill all the requirements of the laboratory.
DT-Generator Safety Considerations
A DT generator is capable of releasing an enormous flux of fast neutrons. The Super–Kamiokande DT generator system employs a simple sonic based water detector attached to the cable above the unit. A safety interlock, which cuts power to the device until it is under water, must be employed to guard against an accidental trigger. Fully trained calibration experts will be the only people permitted in the detector dome during the DT calibration. All personnel associated with the deployment of this source will need to carry radiation monitors at all times.
Safety for Sealed Neutron Sources (AmBe and 252Cf)
The DOE has defined a set of thresholds that apply to the classification of radioactive sources. In both cases (AmBe and 252Cf), a class III source should be sufficient for calibration purposes. Calibration workers, carrying radiation monitors, would be fully trained in the use of sealed sources. All sources must be protected with at least two independently leak-tested seals to protect both the sources and the detector. Assuming the height of the vessel will be approximately 80 m, the pressure at the base of the tank will be nearly 8 atm. All deployment containers will have to be pressure tested to this level plus an as-yet-undefined safety margin.
9.2 Large-Area Picosecond Photo-Detectors
A consortium of public and private researchers and engineers is developing large-area, high-resolution microchannel plates (MCP) as a cost-effective alternative to photomultiplier tubes. This consortium, called the Large-Area Picosecond Photo-Detector (LAPPD) Project[65, 66], is mainly funded under the DOE OHEP Detector R&D (KA15) program.
The LAPPD improvements are mainly in the area of plate fabrication. Conventional MCPs are made by drawing and slicing glass tubes, followed by chemical etching and heating in a hydrogen environment. Since glass forms the resistive and photoactive material in addition to being the substrate for the pores, tight control of this process is needed and it is relatively long and expensive. The LAPPD approach is to separate the functions of pore substrate and electron emission and amplification using modern condensed matter techniques, such as self-organizing microtube structures and atomic layer deposition (ALD). It is hoped that industrialization of these processes can be achieved at a much lower cost than for the conventional technique. In addition, significant work is ongoing into the study of large-area photocathode production and enhancement to reach higher quantum efficiency than what is typically available in standard photomultipliers.
The characteristics of this type of photodetector have the potential of enhancing the physics capabilities of a large water Cherenkov detector such as that considered for LBNE. Among the improvements that these photodetectors might be able to provide are the following:
-
1.
Fast timing (in the range of 30–100 ps rather than the 2 ns typical for large PMTs).
-
2.
High spatial resolution (1 cm versus 25–50 cm typical of standard PMTs).
-
3.
Smaller magnetic field effects. No magnetic compensation system would be necessary.
-
4.
Potentially higher pressure resistance. The much smaller volume means less implosive energy, so anti-implosion devices would most likely not be needed.
-
5.
Flat-panel form factor devices have a more uniform outer physical envelope than a PMT with less intrusion into the detector active volume.
With a potential smaller cost per unit area, this technology could make possible the instrumentation of a larger surface area of the detector, using large-area planar MCPs with 100 ps resolution. This time resolution is an order of magnitude better than the current PMT technology and translates into a resolution of a few cm in . In addition, thanks to the multiplicity of channels in the plate (granularity), it has the potential to achieve 1-cm - resolution. Such improvements could enhance significantly the background suppression in an electron neutrino appearance measurement and, consequently, the physics capabilities for water Cherenkov detectors. Large collection areas would also help with vertex resolution for low-energy physics.
Demonstrating these capabilities requires a detailed simulation and reconstruction development effort in collaboration with the LAPPD project. Such effort has already been initiated by Mayly Sanchez through a NSF CAREER award. This effort will assess the improvement in tracking and particle ID that MCP detectors could achieve. Due to the natural limits on the timing and spatial resolution imposed by the chromatic dispersion and scattering of Cherenkov light in water, a fairly detailed study is required in order to give a reliable answer to these questions and to understand the advantages this technology would offer over PMTs. Preliminary studies show that a combined improvement of photodetector coverage (for reduced uncertainty in the rise time) and faster timing (to better sample the rise time) opens the door to a more extensive use of timing information in water Cherenkov detectors[67]. The study requires a complete set of analysis tools, including ring-counting and vertex-fitting algorithms. In addition to these algorithms, we must check in detail to what extent the chromatic dispersion and scattering can be mitigated in the high-light-level environment of beam-induced neutrino interactions. These studies have never been done to this level before. In carrying out these studies we will be able to provide specific feedback to the LAPPD collaboration into the baseline design of these devices by defining and optimizing the specifications that would result in prototype modules useful to the LBNE water Cherenkov detector.
Both the production schedule and the commercialization of these devices are potential roadblocks for implementing MCPs for LBNE. Currently, no LBNE-specific prototype of such a large-area photodetector exists nor is there a precise cost estimate available. We hope that LAPPD will achieve this level of development in the next few years. Given the potential of this technology in advancing the physics capabilities of LBNE, the collaboration plans to continue to support the studies described and maintain our close ties with the LAPPD development and keep up-to-date on their schedule and progress.
10 Current Alternatives
Engineering a system as complex as the Water Cherenkov Detector and optimizing the costs versus benefits requires testing conceptual designs for functional efficacy and examining the total costs of each proposed solution. New ideas are introduced, discussed, and rejected. Alternatives analysis generates a few worthy concepts that are selected for further evaluation. As the evaluation of a selected concept or “reference design” proceeds, the strengths and weakness become more apparent. In some instances alternatives present a mitigation to a known risk, in other instances alternatives could reduce the detector cost. We expect that as we study the reference designs, there will be opportunities to once again choose between a particular reference design and various alternates.
For some of the subsystems there may be more than one way to satisfy the experimental requirements. At the present time there are potential alternative solutions that are still viable. These alternates have cost benefit ratios that are too close to decide which one is superior at this point. Some alternatives deemed too expensive or not technically feasible do not survive. In most cases, alternatives do not change the scope of physics. Regardless of the evaluation outcome for any specific concept, the possibility of merging the best qualities of various ideas is part of the creative process. For this reason the discussion of alternatives is an important part of the Water Cherenkov Detector development.
This chapter discusses alternatives to the WCD reference design that are still under consideration for three systems.
-
Free-standing PIU design to replace the PMT cable deployment design described in Chapter 2
-
Concrete vessel formed against the cavity shotcrete to replace the liner mounted directly on cavity floor and walls described in Chapter 2
-
A thin muon veto to be added if it is necessary to the experimental physics performance
In addition to these alternatives, in Chapter 9 we consider two options for enhancing the scientific reach that we may want to pursue at some later point.
10.1 Alternate PIU Plan
The reference design is for cable deployment of PMT Assemblies (PAs) from the deck and attached to a ring truss on the floor. The cable deployed PAs may require auxiliary support against the vessel wall to prevent movement. These supports may require drilling a hole into the vessel wall and securing the support using an adhesive. In addition, the penetration of the vessel wall must be sealed to prevent water contamination crossing the boundary. Each penetration requires mechanical components, drilling, attaching, sealing, and testing operations. The sum of costs in time, money and risk of leaks warrants our continuing to evaluate alternate ideas that may eliminate or reduce the number of required penetrations. The following paragraphs will describe an alternative regarding the specifics of how PMT Assemblies will be deployed in the detector.
A possible approach is to build a nearly free standing matrix of welded stainless steel components. The matrix would be constructed with attachment components at the floor of the vessel, followed by bolting together frames ascending the wall. Penetrations in the vessel wall are required, however only a small number, perhaps less than thirty, may be needed to stabilize the assembly against the rock. While adding a minimal number of penetrations, such a structure would eliminate the requirement for a smooth vessel wall. The structure would provide regular attachment points for the PIU on the inside cylindrical surface of the matrix.
This concept is shown in Fig. 10–1.

The figure shows a portion of this structure for the wall with some PIUs shown in the bottom half. The vertical members are made from tubular stainless steel with endplates that allows them to be stacked in a modular fashion. Braces and other components are also modular. The mass of the entire structure is about 365,000 kg. The increased mass and cost of this structure would be offset by simplifications to the vessel design. This design has the benefit that it will not require approximately 5000 penetrations of the vessel wall.
10.2 Alternate Vessel Design
The alternative vessel concept is a cast-in-place concrete vessel integrated with the rock. Studies to be performed in the mitigation plan of LBNE Risk WCD-019[68] will assist in determining the required vessel wall smoothness and waviness to meet a maximum leak rate requirement. If the reference design liner on shotcrete cannot meet the requirement then the smoothing shotcrete shown in Figure 2–6 is replaced with a cast-in-place smooth-surface concrete vessel.
10.3 Thin Muon Veto and Muon Telescope
By instrumenting the vessel space between the PMTs and the wall with additional, smaller PMTs, that space can be utilized as a muon veto detector. On the beam side of the WCD, the system will detect and veto muons that originate in the rock and enter the WCD (Fig. 10–2).
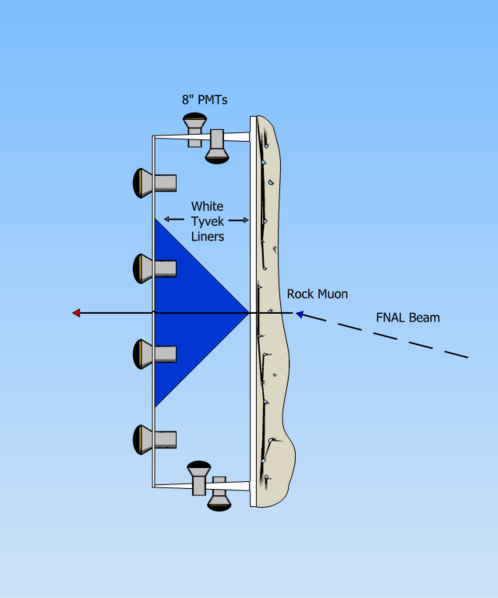
On the far side, the veto will detect and veto muons that originate in the water and exit the WCD, which would help to reduce the systematic error in the analysis. The veto system can also serve as the muon telescope discussed in Section 5.4.
If the addition of a thin (0.5–0.8 m) veto region behind the large PMTs allows the fiducial cut region in front of the PMTs to be reduced from 2 m to 1 m, the fiducial volume of the WCD would be increased by 8% for the same cavern size. Alternatively, there could be a cost savings from a reduced cavern size and number of large PMTs for the same fiducial volume. The smaller (e.g., 8-in) PMTs for the veto system might be obtained from an existing experiment, allowing its advantages to be obtained at low cost.
11 Value Engineering
In this chapter we provide an overview of the major alternative designs and technologies that we considered, and decided not to incorporate into the reference design, for systems or components within the WCD subproject. A more in-depth discussion of these can be found in the Chapter 10. Alternative designs at the LBNE Project level are discussed in the LBNE Alternatives Analysis[69].
11.1 Number of Caverns
Through the WCD conceptual design during 2010, size limitations of a single large cavity competed with the LBNE science goals for a minimum WCD fiducial mass of 200-kTon of water; therefore, we had to consider multiple caverns, in particular, two 100-kTon caverns. Preliminary geotechnical evaluations by the panel of experts of the Large Cavity Advisory Board (LCAB) set the limitation of the cavity cylindrical diameter at 55 m. The only way to achieve a single 200-kTon WCD with this limitation would have been to make the cavern deeper. But, a deeper WCD would have meant considerably higher pressure on the detector’s PMTs. Under these circumstances, two 100-kTon detectors was the rational option. Cost considerations forced the WCD Subproject to plan for only one 100-kTon detector at the end of 2010.
By early 2011, LCAB had received enough geotechnical data from coring samples and new excavation work performed in the DUSEL Davis Campus for Early Science that a new analysis of the cavity size could be made. The results of the new analysis determined that a cavern span of 65 m was safely achievable. The WCD Subproject evaluated the depth, and therefore PMT pressure rating, required to construct a 200-kTon WCD within this diameter and found this design to be within these engineering parameters.
11.2 Water Containment
The current reference conceptual design of liner on shotcrete has an alternate that remains under consideration, see Section 10.2. The designs under consideration during earlier stages of conceptual design included:
-
1.
A free-standing, self-supporting vessel (not supported on the rock wall),
-
2.
A vessel supported on the rock wall, and
-
3.
A pressure-balanced arrangement with no vessel (the liner is pressure-balanced with water on both sides).
We performed a technical evaluation of the three options in a variety of configurations, as listed in Table 11–1:
| Major concept | ID | Material | Method |
|---|---|---|---|
| Free-Standing Vessel | 1A | Concrete 5000 psi | Cast-in-Place |
| Free-Standing Vessel | 1B | Concrete 7000 psi | Cast-in-Place |
| Free-Standing Vessel | 1C | Concrete 5000 psi | Precast |
| Free-Standing Vessel | 1D | Concrete 7000 psi | Precast |
| Free-Standing Vessel | 1E | Steel ASTM 516 | Welded-in-Place, API 100% |
| Free-Standing Vessel | 1F | Steel ASTM 516 | Welded-in-Place, API 620, spot inspection |
| Free-Standing Vessel | 1G | Steel ASTM 517 | Welded-in-Place, ASME SVIII, Div 2 |
| Vessel Integrated w/Rock | 2A | Concrete 7000 psi | Cast-in-Place, CIP backfill |
| Vessel Integrated w/Rock | 2B | Concrete 7000 psi | Precast w/CIP backfill |
| Vessel Integrated w/Rock | 2C | Polymer | Liner against shotcrete |
| Pressure-Balanced Vessel | 3A | Polymer | Polymer sheet |
| Pressure-Balanced Vessel | 3B | Stainless Steel | Stainless steel sheet |
A down-select meeting for vessel design was held in March 2010 to select one reference design and an alternate, and to determine a clear work plan to CD-1. The meeting was held in a Charrette format, typical of large civil-construction projects, in order to consider input from the entire, highly-experienced team. The resulting ranking, based solely on technical merit and technical risks, emerged in the following order:
-
1.
Free-standing
-
2.
Supported on rock
-
3.
Pressure-balanced
However, the costs for a free-standing vessel are significantly higher than for a rock-supported one, and the following other considerations about this design came to light (two negative and one positive):
-
1.
It requires a cavern approximately 2 m to 4 m larger in diameter; hence extra excavation costs.
-
2.
It does not maximize the fiducial volume diameter for a given cavern diameter, i.e., physics performance is reduced relative to the rock-supported alternative.
-
3.
On the positive side, it may have advantages in terms of PMT supports and operations, and maintenance costs may be lower than for the rock-supported alternative.
The team decided that the higher technical merits of a free-standing vessel do not justify the anticipated higher cost and reduced physics performance. Therefore the final ranking from the 2010 evaluation changed to:
-
Preferred: Supported on rock
-
Alternate: Free-standing
-
Discontinued: Pressure-balanced
In mid-2011 we dropped free-standing as an alternate.
11.3 Photon Detector Technology
The WCD subproject considered both photomultiplier tubes (PMT), the current standard technology used in detectors of this kind, and large-area micro-channel plates (MCP). While MCPs have potential benefits in both performance and cost, the required time to finish their development and initiate production is inconsistent with the LBNE schedule. In 2010 PMTs were chosen as the photon detectors for the WCD reference design. MCPs are still under consideration for the WCD Enhanced Physics Capabilities (see Section 9.2).
PMT technology is quite mature. In Chapter 3 we describe the optical, electronic and mechanical challenges that the LBNE WCD environment and physics requirements will impose on the PMTs, and the methods set up for evaluation and procurement of these devices.
No working prototype of an MCP that would be useable for LBNE currently exists, nor is a precise cost estimate available. We hope that LAPPD (see Section 9.2) will achieve this level of development in the next two to three years. Because these detectors may be potentially very useful for future modules or to upgrade existing ones, the collaboration plans to maintain our close ties with the LAPPD development and keep up-to-date on their schedule and progress.
11.4 PMT Assembly Mounting Scheme
During 2010, the reference design for PMT Assemblies (PA) called for solid frames to be made for sets of six PMTs which would be mounted on the vessel wall. This has now been rejected in favor of a system in which the PAs are suspended from multi-filament stainless steel cables supported at the top and bottom of the detector. This eliminates the need for wall penetrations and access to the wall for mounting. This is the subject of VE proposal VE-WCD-006a[70]. The reference design of cable deployment of PAs itself has an alternate of a free standing PIU structure, see Section 10.1
11.5 In water electronics
A significant alternative to the reference design electronics described in Chapter 4 is to place the bulk of the active electronics under the water, very near the PMTs. Both designs are based generically on the previous, successful designs used at the Super–Kamiokande and SNO detectors. The reference design places the majority of the electronics outside the vessel (all but the PMT Assemblies, described in Chapter 3, are external) whereas the in-water design places the majority of the electronics in the water near the PMTs, as shown in Figure 11–1.
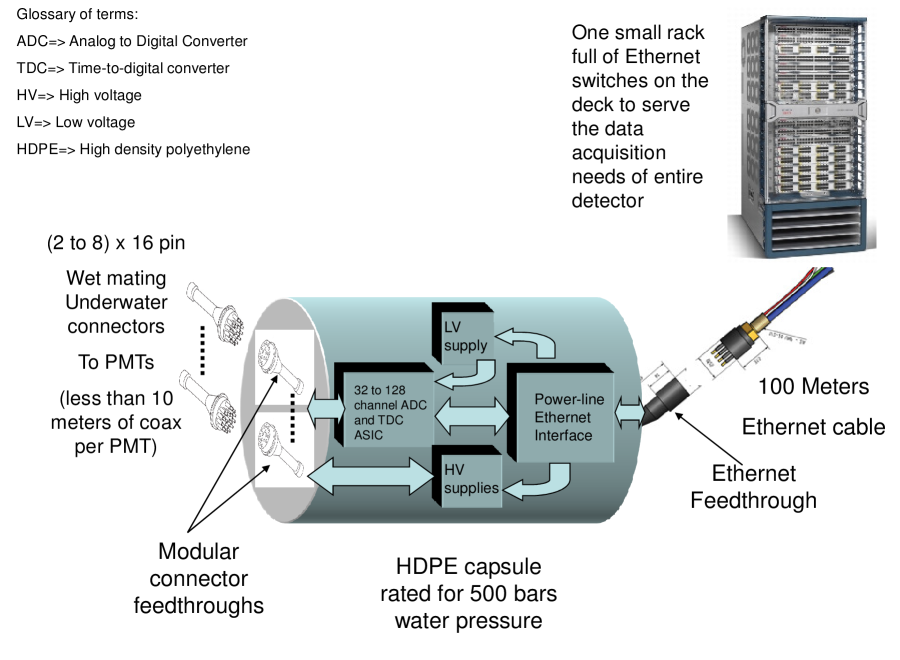
The major advantage of this in-water scheme is that the multiplexing of data, power and control allows many fewer cables between the capsule and the surface compared to the reference design. These connections are all at low voltages and so amenable to a single multi-conductor cable. For instance, concatenating the functions of the High Voltage and Readout Boards described in Chapter 4 into a form factor suitable for an underwater capsule as shown in Figure 11–1 could then reduce the link to the surface to two pairs of Ethernet signals, two pairs of precision clock and synch signals, one or two pairs of hardware trigger signals and one or two pairs of DC power connections — one eight pair, low voltage, multi-conductor cable in place of sixteen High Voltage coaxial cables — a significant reduction in cable volume and cable plant stiffness.
The in-water implementation of this design offers a few advantages over the external configuration. The cables would be shorter, resulting in less cable, simpler cable routes, simpler cable management issues and fewer fire protection issues during construction. The impact of shorter cables is discussed in VE proposal VE-WCD-007[71]. With less cable in the water the materials compatibility issues are reduced. Commercial underwater encapsulation technology used for deep-undersea-oil and natural-gas exploration and communication cables could be used to house these electronics and a number of vendors of such housings, connectors and cables have been identified. These commercial housings and connectors are typically used in much more demanding environments than we face, and so little or no R&D is required for packaging an underwater solution.
Initial investigations into capsules, connectors and cables indicate that the cost differences between the out-of-water and in-water schemes are relatively small. Initial estimates of installation costs for the PMTs and their cables, on the other hand, are quite significant so it is possible that the in-water installation scheme could save money.
A major disadvantage of such a scheme, however, is the loss of access to the underwater part of the electronics for repair, rework or upgrade. In addition, the heat load from the electronics has the possibility to create water-convection currents and potentially degrade the attenuation length.
The in-water electronics alternative, in conjunction with the reference design PMT-mounting scheme, see Section 2.7.1.1, holds out the possibility of significant cost savings in installation labor, time and material.
11.6 Water-Fill System Location
The alternative designs for the Water System differ in their placement of the fill system; above-ground or underground near the detector.
If the supply water is very poor (i.e., untreated) the deionization step in the fill system, discussed in Section 6.2, requires large quantities of caustic chemicals. Therefore, as of 2011 we have chosen for the reference design a configuration that places the fill system in an accessible location above-ground (see Figure 6–1). This not only allows convenient access to the chemicals and resin necessary for the initial fill, but also conserves expensive underground space and reduces the need to discharge waste-process water to the surface.
11.7 Computing Software Framework
We evaluated three initial software framework candidates in 2010 for both online and offline computing, selected based on existing expertise in the group: Gaudi[51], IceTray[49] and RAT[50]. As part of a VE exercise, proponents of each framework presented their cases to the group, and based on this, the group composed tables of metrics. The metrics included support longevity, current community acceptance, flexibility and existing features. This resulted in a rather clear case for Gaudi. IceTray provides a very good second choice but was seen to have a smaller support base and would require additional software modules already included in Gaudi.
11.8 Installation Methods
Several strategies for installation have been explored and evaluated. We plan to continue these studies. Installation planning reviews were held in 2010 and 2011.
During the VE process, we looked at different methods for organizing installation activities. The two most important methods are:
-
Line-leveling is a technique that monitors the flow of work through a multi-stage process. Each stage takes input from a previous stage and outputs to the next stage. If a stage is running too slowly (or too fast) resources have to be adjusted (if possible) to compensate.
-
Just-In-Time delivery methods because they minimize capital outlay.
To best organize the installation activities, we first generated a table of assumptions, portions of which pertain to the integration of the work between the subgroups and Sanford Lab. The assumptions related to the following types of considerations:
-
The number of detectors
-
Availability of the shafts
-
Availability of the major excavation components and schedule
-
Location of a central warehouse for storage and testing prior to installation
-
Power and space requirements
-
Hoist capacity for space and cycle time
-
Deployment of safety systems
-
Pre-testing and certification of components prior to delivery to the Sanford site
The integration systems were organized into subgroups, roughly one per subsystem. As part of the integration effort, each subgroup must analyze key components for maximizing performance while minimizing costs and develop a set of requirements. The requirements must clearly define the interfaces among the subgroups and with Sanford Lab. They must allow neither too little nor too much margin, as either can lead to increased cost. Finally, they must come with a solid, verifiable basis for traceability.
The installation reference design includes a serial configuration for the large components and a parallel one for the smaller systems to the extent possible. We determined that a Just-In-Time strategy would be too risky, and have chosen line-leveling. Slight delays in component delivery to the detector site, for example, could leave a large workforce idle while waiting on parts for installation.
12 Environment, Safety and Health (WBS 1.4.8.4)
WCD safety involves coordination with the LBNE safety committee and the Sanford Laboratory safety organization. Sanford Laboratory has responsibility for safety throughout the local site and establishes requirements and expectations that user facilities, such as WCD, must meet. The WCD safety organization implements those requirements and has direct responsibility for the day-to-day safety of the WCD experiment, and maintains compliance with the LBNE Integrated Environment, Safety, and Health Management Plan[72]. The WCD Safety Officer will serve as a member of the LBNE Safety Committee. The organization and primary responsibilities of the WCD, LBNE and Sanford safety organizations is shown in Figure 12–1.
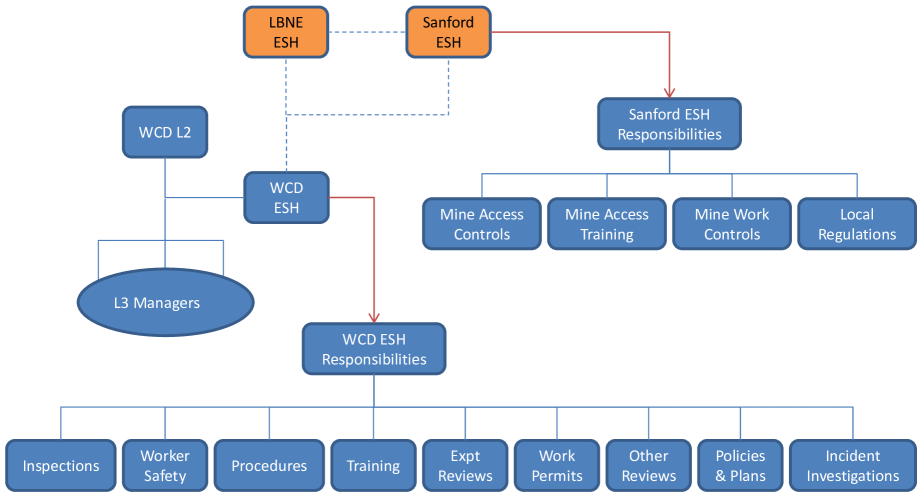
A WCD Safety Committee will be established that includes the WCD Safety Officer, a Local Safety Officer (LSO), who will be stationed at the site, a WCD project engineer, a WCD project scientist, and a representative from the Sanford Laboratory safety organization. The proposed structure of the WCD ESH Committee is shown in Figure 12–2.

Additional experts may be added to the committee or consulted as needed.
The WCD Safety Committee responsibilities include:
-
establishing safety procedures and rules
-
establishing training requirements and courses that are needed to supplement Sanford training requirements
-
to review and approve all planned work, installation and operational procedures, and other activities
-
to represent safety concerns at all engineering and design reviews
-
to conduct incident investigations and report findings to management
-
and to report to Sanford Laboratory and LBNE safety organizations
The LSO will reside at the site and be charged with implementing safety requirements that are established by the WCD, LBNE, and Sanford safety committees. The LSO will oversee working conditions, perform safety inspections, assist in training and maintaining training records, report incidents and injuries to safety management and perform other activities necessary to ensure a safe working environment.
Training courses from Brookhaven National Laboratory (BNL) will be used as the basis for training that is required for WCD, but not available from Sanford. These courses may be modified to reflect local conditions or requirements, as needed.
The WCD must comply with all applicable federal, state and local regulations. To accomplish this, we will implement an Integrated Safety Management System (ISMS) to ensure that all stages of the project, planning, design and physical work are performed with attention to the potential hazards. This system will encourage supervisor and worker interaction, and a shared responsibility for safety among all parties.
Work can begin only after a successful safety review or hazard analysis and approval by the WCD safety committee. WCD will establish formal procedures where necessary to ensure that work is done safely and correctly. The reviews are part of a safety system that includes compliance with OSHA 29 CFR 1910 and 29 CFR 1926 standards. The WCD project is committed to meeting those requirements.
12.1 Hazard Analysis
All work will be reviewed for safety and environmental concerns. These reviews will:
-
Define the scope of the work
-
Identify and analyze the hazards associated with the work
-
Develop and implement hazard controls and assess risks
-
Provide a basis for working within the controls
-
Provide a mechanism for feedback for continual improvement
In addition, engineering reviews and external reviews for tasks or procedures will be performed as warranted. Approval by appropriate supervisors and safety committees is required before work can begin. Workers on an approved project will be required to read and sign the approved safety review or work plan, indicating that they understand the hazards, risks and controls, before they begin work.
All workers and other participants are responsible for safety. They must individually ensure that they and their coworkers understand the tasks, hazards and risks involved, and how to implement controls or utilize existing controls to mitigate these hazards and risks. Controls are applied using the following hierarchy:
-
1.
Elimination or substitution — change the process so that the hazard is removed
-
2.
Engineering controls — use a physical system or barrier to avoid exposure to the hazard
-
3.
Administrative controls — use procedures or rules that reduce the likelihood of the hazard leading to an event
-
4.
Personal Protective Equipment (PPE) — use clothing or devices that reduce the impact of a hazard
Supervisors must seek feedback from workers to improve procedures, controls, and working conditions. All personnel will be given the authority to stop work if and when they perceive an unsafe working condition.
As required by ISMS, the ongoing design, assembly, installation and operation of the WCD will be reviewed on a regular basis to identify any necessary changes or additions to the identified job hazards and the associated mitigation procedures. The reviews will occur at least annually or more frequently if necessitated by changes to the system design and/or operation. Regular walk-throughs of the experimental areas will be included as part of the on-going hazard review.
12.1.1 Identification of Hazards
This section identifies potential hazards, the corresponding safety concerns and the apparatus and/or activities around which or in which these hazards are present. This hazard identification is part of the LBNE Project Preliminary Hazard Analysis Report[73]. Tables 12–1–12–3 list the general hazard categories for the WCD and specific examples. Hazard assessment for the WCD covers the entire experimental program, but is not intended to supersede safety programs at institutions or facilities where work is performed. At a minimum, those institutions are expected to work in compliance with federal, state and local regulations and agencies that apply, as well as any additional WCD-imposed procedures that apply.
| Hazard Type | Hazard | Safety Concerns | Equipment or Activity |
|---|---|---|---|
| Electrical |
Electrical shock
Electrically induced fire Arc flashes |
Electrocution or shock injuries
Burns from electrically induced fire Arc flash injuries |
Photomultipliers (PMTs)
Low-voltage power supplies Energized electrical equipment Magnetic field compensation coils General electrical use |
| Material handling and rigging |
Lifting objects
Falling objects |
Being struck by falling or dropped objects
Muscle injuries from handling heavy objects |
Storage of materials and equipment above ground
Transfer of equipment from surface Transfer of equipment or personnel inside detector vessel Lifting in place at detectors Operation of small rail cars, forklifts |
| Working at heights |
Falls
Dropped objects |
Injuries from falling
Being struck by falling or dropped objects |
Installing PMTs, electronics and cables
Repairing and calibrating detectors |
| Oxygen deficiency | Low oxygen concentration |
Asphyxiation
Injury or death from low oxygen atmosphere |
Gas blanket over pool
Gases emitted from mine Air circulation |
| Pressurized systems |
Low oxygen concentration
Explosion due to overpressure Sudden release of energy |
Asphyxiation
Injury or death from low oxygen atmosphere Muscle and skeletal injuries |
Gas blanket over water volume
Transfer of gas cylinders Water circulation and purification |
| Cryogenic systems |
Low temperature fluids
Low oxygen concentration Explosion due to overpressure Sudden release of energy |
Frostbite to skin
Asphyxiation Injury or death from low oxygen atmosphere Muscle and skeletal injuries |
Gas blanket over pool |
| Water pool | Falling into water |
Drowning
Hypothermia |
Work in proximity of pool
Inspection of tank interior |
| Hazard Type | Hazard | Safety Concerns | Equipment or Activity |
|---|---|---|---|
| Chemical |
Acute and chronic exposure
Toxicity Corrosives Explosions |
Skin and eye injuries
Poisoning due to exposure Long and short term health effects Muscle and skeletal injuries Allergic reactions |
Water-treatment chemicals
Cleaning agents Adhesives Exposure during liner application or installation |
| Radiation |
Radiation exposures
Personnel contamination |
Long term health effects |
Calibration sources
Radiation-generating devices Exposure to radioactive gases (Radon), dust, or minerals |
| Lasers |
Intense laser light
High energy laser beams |
Eye injury
Skin burns |
Calibration and testing of PMTs
Survey equipment |
| Non-ionizing radiation | Radiation with wavelength longer than 100 nm | Heating of body tissues |
UV lamps in water system
Accelerator power supplies |
| Environmental |
Waste handling and disposal
Spills and leakage |
Personnel exposure to toxic wastes
Environmental damage or contamination |
Broken PMTs
Water treatment chemicals Oil/fuel from vehicles, generators |
| Underground events |
Rock fall or fracture or seismic events
Ventilation failure Flooding |
Muscle or skeletal injury or death from falling rocks
Injury or death from low oxygen atmosphere Exposure to toxic or radioactive gases or minerals Drowning in flooded area Claustrophobia |
Occupation of and work in underground spaces |
| Hazard Type | Hazard | Safety Concerns | Equipment or Activity |
|---|---|---|---|
| Welding and cutting |
Flammable welding gases
Fires Explosion |
Burns to personnel
Eye injury Muscle and skeletal injuries |
Assembly of detector
Maintenance and repair |
| Fire and smoke |
Entrapment by fire
Asphyxiation |
Smoke inhalation
Skin burns Injury or death from low oxygen atmosphere |
Liner storage, staging and installation
PMT cable storage, staging and installation General conditions and concerns |
| Stored energy |
Explosion
Arc flash PMT implosion |
Muscle and skeletal injuries
Cuts and abrasions |
Electrical service
Compressed gases Hydraulic systems PMTs |
| Routine work |
Slips, trips and falls
Cuts, lacerations, and abrasions Low overhead clearance Ergonomic conditions Low light levels |
Muscle and skeletal injuries |
General working conditions
DAQ and computer operation and use Office-type work |
| Confined spaces |
Entrapment during emergency or injury
Injury or death from low oxygen atmosphere Chemical exposure due to poor ventilation |
Entrapment, asphyxiation, chemical exposure
Claustrophobia |
Entry into cavern or other excavations |
The construction phases of the experiment will involve some contracted work. Environment, safety, health and quality requirements are specified in contracts from the issuing institution or organization. At a minimum, contractors will be expected to follow contractual obligations, to comply with applicable federal, state and local regulations and agencies, and to follow any WCD-imposed procedures or requirements.
12.1.2 Mitigation of Hazards
Many of the hazards we need to prepare for are those typically found in any scientific laboratory for which controls and mitigation techniques are addressed in their Environment Safety and Health manuals. Other hazards are associated with non-routine activities, such as underground work, that require additional consideration.
Training will be an important component of hazard mitigation. The WCD Safety Committee will be responsible for ensuring that training course are developed when necessary training is not provided by the Sanford facility. All workers will require underground access training, which is expected to be provided by the Sanford facility. Personnel will be assigned other training based on safety-review and work-permit requirements and supervisor input. Training records will be maintained in a project database, or by employing an existing database at one of the collaboration institutions. Each work plan will specify the training requirements, and require a pre-job briefing to confirm that the training is current.
The following section discusses mitigation strategies for the anticipated hazards associated with the WCD, both at the detector location and at collaborating institutions. This is not a complete list, but it serves to illustrate the processes employed to apply hazard identification, hazard mitigation through controls, and personnel protection. All hazards and controls are described and reviewed as part of the work-planning phase of ISMS.
12.2 Identified Hazards and Controls
This section lists the hazard types associated with the WCD and their mitigations.
12.2.1 Electrical Hazards
Electrical hazards exist in the installation, operation, and maintenance of a wide variety of equipment. Most of the work will involve low voltages (50 VDC), where the primary concern is for arc-flash hazards associated with high-current devices. High-voltage, low-current power supplies are used for PMTs; low-voltage DC power supplies are used for preamplifiers and associated electronic modules; low-voltage, high-current power supplies are used for magnetic field compensation coils, DAQ electronics and interfaces such as VME; and typical “household” AC is used for general purposes, including supplying power to the mentioned power supplies, computers and associated equipment, and lighting. Electrical work will be performed in compliance with NFPA 70E.
Controls:
-
All purchased electrical equipment will be rated by a nationally recognized testing laboratory (NRTL), or be verified as equivalent by an appropriate local authority.
-
Lock out tag out (LOTO) will be used to reduce the risk of shock hazards whenever voltages could exceed 50 volts and the worker cannot disconnect or directly control the source of power.
-
Other common low-hazard electrical work will involve high-voltage, low-current (10 mA) devices, for example PMT power supplies. The current limit of these power supplies prevents harmful electrical shock.
-
Work on electrical or electronic devices is done with power off whenever possible. Working “hot” is not allowed for voltages exceeding 120 VAC unless a working-hot permit is completed by the worker and approved by the supervisor. Working hot on line voltages above 208 VAC is allowed only for qualified linemen using Personal Protective Equipment (PPE) required for the work.
-
Electrical terminals will have a physical cover over them wherever accidental contact is a concern.
-
Damaged cords on electrical equipment will be replaced before use.
-
Cables and connectors for high voltage, signals or power will be rated for the intended task.
-
The working environment (e.g., contact with water) will be considered before choosing connectors, housings, and cables.
-
AC power cables will kept separate from PMT cables, and from other utilities when placed in cable trays.
-
All cabling must meet specifications for the environment, e.g., in or near ultra-pure water, in which it will be used or installed. Cabling and any associated fire suppression systems must be approved by project engineering and fire safety reviews.
-
Electrical safety training will be required for any work with exposed electrical components.
-
Final installation of electrical service will include testing and certification of the safety ground to prevent against shock hazards due to poor grounding. The grounding and power supply safety for the magnetic field compensation coils must also be tested and verified before installation.
12.2.2 Material Handling and Rigging Hazards
Lifting and material-handling equipment, which includes elevators, hoists, cranes, forklifts, and so on, are used to move or place items too large to be safely handled manually. This hazard is present when unloading large, purchased equipment, transporting it, and installing elements of the experiment. Operations both above-ground and underground are subject to this hazard. Material handling and rigging work will be in compliance with OSHA 29 CFR 1910 Subpart N.
Controls:
-
Operators of hoisting or rigging equipment, including forklifts, must be trained and authorized to use this equipment.
-
All material-handling equipment will be inspected annually, and lifting attachments, such as slings, will be inspected for any wear or damage before each use.
-
All personnel in the area must wear hard hats and safety shoes when a lift is performed.
-
Procedures for lifts of critical equipment will be reviewed and approved by project engineers prior to the work.
12.2.3 Working at Heights
Assembly of detector tanks and installation of detector components will require working at heights in excess of four feet, and possibly scaffolds exceeding six feet. This may include work on platforms and using a human-occupied gondola or mast climber. All work at heights will be in compliance with the OSHA fall protection standard, 29 CFR 1926.500.
Controls:
-
As their jobs call for it, workers’ training will include working at heights. They will also receive any medical evaluation to meet worker qualification requirements.
-
OSHA-compliant railings and fall-suppression equipment will be used where required.
-
We will inspect fall-protection equipment for wear and other maintenance issues before each use.
-
All personnel in the vicinity will wear hard hats when performing work at heights above six feet.
12.2.4 Oxygen Deficiency Hazards
Ventilation failure or escape of nitrogen from the detector gas blanket into an occupied space could cause low-oxygen conditions. Once the overall parameters of the system are established, an analysis will be performed to determine the level of hazard, if any, that exists. An alternate system would use radon-free air in the gas blanket instead of an inert gas and would not present an Oxygen Deficiency Hazard (ODH) condition, but the presence of oxygen may negatively impact water quality. Hazards will be analyzed and work performed in compliance with OSHA 29 CFR 1910.134.
Controls:
-
Oxygen-level sensors will be installed if the ODH calculations indicate they are warranted, and emergency plans will include response to ventilation failure and ODH alarms.
-
Personnel will be trained to properly respond to ODH and other emergencies, and to follow established evacuation procedures. Personnel training requirements will include those for work in ODH areas.
-
Oxygen sensors, if utilized, will be tested, calibrated and maintained on a regular schedule.
-
The blanket volume is expected to be 2300–4800 m3 and separated from the occupied deck by a gas barrier. The volume above the deck is expected to be more than 3000 m3 larger than the gas blanket volume. Leaks from the gas blanket would not likely exceed the gas flow rate, which further reduces the potential asphyxiation hazard.
12.2.5 Pressurized Systems
Pressurized systems include compressed-gas cylinders, pressurized water, hydraulic systems, and reverse-osmosis purification systems. Compressed gases are used in the nitrogen gas blanket and for other activities such as soldering and welding. Other pressurized systems include water circulation and purification. Work with pressurized systems will be in compliance with 10 CFR 851.
Controls:
-
Compressed-gas and hydraulic systems will use components rated for the intended application and operating range. Any custom components will be tested to 150% of the rated pressure.
-
Cylinders will be fixed to stationary objects; regulators rated for the gases used and pressures required will be installed.
-
Pressure relief devices will be installed in pressurized lines and chambers.
-
Backflow prevention valves will be used if there are mixed gas systems in use.
-
Personnel who use and transport gas cylinders will complete a safety training course for this task.
-
Pressurized water systems, including reverse osmosis purification systems will be equipped with pressure relief and backflow prevention valves.
-
Personnel who operate the water system will be trained and authorized.
-
Pressurized systems will be inspected on a regular basis, at least annually.
12.2.6 Cryogenic Systems
Cryogenic systems may be used as a source of dry nitrogen for the gas blanket, and for other purposes, such as to cool detectors used for calibration or analysis. They will be located above or underground, as required for their application. Work with cryogenic systems will be in compliance with 10 CFR 851.
Controls:
-
Cryogenic storage and piping systems will be constructed of materials rated for cryogenic use and equipped with proper pressure relief valves to prevent bursting and uncontrolled venting of cold gases.
-
Cryogenic systems, whether located above or underground, require review and approval before installation and operation.
-
Persons handling dewars will wear appropriate PPE and use approved carts to move dewars.
-
Personnel will be trained in the proper handling of cryogenic liquids, dewars and material handling equipment.
-
Analysis of the planned storage and use of cryogens may indicate a need for oxygen monitors, ODH training, or other mitigation strategies.
12.2.7 Water Pool
After the PMTs are installed and the tank filled with water, no nonessential entries into the water tank will be allowed. Any access will require an extensive safety review. However, it is possible that a worker may fall into the water during work on the deck structure. In this case, the worker could drown or suffer from hypothermia, since the water will be maintained at 13C. Work requiring entry into, or possibly falling into the water vessel will follow the relevant OSHA 29 CFR 1918.105 requirements.
Controls:
-
The deck structure will be designed to reduce the likelihood of falling into the tank during normal work. In the event that work requires spaces open to the water, the specific circumstances and work to be performed will be evaluated and, when necessary, fall prevention devices will be used, water rescue devices will be available, and a two-person rule will be imposed.
-
A training course on techniques for water rescue will be developed.
12.2.8 Chemical Hazards
Most chemical use will involve cleaning and degreasing agents, such as alcohol, glues, epoxies and other bonding agents, and water treatment chemicals. If a spray-on liner material is used, that will also present a chemical exposure hazard to workers who are applying the liner material, and to other workers who may be exposed to vapors during the curing period. Potential hazards include eye injuries, skin injuries, skin sensitization, inhalation, and ingestion of toxic chemicals. Gadolinium sulfate may be added to the water to enable the detector to observe neutrons with high efficiency. For this purpose, a 0.1% gadolinium solution would be maintained, requiring about 200 tons of gadolinium sulfate per 100 kTon tank. Except for water treatment, which includes gadolinium sulfate, and chemicals for applying the vessel liner, chemicals will be used in bench-top quantities that are easily handled by a single person. Chemical work will comply with the relevant OSHA 29 CFR 1910 Subpart Z requirements.
Controls:
-
The Material Safety Data Sheet (MSDS) for each chemical in use will be available to all workers, either in printed form or via an electronic database.
-
A chemical inventory will be maintained; chemicals will be entered into the inventory when received, and removed when the container is emptied or discarded.
-
All personnel using chemicals will be trained to understand the hazards of the chemicals they use. Personnel involved in water treatment will receive job-specific training that will include chemical hazard awareness.
-
All personnel working with chemicals will use the proper PPE, including protective eyewear, clothing, and gloves appropriate to the chemical(s) in use.
-
The gadolinium content of water will require monitoring at sumps for each tank location and the underground facility pump-out station to maintain effluent concentrations in compliance with environmental regulations.
-
A monitoring plan will be developed to assess leak rates and, if possible and necessary, reclaim water loss.
-
If the vessel liner is a spray-on application, those chemicals could represent an exposure hazard. Exposures will be controlled by supplying sufficient ventilation, limiting work time, use of filtering or air supplied respirators, or a combination of these mitigating controls.
12.2.9 Radiation Hazards
Personnel will be exposed to radiation from radioactive sources or radiation-generating devices during detector calibrations, and from exposure to radon from the rock in the detector excavation. Another risk from use of radioactive sources includes contamination to personnel and equipment due to failure of a source containment. The use of certain radiation-generating devices, for example a neutron generator, could cause activation of materials and exposure of personnel from the primary beam and/or activated materials. Work with radiological materials or radiation generating devices will be in compliance with 10 CFR 835. ALARA (As-Low-As Reasonably Achievable) principles will be followed in planning and reviewing radiological work. ALARA requires that workers and line management understand radiological hazards, are properly trained, incorporate steps in their work planning to minimize radiological risks, and are accountable for radiological performance and compliance.
Controls:
-
An inventory of radioactive sources will be maintained and verified annually.
-
Radioactive sources will be stored in a locked cabinet and away from public access.
-
Personnel using radioactive sources will be trained to understand the hazards involved and proper handling techniques.
-
Radiation monitoring devices will be used (e.g., TLDs) if required.
-
If a source needs to be put into the detector water, it will be checked for leakage before and after use to check for possible contamination of the water.
-
Operators of radiation generating devices will be trained on the proper operation of each device.
-
Radiation-producing devices will be stored and operated in such a manner as to preclude measurable radiation exposure above background levels in public areas, e.g. neighboring access drifts to adjacent experiments.
-
Operation, maintenance, and interlock testing logs will be maintained for radiation-generating devices, if the level of radiation warrants such controls.
-
Exposure to radon will be controlled by the ventilation system.
12.2.10 Laser Hazards
Lasers may be used to test and calibrate PMTs, in survey instruments, and other applications. For calibration, the laser output will be connected to a fiber or diffuser ball that distributes the light to the PMTs being tested. Survey instruments use low-hazard lasers. Laser light may also be distributed over a large region inside the water vessel. The laser class and output power will be determined by the specific requirements of the PMTs and light-distribution system. Use of lasers will comply with ANSI Z 136.1 Safe Use of Lasers.
Controls:
-
The lasers will be evaluated by a laser safety officer to determine if specific written operating procedures or interlocks are required (class 3B and 4), and what protective eyewear is required.
-
Areas where lasers are in use will be posted with warning signs .
-
Personnel operating lasers will have training in safe operation and use of the system, and use appropriate protective eyewear and other PPE.
-
Personnel operating class 3B and 4 lasers will have laser medical eye examinations prior to use of such lasers.
12.2.11 Non-ionizing Radiation Hazards
Non-ionizing radiation includes exposures from ultraviolet light sources, intense magnetic fields, accelerator power supplies, and microwave sources. A primary concern in the WCD is the use of UV lamps for sterilization in the water purification process. All work involving non-ionizing radiation will be reviewed for acceptable exposures. The BNL non-ionizing radiation exposure limits, which summarize the ACGIH and OSHA 29 CFR 1910.97 limits, will be used to determine allowable exposures. Consumer microwave ovens for food preparation, video display terminals, consumer telecommunication equipment and heat lamps used in food service are exempt from these requirements.
Controls:
-
Non-ionizing radiation devices will be identified and evaluated for their potential exposure.
-
Devices capable of producing non-ionizing radiation in excess of limits will be labeled to warn of the potential exposure.
-
Areas where non-ionizing radiation exposure potential exists will be posted with appropriate warnings, or interlocked.
-
Procedures for routine maintenance or replacement of components (e.g., UV lamps) will be developed.
-
Personnel who routinely work within areas where an exposure above the limits is possible will be trained in non-ionizing radiation safety.
12.2.12 Environmental Hazards
Environmental hazards include waste disposal and possible contamination of subsurface water at the detector site. Wastes may include broken PMTs, oils and fuels from vehicles in underground areas, cleaning solvents, adhesives, gadolinium sulfate, and water-treatment chemicals. Wastes will be handled and disposed of in compliance with federal and local regulations.
Controls:
-
Hazardous waste will be stored in closed containers, clearly marked as hazardous waste, with the hazardous content listed, the name of the waste generator, and the date the waste was generated.
-
Liquid wastes will be stored with secondary containment so that waste cannot enter the ground due to a leaking container.
-
Wastes will be stored in containers suitable for the waste material and incompatible wastes will be stored separately.
-
Wastes will be stored in designated locations.
12.2.13 Underground Events Hazards
Working underground presents hazards associated with geology, air circulation, exposure to gases, exposure to naturally occurring radioactivity, fires, operation of vehicles in confined areas, and flooding of work areas. Geological hazards such as underground collapse, earthquakes, and other seismic events will be evaluated by qualified engineers. Falling rock or rock fractures could result in debris that presents a hazard to both personnel and equipment. Human performance factors, such as fatigue, also play a role in underground work hazards.
Controls:
-
Plans will be formulated for evacuation in case of emergency. The working areas will be evaluated for life safety and means of egress, in compliance with federal regulations.
-
Access will only be permitted in compliance with established access rules, and a two-person rule will be enforced.
-
First aid supplies will be located in proximity to work areas, and will be stored in water resistant containers.
-
Monitors for oxygen levels, toxic gases, fire, smoke, and radiation will be installed if it is determined that these are needed to enhance safety for occupancy.
-
Personnel will be trained on the proper response in case of an emergency and will participate in drills that are required.
-
Vehicles operated underground will only be operated by trained personnel.
-
Hard hats will be required in areas where exposed rock faces could result in falling rocks.
-
To address radiation exposure and human performance factors, a time limit for continuous underground work or occupancy will be considered.
12.2.14 Welding and Cutting Hazards
Welding and cutting operations may be performed by contractor personnel or collaborators, depending on the extent and nature of the work. The work may be performed in machine shops, on or off the detector site, in surface assembly areas or underground. Welding or cutting will comply with OSHA 29 CFR 1910 Subpart Q. The hazards of these tasks include:
-
Burns from contacting hot objects, from sparks or molten metals or from accidental contact with welding heat devices,
-
Eye injury from high intensity welding light emissions,
-
Impact of debris from shattered cutting wheels,
-
The dropping or falling of heavy objects being welded,
-
Fires started from high temperature operations.
Controls:
-
Welding and cutting operations will be carried out by qualified workers.
-
Workers will use the appropriate PPE, tinted goggles, welding helmets, heat resistant gloves, and proper clothing.
-
Work areas will be kept free of flammable debris to reduce the risk of fire.
-
Operations that must be done in the presence of flammable material will utilize an additional worker as a fire watch.
-
Compressed welding gases will be used, stored and maintained in compliance with OSHA regulations and local requirements.
-
Jigs and lifting devices will be used where needed to reduce the likelihood of heavy objects falling on personnel while welding or cutting.
12.2.15 Fire and Smoke Hazards
Hazards from smoke or fire are present in all phases of any project. Storage and installation of cables and liner materials represent perhaps the most significant fire hazard. Although when the vessel is filled with water the hazard is minimized, there will remain exposed liner material above the water line and substantial amounts of combustible cables will remain on the deck. During installation, all of the installed cable will be exposed as a potential fuel source. Hazards due to combustion in laboratories and work areas, above- or below-ground, include: asphyxiation; smoke inhalation; severe or minor burns; and entrapment due to fire. Fire protection will be in compliance with OSHA 29 CFR 1910 Subpart L.
Controls:
-
Work areas will be kept in good order, minimizing the accumulation of flammable and combustible materials, maintaining good egress paths, and careful use of open flames and heat-producing equipment.
-
Evacuation plans will be developed for the detector site.
-
Personnel will participate in fire and evacuation drills.
-
Fire suppression systems are being investigated to mitigate the underground cable-storage and vessel liner hazards during installation and operation. Cable storage above ground also represents a fire hazard and may require suppression systems to protect against material loss and personnel injury.
12.2.16 Stored-Energy Hazards
12.2.16.1 Conventional systems
Stored-energy hazards will be present in electrical service, compressed gases, hydraulic and other pressurized systems. The hazards include explosions, electrical-arc flashes and other rapid energy releases that can lead to burns, muscle and skeletal injuries. Work with stored energy systems will be performed in compliance with OSHA 29 CFR 1910.147.
Controls:
-
Hydraulic and pressurized systems will be affixed with appropriate pressure-relief devices and will be rated and designed to comply with relevant standards and ASME codes.
-
Electrical equipment will be installed and constructed to meet the appropriate electrical codes and the NFPA 70E codes.
-
Workers involved with operation or maintenance of devices with stored energy will be trained on the potential for injury or system damage for each system.
-
Procedures will be developed for safe operation and maintenance, where applicable.
-
Lockout-Tagout (LOTO) procedures will be developed for stored energy systems.
12.2.16.2 Photomultiplier Tube Hazards
The number and size of PMTs in the experiment represents a special hazard with respect to stored energy. Due to the large evacuated volume and thin glass used, a PMT that breaks produces very sharp fragments that can easily cause cuts to personnel. Individuals must be protected from implosion of a PMT during installation, and the entire system of PMTs must be protected against a chain reaction of imploding PMTs caused by the failure of a single one. Studies are being performed to understand the magnitude and propagation of pressure waves from an imploding PMT.
Controls:
-
The required PPE during handling PMTs will include appropriate eye protection, nonslip cut-resistant gloves, long-sleeved shirt, long pants and closed-toed shoes.
-
In high bay or construction areas where there is a danger of falling objects from above, a hard hat is also required.
12.2.17 Routine Work Hazards
We must also address hazards that can be found in any machine shop, laboratory or office space. This includes slips, trips and falls on working and walking surfaces, repetitive stress injuries, fires, cuts and abrasions from using common tools, and so forth. During winter weather additional hazards of walking through snow and in icy conditions, driving on-site in inclement weather, tornados and severe thunderstorms for surface buildings. Some underground areas may have low overhead clearance, others may be noisy environments. Working with PMTs could result in lacerations from accidental breakage of the glass enclosures. Another working concern is the potential transfer of dust, which may contain naturally occurring radioactivity to the WCD, or from the WCD to other low background areas.
Controls:
-
Working and walking areas must remain clear of debris, and be well lighted to reduce the likelihood of slips, trips and falls. Routine walk-throughs will be performed to check and correct these conditions.
-
Areas requiring PPE such as hard hats and hearing protection will be be clearly marked.
-
General worker training will include awareness of areas requiring PPE and the importance of following those requirements.
-
Personnel will be trained on the proper response in case of an emergency and will participate in drills.
-
Underground access will only be permitted in compliance with established access rules, and a two-person rule will be enforced.
-
The collaboration will arrange for timely snow removal and keeping walkways clear of ice.
-
Procedures for removal of dust before entering or leaving areas will be established if it is determined to be necessary.
12.2.18 Confined Space Hazards
Work within the excavated caverns may qualify as confined space work, depending on egress paths and the nature of hazards within those spaces. Entry into the excavations will be performed according to safety standards, which are developed from applicable OSHA and MSHA regulations. Personnel working will be trained to understand and recognize the hazards of such work. Prior to entry, routine services will be confirmed to be operating, such as ventilation and fire suppression systems. If there are times when additional hazards, such as welding or spraying chemical coatings, are introduced, an entry permit that identifies those hazards and their mitigation, and authorization by safety personnel will be required. Work in confined spaces will comply with OSHA 29 CFR 1910.146.
Controls:
-
Work with safety personnel to establish proper cavern entry requirements.
-
Evaluate and approve planned work for hazards prior to entry, and provide appropriate mitigation.
-
Establish routine atmosphere testing of oxygen levels, carbon monoxide levels, and other noxious gases, as warranted.
-
Review and approve entry permits when they are required for the planned work.
Appendix A Appendix: Conventional Facilities
A.1 Introduction
The goal of the LBNE Project is to explore physics beyond the Standard Model including the mass spectrum of the neutrinos and their properties by aiming an intense proton beam created at the Fermilab Main Injector at neutrino detectors more than 1,200 kilometers away. The preferred physics location for LBNE far detector is the Sanford Underground Laboratory at Homestake (Sanford Laboratory) in Lead, South Dakota. This site was selected as part of a National Science Foundation effort to create a deep underground science and engineering laboratory. This process is discussed further in the LBNE Alternatives Analysis[69], where the scientific reasons for this location are detailed.
The Sanford Laboratory is located at the site of the former Homestake Gold Mine, which is no longer an active mine. It is now being repurposed and modified to accommodate underground science. There are extensive underground workings that provide access to a depth of 8,000 ft.
The reference conceptual design for the far detector is a 200-kton water Cherenkov detector (WCD). The mass quoted is the fiducial mass of the detector — the volume over which the behavior of the detector is well understood at a size that meets the physics requirements. Excavated space for the detector will be larger than the fiducial volume. The WCD is designed to be constructed at 4850L of the facility between the Ross and Yates Shafts (see Figure A–1).

The existing Sanford Laboratory has many underground spaces, some of which can be utilized by LBNE for the WCD detector. However, significant work is required to provide the space and infrastructure support needed for the experiment installation and operation. The scope of the underground facilities required for the WCD includes new excavated spaces at 4850L for the detector, utility spaces for experimental equipment, utility spaces for facility equipment, drifts for access, Areas of Refuge (AoR) for emergencies, as well as construction-required spaces. Underground infrastructure provided by Conventional Facilities for the experiment includes power to experimental equipment, cooling systems and cyber infrastructure. Underground infrastructure for the facility includes domestic (potable) water, industrial water for process and fire suppression, fire detection and alarm, normal and standby power systems, sump pump drainage system for native and leak water around the detector, water drainage to the facility-wide pump discharge system, compressed air and cyber infrastructure for communications and security.
In addition to providing new spaces and infrastructure underground, Conventional Facilities will enlarge and provide infrastructure in some existing spaces for WCD use, such as the West Access Drift. Examples of existing infrastructure that require upgrades to meet LBNE needs include rehabilitation of the Ross and Yates Shafts.
The existing Sanford Laboratory has many surface buildings and utilities, some of which can be utilized for WCD. The scope of the above ground work for Conventional Facilities includes that work necessary for LBNE, and not for the general rehabilitation of buildings on the site, which remains the responsibility of the Sanford Laboratory. Buildings that will be upgraded for WCD include repurposing of the Yates Crusher Building for the WCD water fill and purification system. The Yates and Ross Headframes and Hoist Buildings will receive structural, architectural, and electrical improvements. Electrical substations and distribution will be upgraded to increase power and provide standby capability for life safety. Additional surface scope includes a small control room in an existing building and temporary experimental installation office space in trailers. No new buildings will be constructed as part of the WCD Conventional Facilities.
A.1.1 Participants
The Far Detector is planned to be located at the Sanford Laboratory site, which is managed by the South Dakota Science and Technology Authority (SDSTA). The design and construction of LBNE Far Site Conventional Facilities will be executed in conjunction with Sanford Laboratory staff.
The LBNE Project Conventional Facilities is managed by the Work Breakdown Structure (WBS) Level 2 Conventional Facilities Manager. The supporting team includes a WBS Level 3 Manager for Conventional Facilities at Far Site, who works directly with the Sanford Laboratory engineering staff. The Level 3 Far Site Manager is also the LBNE Project liaison with the WCD subproject to ensure the detector requirements are met and is responsible for all LBNE scope at the Far Site. Management of the Sanford Laboratory and the organizational relationship between it and the LBNE Project and Fermilab were in the process of being determined when this section was written.
To date, Sanford Laboratory has utilized a team of in-house facility engineers to oversee multiple engineering design and construction consultants. Design consultants have specific areas of expertise in excavation, rock support, fire/life safety, electrical power distribution, cyber infrastructure, cooling with chilled water and heating/ventilation systems. Design consultants for LBNE’s Conceptual Design were: HDR for surface facilities, Arup, USA for underground infrastructure and Golder Associates for excavation. Interaction between Sanford Laboratory facility engineers, LBNE Far Site design teams, and design consultants was done via weekly telephone conferences, periodic design interface workshops and electronic mail. The Sanford Laboratory facility engineers coordinated all information between design consultants to assure that design efforts remain on track.
For the LBNE Conceptual Design phase, the McCarthy Kiewit Joint Venture (MK) performed as the construction manager for pre-construction services. MK reviewed the consultant designs for constructibility and provided independent estimates of cost and schedule. MK also provided guidance on packaging of design components for contracting as part of the Far Site conventional facility acquisition strategy.
A.1.2 Codes and Standards
Conventional facilities to be constructed at the Far Site shall be designed and constructed in conformance with the Sanford Laboratory ESH Standards[74] especially the latest edition of the following codes and standards:
-
Applicable Federal Code of Federal Regulations (CFR), Executive Orders, and DOE Requirements
-
2009 International Building Code
-
Sanford Underground Laboratory Subterranean Design Criteria, EHS-1000-L3-05
-
“Fire Protection/Life Safety Assessment for the Conceptual Design of the Far Site of the Long Baseline Neutrino Experiment (LBNE)”, a preliminary assessment dated October 11, 2011, by Aon/Schirmer Engineering
-
The Occupational Health and Safety Act of 1970 (OSHA)
-
Mine Safety and Health Administration (MSHA)
-
NFPA 101, Life Safety Code
-
NFPA 520, Standard on Subterranean Spaces, 2005 Edition
-
NFPA 72, National Fire Alarm Code
-
American Concrete Institute (ACI) 318
-
American Institute of Steel Construction Manual, 14th Edition
-
ASHRAE 90.1-2007, Energy Standard for Buildings
-
ASHRAE 62, Indoor Air Quality
-
2009 National Electrical Code
-
American Society of Mechanical Engineers (ASME)
-
American Society for Testing and Material (ASTM)
-
American National Standards Institute (ANSI)
-
National Institute of Standards & Technology (NIST)
-
Insulated Cable Engineers Association (ICEA)
-
Institute of Electrical and Electronics Engineers (IEEE)
-
National Electrical Manufacturers Association (NEMA)
-
American Society of Plumbing Engineers (ASPE)
-
American Water Works Association (AWWA)
-
American Society of Sanitary Engineering (ASSE)
-
American Gas Association (AGA)
-
National Sanitation Foundation (NSF)
-
Federal American’s with Disabilities Act (ADA) along with State of South Dakota ADA amendments. These requirements shall only be applied to those facilities which are located at the ground surface and accessible to the public.
A.2 Existing Site Conditions
The SDSTA currently operates and maintains Sanford Laboratory at Homestake in Lead, South Dakota. The Sanford Laboratory property comprises 186 acres on the surface and 7,700 acres underground. The Sanford Laboratory Surface Campus includes approximately 253,000 gross square feet of existing structures. Using a combination of private funds through T. Denny Sanford, South Dakota Legislature-appropriated funding, and a federal Department of Housing and Urban Development Grant, the SDSTA has made significant progress in stabilizing and rehabilitating the Sanford Laboratory facility to provide for safe access and prepare the site for new laboratory construction. These efforts have included dewatering of the underground facility and mitigating and reducing risks independent of the former Deep Underground Science and Engineering Laboratory (DUSEL) efforts and funding.
The Sanford Laboratory site has been well-characterized through work performed by the DUSEL Project for the National Science Foundation (NSF). The following sections are excerpted from the DUSEL Preliminary Design Report (PDR)[75], primarily Volume 5, and are used with permission in this and other sections of this CDR. They are edited to include only information as it is relevant to the development of the LBNE Project. The research supporting this work took place in whole or in part at the Sanford Laboratory at Homestake in Lead, South Dakota. Funding for the DUSEL PDR and project development was provided by the National Science Foundation through Cooperative Agreements PHY-0717003 and PHY-0940801. The assistance of the Sanford Laboratory at Homestake and its personnel in providing physical access and general logistical and technical support is acknowledged.
The following figures provide a context for the Sanford Laboratory site. Figure A–2 illustrates Sanford Laboratory’s location within the region as a part of the northern Black Hills of South Dakota. Figure A–3 outlines the Sanford Laboratory site in relationship to the city of Lead, South Dakota, and points out various significant features of Lead including the surrounding property that still remains under the ownership of Barrick Gold Corporation111Barrick Gold Corporation (Barrick) operated the former Homestake Gold Mine in Lead, SD and when they closed the mine operations, a portion of the land was donated to the state of South Dakota and the use of the property is governed by the Property Donation Agreement (PDA) between Barrick and the state of South Dakota. The state of South Dakota manages the development of the now Sanford Laboratory site through the South Dakota Science and Technology Authority (SDSTA). . Finally, Figures A–4 and A–5 provide perspectives of the Sanford Laboratory Campus from a surface and aerial view of the property and its surroundings. These views illustrate the varied topography found throughout the site.


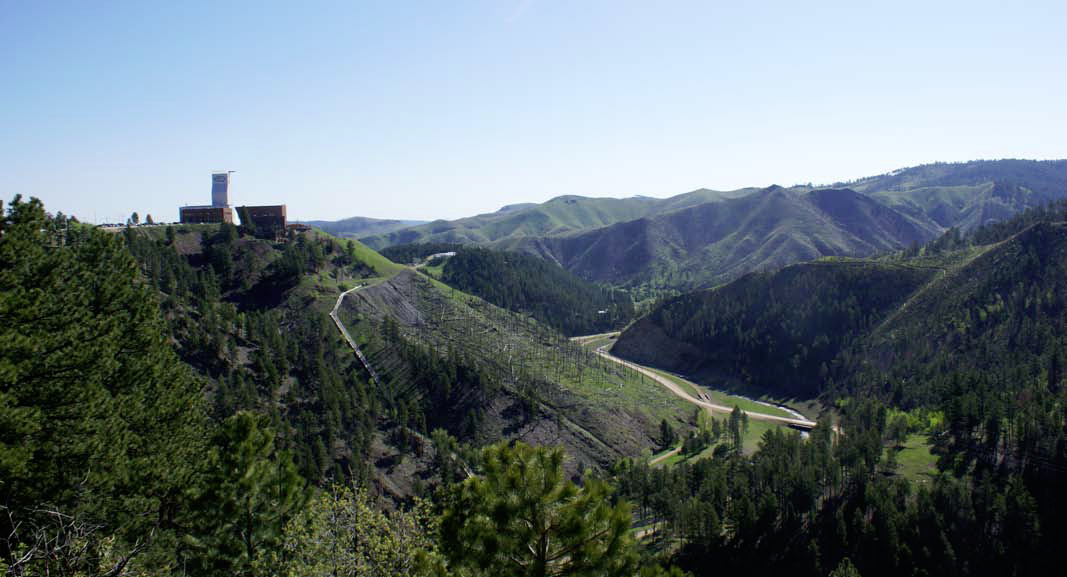
(Courtesy of Sanford Laboratory)

A.2.1 Existing Site Conditions
The existing facility conditions were assessed as part of the DUSEL Preliminary Design and documented in the DUSEL PDR, Section 5.2.4, which is excerpted below. The portions of DUSEL’s assessment included here have been edited to reflect current activities and to reference only that portion of the assessment that are pertinent to the LBNE Project. References to the DUSEL Project are from that time, and are now considered historic.
A.2.1.1 Existing Facilities and Site Assessment
Site and facility assessments were performed during DUSEL’s Preliminary Design phase by HDR CUH2A to evaluate the condition of existing facilities and structures on the Yates, and Ross Campuses. The assessments reviewed the condition of buildings proposed for continuing present use, new use, or potential demolition. Building assessments were performed in the categories of architectural, structural, mechanical/ electrical/plumbing (MEP), civil, environmental, and historic. Site assessments looked at the categories that included civil, landscape, environmental, and historic. Facility-wide utilities such as electrical, steam distribution lines, water, and sewer systems were also assessed. The assessment evaluation was completed in three phases. The detailed reports are included in the appendices of the DUSEL PDR as noted and are titled:
-
Phase I Report, Site Assessment for Surface Facilities and Campus Infrastructure to Support Laboratory Construction and Operations (DUSEL PDR Appendix 5.E)
-
Phase II Site and Surface Facility Assessment Project Report (DUSEL PDR Appendix 5.F)
-
Phase II Roof Framing Assessment (DUSEL PDR Appendix 5.G)
The site and facility assessments outlined above were performed during DUSEL’s Preliminary Design as listed above and include a review of the following:
-
Buildings proposed for reuse were evaluated for preliminary architectural and full structural, environmental, and historic assessments.
-
Buildings proposed for demolition were evaluated for preliminary historic assessments.
-
Preliminary MEP assessments were performed on the Ross Substation, #5 Shaft fan, Oro Hondo fan, Oro Hondo substation, and general site utilities for the Ross, Yates, and Ellison Campuses.
-
The Waste Water Treatment Plant received preliminary architectural and structural assessments and a full MEP assessment.
-
Preliminary civil assessments of the Kirk Portal site and Kirk to Ross access road were also completed.
A.2.1.2 Building Assessment Results
Results of the building assessment work, as detailed in the three reports referenced above, show that the buildings on the Ross and Yates Campuses were architecturally and structurally generally suitable for reuse or continued use with some upgrades or modifications.
Site Civil Assessment
Results of the civil assessment found in the Phase I Report, Site Assessment for Surface Facilities and Campus Infrastructure to Support Laboratory Construction and Operations (DUSEL PDR Appendix 5.E) and Phase II Site and Facility Assessment, Project Report (DUSEL PDR Appendix 5.F) showed the following results:
-
Water and sewer utilities on both the Ross and Yates Campuses need replacement.
-
Roadway and parking lot surfaces need replacement and regrading. Drainage ways and steep slopes need maintenance.
-
Retaining walls and transportation structures are in useable condition, with some maintenance, except for two failing retaining walls.
-
Retaining walls and transportation structures need maintenance in the form of drainage improvements and minor repairs to section loss due to rust and erosion.
-
Existing fencing and guardrails are a very inconsistent pattern of chain link, wood, and steel; much of the fencing is deteriorating or collapsed.
-
Abandoned equipment/scrap-metal piles around the sites represent traffic and health hazards.
-
Pedestrian and traffic separation is poorly defined.
-
Existing traffic signs are faded and do not meet Manual of Uniform Traffic Control Devices standards.
The Civil Site Assessment recommendations can be found in DUSEL PDR Appendix 5.E (Section 4, Page 4(1) of the Phase I Report, Site Assessment for Surface Facilities and Campus Infrastructure to Support Laboratory Construction and Operations); and DUSEL PDR Appendix 5.F (Section 2, Page (2.1) — 39 of the Phase II Site and Facility Assessment Project Report). All items that would cause immediate concern for the health and safety of onsite personnel have been addressed by the SDSTA by removing, repairing, or isolating the concerns.
Landscape Assessment
The landscape assessment, found in DUSEL PDR Appendix 5.E (Phase I Report, Site Assessment for Surface Facilities and Campus Infrastructure to Support Laboratory Construction and Operations); and DUSEL PDR Appendix 5.F (Phase II Site and Surface Facility Assessment Project Report) noted many of the same items as the site civil assessment: drainage issues, erosion concerns, abandoned equipment, and scrap metal. Soil conditions were noted as well as rock escarpments and soil stability concerns.
Site MEP Assessment
The site assessments, detailed in DUSEL PDR Appendix 5.E (Phase I Report, Site Assessment for Surface Facilities and Campus Infrastructure to Support Laboratory Construction and Operations); and DUSEL PDR Appendix 5.F (Phase II Site and Surface Facility Assessment Project Report) found the electrical distribution condition to range from fair to excellent, depending on the age of the equipment. The Ross Campus recommendations generally consisted of upgrades to increase reliability. The Yates Campus recommendations call for a new substation to replace the old abandoned East Substation if significant loads are added to this campus.
The assessments also evaluated the natural gas and steam distribution systems. Natural gas is provided to the site at three locations and appears to have the capacity required to meet surface needs as they are currently understood. However, the natural gas supply is an interruptible supply (non-firm) and thus cannot be guaranteed. Either an upgrade to Montana-Dakota Utilities (MDU, local natural gas supplier) supply lines (outside the scope of this Project) or an alternate fuel/heating source will be needed to meet the surface needs. The steam boiler systems have been dismantled and should not be reused. The existing components represent placeholders for routing for new distribution if steam is re-employed.
The site telecommunications service currently is provided by Knology Inc., Rapid City, South Dakota, and a fiber-optic data connection is from the South Dakota Research, Education and Economic Development (REED) Network (see DUSEL PDR Chapter 5.5, Cyber Infrastructure Systems Design, for details on these service providers). Both services are quite new and have historically been very reliable. The site distribution system is a mix of copper and fiber, copper being quite old and fiber very new. The Ross and Yates Campus’ recommendations are to increase reliability as the campuses are developed.
Environmental Assessment
The environmental assessment, found in DUSEL PDR Appendix 5.F (Phase II Site and Surface Facility Assessment Project Report) looked for contamination from lead-based paint (LBP); polychlorinated biphenyls (PCBs) contained in electrical equipment, lubrication oils, and hydraulics; asbestos-containing building materials; heavy metals; the historic presence of petroleum hydrocarbons and chlorinated solvents; molds; historic uncontrolled discharges of domestic sewage; industrial wastewater; and storm-water runoff. Environmental results showed some LBPs in various locations across both the Ross and Yates Campuses. No PCB concentrations above Environmental Protection Agency (EPA) regulatory standards were encountered, and no heavy metals above EPA regulatory standards were found.
Historic Assessment
The former Homestake Gold Mine site is a major component of the Lead Historic District. Most of the DUSEL Campus is within the historic district; thus, work on the DUSEL site must conform to the National Historic Preservation Act of 1966, as Amended. These standards recognize that historic buildings and sites must change with time if they are to meet contemporary needs but that alterations to meet these needs can be done in a manner that is sensitive to the historic property. Figure A–6 is a historic photograph showing the former Homestake Mining Company milling operation and components of the Yates Campus.

Figure A–7 shows the boundaries of the Lead historic district.

The historic assessment consisted of the full assessment of 10 transcendent and eight support buildings. Transcendent buildings have the most significant historic value and represent an operation that was unique or limited to the site. Support buildings represented a function or activity that, although performed on the site, could have been done off site. Of the 10 transcendent buildings, nine were deemed to have significant historic value while one held only moderate historic value. Seven of the support buildings held moderate historic value, while the eighth has only limited historic value. Sixteen other buildings received a preliminary historic assessment. Two were deemed to have significant historic value, 13 held moderate historic value, and the last was deemed to be of limited historic value.
To assist the DUSEL Project in understanding the historic requirements for the Project, a meeting was held with the South Dakota State Historic Preservation Office (SD SHPO) in June 2010. The DUSEL team provided a Project overview for the SD SHPO staff and took a site tour so the SHPO staff could develop an understanding of the Project. The SD SHPO staff members were pleased, for the most part, with the direction the design team was taking for the Project. SD SHPO provided recommendations to DUSEL for documentation and preservation options that will need to be addressed during Final Design to meet mitigation requirements for any facilities that may ultimately be removed. LBNE is not currently planning to remove any existing structures.
It should be noted that the historic assessment prepared for this portion of the overall site assessment is not the formal historic assessment that will be required to comply with the National Environmental Policy Act (NEPA) strategy.
See section A.3.2.1 for additional information about the LBNE NEPA strategy.222For clarity, this discussion of NEPA activities was developed for this Conceptual Design Report and inserted into this section of text which is largely copied from the DUSEL Preliminary Design Report. Discussions on NEPA were not included in the text of the DUSEL Preliminary Design Report.
The entire historic assessment process and results can be viewed in DUSEL PDR Appendix 5.E (Phase I Report, Site Assessment for Surface Facilities and Campus Infrastructure to Support Laboratory Construction and Operations), and DUSEL PDR Appendix 5.F (Phase II Site and Surface Facility Assessment Project Report).
A.2.2 Geology and Existing Excavations
The accessible underground mine workings at the Homestake mine are extensive. Over the life of the former gold mine some 360 miles of drifts (tunnels) were mined and shafts and winzes sunk to gain access to depths in excess of 8,000 feet. A number of underground workings are being refurbished by Sanford Laboratory and new experiments are being developed at 4850L, the same level as proposed for LBNE WCD facilities. Geotechnical investigations and initial geotechnical analyses have been completed for the DUSEL Preliminary Design and are described in detail in the DUSEL PDR. Below are summaries of some of the work completed to date that is applicable to LBNE as excerpted from the DUSEL Preliminary Design Report, Chapter 5.3 and edited to include only information as it is relevant to the development of the LBNE Project.
A.2.2.1 Geologic Setting
The Sanford Laboratory is sited within a metamorphic complex containing the Poorman, Homestake, Ellison and Northwestern Formations (oldest to youngest), which are sedimentary and volcanic in origin. An amphibolite unit (Yates Member) is present at the base of the Poorman Formation. The Yates Member is the preferred host rock for the LBNE excavations at 4850L. The layout adopted on 4850L attempts to maximize the amount of WCD excavation work performed in the Yates Member amphibolite rock.
A.2.2.2 Rock Mass Characterization
One of the goals of the geotechnical investigations performed to date by the DUSEL Project was to provide information for the excavation and stabilization of an alternative large cavity for a WCD supporting the Long Baseline Neutrino Experiment (LBNE). Characterization of the rock mass (see DUSEL PDR Sections 5.3.2 and 5.3.3) was accomplished through a program of mapping existing drifts and rooms in the vicinity of planned excavations, drilling and geotechnical logging of rock core samples, and laboratory measurements of the properties of those samples.
As part of the Preliminary Design process, the DUSEL Project engaged two advisory boards to provide expert review of the geotechnical investigation and excavation design efforts. The Geotechnical Advisory Committee (GAC) was an internal committee that focused primarily on geotechnical investigation and analysis. The Large Cavity Advisory Board (LCAB) was an internal high-level board that focused on geotechnical investigations and excavation design of the WCD cavity in support of the LBNE Project. The Geotechnical Engineering Services contract, which was used to execute geotechnical investigations, was reviewed by the GAC and the LCAB and included the following scope of work:
-
The mapping program included drift mapping at the 300L and 4850L and 4,400 ft (1,340 m) of existing drifts mapped in detail and 2,600 ft (793 m) of newly excavated drifts and large openings mapped in detail (Davis Campus, Transition Area, and associated connecting drifts).
-
The drilling program included the completion of nine new holes totaling 5,399 ft (1,646 m) of HQ (4-inch drill producing 2.5 inch core) diamond core drilling, which incorporated continuous logging, continuous core orientation, detailed geotechnical and geological logging, full depth continuous televiewer imaging, and initial groundwater monitoring.
-
The in situ stress measurement program included stress measurements in three locations; two sites in amphibolite and one site in rhyolite for the total of eight measurements (six in amphibolite and two in rhyolite).
-
The laboratory testing program included uniaxial compressive strength tests (80 samples that incorporated elastic constants and failure criteria), indirect tensile strength tests (40 samples), triaxial compressive strength tests (63 samples), and direct shear strength of discontinuities (36 samples).
Geotechnical investigations were initiated by DUSEL in January 2009 and executed by RESPEC Inc., with Golder Associates and Lachel Felice & Associates (LFA) as their main subcontractors. The initial scope was modified to include the addition of a 100 kTon water Cherenkov detector. The scope was further modified, resulting in the requirement for the potential to include up to two 100 kton WCDs into the DUSEL Preliminary Design effort. In mid-2010, the DUSEL Preliminary Design scope was narrowed to one WCD.
In mid-2009, an initial geotechnical program was executed by DUSEL, first on the 300L, then on 4850L of the Homestake site. This program included site mapping, reconnaissance level geotechnical drilling and core logging, in situ stress measurements, optical and acoustic televiewer logging, numerical modeling, laboratory testing, initial surveying, and generation of a three dimensional (3D) Geological and Geotechnical Model. Additional tasks added in 2010 included characterization of ground vibrations from blasting associated with the Davis Campus excavation activities, and groundwater monitoring. A Geotechnical Engineering Summary Report (DUSEL PDR Appendix 5.H) was completed in March 2010, which recommended additional drilling and mapping to address data gaps and reduce uncertainty in the characterization of the rock mass that would be important for future phases of design. All of the geologic, geotechnical, and hydrogeologic information collected has been used to advance the Conceptual Design of the WCD at 4850L.
Based on these site investigations and the recommendations of the LCAB, the single 100 kton WCD has increased in size resulting in the 200 kTon WCD that was considered during LBNE Conceptual Design.
The geotechnical site investigations area on 4850L, showing bore holes, in situ measurement stations, and planned cavities within the triangle of drifts between the Ross and Yates Shafts, is presented in Figure A–8.

Note that only one core (hole J) was collected in the Poorman formation, as this was not the intended rock formation to be used at the time of the investigation.
Since their formation, the host rock units have been subject to periods of significant structural deformation. Deformations during the Precambrian era lead to the development of complex fold patterns, and local shear zones. Brittle deformations that took place during the Tertiary era resulted in the development of joint sets, veining, faulting and the intrusion of dikes[76]. Tertiary rhyolite dikes cross-cut the Precambrian rock units across the former mine site, from surface (open cut) to the deepest development levels (8,000 ft). In the areas of 4850L observed and investigated to date, these dikes are commonplace. Rhyolite is estimated to constitute some 40% of the rock volume in the area of the proposed campus. Faulting and veining have also been observed within the host rock mass[77, 78].
The in situ stress levels at various levels of the Sanford Laboratory underground facility have been measured on a number of occasions. The major principle stress, at depth, is sub-vertical. Recent measurements on 4850L report a range of vertical stress values, from 22 to 61 MPa (3.2 to 8.8 ksi) (average 44 Mpa / 6.4 ksi). Measured intermediate: major and minor: major stress ratios were reported to be 0.6 to 0.8 and 0.5 to 0.7 respectively. For further details, see Golder’s Geotechnical Engineering Services[79].
The intact hard metamorphic rocks are generally of low primary hydrologic conductivity. During historic mine operations most water inflows were observed to be local and typically attributed to secondary permeability[80]. A recent evaluation by Golder[78] estimates the typical inflow rate of about 1–2 gallons per minute per mile of underground workings. Some additional flow may be anticipated in the upper workings where fractures may be generally more weathered, open and directly connected to the surface and/or the Open Cut.
A.2.2.3 Geologic Conclusions
The recovery of rock cores, plus geologic mapping, was performed to determine if discontinuities in the rock mass exist that would cause difficulties in the construction and maintenance of planned excavations. In general, the proposed locations of the excavations do not appear to be complicated by geologic structures that cause undue difficulties for construction. This information, along with measurement of in situ stresses, allowed initial numerical modeling[78] of the stresses associated with the anticipated excavations. 2D and 3D numerical modeling was then used to design ground support systems that will ensure that the large cavity, in particular, remains stable. The excavation design, which is influenced by anticipated methods of excavation and sequence of excavation, is described in the Golder Associates Conceptual Design Report[78], followed by the means by which the excavations will be monitored to ensure their long-term stability.
The overall analysis of the work indicates that the rock in the proposed location of the WCD is of good quality for the purposes of the LBNE Project, that preliminary numerical modeling shows that a large cavern of the size envisioned can be constructed, and that a workable excavation design has been developed.
A.3 The Facility Layout
The Sanford Laboratory property of 186 acres consists of steep terrain and man-made cuts dating from its mining history. There are approximately 50 buildings and associated site infrastructure in various states of repair. A select few of these buildings and the main utilities are needed by the WCD experiment and will be upgraded and rehabilitated as necessary. HDR prepared a conceptual design for surface facility improvements for WCD[81]. This section summarizes the work done by HDR and utilizes information from that report.
A layout of the overall Sanford Laboratory architectural site plan for the LBNE Project is found in Figure A–9.

The Yates Campus contains the main Sanford Laboratory Administration building and will be the location of WCD experiment installation and operations. Layout of surface facilities in the vicinity of the Yates Shaft is shown in Figure A–10.
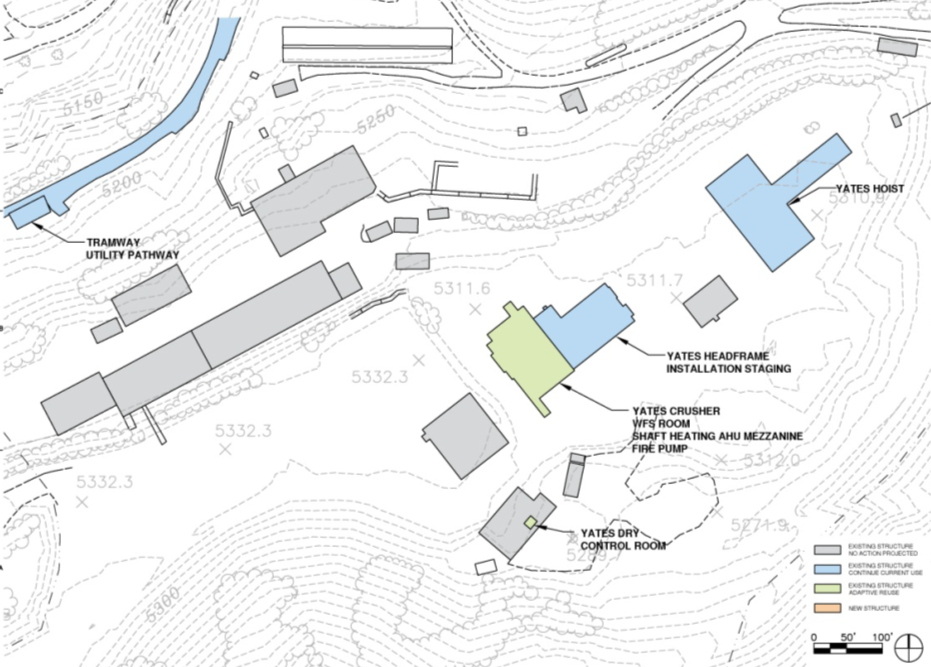
The Ross Campus will house the facility construction operations as well as continue to house the Sanford Laboratory maintenance and operations functions. Layout of surface facilities in the vicinity of the Ross Shaft is shown in Figure A–11.

A.3.1 Surface Infrastructure
Surface infrastructure includes surface structures such as retaining walls and parking lots, as well as utilities to service both buildings and underground areas. Existing infrastructure requires both rehabilitation as well as upgrading to meet code requirements and WCD experiment needs. The experimental[16] and facility[81] requirements were documented.
A.3.1.1 Roads and Access
No new roads or parking lots are required for WCD at the Yates Campus. An analysis was performed to confirm that large delivery trucks could drive up Summit Street and turn around on the Yates Campus. Six existing retaining walls need upgrades to strengthen and stabilize them on this sloped site. Site drainage improvements are needed to adjust grades and ensure that storm water is diverted properly.
No new roads or parking lots are required for WCD at the Ross Campus.
A.3.1.2 Electrical Infrastructure
Power for the experiment and new facilities underground will be fed from the Yates Shaft. Underground life safety loads will be powered from the Yates Shaft standby power. Both the Ross and Yates Campuses will provide standby power generators for surface life safety needs, including fire pumps, hoists, and shaft heating and ventilation equipment. Standby power will also be added to the existing Oro Hondo substation for exhaust ventilation. Emergency power, defined by National Fire Protection Agency (NFPA) codes as “critical for life support” will be provided by 90 minute battery backed uninterruptible power supply (UPS) connected downstream of the standby power system. Figure A–12 indicates the location of electrical infrastructure work at Sanford Laboratory.
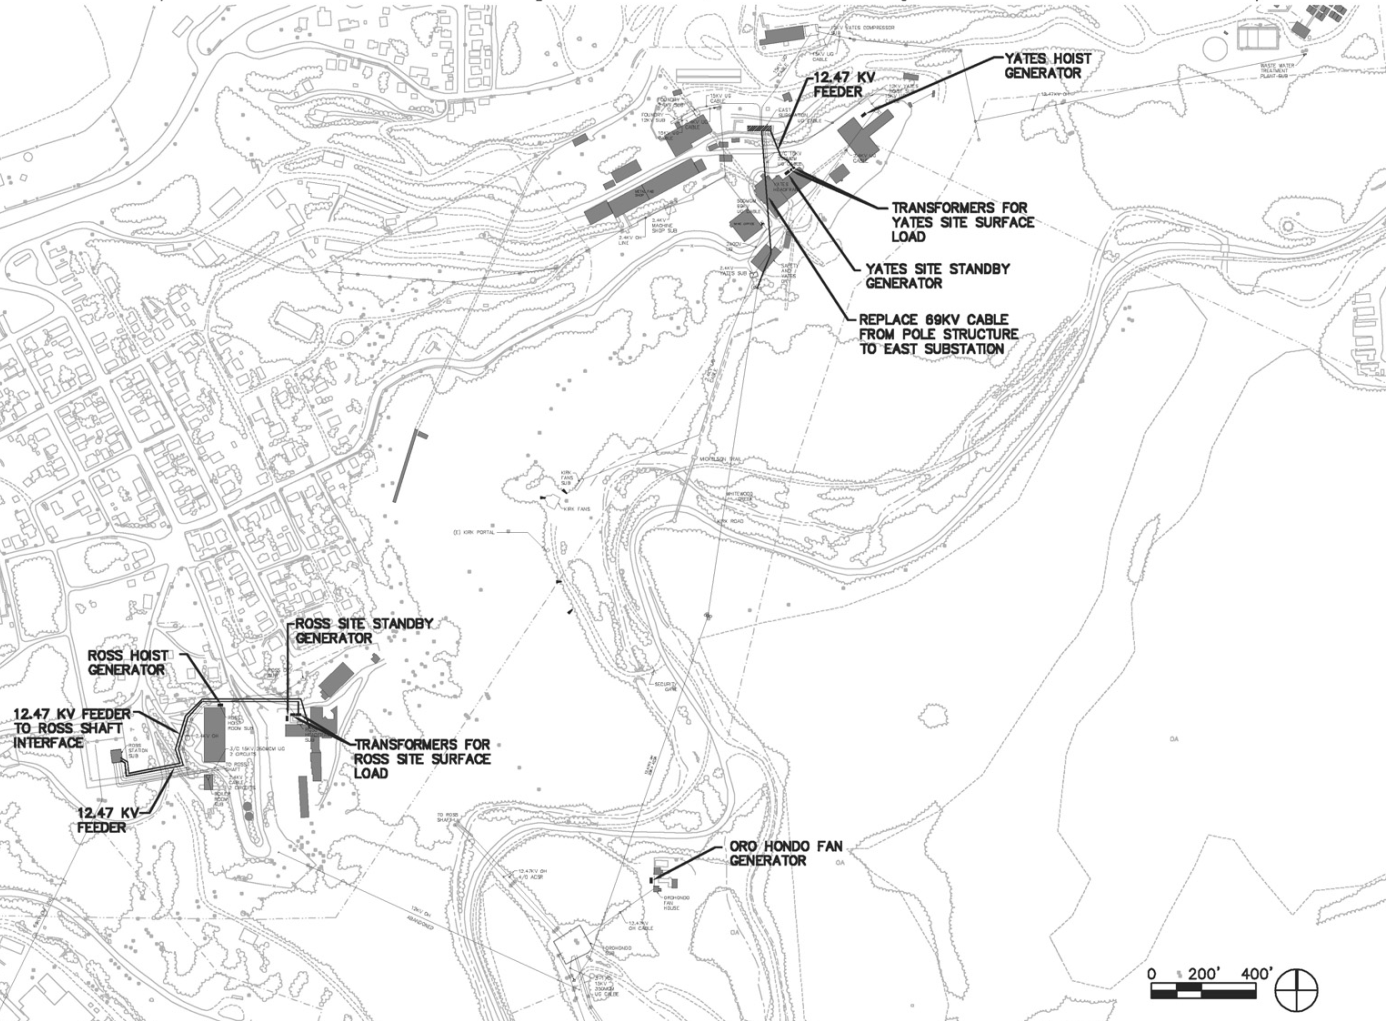
Power requirements for the WCD experiment and facility is shown in Tables A–1 and A–2 and summarized below in Table A–3.
![[Uncaptioned image]](/html/1204.2295/assets/x79.png)
![[Uncaptioned image]](/html/1204.2295/assets/x80.png)
| Ross Campus summary | ||
|---|---|---|
| Normal Power load (UGI and surface) | 2654 | KVA |
| standby Power load (UGI and surface) | 490 | KW |
| 20% uncertainty Factor | 98 | KW |
| Total standby Power load (UGI and surface) | 588 | KW |
| Yates Campus summary | ||
| Normal Power load (UGI and surface) | 1048 | KVA |
| standby Power load (UGI and surface) | 656 | KW |
| 20% uncertainty Factor | 131 | KW |
| Total standby Power load (UGI and surface) | 787 | KW |
| Oro Hondo summary | ||
| Normal Power load (UGI and surface) | 0 | KVA |
| standby Power load (surface) | 315 | KW |
| 20% uncertainty Factor | 63 | KW |
| Total standby Power load (surface) | 378 | KW |
Note: Loads shown are only connected loads. Generator size is based on the starting and running loads of the equipment served.
New primary power feeder will be provided from the East Substation to the new surface load transformer (for power to ventilation fans, fire pumps, water purification system, etc.). The below grade portion of the existing feeder cable from the Oro Hondo Substation to the East Substation (presently routed through the Yates Tramway Drift) has experienced problems in the past and will require replacement. The existing East Substation has capacity for the additional WCD Experiment surface loads, but will require rehabilitation to preserve the option of adding of gadolinium to the detector water and increasing science capability. This rehabilitation will involve the reinstatement of the substation feeder to its original voltage level of 69 KV and the addition of a new 1500 kVA, 12.47 kV: 480V/277V pad-mounted transformer with integral loadbreak switch. The secondary conductors from the transformer will feed a new 2000 A, 480V/277V main switchboard, MSB, located on the ground level of the Yates Crusher building.333Text of this paragraph excerpted from the HDR “WCD 4850L Final Report, Conceptual Design Report”. September 30, 2011.
Standby power at the Yates Campus will be provided for life safety considerations, none is required for the experiment. Two generators will be provided, one for the Yates Hoist and one for surface and underground life safety loads. The generator for the latter will feed 12.47 kV power to medium voltage switchgear from which one feeder will serve the Yates Shaft underground loads, and another feeder will serve a 750 kVA, 12.47 kV: 480V/277V pad-mounted transformer for the surface loads. An 1200 A, 480V/277V emergency switchboard (ESB) will be located in the Yates Crusher building. The ESB will feed three automatic transfer switches, one dedicated to standby power for the Yates Shaft ventilation air handing units (AHUs), one dedicated to the surface life safety loads, and one dedicated for the fire pump.
The Ross Campus normal power feeder will be provided from the existing Ross Substation to the new 750 kVA, 12.47 kV: 480V/277V pad-mounted transformer with integral loadbreak switch. The secondary conductors from the transformer will feed a new 1600 A, 480V/277V main switchboard (MSB) located within the Ross Headframe Building. Power from the MSB will be distributed to the Ross Shaft ventilation AHUs. New primary power feeder will be provided from the Ross Substation to the Ross Shaft collar at 480 V for interface with the underground infrastructure normal power.
Standby power for the surface Ross Shaft ventilation AHUs, fire pump, and associated equipment will be supplied from the Ross surface/underground life safety standby generator system. The generator will feed 12.47 kV power to medium voltage switchgear from which one feeder will serve the Ross Shaft underground life safety loads, and another feeder will serve a 500 kVA, 12.47 kV: 480V/277 volt pad-mounted transformer for the surface loads. A 800 A, 480V/277 volt emergency switchboard, ESB, will be located within the Ross Headframe Building. The ESB will feed three automatic transfer switches, one dedicated to standby power for the Ross Shaft ventilation AHUs, one dedicated to the surface life safety loads, and one dedicated for alternate source power to the fire pump.
A.3.1.3 Cyber Infrastructure
On the overall site, communications infrastructure is required for voice/data communications, security, the facility management system, and the fire alarm system. The underground systems will be tied to the corresponding surface systems. Redundant underground communications will be provided through new backbone cables in both the Ross and Yates Shafts with connection at 4850L. The campus fiber and copper backbone network will be upgraded and extended to the existing Ross Hoist Building telecommunications closet and a new closet in the Yates Hoist Building. The Yates Campus will be the main IT source, with the Ross as backup. Surface network connection will be done through existing tunnels as much as practical. New routes will be created in ductbanks. Surface connections will include connection to the Yates Dry control and Yates Administration Building.
A.3.1.4 Mechanical and HVAC
Ventilation for the underground systems is provided by equipment at the Ross and Yates Campuses. New equipment is required to meet life safety codes. Heating of the supplied air is required to prevent ice formation in the shafts during cold weather. Air handling units (AHUs) are equipped with filtration, fans and indirect natural gas-fired furnace sections. All major system components will be provided with a standby unit utilizing an N+1 design approach. If one of the AHUs were to fail, the standby component will provide 100% redundancy.
The shaft ventilation system for the Yates Shaft is proposed to be located in the existing Yates Crusher Building on a new mezzanine above the WCD water fill system. The normal ventilation load for the Yates Shaft will be 200,000 cubic feet per minute (CFM). This volume corresponds with the minimum flow capacity of the existing Oro Hondo exhaust fan as well as the requirements for heat removal from the WCD experiment. This would be met by three AHUs, each sized at 100,000 CFM, permitting two units to meet the required capacity and one unit to act as standby should a unit fail or be shut down for maintenance. Should interim construction conditions require higher ventilation rates, the redundant AHU could be put into service and/or supplemental, heated, make-up air will be provided by the construction contractors. In order to provide some level of temperature control within the shaft the supply air temperature from the AHUs will be maintained at a minimum level of 45∘F. No cooling will be provided.
A.3.1.5 Plumbing Systems
The existing Yates Campus has a network of aging water mains serving the site which is supplied from nearby city of Lead mains and water supply reservoir. To increase the reliability of the system and to provide fire protection, a new water main will be installed and connected to the existing mains to provide a looped water main. The looped system will serve the portion of the Yates Campus that will be used by the WCD 4850L Experiment. The water main will connect to an existing main west of the Upper Yates Parking Lot, run east along the south edge of this parking lot past the Administration and Sawmill buildings, turn north and reconnect to an existing water main to the west. This will also allow for simple connections of future water main improvements. A fire sprinkler main will be installed between the Yates Crusher and Yates Hoist Buildings. These improvements are shown in Figure A–13.

The Ross Campus is also served by the city of Lead municipal system. New water main and fire hydrants will be installed at the site to ensure adequate fire protection. The new water main will be installed from the end of the existing main southeast of the LHD Warehouse (LHD stands for Load Haul Dump equipment used underground), then continued to the north along the west edge of the site, where it will eventually connect to the existing main north of the Ross Headframe Building. At the Ross Hoist Building, new fire hydrants will be connected to existing water mains serving the building. A fire sprinkler main will be installed between the Ross Headframe to the Ross Hoist Building. These improvements are shown on Figure A–14.

Potable and Industrial Water Systems
The city of Lead provides two type of water to the site. Industrial water is provided from a mountain stream source several miles away directly to the site. This system was installed by the former Homestake Mining Company specifically for underground mining, and therefore it provides a reliable direct source of water. Potable water treats a side stream of the industrial water supply by filtering and adding fluorine and/or chlorine to the water.
Potable cold water will be provided to the Yates Shaft collar to serve the underground water requirements. Industrial cold water will be provided to serve all detector support systems that require an industrial water supply. The industrial cold water distribution system will be isolated from the potable water system by utilizing a reduced pressure backflow preventer (RPBP). The potable and industrial cold water distribution piping will be galvanized steel pipe. Piping has been sized for a maximum velocity of 8 fps for the cold water.
The Ross Campus water system will supply an 8-inch industrial water into the Ross Headframe Building and up to the shaft collar in order to support the underground water needs, independent of the purified water needed to fill the WCD. The Yates Campus water system also will supply a maximum of 600 GPM of industrial water into the Yates Crusher Building to support the surface water purification plant. A 6-inch line will be provided to serve this load.
This purified water will be generated utilizing WCD-supplied pretreatment equipment located on the ground floor of the Yates Crusher Building. From this system, purified water will be supplied to the underground for additional polishing and purification utilizing WCD water systems. A single 4-inch, 316 L electro-polished stainless steel pipe will be routed from the Yates Crusher Building to the Yates Shaft collar. A plan view of this system is included as Figure A–15. The capacity of the shaft pipe has been specified by the WCD experiment.
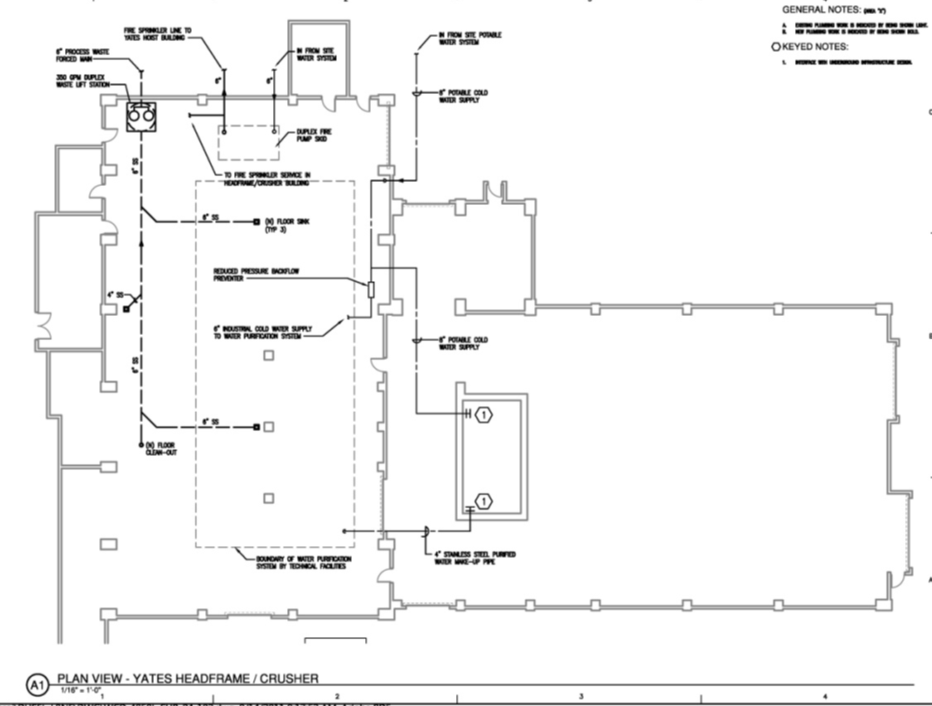
Fire Protection Systems
All areas of the existing buildings will have full sprinkler coverage. The building fire protection system for the existing buildings will be supplied from the water distribution system on site. The system will be designed in accordance with NFPA-13 guidelines, with fire sprinkler hazard classifications selected to suit the building function. Underground laboratories will be supplied fire water from the existing gravity water distribution system. Fire water piping will be routed to the shaft collars for interface with the underground piping installation.
Given the relatively low water pressure available on the Yates and Ross Campuses, new fire pump systems will be provided to serve the taller structures at both campuses. Each system will include two 1,000-gallon per minute (GPM) electric fire pumps supplied with standby power. Systems will include all required accessories such as jockey pumps, flow test meters, flow test headers, controllers, etc. The Yates Campus system will be located in the Yates Crusher Building, while the Ross Campus system will reside in the Ross Headframe Building. New fire pumps will be UL/FM approved and fully compliant with NFPA 20. Piping for the sprinkler and standpipe systems will be Schedule 40 black steel with flanged, grooved or threaded fittings. Two fire pumps, each capable of 100% of the required flow, will be provided at each campus.
Process Waste System
A process waste and vent system will be added to the Yates Crusher Building to serve wastewater produced by WCD water purification system. The building system is anticipated to flow by gravity to a duplex, waste lift station installed in the Yates Crusher Building. From the lift station the waste will be pumped through a force main then flow to the existing site Waste Water Treatment Plant, which currently treats water from underground facility dewatering operations. No supplemental treatment is expected for process waste.
Gas Fuel System
Natural gas will be used as the primary fuel in the shaft ventilation systems, but dual fuel systems are required, since the Black Hills area is near the end of a natural gas pipeline from North Dakota. Service is reliable but is served on an interruptible basis for large loads during adverse weather conditions. Loads below approximately 2,500 MBH (thousands of BTU per hour) per customer are typically allowed to be served on a firm basis. The periods of interruption are typically one to several days.
Independent propane systems will be provided at both the Yates and Ross Campuses in order to serve the shaft heating systems, in the event of natural gas curtailment. Each system will be designed to provide five full days of backup fuel, assuming winter design conditions and normal ventilation airflow. Based on calculations, the Yates Campus will utilize a single 12,000-gallon propane tank, while the Ross Campus will utilize two 3,500-gallon propane tanks. Each system will be provided with an associated vaporizer unit.
Natural gas will be distributed to the heating, ventilation, and air conditioning (HVAC) mechanical equipment requiring natural gas. The low pressure gas shall be distributed inside the buildings at 7 inch to 11 inch water column. The primary design criteria use the 2009 International Plumbing Code and NFPA-54, including the applicable state and city amendments.
Natural gas and propane will be distributed within buildings in Schedule 40 black steel piping with black iron welded fittings. The natural gas and propane lines serving the facility will be sized for the current building program with an additional anticipated load of 20% for renovation flexibility.
A.3.2 Project-Wide Considerations
There are several project-wide considerations, many with environmental considerations that must also be considered. These are discussed below.
A.3.2.1 Environmental Protection
The LBNE Project will prepare designs and execute construction and operations of the WCD at the Far Site in accordance with all codes and standards to ensure adequate protection of the environment. The Sanford Laboratory codes and standards outline the requirements for work at the site.
The overall environmental impact of the LBNE Project will be evaluated and reviewed for conformance to applicable portions of the National Environmental Policy Act (NEPA).
Several specific environmental concerns will be addressed during the project. These are described in the subsections below.
Environmental Controls during Waste Rock Disposal
There are a number of components to the waste rock handling system, most of which are either underground or on SDSTA property. The most visible component of the system to the public is the surface pipe conveyor which conveys excavated material from the Yates Shaft overland to the Open Cut and is discussed further in Section A.6.8.
Several controls are included in the waste rock handling system design to protect both the equipment and the community. The existing belt magnet provides a first defense against belt damage due to rock bolts, loader bucket teeth, etc. Prior to the pipe conveyor rolling into the pipe configuration, an additional magnet followed by a metal detector will catch both ferrous and nonferrous metals and shut down the system before damage is done. A scale on this belt protects against over- or underloading the conveyor, preventing issues experienced with similar conveyors. Standard safety controls, including pull cords, drift switches, zero-speed switches, and guarding provide further protection for both the equipment and operators. A full building enclosure around the car dump, surge bin, and pipe conveyor feeding point will contain noise and spills, should they occur. The entire length of the pipe conveyor will be enclosed and fencing will be provided to eliminate public access. Figure A–16 shows a depiction of what the conveyor may look like as it passes over Main Street in Lead and into the Open Cut.

A combination of dust collection and suppression will ensure that all environmental standards are met or exceeded. The Facility Management System will create interlocks to limit the potential for human error.
Waste Water Disposal Underground
To ensure environmental contaminants are not introduced into the lab-wide dewatering system, experimental space sumps will be required to be tested prior to discharge into the main drainage system. If contaminants are found, the experiment will be required to treat the water, or the water will be manually removed via tanks for proper disposal at the expense of the collaboration.
A.3.2.2 Safeguards and Security
A facilities security system shall be installed to provide a secure environment for the interior and the exterior of the facilities. To accomplish this, the security system will consist of the following:
-
Closed Circuit Video Monitoring: A closed circuit video system to monitor security cameras at selected locations
-
Card Access Control: An electronic access control system utilizing proximity card readers to control and record access to designated doors in the facility
-
Intrusion Detection Alarms
-
Security System Integration: The access control and video monitoring system shall be integrated into the Sanford Laboratory security monitoring system and monitored at the Command and Control Center.
A.3.2.3 Emergency Shelter Provisions
Required provision for occupant protection in the event of tornadoes or other extreme weather conditions may be incorporated into the design of the service buildings, if determined to be applicable. Guidelines established by the Federal Emergency Management Agency (FEMA) in publications TR-83A and TR-83B and referenced in Section 0111-2.5, DOE 6430.1A may, if determined to be applicable, be used to assess the design of the buildings to insure safe areas within the buildings for the protection of the occupants. These protected areas would also serve as dual-purpose spaces with regard to protection during a national emergency in accordance with the direction given in Section 0110-10, DOE 6430.1A.
FEMA guidelines indicate that protected areas are:
-
on the lowest floor of a surface building
-
in an interior space, avoiding spaces with glass partitions
-
areas with short spans of the floor or roof structure are best; small rooms are usually safe, large rooms are to be avoided.
A.3.2.4 Energy Conservation
The DOE directive, Guiding Principles of High-Performance Building Design, is being assessed to determine applicability of how it may, or may not, be incorporated into the design of the LBNE Conventional Facilities. However, discussions are ongoing regarding the applicability of the guiding principles based on the ownership/stewardship of the Sanford Laboratory, the type and use of the facilities. If applicable, LBNE processes and each project element will be evaluated during design to reduce their impact on natural resources without sacrificing program objectives. The project design will incorporate maintainability, aesthetics, environmental justice, and program requirements as required to deliver a well-balanced project.
As applicable, elements of this project may be reviewed for energy conservation features that can be effectively incorporated into the overall building design. Energy conservation techniques and high efficiency equipment will be utilized wherever appropriate to minimize the total energy consumption.
A.3.2.5 DOE Space Allocation
The elimination of excess facility capacity is an ongoing effort at all DOE programs. Eliminating excess facilities (buildings) to offset new building construction (on a building square foot basis) frees up future budget resources for maintaining and recapitalizing DOE’s remaining facilities.
The LBNE Near Site project has obtained a DOE Space Allocation/Space Bank waiver, meaning that there is sufficient elimination of excess facilities capacity elsewhere in DOE labs to offset the new LBNE building square footage. The ultimate applicability of these DOE requirements to the Far Site will be determined as the ownership/stewardship model of the Far Site is determined.
A.4 Surface Buildings
Surface facilities utilized for the WCD include those necessary for safe access and egress to the underground through the Ross and Yates Shafts, as well as that necessary for the WCD-provided water purification and fill system. Existing buildings will be rehabilitated to code-compliance and to provide for the needs of the experiment.
A.4.1 Ross Headframe and Hoist Buildings
The headframe and hoist buildings at the Ross Campus require exterior rehabilitation to provide a warm, usable shell. The Ross Headframe Building will be the main entry point for construction activities as well as the ongoing operations and maintenance functions. The Ross Hoist Building and Ross Headframe are pictured in Figures A–17 and A–18.


The rehabilitation work includes installation of fire suppression systems, improved lighting and heating, and miscellaneous plumbing and power upgrades.
A.4.1.1 Architectural
No architectural improvements are planned for the Ross Headframe and Hoist rooms. Some repairs are required for the metal sheathing of the headframe, and the brick for the hoist building requires tuckpointing.
A.4.1.2 Structural
The Ross Headframe was designed and constructed in the 1930’s. The design at that time did not take into consideration the potential for the shaft conveyance to over-travel and get pull against the sheave deck at the top of the headframe. If this occurs, a force equivalent to the breaking strength of the wire rope would be applied in the direction of the hoist room, substantially higher than the typical force in this direction. Current standards require that this load be included in the design of head frames. To address this deficiency in the design, internal reinforcement of the structure will be performed.
The Ross Hoist Building was evaluated during an early phase of design for the DUSEL Project. During this evaluation, the roof was found to have insufficient strength to meet 2009 International Building Code standards. A design for reinforcing this structure was funded by Sanford Laboratory and this roof will be repaired prior to the LBNE Conventional Facility project commencement.
A.4.1.3 Mechanical
The shaft heating system described in Section A.3.1.4 is the only mechanical upgrade associated with either the Ross Headframe or Ross Hoist building.
A.4.1.4 Electrical
The electrical systems in both the Ross Headframe and Hoist buildings will be upgraded as necessary to support fire suppression systems and ensure that these buildings are code compliant.
A.4.1.5 Plumbing
Plumbing modifications for the Ross Headframe and Hoist buildings are described in Section A.3.1.5 and are focused on providing fire protection and water supply for the underground.
A.4.1.6 ES&H
The Ross Headframe and Hoist buildings were investigated for potential environmental contaminants during the DUSEL Preliminary Design. These buildings are free from health concerns related to asbestos, lead based paints, or PCBs. Fire protection is the only upgrade required as described previously.
A.4.2 Ross Crusher Building
The existing Ross Crusher Building, as shown in Figure A–19, is a high bay space that contains rock crushing equipment that will be used for construction operations.

The exterior of the building will be repaired to create a warm, usable shell. The upgrade of the existing crusher equipment is part of the waste rock handling work scope and not part of the building rehabilitation.
The rehabilitation work includes installation of fire suppression systems, improved lighting and heating, and miscellaneous plumbing and power upgrades.
A.4.3 Ross Dry
The Ross Dry building is in use by the Sanford Laboratory to provide office and meeting space in addition to men’s and women’s dry facilities. A portion of an existing meeting space within this building will be modified to allow the installation of a control room for facility control. The exterior of the Ross Dry is shown in Figure A–20.

A.4.4 Yates Headframe and Hoist Building
The headframe and hoist buildings at the Yates Campus require exterior rehabilitation to provide a warm, usable shell. Since the Sanford Laboratory site is listed in the National Register of Historic Places, rehabilitation work will need to take into consideration appropriate standards and be coordinated with the State Historic Preservation Office. The Yates Headframe Building will be the main entry point for WCD experiment installation and operations, therefore staging of materials to be lowered underground will be done here. The Yates Headframe and Yates Hoist Buildings are pictured in Figure A–21 and A–22.
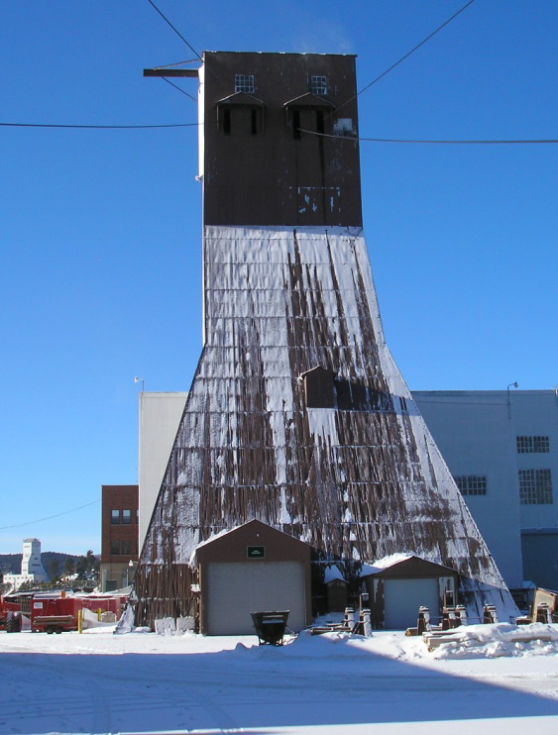
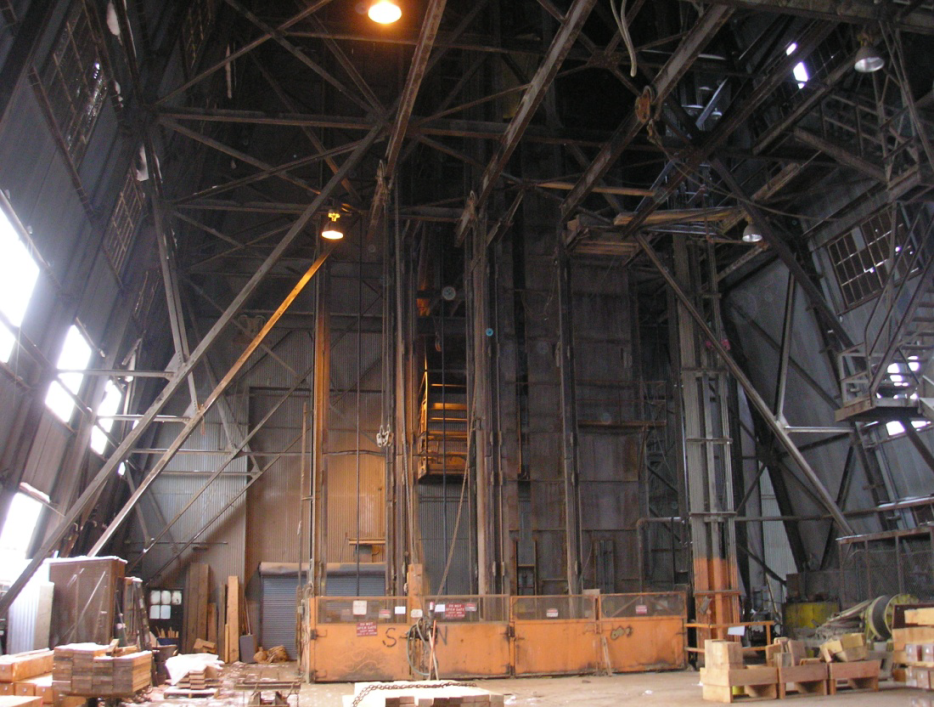
A.4.4.1 Civil
No civil improvements are anticipated for either the Yates Headframe or Yates Hoist buildings. New foundations will be installed by the Sanford Laboratory for a rope dog tower being installed in 2012. Additional civil foundation work may be identified for structural reinforcement of the headframe described in Section A.4.4.3.
A.4.4.2 Architectural
The Yates Headframe and Hoist buildings are perhaps the most recognizable buildings in the area from a historical perspective. This requires enhanced sensitivity to historical preservation in these buildings. No significant modifications to the architecture of either building are planned.
A.4.4.3 Structural
During the DUSEL Preliminary Design, the Yates Headframe was assessed by G.L. Tiley to determine its capability to withstand a rope break load in the event that the conveyance became stuck at the top of the headframe with the hoist still operating. This assessment highlighted required structural reinforcement similar to that required for the Ross Headframe.
The Yates Hoist Building has been evaluated and minor roof strengthening is required in this building to meet current codes. A final design for this work has been provided to the Sanford Laboratory and construction will be completed prior to LBNE Conventional Facility project commencement.
A.4.4.4 Mechanical and Plumbing
The Yates Headframe will house two new mechanical/plumbing installations, fire pumps and the shaft heating system. The layout of these installations is shown in Figure A–23.

In addition to this, a new water line will be installed to deliver water through the shaft to the underground spaces.
A.4.4.5 Electrical
No significant electrical upgrades are required for either the Yates Headframe or Hoist buildings. System will be upgraded as necessary for code compliance, and new conductors and controls will be installed for the fire pumps and AHUs.
A.4.5 Yates Crusher Building
The water fill system will be housed in the Yates Crusher Building, which has adequate space for the fill system equipment. The water fill and purification system at the surface will be designed and provided by the experiment. The equipment requires 4,775 square feet and a 20 ft minimum inside height. Adjacent to the fill system will be an external 10,000-gallon brine tank that needs space for truck deliveries. The system will be served by the Lead municipal industrial (i.e. non potable) water supply to the Yates Campus, and the purified water will be routed down the Yates Shaft. In addition, the Yates Crusher Building will house the new fire pump for the Yates Campus as well as a new mezzanine on which new shaft heating equipment will be placed. The building will require a new floor infill at an existing floor pit, as well as upgrades to the exterior of the building to create a warm, usable interior. Layout of the building showing the water fill system is in Figure A–23. The interior of the building where the equipment would be placed is shown in Figure A–24.

The rehabilitation work includes installation of a new roof, fire suppression systems, improved lighting and heating, and miscellaneous plumbing and power upgrades.
A.4.6 Yates Dry Building
The Yates Dry Building will house the WCD experiment and facility monitoring and control room. The experiment requires a 200-sf control room which can be easily housed in the existing Yates Dry, just to the south of the Yates Administration Building. Space will contain computer monitors and racks. Modest fit-out of this space will be required. Figure A–25 shows how the control room would fit into the existing Yates Dry on the upper level.

A.4.7 Temporary Installation Offices
The WCD experiment requires 4,000 square feet of office space during experiment installation. As this is not a permanent space requirement, the current plan is to utilize temporary mobile office trailers that will be staged on the Upper Yates Parking Lot and will be provided for two years by Conventional Facilities. This will provide the greatest flexibility for site usage, and timing without placing an increased demand on the limited existing facilities, the project schedule, or construction sequencing.
A.5 Underground Excavation
The main excavated spaces necessary to support the WCD experiment are a combination of excavations required for the experiment and those believed to be required for constructability. Experimental spaces on 4850L include the detector cavern, two utility drifts, main access drift, secondary egress drift, AoR, plus a sump pit on 5117L. Spaces identified as likely necessary for the excavation subcontractor include a mucking drift from 4850L to 5117L and spaces near the Ross Shaft to enable waste rock handling. All spaces are identified on the Conceptual Design excavation drawings produced by Golder Associates in September 2011[82]. The spaces are pictured in Figures A–26 and A–27.


LBNE Conceptual Design is based on several geotechnical investigations conducted through the DUSEL Project by Golder Associates between 2008 and 2010 at the 4850L Campus. The geological/geotechnical characterization is taken from that work, which was for a larger scope at that time. The investigative work is summarized in the Golder Associates reference design report dated September 30, 2011[78].
A.5.1 WCD Cavity
The required experimental spaces were defined through interaction with the WCD design team[16]. The size and depth of the WCD cavity was prescribed to suit the scientific needs of the experiment. The nominal 200 kTon detector size is shown graphically in Figure 2–2. The WCD will be housed in a large underground cavity at 4850L. Siting deep underground is required to shield the detector from cosmic rays[9]. The 4850L level is deeper than what is absolutely required, but is used because of existing access and related infrastructure at this level.
The limits on size for the detector are determined by rock strength, clarity of the water, and by maximum hydrostatic pressure that may be applied to submersed photomultiplier tubes. Spaces occupied by the vessel wall, liner, and photomultiplier tubes (PMTs) reduce the total volume to the fiducial volume needed to satisfy the physics requirement for the detector mass. Current assessment of rock quality indicates that an excavated cavity diameter of 65 m is achievable with sufficient rock support. LCAB concluded in its April 2011 meeting that, “A combination of favorable rock mass strength and structural conditions and an in situ stress field that is reasonably benign means that a stable 65 m diameter 97 m high vertical cylindrical cavity with a dome-shaped roof can be constructed at the selected location on 4850 level of the [former] Homestake mine”[83].
Preliminary modeling of the proposed excavations included 2D and 3D numerical modeling. The intact rock strength and joint strength had the greatest impact according to the 2D modeling, and 3D modeling confirmed that the domed right-cylinder cavity to be the most favorable geometry.
The WCD cavity will be excavated using modern drill and blast techniques, in phases from the top down. Excavation access to the crown of the cavity will be via an exploration drift ramp constructed as part of the geotechnical investigation. This drift will begin from the West Access Drift on 4850L through the planned utility drift and end in the crown of the WCD cavity. The mucking drift from 4850L at the Ross Shaft to the bottom of the WCD cavity at 5117L will be excavated to the center of the cavity. Then a raise bore will be pulled to the crown. The dome and can portions of the cavity will be excavated in lifts, with ground support installed as excavation progresses. Given the size of the WCD cavity excavation, the presence of structural features, potential for overstress zones and critical requirements for long-term stability, special attention will be paid to controlled drilling and precision blasting techniques. This will minimize overbreak and create smooth, stable walls as much as possible, which is also essential for the WCD liner to be installed as part of the experiment.
The WCD cavity and drifts will be supported using galvanized rock bolts/cables, wire mesh, and shotcrete for a life of 30 years. The floor of the cavity will also be supported to resist uplift and provide a stable surface for detector equipment. Figure A–28 illustrates the ground support conceptual design, as detailed in the Golder Associates design report and Golder drawing WCD-G3P-LC1-1.
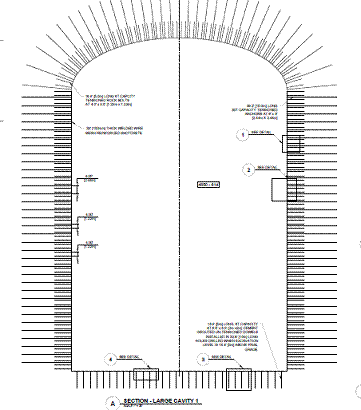
A groundwater drainage system will be placed behind the shotcrete in the arch and walls of the WCD cavity rock excavation. This drain system is comprised of a membrane fabric will collect groundwater (native) seepage and eliminate the potential for hydrostatic pressure build-up behind the shotcrete. Channels will be placed in the concrete floor mud-mat to drain groundwater to the WCD sump system.
To seal the opening at the bottom of the WCD cavity, a conceptual design was done for a flat-wall bulkhead with a high pressure water-tight access hatch at the 5117L drift at the bottom of the cavity. The bulkhead will be installed at the end of the access drift 5117-601 providing a hydraulic barrier between the drift and the WCD, as depicted in Figure A–29.
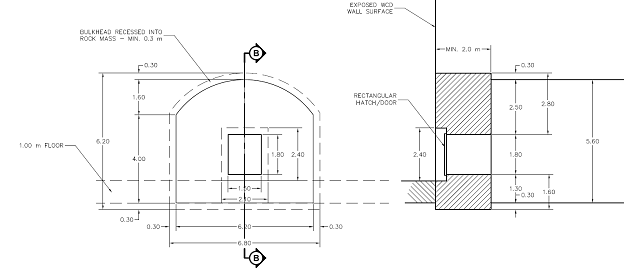
It is designed[84] to withstand the hydraulic head of 85 mwe. The conceptual bulkhead design is an internal hatch with a rectangular opening, which utilizes water pressure to improve the seal between the door and the opening, i.e., reduces stresses on the latching mechanism which is likely to result in a simple, safe design. The access hatch allows for future access at this level for maintenance.
WCD Drifts
WCD experiment requires spaces for experimental equipment outside of the cavity. These requirements have been combined with that for the MEP utilities to create the utility drifts 4850-636 and 4850-625. These drifts will house the experiment’s water recirculation system, electrical equipment to supply power for facility and experiment needs, sump pump access and controls, fire sprinkler room, and exhaust ducting from the cavity to the East Access Drift. Drift 4850-636 will have a steel mezzanine to increase the space available for equipment, which will be provided by the conventional facilities. The water system layout was coordinated with the underground infrastructure design team and is shown in Figure 6–4 in schematic format. This drift is sized to allow for additional equipment during experimental upgrades in the future. Specifically, this would allow for management of gadolinium in the water to enhance scientific capabilities.
The sump pump pit for WCD cavity will be outside the cavity at 5117L. The pit will be a repurposed excavation from the mucking operation, and fashioned to meet the long-term pumping needs. The pit is sized for containment of leak water from the WCD as well as native water leakage from behind the shotcrete. At the base of the Ross Shaft, an electrical switchgear room is necessary for power distribution at 4850L. More information on utility requirements and designs can be found in Section A.6 of this Appendix.
A.5.2 Access/Egress Drifts
The primary experimental access to and egress from the underground will be via the Yates Shaft, due to its proximity to the location of the WCD cavity at 4850L. The existing West Access Drift will be enlarged to accommodate installation of additional utilities, since this drift will become a main egress passageway for secondary exiting to the Ross Shaft. Secondary egress from the cavity to the West Access Drift will be via the WCD Egress Drift 4850-618.
Life safety requirements also dictate provision for areas of refuge at specific locations throughout the occupied areas. AoRs are provided at the base of the Yates and Ross shafts, the West Access Drift, and the WCD Egress Drift.
A.5.3 Excavations Necessary for Construction
Several spaces are shown on the excavation drawings that are not required by WCD experimental needs, but are believed to be necessary for the excavation activities. These may not be constructed exactly as shown, but represent one method of accomplishing the excavations, and thus provide a means to understand the scope and estimate and schedule the work properly. The spaces are the mucking drift 5117-601 from the bottom of the WCD cavity to the Ross Shaft, the powder and cap magazines (4850-691, 4850-692), and several spaces for waste rock handling and underground equipment near the Ross Shaft.
A.5.4 Interfaces between WCD and Excavation
There are several points at which the experiment and the facility interface closely. These are managed via discussions between WCD design team and the CF L3 managers and design contractors. The major programmatic elements of the WCD deck design are shown in Figure 2–9.
-
The WCD liner and magnetic compensation coils are applied directly over the shotcrete, so the smoothness of the shotcrete and stability of the excavation walls and floor are important to the experiment.
-
The WCD deck is supported from the cavity roof via 50-ton cable bolts installed by the excavation contractor, as well as corbels along the side walls.
-
The utility drifts to house the water system are directly influenced by the size of the water system equipment.
A.6 Underground Infrastructure
The requirements for underground infrastructure for the LBNE Project will be satisfied by a combination of existing infrastructure, improvements to those systems, and development of new infrastructure to suit specific needs. The Project assumes that the only other tenant underground at Sanford Laboratory for which infrastructure is required is the existing Davis Campus experiments.
The systems will support the WCD experiment installation and operations, the Conventional Facilities (CF) designed to support the experiment, and the CF construction activities. In general, excavation construction requirements exceed other infrastructure requirements and govern over experiment installation and other CF construction needs.
Some of the Sanford Laboratory infrastructure that requires upgrading for LBNE will be rehabilitated prior to the beginning of LBNE construction funding. This work is important for LBNE, but is considered not part of the LBNE Project scope. This includes Ross Shaft rehabilitation, Yates Shaft rope dog installation, Hoist Buildings’ roof strengthening, and Headframe Buildings’ structural upgrades. This work is expected to be performed using non-project funding, and is discussed below and elsewhere in this CDR as it is pertinent to the LBNE Project.
The conceptual underground infrastructure design for WCD were coordinated by Sanford Laboratory and performed by several entities. Arup’s scope includes utility provisions and fire/life safety (FLS) strategy, covering infrastructure from the surface through the shafts and drifts, to the cavity excavations for the experiment. Utility infrastructure includes fire/life safety systems, permanent ventilation guidance, HVAC, power, plumbing systems, communications infrastructure, lighting and controls, per the experimental utility requirements provided by WCD and through coordination with LBNE, Sanford Laboratory and the excavation and surface design teams. The design is described in Arup’s Conceptual Design Report for WCD at 4850L[85]. This chapter summarizes the work done by Arup and utilizes information from that report.
Shaft rehabilitation and waste rock handling design were previously provided by Arup for the DUSEL PDR. This chapter uses excerpts from the DUSEL Preliminary Design Report, Chapter 5.4. The research supporting this work took place in whole or in part at the Sanford Laboratory at Homestake in Lead, South Dakota. Funding for this work was provided by the National Science Foundation through Cooperative Agreements PHY-0717003 and PHY-0940801. The assistance of the Sanford Laboratory at Homestake and its personnel in providing physical access and general logistical and technical support is acknowledged.
A.6.1 Fire/Life Safety Systems
Life safety is a significant design criterion for underground facilities, focusing on events that could impact the ability to safely escape, or if escape is not immediately possible, isolate people from events underground. Design for fire events includes both preventing spread of fire and removing smoke through the ventilation system.
Life safety requirements were identified and the design developed by Arup, utilizing Sanford Laboratory codes and standards, including NFPA 520: Standard on Subterranean Spaces, which requires adequate egress in the event of an emergency. Facility fire detection and suppression systems, as well as personnel occupancy requirements are defined in accordance with NFPA 101: Life Safety Code. The design was reviewed by Aon Risk Solutions[86].
Based on data provided by Sanford Laboratory the maximum occupant load of the WCD is 82 occupants which includes 42 underground operations staff and 40 science staff (during installation). In addition there will be 9 science staff associated with the Davis Cavity. The total operations occupant load at 4850L is 91 occupants which will be used to size the Yates and Ross Shaft AoRs at 4850L.
Compartmentation will be needed for egress routes to separate them from adjacent spaces to limit the horizontal and vertical spread of fire and smoke. Use of compartmentation will help to reduce the likelihood of fire spreading from the area of fire origin to other areas or compartments. Compartmentation will also help limit the spread of other materials such as cryogenic gases, leaks and spills. This results in design criteria of minimum 4-hour fire separation between the WCD cavity and adjacent drifts, while all rooms that connect directly to the egress drift at 4850L, as well as the shafts, will have 2-hour minimum fire separation.
In addition to the fire/life safety systems described above, LBNE in conjunction with Sanford Laboratory determined a requirement for a temporary fire suppression system during the time period from the start of detector liner installation through the start of filling the detector with water. This requirement is due to the lack of fire retardant chemical in the detector PMT cabling and the potential combustibility of the liner material. The conceptual design of this system includes a fire mist system for which there is a deployed piping network that protects all necessary large cavity surfaces.
A.6.1.1 Egress and Areas of Refuge
The evacuation strategy for occupants at 4850L is to egress directly to the Yates Hoist/Cage (or Ross Hoist/Cage if the Yates Shaft is not working or inaccessible) to evacuate to grade. If occupants are subjected to untenable conditions within the egress route, then they will need to evacuate to the alternate hoistway/cage or to their nearest AoR. There will be a minimum of two ways out of the WCD cavity and areas of high hazard. Once in a drift (exit route) there will be at least two directions to escape from any location leading to a choice of exit hoist/cage.
AoRs provide a protected environment for occupants during an emergency event, such as a fire or cryogen leak. AoRs are strategically located within 4850L such that the travel distance to an area of refuge is limited to within the NFPA 520 maximum travel distance of 2,000 ft. AoRs are to be located at each of the hoistways/cages (i.e. Yates Shaft and Ross Shaft), where people are working (i.e. WCD cavity), and intermittently throughout 4850L (i.e. within the drifts). AoR area calculations use a baseline area of 10 sf/person, derived from NFPA 520.
A.6.1.2 Emergency Systems
Systems will be installed to facilitate egress for life safety and protect personnel and equipment during emergencies. This includes fire suppressions systems, smoke control, alarm and detection systems, two-way voice communication, and emergency lighting. The details of these systems are described in the sections below.
A.6.2 Shafts and Hoists
The Ross and Yates Shafts provide the only access from the surface to the underground, and are therefore critical to the function of the Facility. Both shafts provide service from the surface to 4850L, though not every intermediate level is serviced from both shafts. The shafts also provide a path for all utilities from the surface to the underground.
The Ross and Yates Shafts were both installed in the 1930s and have operated since installation. These shafts, along with their furnishings, hoists, and cages, were well maintained during mining operations, but have experienced some deterioration as described in this section. A complete assessment of the Ross and Yates shafts was conducted for the DUSEL Project, and is documented in the Arup Preliminary Infrastructure Assessment Report (DUSEL PDR Appendix 5.M). The designs developed as part of the DUSEL PDR are applicable to the WCD experiment at 4850L, and are described below as excerpted from the DUSEL Preliminary Design Report, Chapter 5.4, Underground Infrastructure Design, and edited to include only information as it is relevant to the development of the LBNE Project.
A.6.2.1 Ross Shaft
The Ross Shaft will be used for facility construction, including waste rock removal, and routine facility maintenance, access to other levels and ramps (OLR), and secondary egress path for the finished underground campuses. It will not be used for WCD experiment primary access.
The Ross Shaft is rectangular in shape — 14 ft 0 in (4.27 m) by 19 ft 3 in (5.87 m), measured to the outside of the set steel. The shaft collar is at elevation 5,354.88 ft (1,632.17 m) and 5000L is the bottom at elevation 277.70 ft (84.64 m) above sea level. Service is provided to 28 levels and three skip loading pockets. The shaft is divided into seven compartments: cage, counterweight, north skip, south skip, pipe, utility, and ladder way. Figure A–30 shows the shaft layout.

The Ross Shaft was in operation until the Homestake Gold Mine closed in 2003. Deterioration through corrosion and wear on the shaft steel, including studdles (vertical steel members placed between steel sets), sets, and bearing beams, is evident today. Detailed site investigations were conducted by Arup for the DUSEL PDR through its subcontractor, Tiley. The results of their investigations are included in Section 3.4 of the Arup Preliminary Infrastructure Assessment Report (DUSEL PDR Appendix 5.M). Based on their visual assessment, the findings indicate that as much as 50% of the steel furnishings will need to be replaced to enable full operation of the shaft to be restored.
The production and service hoists at the Ross Shaft are located on the surface in a dedicated hoistroom west of the shaft. The service hoist operates the service cage and the production hoist operates the production skips. The DUSEL PDR describes the condition assessment of the electrical and mechanical hoisting systems which are described in detail in the Arup Preliminary Infrastructure Assessment Report. The Ross Headframe steel requires some strengthening and modifications to meet code requirements.
The Ross Shaft will not be significantly modified from the existing configuration. The requirements for this shaft are safety, performance, and code driven and defined by the existing configuration. This shaft will be used for construction, including waste rock removal, and routine facility maintenance, access to other levels and ramps (OLR), and secondary egress path for the finished underground campuses. It will not be used for WCD experiment primary access. The shaft rehabilitation and headframe work is planned to be executed by Sanford Laboratory with non-LBNE Project funds prior to the start of LBNE construction.
A.6.2.2 Yates Shaft
The Yates Shaft is rectangular in shape — 15 ft (4.572 m) by 27 ft 8 in (8.433 m) measured to the outside of the set timbers. There are two cage compartments and two skip compartments as shown in Figure A–31.

In addition to the cage and skip compartments, there are two other compartments in which shaft services are located. The shaft collar is at 5,310.00 ft (1,618.49 m) elevation and 4850L is the bottom level at elevation 376.46 ft (114.75 m) above sea level. Service is provided to 18 levels plus two skip-loading pockets. Sets are made up of various length and size timbers located to maintain compartment spaces. The Yates Shaft is timbered except for a fully concrete-lined portion from the collar to 300L. Recent repairs include full set replacement from the concrete portion to 800L and additional set repair below this level where deemed critical.
Finite Element Analysis (FEA) modeling by G.L. Tiley[87] showed that a dogging load produced by the cage would require vertical joint reinforcement, guide connection modifications, and additional new bearing beam installations. A dogging event occurs when emergency stop devices, called dogs, dig into the guides to stop the cage if the wire rope loses tension. The east and west wall plates are divided into two pieces, making the removal of a timber divider to make room for the Supercage structurally unsecure. Based on these factors, the support system in the Yates will only be used until it can be replaced.
The timber in the Yates Shaft, even if substantial repairs to the current conditions were made, presents a fire risk and has high maintenance requirements. The re-equip options studied during the DUSEL Project Preliminary Design included a completely concrete-lined shaft compared with installing new steel sets attached to concrete rings spaced on 20 ft (6.1 m) intervals vertically with shotcrete applied between rings. Although providing another degree of reduced maintenance, the fully concrete-lined shaft was not chosen due to cost. The concrete ring design was also not chosen following the DUSEL preliminary design due to the installation process required.
Similar to the Ross Shaft, there is both a production and service hoist at the Yates Shaft. The configuration of the hoists for the Yates Shaft is nearly identical to that of the Ross, with the only difference that the rope size for the production and service hoist are the same at the Yates. The Yates Shaft Hoists are located on the surface in a dedicated hoistroom east of the shaft.
The Yates Service Hoist and Production Hoist are planned to be used as existing, with maintenance performed to bring them into like new condition. The production hoist will no longer be used for material removal, but will be re-purposed to provide a secondary conveyance system to the underground. This enhances access, as well as providing secondary egress from the shaft if the primary conveyance is unavailable. Further details regarding the condition of the Yates Hoists’ electrical and mechanical condition can be found in Section 2.2 of the Arup Preliminary Site Assessment Report (DUSEL PDR Appendix 5.M).
Figure A–31 shows the original Yates Shaft timbered layout. Figure A–32 shows the new arrangement with steel members.
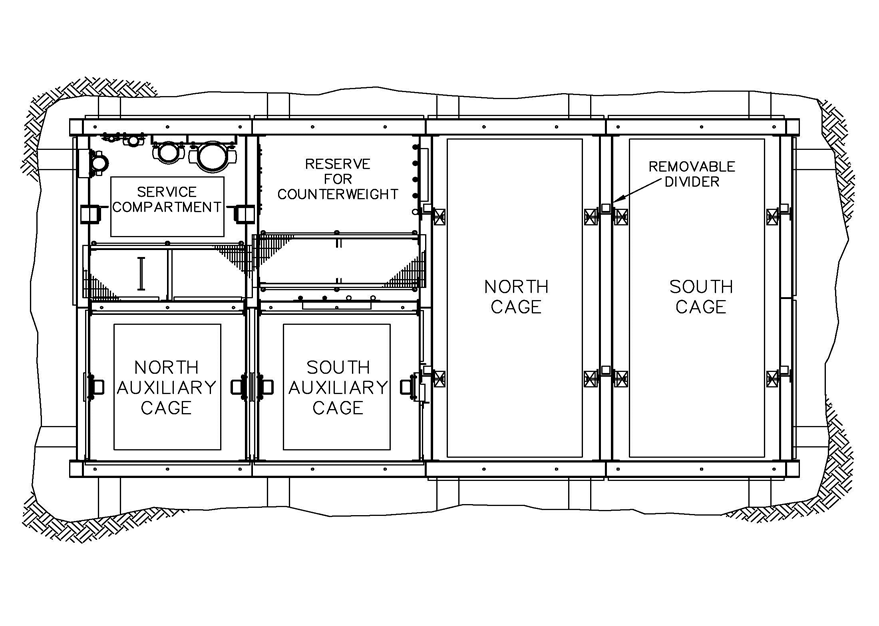
The design shown in Figure A–32 is a modified version of a design prepared prior to mine closure and provides a basic concept for the design to be utilized. The design shown would replace the timber spaced at 6-foot centers with steel at 18-foot centers for the length of the shaft. It would allow for the divider between the North and South Cages to be removed at a future date to allow for a single cage to be installed with slightly over twice the width of the two existing cages. The replacement of timber with steel would be done by Sanford Laboratory personnel over a period of several years. During this time, secondary egress through this shaft requires maintaining the configuration as shown, with compartments and guides aligned with the existing timber. This secondary egress could be made available within hours of a need. Removing the divider during rehabilitation would not allow the work platforms to pass from the new guides to the old guides to provide this ease of secondary egress. Another incentive for not removing this divider initially is the requirements for modification to the headframe to relocate the sheave guiding the wire rope, and modification to the hoist to allow for a higher load capacity with the larger conveyance.
Ground support in the Yates Shaft currently consists of wood lacing around the perimeter of the shaft to prevent spalled rock from entering the occupied compartments. This ground support would be replaced with modern pattern bolting and screening to both control the ground and prevent material from entering the compartments.
A.6.3 Ventilation
The ventilation system will utilize the existing mine ventilation system as much as possible with minimal modifications. Fresh air for the WCD cavity and the utility drifts will be provided by pulling air directly from the adjacent West Access Drift, which is supplied from the Yates and Ross Shafts. Air will be exhausted from the WCD cavity and utility drifts to the East Access Drift, and then pulled out through the existing Oro Hondo exhaust vent. The 100,000 CFM design exhaust is sized for smoke extraction. The flow is shown in the Figure A–33.
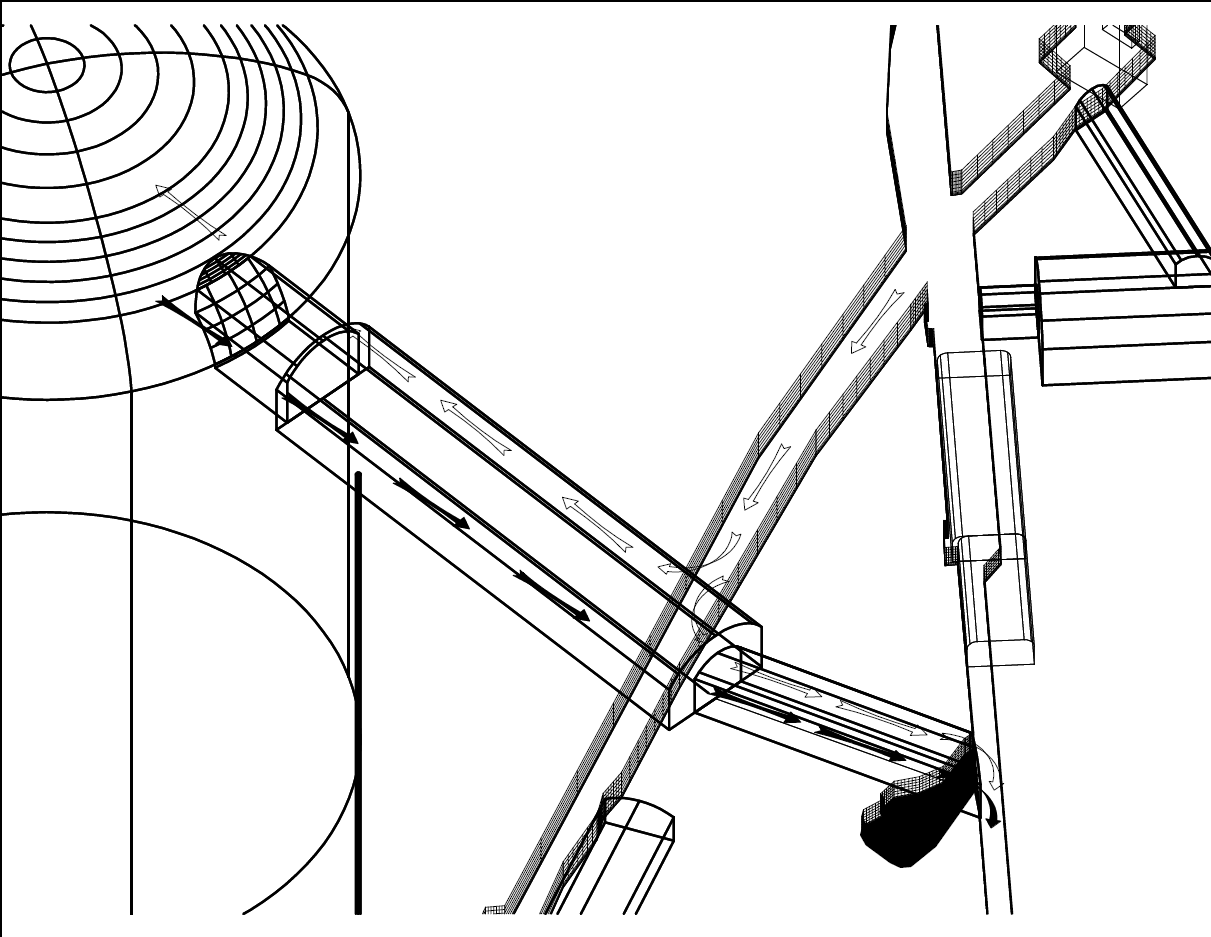
The environmental design criterion for WCD underground spaces is shown in Table A–4.
| Room | Temp | Humidity | Air Changes | Occupancy |
|---|---|---|---|---|
| (during assembly) | ||||
| Large Cavity | 40–82 ∘F | 15–85% | 1 | 20 |
| (10–28 ∘C) | (50) | |||
| Access Drifts | Min 50∘F | Uncontrolled | Transient | |
| (10∘C) | space | |||
| Utility spaces | 50–95 ∘F | Uncontrolled | 1 | |
| Electrical rooms | (10–35 ∘C) | |||
| Areas of Refuge | 68–78 ∘F | Uncontrolled | Min 20 | Room |
| (20–25.6 ∘C) | cfm/person | Dependent | ||
| Storage Rooms | 59–104 ∘F | Uncontrolled | Min 15 | Room |
| (15–40 ∘C) | cfm/person | Dependent |
A note on the large cavity entry: temperature, humidity and filtration requirements in localized areas of this space may differ, dependent on requirements. This will be provided by the experiment installation design team. The internal conditions stated above will be used to inform the design of plant and services for each space unless specific requirements that differ from this are provided by LBNE/Sanford Laboratory or the lab experiment design teams.
The WCD experimental spaces do not require air conditioning or humidification. The drift temperatures are low enough that adequate cooling can be attained by a once through air only system (untreated air). Much of the experimental equipment will be directly water cooled by experiment-provided systems, and the heat rejected by that cooling system which will be integrated into the overall mine ventilation air flow scheme.
Per historical data, outdoor temperatures can drop to F, therefore the intake air will require heating to prevent ice will build up in the shafts which could potentially disrupt hoisting operations and damage shaft support members, cables and piping. Heating requirements will be calculated based on the induced airflow volumes at Ross and Yates obtained from the mine ventilation calculations. The heating systems are designed as part of the surface facilities and not underground infrastructure.
The HVAC systems will be controlled and monitored via Direct Digital Controls (DDC), through the Facility Management System.
A.6.4 Electrical
The underground facilities at 4850L will have electrical power for normal operations as well as standby power for emergency occupant evacuation. WCD experiment power does not require standby power.
A.6.4.1 Normal Power
The electrical systems both at the surface and underground are designed to meet International Building Code and applicable portions of the National Electric Code and National Electric Safety Code. Underground portions also comply with National Fire Protection Code (NFPA) 520, which is specifically intended for underground facilities.
The estimated electrical loads for both the WCD experiment and the underground infrastructure serving the experimental spaces are included in the facility load determination and design. These loads are shown in Tables A–5 and A–6.
| Item | Electrical Load | Notes |
|---|---|---|
| LC Water (PMT-HV) | 3 kW | August 12, 2011 Table 1-200 |
| LC-Deck | 138 kW | August 12, 2011 Table 1-200 |
| LC-Balcony | 88 kW | August 12, 2011 Table 1-200 |
| Crane | 6 kW | |
| Total Estimated Detector Power | 235 kW | |
| With 20% Uncertainty factor | 282 kW | 20% based on LBNE requirements |
| Item | Electrical Load | Notes |
|---|---|---|
| Detector Lighting — assuming 1w/sq.ft. | 32 kW | |
| Drift Lighting — assuming .5w/sq.ft. | 45 kW | |
| Exhaust Fans | 63.4 kW | |
| Water System | 351 kW | August 12, 2011 Table 1-200 |
| Sump Pump @ 5117 Level for experiment | 127 kW | August 12, 2011 Table 1-200 |
| Sump Pumps for 4850 level drainage system | 75 kW | |
| Utilities in Drift | 694 kW | August 12, 2011 Table 1-200 |
| AoRs — anticipate total load | 76 kW | 100% PDR typical AoR. |
| Fire alarm | 2 kW | |
| Communication | 12.5 kW | |
| Security (future place holder) | 12.5 kW | |
| Total Infrastructure Power | 1490.4 kW | |
| 20% Spare factor | 1788.5 kW | |
| Total Load — Detector + Infrastructure | 2070.5 kW | Includes 20% spare factor |
| Total Load assuming .9 Power Factor | 2300.5 kW |
Power to serve the WCD experiment will originate from the Ross substation and routed down the Ross shaft to 4850L. One 15-kV mining cable shall be installed down the Ross Shaft to 4850L and will be cable rated for mine use, highly flame retardant, low smoke toxicity with high tensile strength and self-supporting. At 4850L, the 15-kV mining cable will terminate in 15-kV switchgear located in the substations.
Varying voltages will be distributed at strategic locations at 4850L for use by WCD and the facilities. To conserve space within the drifts, armored cable with low smoke properties will be used to distribute normal power wiring throughout 4850L.
The WCD experiment equipment will have a dedicated shielded transformer to serve the detector electronics at 208V/120V. In addition, WCD mechanical equipment will be fed from a dedicated transformer. On the mezzanine platform structure installed in the WCD utility drift, electrical panels and small transformers will serve equipment operating in the WCD cavity.
In order to preserve the possibility of upgrading the WCD experiment in the future, provision has been made to provide power for future pumps at specific levels in the shafts with this initial installation, since work will already be going on in the shaft. Dedicated feeders originating from either the 1700 level or 4100 level substation will serve the POGO pumps, which would be installed in the future.
A.6.4.2 Standby Power
Surface level generator sets, provided under the surface facilities and located near the Ross shaft will be installed to provide standby power for life safety. The following 4850L electrical loads are anticipated to be connected to the standby power system: emergency lights, exit signs, 4850L AoRs, fire alarm, security, and IT System for communications.
There will be one multi conductor 15-kV mining armored cable, with low smoke properties, installed down the Ross Shaft from the surface level standby generation system to provide standby power at the 4850L. A redundant, 15-kV multiconductor armored mining cable will be installed down the Yates Shaft to 4850L to provide a redundant path for standby power. The two 15-kV standby feeders will be tied together at 4850L through sectionalizing switches.
A.6.4.3 Fire Alarm and Detection
The 4850L level will have notification devices installed to alarm the occupants of a fire. Notification devices will consist of speakers and strobe lights. Manual pull stations will be provided at each egress and within 200 ft of egress. Phones will be installed in the AoRs to communicate with the Command and Control Center. An air sampling and gas detection system will be installed in the drifts and WCD cavity as an early detection of a fire condition. The air sampling system will be connected into the fire alarm system.
A.6.4.4 Lighting
Suspended lights mounted at a height just below the lowest obstruction will be provided for all drifts and ramps. Mounting is to be coordinated with conduit and supports of other systems running overhead. Maintained average illumination of approximately 24 lux (2.4 foot-candles) at floor level will be provided throughout the drifts. Lighting control in drifts will be via low voltage occupancy sensors and power packs suitable for high humidity environments.
Lighting within equipment rooms will be UL Wet Location rated, watertight fluorescent fixtures. Exact layouts will be coordinated with final equipment at future design stages. Lighting control in equipment rooms will be via switch only, avoiding possibility of unexpected lights-off triggers.
All light fixtures within the WCD cavity will be UL Wet Location rated watertight industrial high-bay type LED fixtures. Low voltage wiring will be oversized according to distance to avoid voltage drop from remote drivers to the fixtures. Average illumination levels at 0.7 m above WCD work deck is assumed to be between 100 and 150 lux (10–15 foot candles). All light fixtures will be controlled through a networked lighting control system allowing switching of multiple zones or circuits from multiple locations, and time schedule or other automated functions. Emergency light fixtures will be provided with 90 minute battery backup from a centralized system.
A.6.4.5 Grounding
The grounding system will be designed for a resistance of 5 , to provide effective grounding to enable protective devices to operate within a specified time during fault conditions, and to limit touch voltage under such conditions. A dedicated grounding cable will be distributed from the respective level substation ground bars to the water detector chamber and from there to individual items of equipment and distribution board.
A.6.5 Plumbing
Several water systems are required for the experiment and the facility operations underground. All have as their origin the Lead municipal water service to the Sanford Laboratory. The requirements, routing, and use are described below.
A.6.5.1 Domestic Water
An 8-inch potable water line will run down the Yates Shaft from the surface to 4850L. It is not feasible to run an uninterrupted main water supply line from grade level down to serve the lower levels due to the extremely high hydrostatic pressure that would occur in the system. A series of pressure reducing stations will be located at regular intervals in intermediate levels in order to maintain the pressure within the capability of readily available piping. Each pressure reducing station will have 2 pressure reducing valve assemblies (PRVs), 1 duty, and 1 standby. On either end of each PRV, there will be a pressure transmitter which controls a motorized valve. Both the pressure transmitter and motorized valve will be tied to the Facility Management System. Pressure reducing stations will be located adjacent to the Yates shaft at 800L, 1700L, 2600L, 3500L, 4100L and 4850L.
A domestic water double compartment storage tank will be located at 4100L in an existing drift. Water will be supplied to the tank from the potable water service downstream of the PRV at 4100L. Downstream of the PRV, the 8-inch potable water line will split to serve the domestic water tank and the fire water system for 4850L. The domestic water storage tank will be 3,000 gallons that will satisfy 91 occupants in either the Yates or Ross AoRs. Domestic water will be supplied to all AoRs, the WCD cavity and all ancillary spaces requiring domestic water.
A.6.5.2 Drainage
Drainage from the drifts, mechanical electrical rooms, and any areas where spillage is likely to occur will be collected locally in open sumps. Sumps will be located every 500 ft. throughout the West drift, and in any areas where drainage to the drifts is not practical. Sumps will be equipped with sump pumps. This will be a staged system, with each pump discharging to the adjacent sump until water is discharged to the de-watering station near the Ross Shaft at 5000L.
Leaks from the WCD vessel, as well as native water inflow around the WCD, will be collected in a sump located at the base of the WCD at 5117L. A well pump will be located in this sump and will pump water to the drift drainage system at 4850L.
A.6.5.3 Sanitary Drainage
Plumbing fixtures in the AoRs at Ross and Yates Shafts (4850L) will be drained by gravity pipes embedded in the floor slab piped to a vented sewage pit. This pit will be equipped with a manually operated sewage ejector. The sewage ejector will be emptied by the facility maintenance staff into a portable container after a signal from the ejector control panel to the Facility Management System indicates that the sump is full. The sump will be sized to hold all fixture discharges for 96 hours in addition to the normal fixture usage in the facility (i.e. beyond the point where a signal is sent to empty the sump).
An atmospheric vent to the surface is impractical. A 4-inch vent from the sewage ejector will terminate in the nearest appropriate drift. Plumbing fixtures in each AoR will be vented using air admittance valves.
All small AoRs (10–20 occupants) will be equipped with chemical toilets and vented to the nearest drift.
A.6.6 Cyber Infrastructure
A fiber optic backbone provides communications for voice, data, and control of all systems on the surface and underground. Redundancy is built into the fiber-optic backbone by providing multiple cables to communication rooms at strategic locations throughout the site. Two separate backbone cables are routed between communication rooms (CR) along separate, diverse pathways to create a ring topology. Damage to the backbone at any point along the ring will not disrupt connectivity to the communication rooms. This design drastically improves the reliability and fault tolerance of the network systems.
Voice communications are provided via two-way radios and phones distributed throughout the underground spaces (in every room as well as every 500 ft. in the drifts). Two-way radios utilize a leaky feeder system to ensure communications over long distance without line of site. These leaky feeders are cables that act as antennas installed the length of all drifts and shafts. Phones utilize Voice over Internet Protocol to provide communication though the fiber optic data backbone.
The data system is designed to provide 10-Gigabit Ethernet in the backbone and 1-Gigabit Ethernet to connected systems (computers). This system is intentionally left at a lesser level of design due to the continuous progression and advancement of technology that will almost certainly result in more advanced technologies than are currently available being utilized at the time of construction.
A Command and Control Center at the surface will be the primary location for Human Machine Interface with the control system for both the underground mechanical and electrical systems and the experiment. This room will also provide a central location for the asset and personnel tracking system (APTS) included in the design to provide personnel tracking for safety and asset tracking for security using Radio Frequency Identification (RFID) technology to sense when people or assets pass specified areas.
Along with the APTS system, an Asset Control and Alarm Monitoring System provides security through programmable access control points and cameras to remotely control and monitor access to specified areas. This system could use key card technology similar to what is currently in use for security at the site or utilize similar RFID technology to that used for APTS.
The fire alarm and control system will be an isolated system from the remainder of the cyber infrastructure to ensure reliability of this system independent of the control system.
A.6.7 Structural/Architectural
The underground structural work mainly includes a structural steel deck in the WCD Utility Drift 4850-636 to support electrical equipment, experimental operations and make more efficient use of this high space. This deck will be designed as the equipment layout is finalized.
The underground architectural items are limited to cross drift fire separations, including minimum 2-hour fire separation walls and doors. These separations will also assist with directing mine ventilation. These items are shown on the Arup drawings.
A.6.8 Waste Rock Handling
Prior to the commencement of any excavation activities, it will be necessary to complete the rehabilitation of the facility waste rock handling system. The capacity of this system will be equivalent to what was in place during mining. There are a number of components to the Facility waste rock handling system, including refurbishing the Ross Shaft hoisting system, the Ross Shaft crushers, and the tramway; procuring track haulage equipment; and installing a surface conveyor to the Open Cut from the tramway dump.
The design presented here was developed for the DUSEL Project PDR by Arup/Tilley, is described in great detail in the DUSEL Preliminary Design Report, Section 5.4.3.9 and is excerpted here. The systems utilize experience and equipment from the former Homestake Mining Company legacy, where rock was removed to the surface using skips in both the Yates and Ross Shafts. At the headframe of each shaft, the material was crushed to a nominal 3/4 in., passed through ore bins, and was transported via underground rail to the mill system. The underground rail passed through a level called the tramway at approximately 125 ft (38 m) below the collar of the Yates Shaft. The third supply of ore was the Open Cut, where material was transported with haul trucks to a surface crushing system. A pipe conveyor (the longest in the world when it was constructed in 1987) delivered the material overland to the mill system.
During LBNE construction, the excavated waste rock material from the underground will be removed for disposal, with no intention of further processing. The Yates Shaft will primarily provide science access and will be rehabilitated during a significant portion of construction. The Ross Shaft will be the means of removing of material from the underground during construction.
The Ross skipping system allows material to be transported at a rate of 3,300 tons per 18-hour day, allowing six hours of downtime for maintenance, breaks, shift changes, etc. The loading pocket at 5000L for 4850L will be cleaned of any accumulated sand during the skip pocket rehabilitation prior to excavation starting. Several components of the rock removal system require rehabilitation, including the loading system, the skips, the scroll and the bin at the top of the headframe, the crushers, the electrical service equipment, the belt conveyors, and the dust collector. The gates at the base of the fine-ore bin at the tramway level (125 ft [38 m]) below the Ross Shaft collar will be replaced. The existing rail cars are not large enough to meet the cycle times required for construction, but the axles and wheels can be reused with new bodies. New locomotives will be purchased. At the point where the tramway exits the underground, the existing steel-sided building is in disrepair and will be replaced. All other equipment associated with this material handling system, including the original pipe conveyor, has been removed from the site.
The waste rock from the excavation will be relocated to the Open Cut via an overland conveyor, similar to one used during Homestake Mining Company operations, and the design team has been mindful of the impact this activity may have on the local community. The design will accommodate more stringent noise and dust requirements than other portions of the Project may require. In an effort to limit public exposure to this process, all material will be transported through residential areas only during a 10-hour daytime period, which requires a higher design capacity than a 24-hour operation would allow. A limit of 45 dBA at the property boundary has been established to further minimize the public impact. Extreme weather conditions experienced in Lead, South Dakota, must also be considered in the development of design requirements. The route of the waste rock handling system is shown in Figure A–34.

The design excavation volume with allowances for rock support and shotcrete will be approximately 484,000 cubic yards (yd3; 371,000 cubic meters [m3]). Assuming an average of 10.5 in (0.27 m) of combined overbreak and lookout, with a 50% swell factor, the total volume of waste rock is expected to be approximately 749,000 yd3 (573,000 m3). A detailed summary of each excavation volume is provided by Golder Associates[78].
References
- [1] P. Adamson et al., “Improved search for muon-neutrino to electron-neutrino oscillations in MINOS,” Phys. Rev. Lett., vol. 107, p. 181802.
- [2] K. Abe et al., “Indication of Electron Neutrino Appearance from an Accelerator-produced Off-axis Muon Neutrino Beam,” Phys.Rev.Lett., vol. 107, p. 041801, 2011. arXiv:1106.2822 [hep-ex].
- [3] Y. Abe et al., “Indication for the disappearance of reactor electron antineutrinos in the Double Chooz experiment,” 2011. arXiv:1112.6353 [hep-ex].
- [4] F. An et al., “Observation of electron-antineutrino disappearance at Daya Bay,” 2012. arXiv:1203.1669 [hep-ex].
- [5] A. Gando et al., “Constraints on from A Three-Flavor Oscillation Analysis of Reactor Antineutrinos at KamLAND,” Phys.Rev.D, vol. 83, p. 052002, 2011. arXiv:1009.4771 [hep-ex].
- [6] C. Zhang, “Observation of electron-antineutrino disappearance at Daya Bay.” BNL HEP Seminar, 2012. http://www.phy.bnl.gov/~partsem/fy12/DayaBayFirstResult_BNL_20120308.pd%f.
- [7] Particle Physics Project Prioritization Panel, “US Particle Physics: Scientific Opportunities; A Strategic Plan for the Next Ten Years,” 2008. http://science.energy.gov/~/media/hep/pdf/files/pdfs/p5_report_06022008%.pdf.
- [8] LBNE Collaboration, “The 2010 Interim Report of the Long-Baseline Neutrino Experiment Collaboration Physics Working Groups,” 2011. arXiv:1110.6249 [hep-ex].
- [9] A. Bernstein et al., “Report on the Depth Requirements for a Massive Detector at Homestake (LBNE:DocDB-34),” 2009. arXiv:0907.4183 [hep-ex].
- [10] F. Dufour, Precise Study of the Atmospheric Neutrino Oscillation Pattern Using Super-Kamiokande I and II. PhD thesis, Boston University, 2009. http://www-sk.icrr.u-tokyo.ac.jp/sk/pub/fdufour-thesis.pdf.
- [11] V. Barger et al., “Report of the US long baseline neutrino experiment study.” arXiv:0705.4396 [hep-ph], 2007.
- [12] T. Iida, Search for Supernova Relic Neutrino At Super-Kamiokande. PhD thesis, The University of Tokyo, 2009. http://www-sk.icrr.u-tokyo.ac.jp/sk/pub/iida-doctor_edited.pdf.
- [13] Y. Fukuda et al., “The Super-Kamiokande detector,” Nucl. Instrum. Meth., vol. A501, pp. 418–462, 2003.
- [14] J. P. Cravens et al., “Solar neutrino measurements in Super-Kamiokande-II,” Phys. Rev., vol. D, no. 78, 032002, 2008. arXiv:0803.4312 [hep-ex].
- [15] Personal communication.
- [16] J. Dolph, “LBNE Water Cherenkov Detector Requirements,” 2010. LBNE:DocDB-687.
- [17] J. Raff, “Updated Veto Studies.” Presentation at LBNE Collaboration meeting, 2010. LBNE:DocDB-2639.
- [18] J. Raff and E. Kearns, “Do We Want a Veto Region: Initial Studies,” 2009. LBNE:DocDB-460.
- [19] L. Peterson, “WCD Water Containment Vessel.” LBNE:DocDB-3150.
- [20] J. Felde and J. Stavro, “An overview of the Magnetic filed test stand at Davis.” LBNE:DocDB-2926.
- [21] J. Dhooge, J. Felde, and J. Stavro, “Lab tests of Hamamatsu 10 inch HQE in the UC Davis MagLab.” LBNE:DocDB-3678.
- [22] J. Dhooge, “Magnetic Field Studies on 10 in PMT for July 2011 collaboration Meeting PMT Parallel Session.” Presentation at LBNE Collaboration meeting. LBNE:DocDB-3990.
- [23] P. Bourgeios and J. Vavra, “Corrosion of Glass Windows in DIRC PMTs,” 2001. SLAC-PUB-8877.
- [24] L. Pye, H. Stevens, and W. LaCourse, Introduction to Glass Science. Plenum Press, 1972.
- [25] M. Diwan et al., “Underwater Implosions of Large Format Photo-multiplier Tubes,” 2011. LBNE:DocDB-4221.
- [26] R. M. Pope and E. S. Fry, “Absorption spectrum (380–700 nm) of pure water. II. Integrating cavity measurements,” Applied Optics, vol. 36, pp. 8710–8723, 1997.
- [27] J. Boger et al., “The Sudbury Neutrino Observatory,” Nucl. Instrum. Meth., vol. A449, pp. 172–207, 2000.
- [28] P. B. Price and T. Sowers, “Temperature dependence of metabolic rate for microbial growth, maintenance, and survival,” Proc. of the National Acad. of Sci., vol. 101, pp. 4631–4636, 2004.
- [29] B. Blakely. Private communication, 2010.
- [30] Y. Takeuchi et al., “Measurement of radon concentrations at Super-Kamiokande,” Phys. Lett., vol. B452, pp. 418–424, 1999.
- [31] Y. Takeuchi et al., “Development of high sensitivity radon detectors,” Nucl. Instrum. Meth., vol. A421, pp. 334–341, 1999.
- [32] “WCD Water System Physics Requirements.” LBNE:DocDB-196.
- [33] R. Becker-Szendy et al., “A Large Water Cherenkov Detector for Nucleon Decay and Neutrino Interactions,” Nuclear Instruments and Methods, vol. A324, pp. 363–382, 1993.
- [34] The Super–Kamiokande Collaboration, “The Super–Kamiokande Detector,” Nuclear Instruments and Methods, vol. A501, pp. 418–462, 2003.
- [35] M. Ahn et al., “Measurement of Neutrino Oscillation by the K2K Experiment,” Phys. Rev. D, vol. 74, p. 072003, 2006.
- [36] P. Antonioli et al., “SNEWS: The SuperNova Early Warning System,” New J. Phys., vol. 6, p. 114, 2004.
- [37] K. S. Beattie and D. Glowacki, “Searching for Neutrinos Using Python at the Bottom of the World,” in PyCon 2009, 2009. http://us.pycon.org/2009/conference/schedule/event/19/.
- [38] J. Allison et al., “GEANT4 developments and applications,” IEEE Trans. Nucl. Sci., vol. 53, no. 1, pp. 270–278, 2006.
- [39] C. Andreopoulos et al., “The GENIE Neutrino Monte Carlo Generator,” Nucl. Instrum. Methods, vol. A, no. 614, pp. 87–104, 2010.
- [40] “GNUMI NuMI Beamline Simulation Code.” http://www.hep.utexas.edu/numi/beamMC/MC-code.html.
- [41] MINOS Collaboration, “Measurement of Neutrino Oscillations with the MINOS Detectors in the NuMI Beam,” Phys.Rev.Lett., no. 101:131802, 2008.
- [42] LBNE Project Office, “LBNE Science Objectives,” 2011. LBNE:DocDB-4772.
- [43] J. Dolph, “LBNE Global Science Requirements,” 2011. LBNE:DocDB-3781.
- [44] M. Shiozawa, “Reconstruction algorithms in the Super-Kamiokande large water Cherenkov detector,” Nuclear Instruments and Methods, vol. A433, pp. 240–246, 1999.
- [45] R. B. Patterson et al., “The Extended-Track Event Reconstruction for MiniBooNE,” Nuclear Instruments and Methods, vol. A608, pp. 206–224, 2009.
- [46] S. Seibert and A. LaTorre, “Fast Optical Monte Carlo Simulation with Surface-Based Geometries Using Chroma,” 2011. LBNE:DocDB-3945.
- [47] “Condor Batch System.” http://www.cs.wisc.edu/condor/.
- [48] T. Maeno, “PanDA: Distributed Production and Distributed Analysis System for ATLAS,” in CHEP 07, 2007. https://twiki.cern.ch/twiki/pub/Atlas/PanDA/TadashiMaeno-CHEP2007.pdf.
- [49] T. DeYoung, “IceTray: A Software Framework For IceCube,” in CHEP 04, 2004. http://indico.cern.ch/contributionDisplay.py?contribId=292&sessionId=6&%confId=0.
- [50] J. Klein, “RAT Simulation and Analysis Tool.” LBNE:DocDB-246.
- [51] M. Clemencic et al., “Recent developments in the LHCb software framework, Gaudi,” in J. Phys: Conf. Ser. 219 042006, 2010.
- [52] “Mailman home page.” http://www.gnu.org/software/mailman.
- [53] “Subversion home page.” http://subversion.tigris.org.
- [54] “Concurrent Version System.” http://www.cyclic.com/.
- [55] “Git version control system, home page.” http://git-scm.com/.
- [56] “Trac home page.” http://trac.edgewall.org.
- [57] “MediaWiki home page.” http://www.mediawiki.org/.
- [58] “MySQL Database home page.” http://www.mysql.com/.
- [59] “Postgres Database home page.” http://www.postgresql.org/.
- [60] “ELOG home page.” https://midas.psi.ch/elog/.
- [61] “High Performance Storage System home page.” http://www.hpss-collaboration.org/.
- [62] “Water Cherenkov detector offline computing time estimate.” LBNE:DocDB-506.
- [63] “LBNE WC Computing (1.4.7) Preliminary Requirements.” LBNE:DocDB-587.
- [64] Personal communication, Bob Svoboda.
- [65] J. Anderson et al., “The Development of Large-Area Fast Photo-detector. Proposal to DOE (2009),” 2009. http://psec.uchicago.edu/other/Project_description_nobudgets.pdf.
- [66] J. Anderson et al., “Technical Design Report for the frugal MCP,” 2010. http://psec.uchicago.edu/library/doe_reports/TDR.pdf.
- [67] M. Sanchez and M. Wetstein, “Using Large Area Micro-channel Plate Photodetectors in the Next Generation Water Cherenkov Neutrino Detectors,” in XXIV International Conference on Neutrino Physics and Astrophysics (Neutrino 2010), June 2010.
- [68] J. Stewart et al., “Leak Rate Higher than expected WCD-019 Risk,” 2011. LBNE:DocDB-4874.
- [69] “Alternatives Analysis.” LBNE Project Management Team - LBNE Doc 4382, 2012.
- [70] T. Russo, “LBNE VALUE ENGINEERING PROPOSAL: Use wire rope deployment for the wall PMTs,” 2011. LBNE:DocDB-3538.
- [71] J. Stewart, “LBNE VALUE ENGINEERING PROPOSAL: Multiple-length cables to the PMTs,” 2011. LBNE:DocDB-3119.
- [72] M. Andrews, “LBNE Integrated Environment, Safety, and Health Management Plan.” LBNE:DocDB-4514.
- [73] M. Andrews, “LBNE Project Preliminary Hazard Analysis Report.” LBNE:DocDB-4513.
- [74] Sanford Laboratory, “ESH Standards for Sanford Laboratory,” 2010. EHS-1000-L6-01/document-73205, https://docs.sanfordlab.org/docushare/dsweb/View/Collection-7391.
- [75] Deep Underground Science and Engineering Laboratory, “Preliminary Design Report,” 2011. LBNE:DocDB-2417.
- [76] Thomas J. Campbell, “Synopsis of Homestake Mine Geology.” http://homestake.sdsmt.edu/Geology/geology.htm.
- [77] Lachel Felice & Associates, “Geotechnical Engineering Services Final Report for 4850L Mapping,” 2009. LBNE:DocDB-2417.
- [78] Golder Associates, “LBNE Far Site Detector Excavation Conceptual Design: WCD Reference Design Final Report,” 2011. LBNE:DocDB-4338.
- [79] Golder Associates, “In Situ Stress Measurement Deep Underground Science and Engineering Laboratory,” 2010. LBNE:DocDB-4417.
- [80] A. Davis, C. Webb, and F. Beaver, “Hydrology of the Proposed National Underground Science Laboratory at the Homestake Mine in Lead, South Dakota,” 2003.
- [81] HDR, “WCD 4850L Final Conceptual Design Report for LBNE Surface Facilities at Sanford Lab,” 2011. LBNE:DocDB-4338.
- [82] Golder Associates, “WCD Conceptual Design Excavation Drawings,” 2011. LBNE:DocDB-4338.
- [83] DUSEL Large Cavern Advisory Board, “Report No. 5,” 2011. LBNE:DocDB-3718.
- [84] LBNE, “4850L Bulkhead Design Option Report,” 2011. LBNE:DocDB-4338.
- [85] Arup, “LBNE 100% Concept Design Report Task 1a: WCD at 4850L,” 2011. LBNE:DocDB-4338.
- [86] Aon Risk Solutions, “Fire Protection/Life Safety Assessment for the Conceptual Design of the Far Site of the Long Baseline Neutrino Experiement,” 2011. LBNE:DocDB-4395.
- [87] G.L. Tiley, “Finite Element Analysis,”