The VMC Survey. V. First results for Classical Cepheids††thanks: Based on observations made with VISTA at ESO under programme ID 179.B-2003.
Abstract
The VISTA Magellanic Cloud (VMC, PI M.-R. L. Cioni) survey is collecting deep -band time-series photometry of the pulsating variable stars hosted by the system formed by the two Magellanic Clouds (MCs) and the Bridge connecting them. In this paper we present the first results for Classical Cepheids, from the VMC observations of two fields in the Large Magellanic Cloud (LMC), centred on the South Ecliptic Pole and the 30 Doradus star forming regions, respectively. The VMC -band light curves of the Cepheids are well sampled (12 epochs) and of excellent precision (typical errors of 0.01 mag). We were able to measure for the first time the magnitude of the faintest Classical Cepheids in the LMC ( 17.5 mag), which are mostly pulsating in the First Overtone (FO) mode, and to obtain FO Period–Luminosity (), Period-Wesenheit (), and Period–Luminosity–Colour () relations, spanning the full period range from 0.25 to 6 day. Since the longest period Cepheid in our dataset has a variability period of 23 day, we have complemented our sample with literature data for brighter F Cepheids. On this basis we have built a relation in the band that, for the first time, includes short period hence low luminosity pulsators, and spans the full range from 1.6 to 100 day in period. We also provide the first ever empirical and relations using the colour and time-series photometry. The very small dispersion ( mag) of these relations makes them very well suited to study the three-dimensional (3D) geometry of the Magellanic system. The use of “direct” (parallax- and Baade–Wesselink- based) distance measurements to both Galactic and LMC Cepheids, allowed us to calibrate the zero points of the , , and relations obtained in this paper, and in turn to estimate an absolute distance modulus of mag for the LMC. This result is in agreement with most of the latest literature determinations based on Classical Cepheids.
keywords:
Stars: variables: Cepheids– galaxies: Magellanic Clouds – galaxies: distances and redshifts – surveys1 Introduction
The Magellanic Clouds (MCs) represent a benchmark for studies of stellar populations and galactic evolution (see e.g. Harris & Zaritsky, 2004, 2009). The Milky Way-Magellanic Cloud system is the closest example of a complex ongoing galaxy interaction (see e.g. Putman et al., 1998; Muller et al., 2004; Stanimirović et al., 2004; Bekki & Chiba, 2007). Having a metallicity lower than the Galaxy and hosting significantly younger populous clusters the MCs are also an important laboratory for testing the theory of stellar evolution (see e.g. Brocato et al., 2004; Neilson & Langer, 2012).
Amongst extragalactic systems, the LMC represents the “first step” of the extragalactic distance scale, thus holding a key role for the definition of the entire cosmic distance ladder (see e.g. Walker, 2012, and references therein). Indeed, the absolute calibration of extragalactic distances obtained by the Hubble Space Telescope (HST) Key project (Freedman et al., 2001) and the Supernovae Ia (SNIa) calibration team (see e.g. Saha et al., 2001) both rest upon an assumption of the distance to the LMC, and on the adoption of the - and -bands period-luminosity () relations of Classical Cepheids in this galaxy. Any systematic effects in the distance to the LMC and/or in the slope of the Cepheid relations are expected to affect the final calibration of the cosmic distance scale and, in turn, the resulting estimate of the Hubble constant (see Marconi, 2009; Bono et al., 2010; Walker, 2012, and references therein).
The Classical Cepheid relations have been demonstrated by several authors to show a non negligible dependence on chemical composition (see e.g. Caputo, Marconi & Musella, 2000; Romaniello et al., 2005, 2008; Marconi, 2009; Bono et al., 2010; Freedman & Madore, 2011) with the effect being significantly reduced at near infrared (NIR) wavelenghts (Bono et al., 1999; Caputo, Marconi & Musella, 2000; Marconi, Musella, & Fiorentino, 2005; Marconi et al., 2010). The NIR bands are also less affected by reddening and, in these filters, the relations show a smaller intrinsic dispersion (see e.g. Madore & Freedman, 1991; Caputo, Marconi & Musella, 2000) and a much reduced nonlinearity (Bono et al., 1999; Caputo, Marconi & Musella, 2000; Marconi, 2009) than in the optical range. Furthermore, pulsation amplitudes are much smaller in the NIR than in the optical bands, thus accurate mean magnitudes can be derived from a small number of phase points along the pulsation cycle. NIR observations of Classical Cepheids, as well as of other pulsating stars (see, e.g., Moretti et al. 2012, hereinafter M12), over the whole Magellanic system, including the Bridge connecting the two Clouds, are one of the key objectives of the VISTA near-infrared survey of the Magellanic system (VMC; Cioni et al., 2011, hereinafter Paper I). This ESO public survey is obtaining deep NIR imaging in the , and filters of a wide area across the Magellanic system, using the VIRCAM camera (Dalton et al., 2006) of the ESO VISTA telescope (Emerson, McPherson & Sutherland, 2006). The main science goals of VMC are the determination of the spatially-resolved star-formation history (SFH) and the definition of the 3D structure of the whole Magellanic system. The observations are designed to reach mag at Signal to Noise ratio (S/N)=10, in order to detect sources encompassing most phases of stellar evolution: from the main-sequence, to subgiants, upper and lower red giant branch (RGB) stars, red clump stars, RR Lyrae and Cepheid variables, asymptotic giant branch (AGB) stars, post-AGB stars, planetary nebulae (PNe), supernova remnants (SNRs), etc. These different stellar populations will enable the study of age and metallicity evolution within the whole MC system.
In this paper we present results for the Classical Cepheids contained
in the first two “tiles” completely observed (the whole 12–epoch
time series) by the VMC survey, namely tiles 8_8 and 6_6. Some
preliminary results from the analysis of the Classical Cepheids in
these two tiles were published in Ripepi et al. (2012). Tile 8_8 is of
particular interest, as it covers the South Ecliptic Pole (hereinafter
SEP) region that the Gaia astrometric satellite (Lindegren & Perryman 1996;
Lindegren 2010) will repeatedly observe for calibration purposes at the start of the
mission, just after launch in Spring 2013. It is a tile
that lies in an uncrowded, peripheral area of the LMC.
Tile 6_6 is centred instead on the well known 30 Doradus
(hereinafter 30 Dor) star
forming region. It lies in the central part of the LMC and is a very crowded area.
The VMC data for the SEP and 30 Dor Classical Cepheids are presented in Section 2. The , , and relations derived from Fundamental (F) and First Overtone (FO) Classical Cepheids in these two LMC regions are discussed in Sections 3 and 4. The zero-point calibrations of the , , and relations based on a number of different methods are presented in Section 5. Our final estimate of the distance to the LMC based on the 30 Dor and SEP Classical Cepheids is discussed in Section 6. Finally, a summary of the main results is presented in Section 7.


2 The VMC data for the variable stars
The VMC observing strategy is described in detail in Paper I. The data acquisition procedures specifically applied to the variable stars, the cross-matching between the VMC and existing optical catalogues for the variable stars, and the derivation of the information needed for their analysis are extensively discussed in M12. The interested reader is referred to these two papers for more details. Here, we briefly recall the main steps of the procedures applied to obtain the light curves and average magnitudes for the Classical Cepheids in the 30 Dor and SEP fields.
In order to obtain well sampled light curves, the VMC -band time series observations were scheduled into 12 separate epochs distributed over ideally several consecutive months. The VMC data, processed through the pipeline (Irwin et al., 2004) of the VISTA Data Flow System (VDFS, Emerson et al., 2004), were retrieved from the VISTA Science Archive (VSA, Cross et al., 2012)111http://horus.roe.ac.uk/vsa/. For our analysis we used the v20110909 VMC release “pawprints” (6 “pawprints” form a “tile”, see Paper I and M12). Since usually a variable star is observed in two or three not necessarily consecutive pawprints, we first calculated a weighted average of the pawprints’ magnitudes to obtain the “tile” , which then represented one epoch of data. During this process particular care was devoted to the determination of a proper Heliocentric Julian Day (HJD) for the value of each “tile” per epoch (see M12, for details).
The second phase of the “Expérience pour la Recherche d’Objets Sombres” (EROS-2; Tisserand et al. 2007) is, at present, the largest optical222The EROS-2 channel (420-720 nm) overlaps with the and standard bands, and the channel (620-920 nm) roughly matches the mean wavelength of the Cousins band (Tisserand et al., 2007) survey covering a large fraction of the LMC, and reaching out to peripheral areas such as the SEP region (see Fig. 4 of M12). The 30 Dor field is covered, instead, by both the EROS-2 and the third phase of the “Optical Gravitational Lensing Experiment” (OGLE-III; Soszyński et al. 2008, 2009) survey. For our analysis we used identification, pulsation period, and optical-band light curves from the EROS-2 photometric archive for the Classical Cepheids contained in the SEP; however, we opted to use the OGLE-III information, which is available in standard Johnson-Cousins bands, for the 30 Dor Cepheids.
| HJD-2 400 000 | err | |
|---|---|---|
| 55140.75594 | 14.347 | 0.007 |
| 55141.77415 | 14.477 | 0.007 |
| 55143.74588 | 14.310 | 0.006 |
| 55147.79060 | 14.394 | 0.006 |
| 55152.80550 | 14.288 | 0.007 |
| 55155.72048 | 14.285 | 0.007 |
| 55161.83663 | 14.336 | 0.007 |
| 55164.77643 | 14.473 | 0.007 |
| 55172.74263 | 14.291 | 0.006 |
| 55191.73701 | 14.280 | 0.006 |
| 55209.66414 | 14.425 | 0.007 |
| 55227.56999 | 14.263 | 0.006 |
| 55246.58263 | 14.275 | 0.006 |
| 55266.51279 | 14.277 | 0.006 |
| 55510.79965 | 14.398 | 0.007 |
Table 1 is published in its entirety only in the electronic edition of the journal. A portion is shown here for guidance regarding its form and content.
As a result of the matching procedure between the VMC and the optical surveys’ catalogues we found 11 Classical Cepheids (of which 8 are FO and 3 are F pulsators) in the SEP field, and 323 in the 30 Dor region (of which 161 pulsate in the F mode, 139 pulsate in the FO, whereas 8 and 15 objects are mixed mode F/FO and FO/SO333SO means Second Overtone pulsator, respectively). The very small number of Cepheids in the SEP field may give rise to concerns about the completeness of the SEP sample. Indeed, we checked whether new Cepheids could be identified from the VMC data alone, however 12 epochs do not seem to be sufficient and the variability flag of the VSA (Cross et al., 2009) does not yet appear reliable enough for this purpose. On the other hand, this small number seems to be consistent with the very peripheral location of the SEP region, which is very far from the LMC bar, where most of the Classical Cepheids are located. There are 324 Classical Cepheids in the OGLE-III catalogue of the 30 Dor tile, of which we recovered 323. Thus in this field we are 99.7% complete.
Time-series photometry for these variables is provided in Table 1, which is published in its entirety in the on-line version of the paper.
Our photometry is in the VISTA system, which is tied to the 2MASS photometry, with the difference in magnitude only mildly depending on the colour. Indeed, the empirical results available to date444http://casu.ast.cam.ac.uk/surveys-projects/vista/technical/photometric-properties show that: (2MASS)(VISTA) and (2MASS)=(VISTA)(VISTA). In the absence of a complete light curve in (only very few phase points are available in this passband), this correction might introduce errors larger than the correction itself. Indeed, for the typical ) colour of Classical Cepheids with periods shorter than 20–30 d 0.3–0.4 mag), the correction is of on the order of 3-4 mmag, hence, for Cepheids, to a very good approximation, the VISTA system reproduces well the 2MASS one at . Furthermore, this error for the Cepheids is much smaller than the typical uncertainties of the , and relations (see next sections).
The periods available from the EROS-2 and OGLE-III catalogues were used to fold the -band light curves produced by the VMC observations of the SEP and 30 Dor variables, respectively. Examples of the VMC -band light curves of the Cepheids in the 30 Dor and SEP regions are shown in Fig. 1 (see also Ripepi et al., 2012, for additional examples). The light curves are very well sampled and nicely shaped. Intensity-averaged magnitudes were derived from the light curves simply using custom software written in C, that performs a spline interpolation to the data. Final magnitudes are provided in Table 2 and 3 for the 30 Dor and SEP Classical Cepheids, respectively, along with the stars main characteristics: VMC Id, coordinates, pulsation mode, and (for the 30 Dor Cepheids only) intensity-averaged magnitudes, period, -band amplitude and individual reddenings (for the 30 Dor Cepheids only. See next section). The predominance of FO (8) with respect to F (4) pulsators, as well as the lack of Cepheids with periods longer than 4 d in the SEP field are both remarkable. This might be related to the specific star formation history in the SEP region (see M12 for details).
In the VMC data a significant departure from linearity due to saturation starts around 11.5 mag, the actual value depending on seeing, airmass etc. (see Paper I). This limits the Cepheids that can be analyzed on the basis of the VMC data to variables with pulsation period shorter than 20–30 day. The longest period Classical Cepheids analyzed in the present paper has a variability period of 23 day. However, this threshold was mainly set by the lack of longer period pulsators in the OGLE-III and EROS-2 catalogs for the 30 Dor and SEP fields, rather than by the VMC saturation limit.
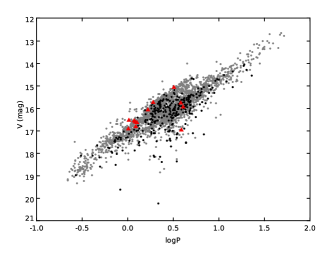
Figure 2 shows the period range covered by the SEP (red filled triangles) and 30 Dor (black filled circles) Classical Cepheids, over the full range of periods spanned by the LMC Cepheids (grey filled circles), according to the OGLE-III catalogue (Soszyński et al., 2008). The variables in the SEP and 30 Dor fields appear to sample very well the full distribution of LMC Cepheids with periods shorter than 20–30 day, thus ensuring a large significance of the , and relations presented in the present study, that were extended beyond the period limit of 20–30 day set by the saturation threshold of the VMC exposures by complementing the SEP and 30 Dor samples with Classical Cepheids exceeding the 10 d period from Persson et al. (2004, see Section 3).
| ID | RA | Dec | M | Period | Notes | ||||||
|---|---|---|---|---|---|---|---|---|---|---|---|
| J2000 | J2000 | mag | mag | d | mag | mag | mag | mag | |||
| VMC J053048.71-694848.0 | 82.70296 | -69.81333 | F | 15.354 | 16.105 | 3.240862 | 14.353 | 0.22 | 0.006 | 0.08 | |
| VMC J053059.48-693531.2 | 82.74783 | -69.59200 | F | 14.890 | 15.693 | 4.656827 | 13.917 | 0.22 | 0.008 | 0.09 | |
| VMC J053100.91-694532.4 | 82.75379 | -69.75900 | F | 14.724 | 15.453 | 4.874545 | 13.775 | 0.23 | 0.004 | 0.08 | |
| VMC J053101.03-690630.3 | 82.75429 | -69.10842 | F | 15.779 | 16.722 | 3.130618 | 14.589 | 0.12 | 0.007 | 0.12 | |
| VMC J053101.70-690621.5 | 82.75708 | -69.10597 | F | 15.993 | 17.003 | 2.908321 | 14.694 | 0.20 | 0.010 | 0.12 | |
| VMC J053102.99-693207.2 | 82.76246 | -69.53533 | F | 14.816 | 15.547 | 4.641402 | 13.957 | 0.25 | 0.009 | 0.09 | |
| VMC J053112.67-700427.3 | 82.80279 | -70.07425 | F | 14.949 | 15.679 | 4.226975 | 14.041 | 0.22 | 0.008 | 0.02 | |
| VMC J053117.49-695428.3 | 82.82287 | -69.90786 | F | 14.357 | 15.133 | 5.976499 | 13.388 | 0.21 | 0.004 | 0.10 | |
| VMC J053118.30-693626.4 | 82.82625 | -69.60733 | F | 14.875 | 15.716 | 4.83438 | 13.833 | 0.14 | 0.008 | 0.10 | |
| VMC J053122.41-695323.0 | 82.84337 | -69.88972 | F | 15.058 | 15.643 | 3.408864 | 14.120 | 0.19 | 0.009 | 0.10 |
| ID | RA | DEC | M | Period | ||||
|---|---|---|---|---|---|---|---|---|
| J2000 | J2000 | mag | d | mag | mag | mag | ||
| VMC J055635.76-654742.2 | 89.14900 | -65.79506 | FO | 16.596 | 1.188733 | 15.264 | 0.09 | 0.0037 |
| VMC J055711.13-655116.1 | 89.29636 | -65.85448 | FO | 16.561 | 1.044436 | 15.284 | 0.10 | 0.0040 |
| VMC J055638.33-660302.5 | 89.15971 | -66.05070 | FO | 16.640 | 1.214786 | 15.338 | 0.08 | 0.0040 |
| VMC J055530.28-660557.6 | 88.87615 | -66.09933 | F | 15.785 | 3.870460 | 14.145 | 0.15 | 0.0062 |
| VMC J055613.37-662234.0 | 89.05570 | -66.37611 | FO | 16.944 | 1.027683 | 15.533 | 0.10 | 0.0060 |
| VMC J060325.16-663124.5 | 90.85483 | -66.52348 | FO | 16.677 | 1.277076 | 15.224 | 0.14 | 0.0154 |
| VMC J060318.77-665244.3 | 90.82822 | -66.87896 | FO | 15.096 | 3.227865 | 13.631 | 0.09 | 0.0045 |
| VMC J060117.35-665319.9 | 90.32228 | -66.88885 | F | 15.986 | 4.085779 | 13.900 | 0.03 | 0.0070 |
| VMC J055922.13-665709.6 | 89.84220 | -66.95267 | FO | 16.100 | 1.683674 | 14.788 | 0.11 | 0.0032 |
| VMC J055535.43-670217.4 | 88.89761 | -67.03818 | F | 17.009 | 3.902331 | 14.130 | 0.02 | 0.0079 |
| VMC J055942.93-670346.8 | 89.92889 | -67.06300 | FO | 15.767 | 1.907595 | 14.515 | 0.09 | 0.0023 |
3 Classical Cepheids in the 30 Dor Field
| mode | r.m.s. | ||||||
| =+ log | |||||||
| F | 16.070 | 0.017 | -3.295 | 0.018 | 0.102 | ||
| FO | 15.580 | 0.012 | -3.471 | 0.035 | 0.099 | ||
| log | |||||||
| F | 15.870 | 0.013 | -3.325 | 0.014 | 0.078 | ||
| FO | 15.400 | 0.008 | -3.530 | 0.025 | 0.070 | ||
| log | |||||||
| F | 15.740 | 0.073 | -3.346 | 0.013 | 0.216 | 0.014 | 0.073 |
| FO | 15.355 | 0.070 | -3.545 | 0.026 | 0.163 | 0.014 | 0.070 |
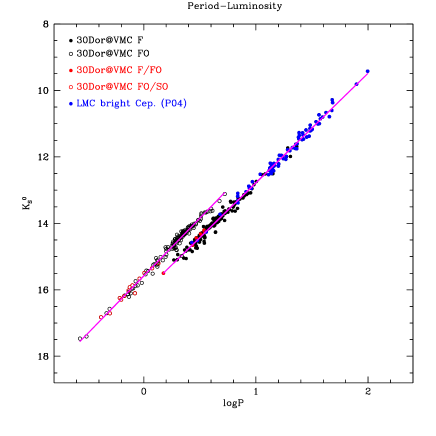
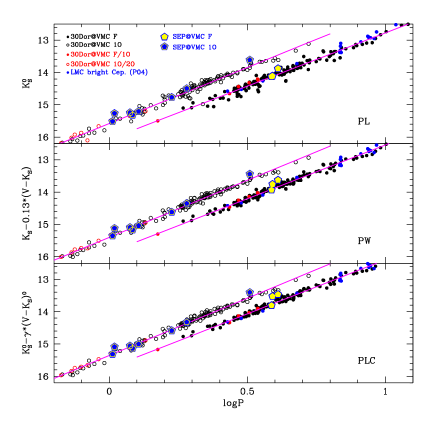
The relations of the 172 F and 154 FO555Double mode pulsators F/FO and FO/SO were included in the F and FO samples, respectively. Classical Cepheids in the 30 Dor field are shown in Fig. 3. In order to extend the period coverage beyond the limit of 23 day set by the longest period pulsator in our sample, we have complemented our data with the sample of Persson et al. (2004) which includes 84 F-mode Cepheids with periods mainly ranging between 10 and 100 day. To merge the two samples we first transformed Persson et al.’s original photometry from the Las Campanas Observatory (LCO) to the 2MASS system using the relations of Carpenter (2001). These data are shown as blue filled circles in Fig. 3. Inspection of this figure (or equivalently Fig. 4 or Fig. 5) and the straight line fits to the two sets of data shows no obvious discontinuity between the data, indicating that our approximation (VISTA)(2MASS) does not introduce a significant error.
To account for the variable reddening which characterizes the 30 Dor field, we adopted the recent evaluations by Haschke, Grebel & Duffau (2011) (reported in column 11 of Table 2), while to correct the Persson et al. (2004) dataset we adopted the reddening values provided by the authors. We have verified that the two reddening systems are consistent with each other within a few hundredths of a mag, and that there is no trend with period.
Finally, we performed least-squares fits to the data of F- and FO-mode variables separately, adopting an equation of the form log. The coefficients derived from the fits are provided in the first portion of Table 4.
In addition to the relation in the band we can consider the and
relations. The advantages of using these relations in place of
a simple relation have been widely discussed in the
literature (see
e.g. Sandage & Tammann, 1968; Madore, 1982; Sandage, Tammann & Reindl, 2009; Caputo, Marconi & Musella, 2000; Marconi, Musella, & Fiorentino, 2005; Bono et al., 2008, 2010; Ngeow & Kanbur, 2005; Ngeow, 2012). These relations include a colour term with a coefficient that, in the
case of the relations, takes into account the colour distribution
of the variable stars within the instability strip, whereas in the
case of the Wesenheit functions it corresponds to the ratio between total
to selective extinction in the filter pair (Madore, 1982; Caputo, Marconi & Musella, 2000), thus
making the Wesenheit relations reddening free. We emphasize that these
tools are particularly suited to studying the 3D structure of the
Magellanic system, as they have much smaller dispersions than a
simple relation
(Caputo, Marconi & Musella, 2000; Marconi, Musella, & Fiorentino, 2005; Bono et al., 2010).
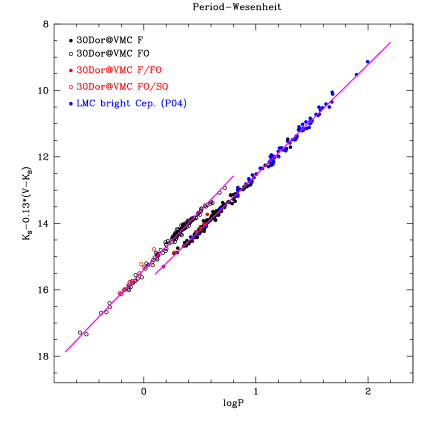
The and relations are usually calculated using the
colour. However, given the data available to us we have built our
relations using the colour.
As far as we know, this is the first empirical relation using
such a colour. Following Cardelli, Clayton & Mathis (1989) the Wesenheit function is
defined as which is
correlated with the logarithm of the period according to a linear
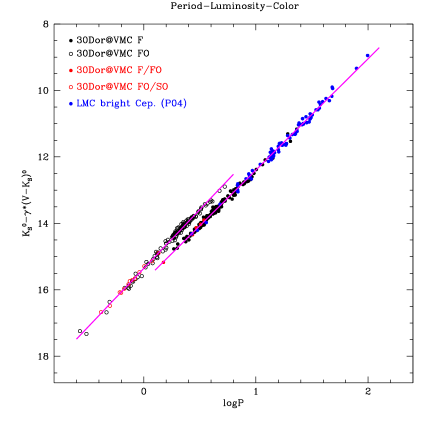
relation of the form log. Similarly,
we adopt a relation of the form
log . The coefficients of the relations
derived with this procedure are provided in the middle and lower
portions of Table 4. The relations are shown in
Figs. 4 and 5, respectively.
We point out that in deriving the above relations we decided to not apply any corrections for the inclination of the LMC disc to Persson et al. (2004)’s and our 30 Dor Cepheids, since our attempt to calculate, e.g., the PW relation after de-projecting both Cepheid samples with the widely adopted van der Marel & Cioni (2001) or van der Marel et al. (2001) model parameters resulted in an increased r.m.s. dispersion of the relation. This is likely because current model uncertainties introduce errors of comparable size as the corrections themselves. In our particular case, as Persson et al. (2004)’s Cepheids are spatially well distributed over the whole LMC, their use should not introduce any systematics on the distance to the LMC barycentre. On the other hand, according to the aforementioned LMC disc models, the 30 Dor field is displaced off the LMC barycentre by, on average, only 0.02 mag (see also Table 3 in Rubele et al., 2012, who performed similar calculations using the comparison between observed and simulated CMDs). Such an effect is much smaller than the intrinsic scatter of the PW relations. We therefore believe that the relations in Table 4 can be safely applied to estimate the distance to the LMC barycentre.
We can now compare our results with previous studies. The literature
values for the coefficients of the , , and relations are
summarized in Table 5. The first four rows in the
table report the empirical results for the relation of
F pulsators by Groenewegen (2000); Persson et al. (2004); Testa et al. (2007); Storm et al. (2011b), while
the fifth row shows the theoretical results by
Caputo, Marconi & Musella (2000). Similarly, rows 6-7 display the empirical results by
Groenewegen (2000) and the semi-empirical results by Bono et al. (2002), for FO pulsators. A
comparison between Tables 4 and 5 reveals
that for the relation of the F-mode pulsators, there
is general agreement within the errors between our results and
Groenewegen (2000); Persson et al. (2004); Storm et al. (2011b) (only slope for the latter because the
zero point is given in absolute magnitude). Only marginal agreement is found
instead with Testa et al. (2007), whose results are based on the
Persson et al. (2004) sample complemented at shorter periods by Cepheids
belonging to the LMC clusters NGC1866 and NGC2031. This is likely
due to the significantly larger sample, both at short and medium periods, presented in
the present paper. As for the comparison with theory, we find that there is
a satisfactory agreement between our slope and the slope predicted by
pulsation models for the LMC’s chemical composition (Caputo, Marconi & Musella, 2000).
The errors in the coefficients of our relation are
shorter than in previous studies. This is a result of the large range in
period spanned by the Cepheids in our sample, including for the first
time a significant number of objects with NIR photometry and periods
shorter than 5 day, and the very good sampling of our multi-epoch
light curves. In the case of the FO pulsators the
agreement with Groenewegen (2000) is less satisfactory than for the F-mode
Cepheids. This may be due to the advantage of the deeper magnitude limit achieved
by the VMC survey, which allowed us to reach the fainter FO Cepheids
populating the short-period tail of the relation, along
with the much better sampling of our light curves.
The Groenewegen (2000) relations rely in fact on 2MASS and DENIS single
epoch NIR data, thus the Cepheid’s mean magnitude is, in
principle, less well determined increasing, in turn, the r.m.s. of the
relation. This is a natural consequence of
studying Cepheids in the NIR using only single epoch data.
Since there are no empirical and relations in
available in the literature we can only compare our relations with the
theoretical results by Caputo, Marconi & Musella (2000).
The slope of our relation is in agreement with the
theoretical value, while a significant discrepancy is found in the
case of the relation (see Table 5). This
discrepancy could be due, at least in part, to uncertainties affecting
the -temperature transformations that might overestimate the
coefficient of the predicted colour term and, in turn, the linear
regression of the corrected magnitude versus period. This effect is
expected to be mitigated in the Wesenheit approach thanks to the
adoption of the same colour coefficient (in the empirical and theoretical
relations) set by
Cardelli’s law.
Finally, we note that no statistically significant evidence is found for the discontinuity around 10 day claimed by several authors. Ngeow et al. (2005) performed a statistical study of the LMC Cepheid sample obtained from the MACHO database and found that the observed behaviour in the period-magnitude diagrams is best reproduced by two linear relations, with a break at 10 day. A similar deviation from linearity is predicted by nonlinear convective pulsation models (see e.g. Caputo, Marconi & Musella, 2000; Fiorentino et al., 2002; Marconi, Musella, & Fiorentino, 2005; Marconi et al., 2010), which also suggest a quadratic form of the relations, particularly in the optical bands. However, all these authors predict that the NIR and relations are well approximated by linear relations (see also Ngeow, Kanbur & Nanthakumar, 2008), as we confirm with the present study.
4 Classical Cepheids in the SEP field
The number of SEP Cepheids is too small (11 objects, see Table 3) to define independent , , and relations. We did not attempt to re-calculate the relations but simply compared the SEP Cepheids with those obtained from the 30 Dor variables. This is done in Fig. 6, where for the SEP Cepheids we have adopted the reddening value =0.06 mag from Rubele et al. (2012)666No evaluation of the SEP field reddening is available from the Haschke, Grebel & Duffau (2011) study..
The SEP variables overlap well with the 30 Dor Cepheids in all panels of the figure. However, there are a few exceptions: stars VMC J055711.13-655116.1, VMC J055638.33-660302.5, VMC J055613.37-662234.0 and VMC J055922.13-665709.6 deviate by more than 2 from the , and relations obtained in the 30 Dor field, and appear to be closer to us by a few kpc. Indeed, from the analysis of the CMD data Rubele et al. (2012) find the SEP field to be located on average 0.05 mag closer to us than the 30 Dor region, which is fully consistent with the results we find here from the Cepheids.
| mode | r.m.s. | source | ||||||
| =+ log | ||||||||
| F | 16.032 | 0.025 | -3.246 | 0.036 | 0.168 | Groenewegen (2000)(a) | ||
| F | 16.051 | 0.05 | -3.281 | 0.040 | 0.108 | Persson et al. (2004)(b) | ||
| F | 15.945 | 0.040 | -3.19 | 0.040 | Testa et al. (2007)(b) | |||
| F | -2.36 | 0.04 | -3.28 | 0.09 | 0.21 | Storm et al. (2011b) (c) | ||
| F | -2.65 | 0.01 | -3.23 | 0.01 | 0.07 | Caputo, Marconi & Musella (2000)(d) | ||
| FO | 15.533 | 0.032 | -3.381 | 0.076 | 0.137 | Groenewegen (2000) (a) | ||
| FO | 15.62 | 0.13 | -3.57 | 0.03 | 0.14 | Bono et al. (2002)(a) | ||
| log | ||||||||
| F | -2.92 | 0.09 | -3.21 | 0.04 | 0.09 | Caputo, Marconi & Musella (2000) | ||
| log | ||||||||
| F | -3.37 | 0.04 | -3.60 | 0.03 | 0.61 | 0.03 | 0.03 | Caputo, Marconi & Musella (2000) |
| (a) data in the CIT system: (2MASS)=(CIT) (Carpenter, 2001) | ||||||||
| (b) data in the LCO system: (2MASS)(LCO) (Carpenter, 2001) | ||||||||
| (c) data in the SAAO system: (2MASS)(SAAO)(SAAO) (Carpenter, 2001) | ||||||||
| (d) models transformed to the Johnson system: for Cepheids (Johnson) (SAAO) (Bessell & Brett, 1988) | ||||||||
5 Calibration of the , and zero points
Our main goal is to use the Classical Cepheids observed by the VMC (along with the RR Lyrae stars, M12) to trace the 3D geometry of the Magellanic system. However, this analysis would be premature with the few VMC tiles observed so far. Still, we can use the , and relations derived in the previous section to estimate an absolute distance to the LMC, but first need to calibrate their zero points. In the following we shall use mainly the and relations, as they appear to be less dispersed than the relation, and derive zero point estimates, adopting for the first time the combination, and two “direct techniques”: the trigonometric parallaxes of Galactic Cepheids, and the Baade-Wesselink method directly applied to LMC Cepheids.
| ID | log | LK | note | |||||
|---|---|---|---|---|---|---|---|---|
| ″ | ″ | d | mag | mag | mag | mag | ||
| SU Cas | 2.57 | 0.33 | 0.440 | 5.9700 | 4.1062 | 0.2590 | -0.1649 | FO, O |
| Dor | 3.26 | 0.14 | 0.993 | 3.7570 | 1.9430 | 0.0520 | -0.0184 | |
| RT Aur | 2.40 | 0.19 | 0.572 | 5.4480 | 3.8962 | 0.0590 | -0.0627 | B: |
| Gem | 2.74 | 0.12 | 1.006 | 3.9150 | 2.1145 | 0.0140 | -0.0192 | V |
| Car | 2.03 | 0.16 | 1.551 | 3.6980 | 1.0788 | 0.1470 | -0.0621 | |
| BG Cru | 2.23 | 0.30 | 0.678 | 5.4590 | 3.8704 | 0.1320 | -0.1810 | FO, B |
| X Sgr | 3.17 | 0.14 | 0.846 | 4.5640 | 2.5033 | 0.2370 | -0.0195 | O |
| W Sgr | 2.30 | 0.19 | 0.880 | 4.6700 | 2.8101 | 0.1080 | -0.0682 | O |
| Y Sgr | 2.13 | 0.29 | 0.761 | 5.7450 | 3.5695 | 0.1910 | -0.1854 | B |
| FF Aql | 2.64 | 0.16 | 0.650 | 5.3730 | 3.4706 | 0.1960 | -0.0367 | O |
| T Vul | 2.06 | 0.22 | 0.647 | 5.7530 | 4.1814 | 0.0640 | -0.1141 | B |
| DT Cyg | 2.19 | 0.33 | 0.550 | 5.7750 | 4.4109 | 0.0420 | -0.2271 | FO |
| Cep | 3.71 | 0.12 | 0.730 | 3.9530 | 2.3037 | 0.0750 | -0.0105 | V |
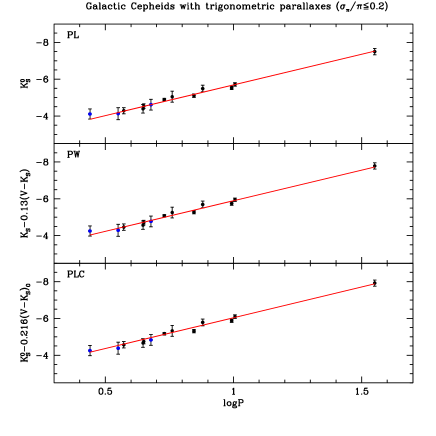
5.1 Zero points from the parallax of Galactic Cepheids
Accurate parallaxes for Galactic Cepheids are available for fewer than 20 objects, from observations with the Hipparcos satellite (van Leeuwen et al., 2007), and the HST (Benedict et al., 2007). To use these data for our purpose, we had to: i) derive the -band relation, and, for the first time, the - and relations for these Cepheids; ii) apply them to our sample taking into account that possible differences may exist in the slopes and zero points, due to metallicity effects.
From the van Leeuwen et al. (2007) and Benedict et al. (2007) samples we only retained stars with the most accurate parallax (). For 10 stars in common between the two sets we computed weighted averages of the parallaxes. Photometric data (including -band photometry, transformed to the 2MASS system according to Carpenter, 2001) and individual reddening values for these stars were taken from Fouqué et al. (2007), while for the Lutz-Kelker corrections we followed Benedict et al. (2007). We then computed the , and relations, by excluding from the fit the most deviating stars: UMi and S Mus. This left us with a total number of 13 Galactic Cepheids. Their list is provided in Table 6. Inclusion in the fit of the three suspected FO stars (see Table 6) did not change the results significantly, hence we kept these stars to increase the statistics. We also kept all binary objects (see Table 6). Excluding them would considerably reduce the statistical significance of our results. This limitation, due to the paucity of trigonometric parallaxes for Cepheids, will be directly addressed when the astrometric satellite Gaia is launched and goes into operation in 2013. We first calculated the regressions leaving all parameters free to vary. The colour term in the relation turned out to be insignificant, thus the and relationships are identical and equal to: log. Similarly, for the Wesenheit function we have: log. Although rather uncertain, the slopes of these relations are in good agreement with our results from the 30 Dor Cepheids, within the errors. We thus adopted our slopes from the 30 Dor Cepheids for the and relations to derive the following weighted-average zero points of the parallax-based relations:
| (1) |
| (2) |
where the error on the zero point is the standard deviation of the mean. Similarly, by adopting our values of and for the period and colour coefficients of the relation, we obtained:
| (3) | |||||
Here, the errors on the zero point estimates include the contribution of the systematic uncertainty due to the adoption of the same slope for Galactic and LMC Cepheids according to the model predictions by Caputo, Marconi & Musella (2000). The , and relations obtained with this procedure are shown in Fig. 7. By comparing Eqs. 2 and 3 with the results in Table 4, we obtain distance moduli of the LMC, based on the F-mode Cepheids, of: mag, and mag, respectively.
5.2 Zero points from the Baade-Wesselink method
5.2.1 Infrared Surface Brightness (IRSB) formulation
Recently, Storm et al. (2011a, b) published individual distances to Galactic and LMC Cepheids (36 objects in the LMC), based on application of the IRSB modification of the Baade-Wesselink technique (see e.g. Gieren, Fouqué & Gomez, 2007, and references therein) to a sample of Galactic and LMC Cepheids and a new evaluation of the projection factor (p-factor) that transforms the observed radial velocity into pulsation velocity. We have used their absolute magnitudes in 777Note that these magnitudes were transformed to the 2MASS system and referred to the centre of the LMC using the corrections by Storm et al. (2011b). and to calibrate the zero points of the , and relations. As done with the Galactic Cepheids, we adopted our slopes for the relations, and determined their zero points. The assumption is well justified in this case as both our and Storm et al. (2011b)’s Cepheids belong to the LMC, hence we do not expect any metallicity effect. As a result we obtain:
| (4) |
| (5) |
| (6) | |||||
where the errors on the zero points include the dispersion of the
measurements, as well as an estimate of the systematic error due to
the uncertainty on the p-factor (see e.g. Storm et al., 2011a, and references
therein). The new zero points are in excellent agreement
with those derived from the Galactic Cepheids and confirm
Storm et al. (2011a)’s findings.
These relations lead to distance moduli for the LMC of:
mag and
mag, respectively, in very good
agreement with Storm et al. (2011b).
5.2.2 CORS Baade-Wesselink formulation
A different implementation of the Baade-Wesselink technique, the so-called CORS method (see e.g. Caccin et al., 1981; Ripepi et al., 1997; Molinaro et al., 2011), was applied by Molinaro et al. (2012) to 9 Cepheids (7 F- and 2 FO-mode) belonging to NGC1866, a populous widely studied young cluster located about 4.1°North–West of the LMC bar. These authors find (NGC1866)= mag. This value can be used to calibrate the , and relations following the same procedure described in the previous sections, and with the advantage that we can now calibrate also the relation for FO pulsators (although only based on two stars). In this case we obtain:
| (7) |
| (8) |
| (9) |
| (10) |
| (11) | |||||
| (12) | |||||
Here, as in the previous section, the errors in the zero points include both the dispersion of the measures, and the uncertainty in the p-factor.
Averaging the results for F and FO Cepheids, we obtain distance moduli of: mag and mag, respectively. The marginally significant 0.02 mag difference with Molinaro et al. (2012) is likely due to the relative distance between NGC1866 and the LMC centre. Indeed, a direct comparison of the NGC1866 Cepheids with our relation reveals a difference on the order of 0.02 mag. Such an uncertainty, when added in quadrature, has negligible effects compared to other sources of error.
6 Discussion and estimate of the distance to the LMC
In the previous sections we have calibrated the zero points of our , and relations using different methods, and derived in turn different estimates of the distance to the LMC. By combining these results, we can derive our best estimates for the zero points of the , and relations, as well as for the distance to the LMC. In particular, a weighted mean of the zero points for F-mode pulsators leads to the following final , and relations:
| (13) |
| (14) |
| (15) | |||||
As for the distance to the LMC, a similar weighted mean leads to the final value of mag, in excellent agreement with several independent literature results (see, e.g., Walker, 2012, and references therein). In particular, Walker (2012) in his recent review of current LMC distance estimates based on Cepheids, red variables, RR Lyrae, Red Clump stars and Eclipsing Binaries, showed that most of these indicators agree on a mean value of the distance modulus for the LMC of 18.48 0.05 mag.
7 Summary and Conclusions
We have presented first results for Classical Cepheids observed by the
VMC survey in two fields of the LMC, centred on the SEP and the 30
Dor regions, respectively. The identification of the variables and their
optical magnitudes were derived from the EROS-2 and OGLE-III
catalogues. Our Cepheid light curves are very well
sampled, with at least 12 epochs, and very precise, with typical
errors of 0.01 mag, or better, for individual phase points. Our
observing strategy allowed us to measure for the first time the
magnitude of the faintest Cepheids in the LMC, which
are mostly FO pulsators, thus enabling us to obtain , and
relations defined over the whole period range spanned by the LMC
FO Cepheids.
Since the longest period Cepheid in our dataset is a 23 day variable,
we have complemented our sample with data from
Persson et al. (2004) for bright F-mode Cepheids. On this basis we have
built a relation in the band that for the first time
includes also short period (i.e. low luminosity) F pulsators. We have
also calculated the first empirical , and relations
using the colour. The latter two have very small
dispersion ( mag) and will be particularly suited for the 3D
study of the Magellanic system, a main goal of the VMC project, that
we cannot yet achieve with only two VMC fields completed so far.
We have used “direct” distance measures to both Galactic and LMC
Cepheids to calibrate the zero points of the , and relations
derived in this paper. This procedure led to
Eqs. 13–15 that we have used to
estimate an absolute distance to the LMC of mag, in
excellent agreement with the latest determinations of the LMC distance,
based on Classical Cepheids
and other independent distance indicators.
The new final distance modulus for the LMC derived in the present study is slightly shorter than the value assumed by the HST Key Project (18.50 mag, according to Freedman et al., 2001), thus implying LMC-calibrated extragalactic distances shorter by about 2 %, a small but still non negligible correction, in the era of the claimed Hubble constant within a few per cent uncertainty (see e.g. Riess et al., 2011).
Acknowledgments
It is a pleasure to thank our referee B. Madore for his prompt and helpful report. V.R. warmly thanks Roberto Molinaro for providing the program for the spline interpolation of the light curves. M.I. Moretti thanks the Royal Astronomical Society for financial support during her two-month stay at the University of Hertfordshire. Financial support for this work was provided by PRIN-INAF 2008 (P.I. Marcella Marconi) and by COFIS ASI- INAF I/016/07/0. RdG acknowledges partial research support from the National Natural Science Fundation of China (grant 11073001). We thank the UK’s VISTA Data Flow System comprising the VISTA pipeline at the Cambridge Astronomy Survey Unit (CASU) and the VISTA Science Archive at Wide Field Astronomy Unit (Edinburgh) (WFAU) provided calibrated data products, and is supported by STFC.
References
- Bekki & Chiba (2007) Bekki K., Chiba M., 2007, MNRAS, 381, L16
- Benedict et al. (2007) Benedict G. F., McArthur B. E., Feast M. W., Barnes T. G., Harrison T. E., Patterson R. J., Menzies J. W., Bean J. L., Freedman W. L., 2007, AJ, 133, 1810
- Bessell & Brett (1988) Bessell, M. S., Brett, J. M., 1988, PASP, 100, 1134
- Bono et al. (1999) Bono G., Caputo F., Castellani V., Marconi M., 1999, ApJ, 512, 711
- Bono et al. (2002) Bono G., Groenewegen M. A. T., Marconi M., Caputo F., 2002, ApJ, 574, L33
- Bono et al. (2008) Bono G., Caputo F., Marconi M., Musella I., 2008, ApJ, 684, 102
- Bono et al. (2010) Bono G., Caputo F., Marconi M., Musella I., 2010, ApJ, 715, 277
- Borissova et al. (2009) Borissova J., Rejkuba M., Minniti D., Catelan M., Ivanov, V. D., 2009, A&A, 502, 505
- Brocato et al. (2004) Brocato E., Caputo F., Castellani V., Marconi M., Musella I., 2004, AJ, 128, 1597
- Caccin et al. (1981) Caccin R., Onnembo A., Russo G., Sollazzo C., 1981, A&A, 97, 104
- Caputo, Marconi & Musella (2000) Caputo F., Marconi M., Musella I., 2000, A&A, 354, 610
- Cardelli, Clayton & Mathis (1989) Cardelli J. A., Clayton G. C., Mathis J. S., 1989, ApJ, 345, 245
- Carpenter (2001) Carpenter J.M., 2001, AJ, 121, 2851
- Cioni et al. (2011) Cioni M.-R. L., Clementini G., Girardi L., et al., 2011, A&A, 527, 116 (Paper I)
- Coppola et al. (2011) Coppola G., Dall’Ora M., Ripepi V., et al., 2011, MNRAS, 416,1056
- Cross et al. (2009) Cross N. J. G., Collins R. S., Hambly N. C., Blake R. P., Read M. A., Sutorius E. T. W. and Mann R.G., Williams P. M., 2009, MNRAS, 339, 1730
- Cross et al. (2012) Cross N.J.G., et al., 2012, MNRAS, submitted
- Dall’Ora et al. (2004) Dall’Ora M., Storm J., Bono G., et al., 2004, ApJ, 610, 269
- Dalton et al. (2006) Dalton G. B., Caldwell M., Ward A.K., et al. 2006, in Society of Photo-Optical Instrumentation Engineers (SPIE) Conference Series, Vol. 6269, Society of Photo-Optical Instrumentation Engineers (SPIE) Conference Series
- Di Criscienzo et al. (2006) Di Criscienzo M., Caputo F., Marconi M., Musella, I., 2006, MNRAS, 365, 1357
- Emerson et al. (2004) Emerson J. P., Irwin M. J., Lewis J., et al., 2004,SPIE, 5493, 401, 41
- Emerson, McPherson & Sutherland (2006) Emerson J. P., McPherson A., Sutherland W., 2006, The Messenger, 126, 41
- Fernie et al. (1995) Fernie J. D., Beattie B., Evans N. R., Seager S., 1995, IBVS, No. 4148
- Fiorentino et al. (2002) Fiorentino G., Caputo F., Marconi M., Musella I., 2002, ApJ, 576, 402
- Freedman et al. (2001) Freedman, W. L. et al., 2001, ApJ, 553, 47
- Freedman & Madore (2011) Freedman W. L., Madore B. F., 2011, ApJ, 734, 46
- Fouqué et al. (2007) Fouqué P., Arriagada P., Storm J., Barnes T. G., Nardetto N., Mérand A., Kervella P., Gieren W., Bersier D., Benedict G. F., McArthur B. E., 2007, A&A, 476, 73
- Gieren, Fouqué & Gomez (2007) Gieren W. P., Fouqué P., Gomez, M. I., 1997, ApJ, 488, 74
- Groenewegen (2000) Groenewegen M. A. T., 2000, A&A, 363, 901
- Harris & Zaritsky (2004) Harris J., Zaritsky D., 2004, AJ, 127, 1531
- Harris & Zaritsky (2009) Harris J., Zaritsky, D., 2009, AJ, 138, 1243
- Haschke, Grebel & Duffau (2011) Haschke R., Grebel E. K., Duffau, S., 2011, AJ, 141, 158
- Irwin et al. (2004) Irwin M. J., Lewis J., Hodgkin S., et al., 2004, SPIE, 5493, 411
- Lindegren & Perryman (1996) Lindegren L., Perryman, M. A. C., 1996, A&AS, 116, 579
- Lindegren (2010) Lindegren L., 2010, IAU Symposium, 261, 296
- Madore (1982) Madore B. F., 1982, ApJ, 253, 575
- Madore & Freedman (1991) Madore B. F. , Freedman W., 1991, PASP, 103, 933
- Marconi (2009) Marconi M., 2009, MmSAI, 80, 141
- Marconi, Musella, & Fiorentino (2005) Marconi M., Musella I., Fiorentino G., 2005, ApJ, 632, 590
- Marconi et al. (2010) Marconi M., Musella I., Fiorentino G., et al., 2010, ApJ, 713, 615
- Marquette et al. (2009) Marquette J.-B., Beaulieu J. P., Buchler J. R., et al., 2009, A&A, 495, 249
- Molinaro et al. (2011) Molinaro R., Ripepi V., Marconi M., Bono G., Lub J., Pedicelli S., Pel J. W., 2011, MNRAS, 413, 942
- Molinaro et al. (2012) Molinaro R., Ripepi V., Marconi M., Musella I., Brocato E., Mucciarelli A., Stetson P. B., Storm J., Walker A. R., 2012, ApJ, 748, 69
- Moretti et al. (2012) Moretti M. I., Clementini G., Ripepi V., et al., 2012, MNRAS, to be submitted (M12)
- Muller et al. (2004) Muller E., Stanimirović S., Rosolowsky E., Staveley-Smith L., 2004, ApJ, 616, 845
- Neilson & Langer (2012) Neilson H. R., Langer N., 2012, A&A, 537, 26
- Ngeow & Kanbur (2005) Ngeow C.-C., Kanbur S. M., 2005, MNRAS, 360, 1033
- Ngeow et al. (2005) Ngeow C.-C., Kanbur S. M., Nikolae, S., Buonaccorsi J., Cook K. H., Welch D. L., 2005, MNRAS, 363, 831
- Ngeow, Kanbur & Nanthakumar (2008) Ngeow C.-C., Kanbur S. M., Nanthakumar A., 2008 A&A, 477, 621
- Ngeow (2012) Ngeow, C.-C., 2012, ApJ, 747, 50
- Persson et al. (2004) Persson S. E., Madore B. F., Krzemiński W., et al., 2004, AJ, 128, 2239
- Putman et al. (1998) Putman M. E., et al., 1998, Nature, 394, 752
- Riess et al. (2011) Riess A. et al., 2011, ApJ, 730, 119
- Ripepi et al. (1997) Ripepi V., Barone F., Milano F., Russo G., 1997, A&A, 318, 797
- Ripepi et al. (2012) Ripepi V., Moretti M. I., Clementini G., Marconi M., Cioni M.-R. L., Marquette J. B., Tisserand P., 2012, Ap&SS, in press; also arXiv:1202.5863
- Romaniello et al. (2005) Romaniello M., Primas F., Mottini M., Groenewegen M. A. T., Bono G., François P., 2005, A&A, 429, 37
- Romaniello et al. (2008) Romaniello M., Primas F., Mottini M., Groenewegen M. A. T., Bono G., François P., 2008, A&A, 488, 731
- Rubele et al. (2012) Rubele S., Kerber L., Girardi L., et al., 2012, A&A, 537, 106 (Paper IV)
- Saha et al. (2001) Saha A., Sandage A., Tammann G. A., Dolphin A. E., Christensen J., Panagia N., Macchetto F. D., 2001, ApJ, 562, 314
- Sandage & Tammann (1968) Sandage A., Tammann G., 1968, ApJ 151, 531
- Sandage, Tammann & Reindl (2009) Sandage A., Tammann G. A., Reindl B., 2009, A&A, 493, 471S
- Soszyński et al. (2008) Soszyński I., Poleski R., Udalski A., et al., 2008, Acta Astron., 58, 163
- Soszyński et al. (2009) Soszyński I, Udalski A., Szymański M. K., al., 2009, Acta Astron., 59, 1
- Stanimirović et al. (2004) Stanimirović S., Staveley-Smith L., Jones P. A., 2004, ApJ, 604, 176
- Storm et al. (2011a) Storm J., Gieren W., Fouqué P., Barnes T. G., Pietrzyński G., Nardetto N., Weber M., Granzer T., Strassmeier K. G., 2011, A&A, 534, A94
- Storm et al. (2011b) Storm J., Gieren W., Fouqué P., Barnes T. G., Soszyński I., Pietrzyński G., Nardetto N., Queloz D., 2011, A&A, 534, A95
- Szabados (2003) Szabados L., 2003, IBVS, No. 5394
- Szewczyk et al. (2008) Szewczyk O., Pietrzyński G., Gieren W., et al., 2008, AJ, 136, 272
- Testa et al. (2007) Testa V., Marconi M., Musella I., Ripepi V., Dall’Ora M., Ferraro F. R., Mucciarelli A., Mateo M., Côté P., 2007, A&A, 462, 599
- Tisserand et al. (2007) Tisserand P., Le Guillou L., Afonso C., et al., 2007, A&A, 469, 387
- van Leeuwen et al. (2007) van Leeuwen F., Feast M. W., Whitelock P. A., Laney C. D., 2007, MNRAS, 379, 723
- van der Marel & Cioni (2001) van der Marel R. P., Cioni M.-R. L., 2001, AJ, 122, 1807
- van der Marel et al. (2001) van der Marel R. P., Alves D. R., Hardy E., Suntzeff N. B., 2002, AJ, 124, 2639
- Walker (2012) Walker A., 2012, Ap&SS.tmp, 746 in press, arXiv:1112.3171