The -ray emission region in the FRII Radio Galaxy 3C 111
Abstract
The Broad Line Radio Galaxy 3C 111, characterized by a Fanaroff-Riley II (FRII) radio morphology, is one of the sources of the Misaligned Active Galactic Nuclei sample, consisting of Radio Galaxies and Steep Spectrum Radio Quasars, recently detected by the Fermi-Large Area Telescope.
Our analysis of the 24-month -ray light curve shows that 3C 111 was only occasionally detected at high energies. It was bright at the end of 2008 and faint, below the Fermi-Large Area Telescope sensitivity threshold, for the rest of the time. A multifrequency campaign of 3C 111, ongoing in the same period, revealed an increase of the mm, optical and X-ray fluxes in 2008 September-November, interpreted by Chatterjee et al. (2011) as due to the passage of a superluminal knot through the jet core. The temporal coincidence of the mm-optical-X-ray outburst with the GeV activity suggests a co-spatiality of the events, allowing, for the first time, the localization of the -ray dissipative zone in a FRII jet. We argue that the GeV photons of 3C 111 are produced in a compact region confined within 0.1 pc and at a distance of about 0.3 pc from the black hole.
Subject headings:
galaxies: active galaxies: jets gamma-rays: galaxies: individual (3C111)1. Introduction
The Large Area Telescope (LAT) on board the Fermi -ray satellite (Atwood et al., 2009) has recently detected a handful of Misaligned Active Galactic Nuclei (MAGN), i.e., Radio Galaxies (RGs) and Steep Spectrum Radio Quasars (Abdo et al. 2010a, ). In spite of their small number, these -ray emitters are extremely appealing sources, as they offer a different perspective to approach the high energy phenomena.
For example, the study of the Spectral Energy Distribution (SED) of Fanaroff-Riley I (FRI) RGs such as NGC 1275 (Abdo et al. 2009a, ), M87 (Abdo et al. 2009b, ) and NGC 6251 (Migliori et al., 2011) has clearly evidenced the difficulty of the one-zone homogeneous Synchrotron Self-Compton model (SSC) in describing the jet emission within the AGN unified scheme. The SED modeling required low Lorentz factors (), implying bulk velocities of the RG jets much lower than typical values found in BL Lac objects (BLs). This is in contrast with the idea that blazars and MAGN are the same kind of source, only characterized by a different inclination angle of the jet (Urry Padovani 1995). As suggested by several authors (Georganopoulos Kazanas, 2003; Ghisellini et al., 2005; Giannios et al. 2010, ), this difficulty can be resolved if the hypothesis of a one-zone homogeneous emitting region is relaxed and a structured jet is assumed. In these models, an efficient (radiative) feedback between different zones at different velocities can reconcile the apparent FRI-BL discrepancy. In the MAGN sample detected by the Fermi-LAT, there is a clear predominance of nearby RGs with FRI morphology. High power radio sources (i.e., FRIIs) with GeV emission are rare. 3C 111 is indeed the only FRII Radio Galaxy of the sample with a secure -ray association. The rarity of -ray counterparts of FRIIs could be due to intrinsic jet differences (Grandi, 2011).
The exact localization of the -ray emitting region is however still an open problem. Fast GeV flux variations, observed on timescales of hours to days (Abdo et al 2010c) have unambiguously attested to the compact nature (but not the localization) of the -ray source in blazars. Very recently, Agudo et al. (2011a,b) claimed that multiwavelength outbursts, observed in two BLs, i.e., OJ 287 and AO , can occur in different zones along the jet, in the stationary core as well as in knots, even at larger distances ( pc) from the black hole. Furthermore, in the Flat Spectrum Radio Quasar PKS 1510089, the complexity of the radio to -ray variability was interpreted as being due to different events occurring along the jet as a knot propagates (Marscher et al., 2010). Constraining the black hole–-ray source distance is a critical issue. Indeed it has a strong impact on the physical models invoked to explain the high energy emission (Tavecchio et al. 2011).
In Radio Galaxies, the situation is even more complicated. Time variability is difficult to detect at GeV energies, because of poor statistics. In addition, the discovery of -ray emission from the radio lobes of Centaurus A shows that GeV photons can also originate from extended structures (Abdo et al. 2010d, ; Yang et al., 2012). In only one case, the FRI RG NGC 1275, flux variations on time scales of months were clearly detected in the LAT light curves (Abdo et al. 2010a, ; Kataoka et al., 2010) allowing the compact nature (but not the localization) of the -ray emitting region to be asserted. Only in the case of the FRI Radio Galaxy M87, some clues on the location were provided by the very high energy (VHE) photons, detected by the ground based Cherenkov telescopes (Aharonian et al. 2003, 2006; Acciari et al. 2008, Albert et al. 2008). The TeV flare in 2005 was simultaneous to a strong X-ray burst associated with the innermost knot in the jet (Harris et al. 2006). In 2008, the coincidence of the VHE and radio flares, monitored with the Very Long Baseline Array (VLBA), confined the VHE photon production within ten Schwarzschild radii (Acciari et al. 2009). A subsequent TeV flare in 2010 was related to a flux increase of the core in X-rays (Raue et al. 2011). The difficulty in the data interpretation does not allow an unequivocal spatial identification of the emitting region.
In this paper we present the first localization of a -ray flare in a FRII Radio Galaxy. The source, 3C 111, was observed by Fermi in a high state in late 2008, while a radio-optical-X-ray campaign was ongoing (Chatterjee et al. 2011, hereafter CH11). The mm-to--ray light curves combined with high resolution VLBA images indicate that the GeV flare occurred during the ejection of a bright plasma knot from the radio core.
2. The 3C 111 -ray flare
2.1. The source
3C 111 (z=0.0491; Eracleous et al. 2004), optically classified as a Broad Line Radio Galaxy (BLRG) shows a typical FRII morphology. It exhibits radio lobes, a strong core and a prominent 120 one-sided jet, terminating in the hot spot of the northeast lobe (Linfield Perley, 1984).
At a distance of 196 Mpc, the linear extension of the jet is 114 kpc (1=948 pc) in projection, assuming km s-1 Mpc-1, , and .
VLBA observations reveal a one-sided core-jet structure characterized by an intrinsic half opening angle and an inclination angle (Jorstad et al., 2005). The milliarsecond (mas) jet contains multiple superluminal components with apparent velocities (Kadler et al., 2008), ejected approximately every 5 months from the core (Jorstad et al., 2005).
The accretion disk of this source is very efficient in converting gravitational power into radiation, as attested by the presence of an iron K line detected by several X-ray satellites (CH11, Ballo et al. 2011).
3C 111 was one of the few sources in the MAGN sample proposed as a possible -ray counterpart of an EGRET detection (Hartman et al. 2008 and references therein, ) and subsequently confirmed by Fermi. In the first LAT catalog of AGN (1LAC; Abdo et al. 2010b, ), based on 11 months of data, the source was associated with the low latitude -ray source 1FGL J0419.03811 (detection significance ) with a high probability (). 3C 111 was still detected with a similar significance after 15 and 24 months of survey (Abdo et al. 2010a, ; Kataoka et al., 2011). It is not listed in the second LAT AGN catalog (Ackermann et al., 2011), where only sources with a detection are included. Indication of possible time variability was first suggested by Hartman et al. (2008). They noted that the source only occasionally became bright ( phot cm-2 s-1) and detectable by EGRET, suggesting a low duty cycle for the -ray emission. The Fermi light curve, based on 15 months of data, revealed a similar behavior. 3C 111 was detected with a significance larger than 3 only in 2008 August-November (Abdo et al. 2010a, ).
2.2. The 24-month -ray light curve
Taking advantage of the recent improvement of the instrument response functions (IRFs) and the background models, we produced a new 0.1-100 GeV light curve of 3C 111 from 2008 August to 2010 August using a bin time of 2 months. The Fermi-LAT ScienceTools software (version v9r23p1) was used with the P7SOURCEV6 set of instrument response functions. The time intervals when the rocking angle of the LAT was greater than were rejected and a cut on the zenith angle of -rays of 100∘ was applied. The model for which we calculated a binned likelihood is the combination of point-like and diffuse sources located within a region of interest (RoI) having a radius of 15∘ and centered on 3C 111. For each point-like source the spectral slope was frozen to the best fit value provided by the Fermi-LAT Second Source Catalog (2FGL; Nolan et al., 2012). The RoI model also includes sources falling between 15∘ and 20∘ from the target source, which can contribute to the total counts observed in the RoI due to the energy-dependent size of the point-spread function of the instrument. For these additional sources, normalizations were also fixed to the values of the 2FGL catalog. The spectral model used for 3C 111 is a power law (F=kE-Γ) with the spectral slope fixed to the value reported in 1LAC paper . Note that the uncertainties have very negligible effect on the flux calculation. A Galactic emission model (gal2yearp7v6v0.fits) and an extragalactic and instrumental background (isotrop2yearP76sourcev0.txt) were used to model the background. We evaluated the significance of the detection given by the Test Statistic TS=log(likelihood) between the models with and without the source (Mattox et al. 1996). When the TS was less than 10, the bin flux value at F GeV was replaced by a 2 upper limit, calculated by finding the point at which 2log(likelihood)=4 when increasing the flux from the maximum-likelihood value.
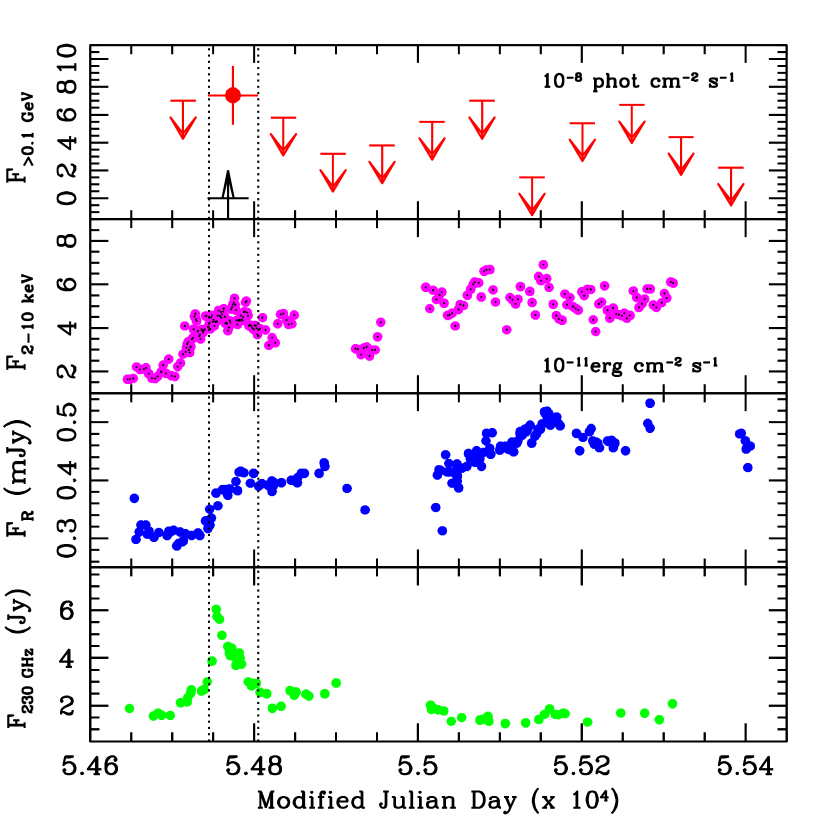
The 24-month light curve confirms the high state of 3C 111 in late 2008 (Fig. 1-left panel): the source appears to spend not more than two months flaring and then drops below the LAT sensitivity threshold. In order to better constrain the -ray flare shape, a more dense LAT time sampling from 2008 August to December was then performed. A light curve was generated by dividing the time interval into bins of 1 month duration and repeating the likelihood analysis for each interval (Fig. 1- right panel). The source is detected with a significance of (TS=9.7) only on one occasion, indicating that the GeV flare peaked between October 4 and November 4. It is probable that the major -ray activity was at the beginning of October. A likelihood analysis performed using a sampling of only 15 days shows that the largest Test Statistic value (TS=7) is observed between October 4 and 19.
2.3. Localization of the -ray dissipation region
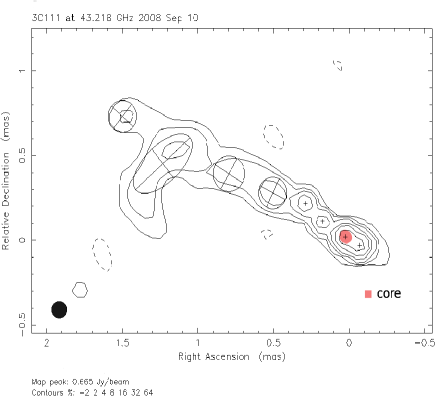
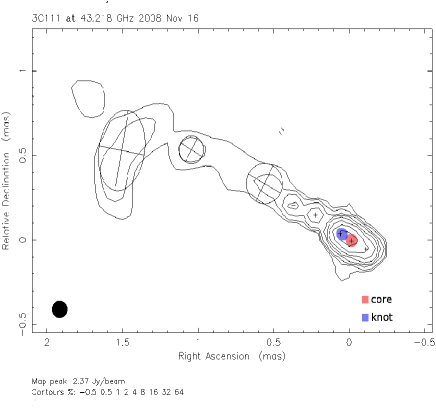
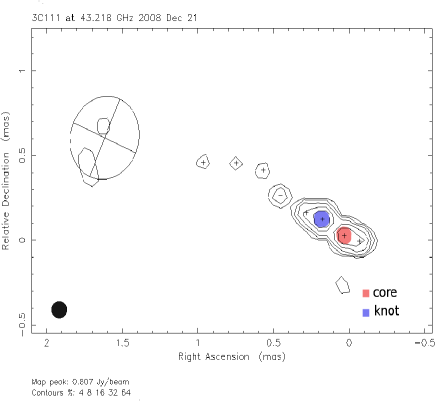
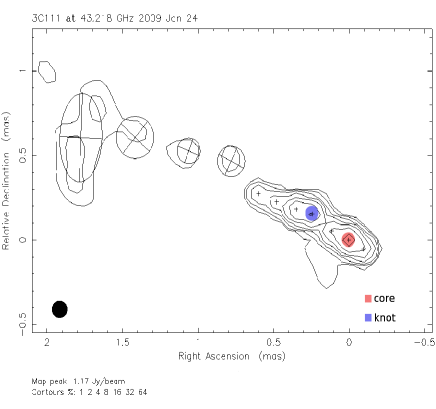
As a multiwavelength campaign of 3C 111 (CH11) was ongoing in the same period monitored by LAT, it was possible to compare the -ray data with mm-optical-X-ray light curves (Figure 2). The simultaneity of the flare is impressive: the source luminosity was increasing from mm to X-ray frequencies exactly when the greatest flux of -ray photons occurred. This is a clear indication of the co-spatiality of the event. As attested by the TeV-radio campaigns organized for the RG M87 (Acciari et al. 2009), a fruitful approach to identify the zone where high energy photons are produced is to follow the jet dynamics at mas scales. We therefore investigated the VLBA images at 43 GHz made available by the blazar research group at Boston University111http://www.bu.edu/blazars/ and discussed in CH11. Looking at Figure 6 of CH11, it appears evident that a deep modification of the core-jet system took place in late 2008. As deduced by the same authors, on October 29 (with an uncertainty of days) a new component was ejected from the stationary core. In order to quantify the jet dynamics, we analyzed the VLBA images at four epochs, before (2008 September) and after (2008 November–December, 2009 January) the appearance of the new blob. To minimize the free parameters, the model fitting of the (u,v) data were performed with DIFMAP (Shepherd 1997) using the simplest models (i.e., delta, circular Gaussian, elliptical Gaussian). The model components were added to the residual images with a restored beam size of 0.1 mas (Figure 3). This is the angular resolution in the direction of the jet propagation, obtained with a suitable weighting of the visibilities. The brightest component was identified as the stationary core, while the westernmost component, at a distance of 0.1 mas from the core, was associated with a possible counter-jet. The new knot was emerging in November and appears clearly separated from the core in the successive epochs. It is beyond the aim of this paper to attest the real nature of the westernmost feature. However, we note that our analysis of 8 epochs, from 2008 June to 2009 February, indicates that the candidate counter-jet does not show any significant systematic displacement. In the assumption that the counter-jet is stationary with respect to the core, we can estimate the position errors from its position scatter. Using the mentioned 8 epochs, the scatter is 0.005 mas. The flux densities of the different jet components, when close to each other, are difficult to disentangle even with the model fitting procedure used here. For this reason, we preferred to follow the core evolution, considering the variation of the total flux density, including the contribution of the stationary feature, the counter-jet and, when separated, the new ejected knot. In 2009 January, a small component between the head of the ejected blob and the core is evident. Its flux was also included, given the difficulty in establishing its nature. It could be a new emerging knot or simply a disruption/elongation of the component ejected in 2008 (see also Großberger et al. 2011). The speed of the knot, considering the blob-core distance at three different epochs (2008 November - 2009 January), is 1.07 mas yr-1 (c) and the ejection time, obtained by extrapolating the linear (core-knot distance vs time) fit, is 2008.80. Our is in agreement, within the uncertainties, with the value of CH11, while our is smaller, because we considered only the 3 epochs closest to the ejection. It is interesting to notice that, assuming an inclination angle of 18∘ and apparent velocity c, the arm length ratio222The arm lenght ratio is the ratio between the apparent length of the approaching () and receding () jets, defined as Q=, being the bulk jet velocity in units of the speed of light (Longair & Riley 1979) is about 20. As a consequence, the observed approaching components extending mas from the core (Figure 3) should be compressed to mas on the receding side. This latter value is consistent with the unresolved size of the counter-jet in the VLBA images.
The light curve of the core is shown in Figure 4. The brightness increases from August to November, following the evolution of the multiwavelength flare (Figure 2), then decreases when the new radio component becomes visible (Figure 3).
Finally, we note that two other knots could have been ejected by the core at the beginning of 2009 (CH11). These minor events caused no significant amplification of the GeV radiation. It seems that only exceptional jet perturbations can boost the gamma-ray flux above the LAT sensitivity threshold.
3. Conclusions
Marscher et al. (2002) in an enlightening paper on the RG 3C 120 noted that a dip in the X-ray light curve is generally associated with an expulsion of a bright superluminal radio knot. It was suggested that, as in microquasars, the inner regions of an efficient accretion disk could be accelerated, causing a shock front streaming along the jet.
3C 111 is quite similar to 3C 120. They are both BLRGs probably hosting a disk-corona system (Haardt Maraschi 1991). CH11, exploring the radio optical and X-ray light curves of 3C 111 noted, also for this source, a strong suppression of X-rays followed by the appearance of a new component in the high resolution radio maps. They interpreted the flux increase, quasi-simultaneously observed at mm-optical and X-ray frequencies after the dip, as the passage of a new knot through the jet stationary core (see also Bell Comeau 2011 for a different interpretation). Incidentally, we note that the Suzaku X-ray satellite observed 3C 111 before the flare, during the dip, on 2008 August 22, and XMM-Newton observed it after the blob ejection in 2009 February 15 (Ballo et al., 2011; Torresi et al., 2012). As expected, there is a difference in the 2–10 keV flux by about a factor 2 between the observations.
An absorption blueshifted feature, associated with the resonant Fe XXVI Ly transition, was revealed by Suzaku but not by XMM-Newton. This absorption line could originate in a fast disk-wind (Ballo et al. 2011 and references therein). If this detection will be confirmed, the episodic presence of hard X-ray absorption features could represent a signature of an ongoing disk-jet perturbation.
Our analysis of 24-month Fermi data reveals that the production of GeV photons is related to these phenomena. First of all, the short time interval of 3C 111 detectability ( days) by the LAT denotes the compactness of the emitting region. Causality arguments show that it cannot be larger than 0.1 pc , if a Doppler factor of (Jorstad et al., 2005) is assumed. This immediately allows us to exclude the radio lobes as the main source of -rays. Note that assuming an extreme time variability of 15 d reduces the radial extent to 0.04 pc. In addition, 3C 111 was detected by the LAT exactly when the mm, optical and X-ray fluxes were rising. The temporal coincidence of the mm-optical X-ray and -ray flares unambiguously implies a co-spatiality of the event. Since the outburst of photons is directly connected to the ejection of a new radio knot, it is natural to localize the -ray source in the radio core region, the size of which cannot be larger than 0.3 pc, corresponding to the VLBA angular resolution of 0.1 mas.
The distance between the stationary radio structure and the black hole (dbh-c) is unknown. However, a weak VLBA feature is seen at a distance of 0.1 mas from the core (dc-cj), just on the opposite side of the ejected bright knot. If this is the counter-jet, as we suggest, the black hole necessarily lies within 0.1 mas (i.e., dbh-cdc-cj). As a consequence, the distance of the –ray dissipation region from the central engine has to be of the same order of magnitude or slightly larger depending on the position of the -ray source with respect to the counter-jet. This black hole--ray source distance (0.1 mas corresponding to 0.3 pc), is surely a conservative upper limit. Indeed a recent estimate of the separation between the black hole and the base of the jet in the RG M87 (Hada et al. 2011) indicates shorter distances between these components: the stationary core seems to be at not more than about twenty Schwarzschild radii from the central engine.
References
- (1) Abdo A. A., et al. 2009a, ApJ, 706, 275
- (2) Abdo A. A., et al. 2009b, ApJ, 707, 55
- (3) Abdo A. A., et al. 2010a, ApJ, 720, 912 (MAGN)
- (4) Abdo A. A., et al. 2010b, ApJ, 715, 429 (1LAC)
- (5) Abdo A. A., et al. 2010c, ApJ, 722, 520
- (6) Abdo A. A., et al. 2010d, Science, 328, 725
- Acciari et al. (2008) Acciari V. A., et al. 2008, ApJ, 679, 397
- Acciari et al. (2009) Acciari V. A., et al. 2009, Science, 325, 444
- Ackermann et al. (2011) Ackermann, M., et al. 2011, ApJ, 743, 171
- (10) Agudo, I., Jorstad, S. G., Marscher, A. P., et al. 2011a, ApJ, 726, L13
- (11) Agudo, I., Marscher, A. P., Jorstad, S. G., et al. 2011b, ApJ, 735, L10
- (12) Aharonian, F., Akhperjanian, A., Bazer-Bachi, A. R., et al. 2006, Science, 314, 1424
- ah (6) Aharonian, F., Akhperjanian, A., Beilicke, M., et al. 2003, A A, 403, 9
- (14) Albert, J., Aliu, E., Anderhub, H., et al. 2008, ApJ. 685, 23
- Atwood et al. (2009) Atwood, W. B., et al. 2009, ApJ, 697, 1071
- (16) Bell, M., and Comeau, S. P . 2011 Astrophysics and Space Science in press (arXiv:1112.4803)
- Ballo et al. (2011) Ballo, L., Braito, V., Reeves, J. N. et al. 2011, MNRAS, 418, 2367
- Chatterjee et al. 2011, hereafter CH (11) Chatterjee, R., Marscher, A. P., Jorstad, S. G., et al. 2011, ApJ, 734, 43 (CH11)
- (19) Elvis, M., Wilkes, B. J., McDowell, J. C., et al. 1994, ApJS, 95, 1
- Eracleous et al. (2004) Eracleous, M. Halpern, J. P. 2004 , ApJS, 150, 181
- Georganopoulos Kazanas (2003) Georganopoulos, M., Kazanas, D. 2003, ApJ, 589, L5
- Ghisellini et al. (2005) Ghisellini, G., Tavecchio, F. , Chiaberge, M. 2005, AA, 432, 401
- Ghisellini et al. (2008) Ghisellini, G. Tavecchio, F. 2008, MNRAS, 387, 1669
- (24) Giannios, D., Uzdensky, D. A., Begelman, M. C.2010, MNRAS, 402, 1649
- Grandi (2011) Grandi P. 2011, Proceedings of the workshop ”High Energy Phenomena in Relativistic Outflows III” (HEPRO III), Barcelona, June 27 - July 1, 2011 (arXiv:1112.2505)
- (26) Großberger M., Kadler, M., Wilms, J., et al. 2011, proceedings of 8th INTEGRAL/BART workshop (arXiv:1110.1197)
- hada (11) Hada, K., et al. 2011, Nature, 477, 185
- Harris (2006) Harris, D. E., Cheung, C. C., Biretta, J. A., et al. 2006, ApJ, 640, 211
- (29) Hartman, R. C., Kadler, M., Tueller, J. 2008, ApJ, 688, 852
- Jorstad et al. (2005) Jorstad, S. G., Marscher, A. P., Lister, M., et al. 2005, ApJ, 130, 1418
- Kadler et al. (2008) Kadler, M., Ros, E., Perucho, M., et al. 2008, ApJ, 680, 867
- Kataoka et al. (2010) Kataoka, J, Stawarz L., Cheung, C. C. et al. 2010, ApJ, 715, 554
- Kataoka et al. (2011) Kataoka, J., Stawarz, L., Takahashi, Y., et al. 2011, ApJ, 740, 29
- Lewis et al. (2005) Lewis, k. T., Eracleous, M., Gliozzi, M., et al. 2005, ApJ, 622, 816
- Linfield Perley (1984) Linfield, R. and Perley, R. 1984, ApJ, 279, 60
- (36) Longair, M. S. Riley, J. M. 1979 MNRAS, 188, 625
- ma (91) Haardt, F. Maraschi, L. 1991, ApJ, 380, 51
- Marscher et al. (2002) Marscher, A.P., et al. 2002, Nature, 417, 625
- Marscher et al. (2010) Marscher, A. P., Jorstad, S. G., Larionov, V. M., et al. 2010, ApJ, 710, L126
- (40) Mattox, J. R., Bertsch, D. L., Chiang, J., et al. 1996, ApJ, 461, 396
- Migliori et al. (2011) Migliori, G., Grandi, P., Torresi, E., et al. 2011, AA, 533, 72
- 2FGL; Nolan et al. (2012) (Nolan P.) Abdo A. A., et al. 2012, ApJS in press (arXiv:1108.1435)
- Yang et al. (2012) Yang, R., Sahkyan, N., et al. 2012, AA, in press (arXiv:1201.1217)
- Raue et al. (2011) Raue M., et al. 2011 Proceedings of the workshop ”High Energy Phenomena in Relativistic Outflows III” (HEPRO III), Barcelona, June 27 - July 1, 2011 (arXiv1111.5344)
- Sargent (1977) Sargent, W. L. W. 1977, ApJ, 212, L105
- S (97) Shepherd M. C. 1997, Astronomical Data Analysis Software and Systems VI, Vol. 125, ASP Conf. Ser., 77
- (47) Tavecchio, F., Becerra-Gonzalez, J., Ghisellini, G., et al. 2011, A&A, 534, 86
- Torresi et al. (2012) Torresi E., 2012 Fermi Jansky Proceedings - eConf C1111
- (49) Urry, C. M. Padovani, P. 1995, PASPJ, 107, 803