On the nature of the Herbig B[e] star binary system V921 Scorpii:
Geometry and kinematics of the circumprimary disk on sub-AU scales111Based on observations made with ESO telescopes
at the Paranal Observatory under the open-time program ID
084.C-0668(A, B) and with the Magellan Clay telescope.
Abstract
V921 Scorpii is a close binary system (separation 0.025″) showing the B[e]-phenomenon. The system is surrounded by an enigmatic bipolar nebula, which might have been shaped by episodic mass-loss events, possibly triggered by dynamical interactions between the companion and the circumprimary disk (Kraus et al., 2012a). In this paper, we investigate the spatial structure and kinematics of the circumprimary disk, with the aim to obtain new insights into the still strongly debated evolutionary stage. For this purpose, we combine, for the first time, infrared spectro-interferometry (VLTI/AMBER, ) and spectro-astrometry (VLT/CRIRES, ), which allows us to study the AU-scale distribution of circumstellar gas and dust with an unprecedented velocity resolution of 3 km s-1. Using a model-independent photocenter analysis technique, we find that the -line emitting gas rotates in the same plane as the dust disk. We can reproduce the wavelength-differential visibilities and phases and the double-peaked line profile using a Keplerian-rotating disk model. The derived mass of the central star is , which is considerably lower than expected from the spectral classification, suggesting that V921 Sco might be more distant ( kpc) than commonly assumed. Using the geometric information provided by our spectro-interferometric data and Paschen, Brackett, and Pfund line decrement measurements in 61 hydrogen recombination line transitions, we derive the density of the line-emitting gas ( m-3). Given that our measurements can be reproduced with a Keplerian velocity field without outflowing velocity component and the non-detection of age-indicating spectroscopic diagnostics, our study provides new evidence for the pre-main-sequence nature of V921 Sco.
Subject headings:
stars: pre-main sequence — stars: individual (V921 Scorpii) — stars: emission-line, Be — binaries: close — protoplanetary disks — accretion, accretion disks — techniques: interferometric1. Introduction
The class of the B[e] stars comprises some of the most peculiar and mysterious objects of stellar astrophysics. In particular, it has been found that the class-defining characteristics, which include infrared excess and strong permitted and forbidden line emission, are observed in a wide range of evolutionary stages, including stars of pre-main-sequence, post-main-sequence, and unknown nature (unclassified B[e] stars, Lamers et al. 1998). An enigmatic member of the latter category is V921 Scorpii (catalog ) (=Hen 3-1300, MWC 865, CD -42∘11721). Despite more than one hundred studies that have been conducted over the last four decades, the stellar parameters and evolutionary stage of V921 Sco remain strongly debated. These uncertainties arise primarily from problems in distance estimation, where values between 160 pc (Hillenbrand et al., 1992) and 2.6 kpc (Shore et al., 1990) have been proposed. Furthermore, due to the lack of photospheric lines in the optical spectrum, the existing spectral classifications are based on rather indirect methods, such as photometric modeling or the ionization analysis of circumstellar emission lines. Accordingly, the derived effective temperatures (12,300 K to 31,600 K; Hillenbrand et al. 1992; Cidale et al. 2001) and spectral types (Aep to B0[e]p; de Winter & The 1990; Natta et al. 1993) exhibit a considerable spread, which prevents a clear Hertzsprung-Russell diagram classification and has lead authors to argue both for an evolved (supergiant; Hutsemekers & van Drom 1990; Borges Fernandes et al. 2007) and young (Herbig B[e]; de Winter & The 1990; The et al. 1994; Benedettini et al. 1998; Habart et al. 2003; Acke et al. 2005; Acke & van den Ancker 2006) object nature.
The aim of this paper is to gain new insights on the astrophysical nature of V921 Sco, and B[e] stars in general, by studying the spatial distribution and kinematics of the circumstellar gas and dust. These constraints will inform us about the disk-formation mechanism (i.e. accretion versus excretion), and, thus, the evolutionary state of V921 Sco. For instance, accretion disks around young stars are believed to exhibit a Keplerian rotation profile, while the radiation-driven winds from evolved stars should exhibit a strong outflowing velocity component (Lamers & Pauldrach, 1991). Given the possible kiloparsec distance of V921 Sco, this task requires both high angular and high spectral resolution, which we achieve in our study by combining, for the first time, two highly complementary techniques, namely spectro-interferometry (VLTI/AMBER, providing milliarcsecond angular resolution and spectral resolution ) and spectro-astrometry (VLT/CRIRES, ). From these spatially and spectrally resolved constraints, we derive the gas velocity field on scales down to a few stellar radii.
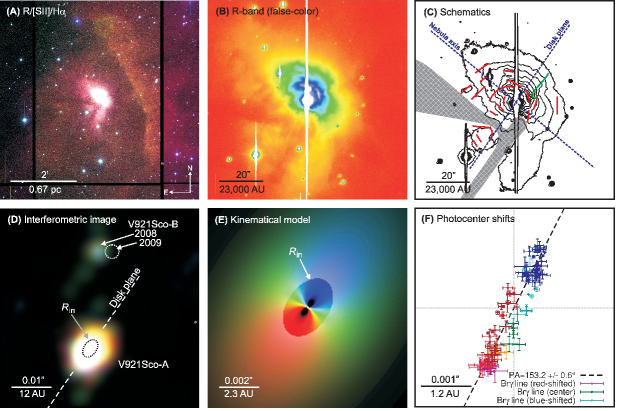
In a recent study (Kraus et al., 2012a, Paper I), we already obtained milliarcsecond-resolution continuum interferometric images of V921 Sco in three wavelength bands (1.65, 2.0, and 2.3 m) and discovered a close (separation milliarcseconds=mas) companion, as well as a continuum-emitting disk with an apparent size of mas (Gaussian FWHM along major axis). In addition, we obtained images of the surrounding large-scale bipolar nebula and detected multi-layered, shell-like substructures that might have been shaped by episodic mass-loss events. Based on roughly matching timescales between the estimated orbital period and the mass-ejection period, we suggested that the mass-ejection events might be triggered by the newly discovered companion.
For the stellar parameters of V921 Sco, we adopt in this study a luminosity , effective temperature K, a distance of pc, , and a stellar radius of (Borges Fernandes et al., 2007). The implications of a modified set of fundamental parameters will be discussed in Sect. 5.2.
In the following, we present our spectro-interferometric (Sect. 2.1), spectro-astrometric (Sect. 2.2), and spectroscopic (Sect. 2.3) observations, followed by a discussion and quantitative modeling, both in the continuum (Sect. 3) and the -line (Sect. 4). Finally, we will interpret our modeling results (Sect. 5) and conclude with a brief summary of our findings (Sect. 6).
2. Observations
2.1. VLTI/AMBER spectro-interferometry
Infrared interferometers, such as ESO’s Very Large Telescope Interferometer (VLTI), coherently combine the light from separate apertures in order to achieve an unprecedented angular resolution of a few milliarcseconds at infrared wavelengths. With a spectral resolving power of up to , these instruments now enable investigations both in the continuum emission and in spatially and spectrally resolved gas-tracing lines. The measured visibility amplitudes, closure phases, and wavelength-differential phases (DPs) provide powerful constraints for model-fitting or can be used for the reconstruction of interferometric images.
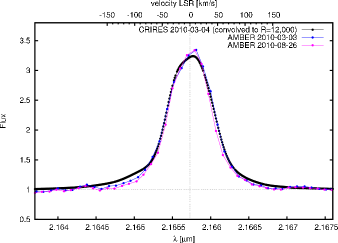
First spectro-interferometric observations on V921 Sco using the VLTI near-infrared beam combiner instrument AMBER (Petrov et al., 2007) were presented by Kraus et al. (2008b), Kreplin et al. (2012), and in Paper I and provided low (LR-HK, ) and medium (MR-K, ) spectral resolution. Here, we present new observations using AMBER’s unique high spectral resolution mode (HR-K, ). The new data sets were obtained on 2010-03-03 and 2010-08-26 using the 8.2 m unit telescopes UT2, UT3, and UT4 and cover a wavelength window around the 2.16602 m line.
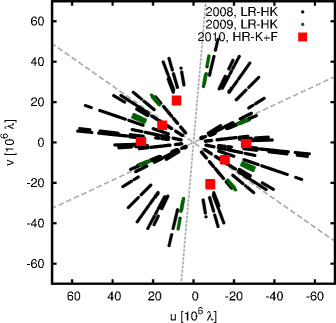
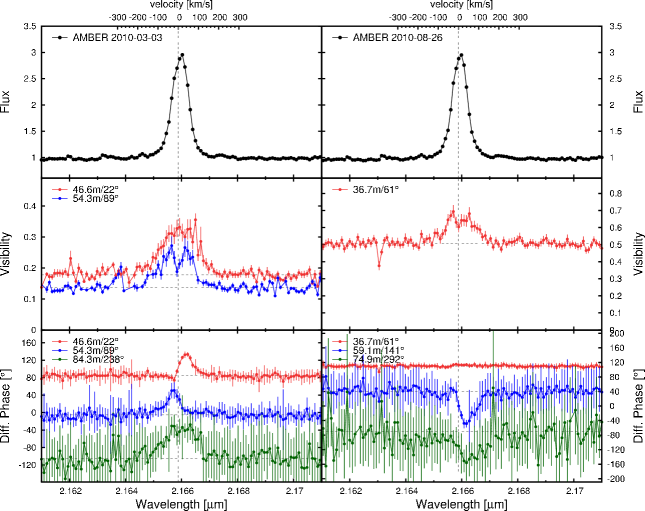
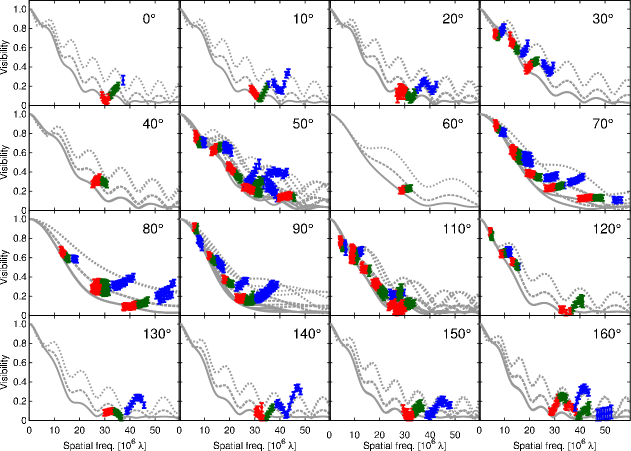
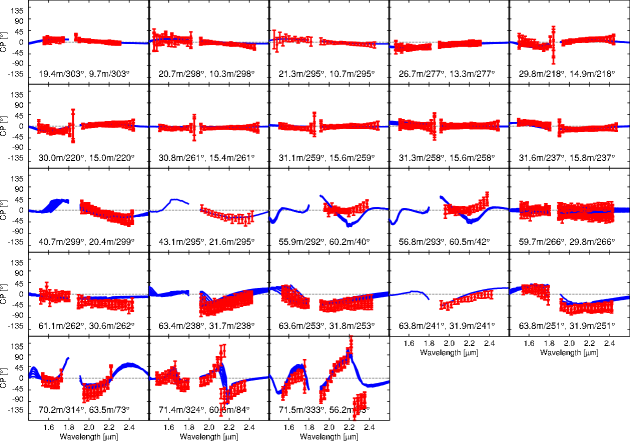
In order to yield sufficient signal-to-noise ratio (SNR) for our high spectral resolution observations, we employed the FINITO fringe tracker instrument (Gai et al., 2004; Le Bouquin et al., 2008). This instrument measures and corrects the atmosphere-induced phase perturbations and allowed us to record the optical path delay (OPD)-stabilized interferograms with a long detector integration time of 3 s. Unfortunately, the tracking performance of FINITO was degraded for the longest baselines due to the low visibility contrast in this baseline regime. Based on the poor SNR, we rejected the visibility measurements for one baseline from 2010-03-03 (UT2-UT4) and two baselines from 2010-08-26 (UT2-UT4, UT3-UT4). The remaining baselines exhibit fringe SNRs up to 3.5, 4.5, and 14, and cover baseline lengths between 36.7 and 84.3 m and PAs between 22 and (Fig. 1). The data shows a double-peaked, rising visibility profile in the -line as well as non-zero DPs (Fig. 2).
The wavelength calibration was done using atmospheric telluric features close to the -line and by applying a heliocentric-barycentric system correction with heliocentric velocities of km s-1 (2010-03-03) and km -1 (2010-08-26), respectively.
Each observation on V921 Sco was accompanied by observations on the interferometric calibrator HD 161068 (catalog ), for which we assume a uniform-disk diameter of mas (Mérand et al., 2006). Both for the science and calibrator star observations, we extract raw visibilities, closure phases, and DPs using the amdlib (V3.0) data reduction software (Tatulli et al., 2007b; Chelli et al., 2009).
Due to the influence of residual vibration, it is known that AMBER+FINITO observations with long DIT, such as used for our HR-K mode observations, might result in a poor absolute visiblity calibration, while the wavelength-differential observables are only marginally affected (e.g. Tatulli et al., 2007a). To recalibrate the absolute continuum visibility level of the HR-K observations, we make use of our earlier LR-HK observations (Paper I) and the best-fit continuum model (Model DISK), which will be described in more detail in Sect. 3. We investigated the influence of frame selection in the course of our data reduction procedure and find that the wavelength-differential signatures are very robust when selecting, for instance, the 80%, 50%, 20%, or 10% of frames with the best SNR. Given that the statistical noise increases with decreasing frame number and that low-SNR frames are down-weighted during the averaging process in a natural fashion, we decided to employ the observables from the full, unselected data sets for our analysis.
In order to associate the closure phase sign with the on-sky orientation, we use a reference data set111The reference data set can be accessed on the website http://www.stefan-kraus.com/files/amber.htm on the binary star Orionis C (Kraus et al., 2009b). To calibrate the wavelength-differential phases, we make use of the fact that the continuum photocenter is systematically offset with respect to the -line emission due to the presence of a close companion star. Using the well-established continuum closure phase sign calibration, we first determine the position angle222In this paper, all position angles are measured east of north. (PA) of the companion star (Sect. 3) and then adjust the DP sign in our spectro-interferometric and spectro-astrometric data in order to match the direction of the continuum photocenter displacement. This procedure calibrates the DP sign unambiguously, and might serve also as a reference for other studies using AMBER’s HR-mode. Recently, we employed this calibration in order to determine the rotation sense of the disk around the classical Be star CMi (Kraus et al., 2012b). Since CMi was observed using both AMBER’s MR and HR-mode, we can also extend the calibration to AMBER MR-mode observations, which resulted in a recalibration of the Tau rotation sense (Kraus et al., 2012b) compared to earlier studies (Štefl et al., 2009).
The statistical error bars on the DPs vary strongly for the different baselines, which is both a result of the low fringe contrast at the longest baselines and of differences in the vibration properties of the UTs. These differences might give overproportional weight to the short baselines in our -fitting procesure. Therefore, based on the typical root-mean-square noise in the continuum channels, we include a minimum DP error of for all baselines in the fitting procedure.
2.2. VLT/CRIRES spectro-astrometry
Spectro-astrometry uses high signal-to-noise (SNR) long-slit spectra to measure the centroid position of an unresolved object as function of wavelength. Since the centroid position can be measured with much higher precision than the size of the point-spread function (Bailey, 1998b), this method allows one to measure sub-mas photocenter displacements in spectrally resolved emission lines. While the earliest astronomical applications in the field of star formation focused on the detection of close companions (e.g. Bailey, 1998a), later studies also successfully applied spectro-astrometry to more general cases, such as outflow signatures (Takami et al., 2003; Whelan et al., 2005) or the characterization of the gas kinematics in protoplanetary disks (Pontoppidan et al., 2011; Goto et al., 2012).
Our spectro-astrometric observations on V921 Sco were obtained using the VLT near-infrared high-resolution spectrograph CRIRES (Kaeufl et al., 2004). The measurements were obtained on 2010-03-04, UT 07:51 to 08:58 using an integration time of 5 s and a slit width of 0.2″, resulting in a spectral resolution of . In order to apply the spectro-astrometry technique, we recorded spectra towards three different position angles (55∘, 115∘, 175∘), and the corresponding anti-parallel position angles (235∘, 295∘, 355∘), complementing the position angles probed by interferometry (Fig. 1). To maximize the flux in the slit, the spectra were recorded using the STRAP adaptive optics system, resulting in a typical PSF Gaussian FWHM of mas. The measured spectra were corrected to the heliocentric-barycentric system using a heliocentric velocity of km s-1. The spectra were extracted using the ESO CRIRES data reduction pipeline (version 1.12.0).
Besides the 2.166078 m line, which was covered by CRIRES detector #3, our observation also covered the Mg ii 2.137 m line in detector #1. This line has also been detected in other B[e] stars (Clark et al., 1999). To compute velocities in the local standard of rest (LSR), we assumed a systemic velocity of km s-1, which we adopt from the forbidden line measurements by Borges Fernandes et al. (2007).
In order to correct the spectrum for telluric spectral features, we observed the early G-type star Hip84425 and we modeled the intrinsic -absorption using an infrared solar spectrum recorded with ACE-FTS (Hase et al., 2010).
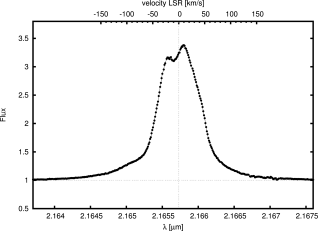
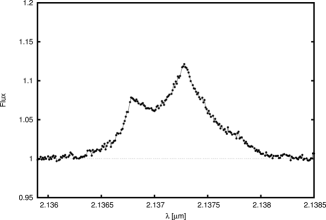
The final spectra are shown in Fig. 3 and reveal a very narrow (FWHM 0.0006560 m or km s-1) and double-peaked line profile with a very small peak separation of just m ( km s-1). In addition to the -line spectrum, which will be discussed and modeled in Sect. 4, we have also recorded the Mg ii 2.137 m line. For the Mg ii-line, the peak separation is significantly wider (m or km s-1), indicating that this line originates at smaller stellocentric radii in the circumstellar environment. This finding is consistent with our non-detection of a spectro-astrometric signal within this line.
To derive the astrometric signal, we compute for each spectral channel the beam centroid position (Pontoppidan et al., 2011) in spatial direction
| (1) |
where defines the size of the virtual aperture (we use pixel around the center of the PSF) and is defined as the ratio between the flux in the virtual aperture and the total PSF (). The astrometric signals are derived for each position angle () and its anti-parallel counterpart () and then subtracted in order to remove potential artefacts (Brannigan et al., 2006):
| (2) |
The interpretation of spectro-astrometric signals is complicated by the fact that this technique measures only the first-order momentum in the brightness distribution (relative position), but is insensitive to higher-order momenta (angular size, asymmetry, kurtosis; see Lachaume, 2003) as well as the continuum-emitting geometry, which limits this technique to relatively simple cases or requires additional model assumptions. In this study, we make use of the fact that photocenter displacements measured with spectro-astrometry are mathematically equivalent to the DPs measured in spectro-interferometry, which allows us to directly combine the spectro-interferometric (Visibility, DP, closure phases) and spectro-astrometric observables (photocenter displacements) for quantitative modeling (Sect. 4.2), providing unique constraints on the AU-scale spatial distribution and kinematics of the circumstellar gas and dust. For this purpose, we translate the measured astrometric signal into the equivalent DP using the relation
| (3) |
where is the FWHM of the PSF measured in the spectrum (typically mas). In order to give a similar weight to the AMBER and CRIRES measurements, we assume a minimum DP error of for our CRIRES DPs.
2.3. Magellan/FIRE near-infared spectroscopy
We recorded a high-resolution, high-SNR near-infrared spectrum of V921 Sco using the FIRE Echelle spectrograph (Simcoe et al., 2008) mounted at the Magellan/Baade 6.5 m telescope. With a 0.45″ slit, this instrument provides a spectral resolution and a wide wavelength coverage from 0.8 to 2.5 m. The spectrum was recorded on 2011-03-12 using an A-B-B-A dithering pattern with DITs of 10 s (high gain mode, to obtain high SNR in the , and -band) and 5 s (low gain mode, in order to avoid saturation in the - and -band). The slit was oriented along the disk polar axis derived from our interferometric observations (PA=56∘). To correct for telluric features, we observed the A0V-type standard star HD 122945 (catalog ). The data reduction was performed using the standard FIRE data reduction pipeline developed at MIT, which performs also a spectro-photometric calibration based using the photometry of the standard star. Trying different combinations of target star / standard star data sets, we find that the derived spectral slopes are consistent on the level of a few percent, while the derived absolute flux levels show some larger scatter in the % range. In order to improve on the calibration, we fit a fifth-order polynomical in order to extract the spectral slope and then use archival ISO photometry in order to recalibrate the absolute flux at m which yields also a satisfying match with 2MASS -, -, and -band photometry (the derived flux densities match within 20%). The derived absolute-calibrated FIRE spectrum is corrected for reddening (, Borges Fernandes et al., 2007) using the extinction law from Cardelli et al. (1989, ).
At the longest wavelengths, the SNR in our final spectrum is reduced compared to the - and -band since some of the recorded frames had to be rejected due to saturation in this part of the spectrum. In particular, the saturation occurs in sky lines, resulting in some narrow spikes in the final corrected spectrum.
3. Results: Continuum geometry
In the following, we investigate the continuum structure of the circumprimary disks using the VLTI/AMBER low spectral dispersion data presented in Paper I. In this earlier study, the circumprimary disk emission was approximated with a Gaussian brightness distribution (in the following denoted “GAUSS” model), which provided a sufficient representation to extract the astrometric information for the companion star. However, the relatively large -value of 4.30 already indicates that this simple geometry does not provide an appropriate representation of the circumprimary disk structure. Therefore, we consider here a more realistic parameterization for the structure of the circumprimary disk, using a disk temperature-gradient model (in the following denoted “DISK” model).
In the DISK model, the emission extends from an inner truncation radius to an outer radius and radiates as a black-body with , where denotes the temperature at the inner disk radius and is the temperature power-law index. In addition, we introduce the inclination angle and position angle , which define the projection ratio () and on-sky orientation of the disk major axis. The inclination is measured from the polar axis (i.e. is pole-on). As in our earlier modeling attempts, the DISK model includes the photospheric emission of the primary and secondary star, which are parameterized by the companion separation () and PA (), the angular extension of the circumsecondary material (given by a Gaussian with FWHM ), and two parameters (, ) to describe the photospheric flux contributions of V921 Sco B to the total flux as function of wavelength: .
We employ a Levenberg-Marquardt least square fitting procedure and find the best-fit solution by minimizing the likelihood-estimator , where and are the reduced least square between the measured and model visibilities and closure phases, respectively. The parameter uncertainties have been estimated using the bootstrapping technique.
Given that the absolute calibration of the AMBER+FINITO HR observations is not very reliable due to the use of long integration times and a potential residual phase jitter, we decided to recalibrate the absolute visibility level using the detailed continuum model discussed in Sect. 3 (Model DISK). Since the HR-data was recorded 2010, we extrapolated the orbital motion of the companion to this later epoch ( mas, ), but note that the continuum geometry has only a marginal effect on our model-fitting results in the strong -line of V921 Sco.
The DISK model provides a significant improvement compared to the GAUSS model, which also reflects in an improved -values of 1.86 (versus 4.88) for the 2008 data and 3.02 (versus 3.39) for the 2009 data,respectively. In contrast to the GAUSS model, the DISK model also provides a physically motivated parameterization for the wavelength-dependent changes in the source geometry, allowing us to fit all wavelength channels simultaneously. The resulting best-fit parameters for the various models are listed in Tab. 1. We plot in Fig. 4 the measured observables versus the prediction of the DISK model. Besides the spatially resolved emission around the primary component, we also checked whether the fit results can be improved by including spatially extended emission around the northern (secondary) component, but were not able to find a significant improvement.
| Secondary star | Circumprimary disk | |||||||||||||||
|---|---|---|---|---|---|---|---|---|---|---|---|---|---|---|---|---|
| Epoch | Model | |||||||||||||||
| [∘] | [mas] | [mas] | (at ) | [m-1] | [mas] | [∘] | [∘] | [mas] | [mas] | |||||||
| 2008 | GAUSS | – | – | – | 4.30 | 3.09 | 4.88 | |||||||||
| 2008 | DISK | – | 1.86 | 1.86 | 1.86 | |||||||||||
| 2009 | GAUSS | aaIn our fitting procedure, this parameter was kept fixed. | 0.054aaIn our fitting procedure, this parameter was kept fixed. | -0.0056aaIn our fitting procedure, this parameter was kept fixed. | 7.5aaIn our fitting procedure, this parameter was kept fixed. | 50.3aaIn our fitting procedure, this parameter was kept fixed. | 147.8aaIn our fitting procedure, this parameter was kept fixed. | – | – | – | 4.17 | 1.78 | 3.39 | |||
| 2009 | DISK | 0.7a | -0.051a | – | 48.8a | 145.0a | 1.59a | 9.7a | 0.36a | 3.26 | 2.52 | 3.02 | ||||
4. Results: -line geometry
4.1. 2-D photocenter analysis
For a first, qualitative interpretation (Sect. 4.1) of the gas kinematics, we derive the photocenter displacement of the line-emitting region with respect to the continuum emission using our CRIRES spectro-astrometric data. For this purpose, it is necessary to separate the line spectro-astrometric signal from the underlying continuum contributions. To determine the continuum level, we fit a high-order polynomial function to the astrometric signal derived from the continuum channels. This function is then subtracted from the astrometric signal in the line channels and weighted by the continuum-to-line flux ratio :
| (4) |
The derived photocenter of the line velocity channels is significantly offset with respect to each other (clearly indicating the gas kinematics), and also shows a displacement with respect to the photocenter of the continuum channels (Fig. 6). This displacement reflects the fact that the center of gravity of the continuum emission does not coincide with the location of the primary star, but is displaced towards the position of the companion. We calculate the center of gravity both for the line channels and the continuum channels and compute their relative displacement vector , which is related to the companion separation , position angle , and the flux ratio by
| (5) |
Based on our continuum model fits from 2008 and 2009 (Tab. 1), we fix mas and then determine the companion position angle and the flux ratio from the CRIRES observations. Applying this procedure yields (which is in reasonable agreement with the astrometry determined with AMBER, Tab. 1) and , which is lower than the flux ratio determined with interferometry for epochs 2008 and 2009, possibly indicating variability.
The photocenters in the blue- and red-shifted line wings are displaced in opposite direction with respect to each other. Also, the highest gas velocities (dark red points and dark blue points in Fig. 6) emerge from smaller stellocentric distances than intermediate velocities, which suggests a rotation-dominated velocity profile. From the distribution of the individual photocenter offsets, we derive the disk plane orientation to .
In contrast to CRIRES, AMBER is able to spatially resolve the geometry of the line-emitting region, entering a regime where higher-order geometric effects are probed. Therefore, in the following two sections, we will employ a quantitative modeling in order to interpret the combined spectro-astrometric and spectro-interferometric observations.
4.2. Model fitting: Keplerian disk
| Parameter | Value | ||
|---|---|---|---|
| Inner emission radius | [mas] | ||
| Outer emission radius | [mas] | ||
| Position angle | [∘] | ||
| Inclination | [∘] | ||
| Stellar mass | [] | ||
| Radial intensity index | |||
| Opacity index |
Given the indications for a rotation-dominated velocity field provided by our model-independent photocenter analysis (Sect. 4.1), we first test whether a Keplerian velocity field might reproduce our spectroscopic, spectro-astrometric and spectro-interferometric data quantitatively.
For this purpose, we employ a Keplerian disk model (), which we have already successfully applied to AMBER high spectral dispersion data on the classical Be star CMi (Kraus et al., 2012b). The model assumes that the line-emitting gas is optically thin and located in a geometrically thin disk, where the radial intensity profile is parameterized with a power-law (). The gas emission extends from an inner truncation radius () to an outer truncation radius (), which we parameterize with a Fermi-type function in order to avoid artifical edges (see Eq. 1 in Kraus et al. 2008a, where the width of the truncation region was chosen to 0.1). In our study on CMi (Kraus et al., 2012b), we investigated the DP signatures induced by photospheric absorption and found that even for a relatively extended stellar surface (equatorial radius of 0.36 mas), the induced DPs are . For V921 Sco, the influence of photospheric absorption is likely -times smaller due to the smaller apparent stellar radius ( mas) and the significantly larger equivalent width of the emission line. Therefore, these signatures are about four orders of magnitude smaller than the disk kinematical signatures and can be safely neglected in our modeling process.
As discussed in Sect. 4.1, the elliptical distribution of the derived photocenter vectors might indicate opacity effects, which cause the more distant parts of the disk to appear fainter than the disk parts facing the observer. In order to include this effect in our model, we assume that the disk is embedded in an medium of constant density. After a distance traveled, the emitted intensity is then reduced to . Combining this line-emission model with our best-fit continuum disk+companion model (DISK, Tab. 1) allows us to produce model channel maps (Fig. 7, bottom), from which we compute line profiles, visibilities, and DPs for comparison with our data (Fig. 7, top).
As line broadening mechanisms, we include thermal and turbulent Doppler broadening (Piétu et al., 2007)
| (6) |
where is the turbulent velocity, which is typically negligible for Herbig Ae/Be stars ( km s-1, e.g. Piétu et al. 2007). In the disk surface layer, the gas temperature will be significantly higher than the dust temperature at a given stellocentric radius. We assume , as suggested by the thermally decoupled radiative-hydrodynamics simulations by Thi et al. (2011), but note that the precise value affects mainly the line width and does not affect our general conclusions (see also Sect. 5.1).
Free parameters in our model are the mass of the central star , the inner and outer disk radius (, ), the radial intensity power-law index , the disk inclination , and the opacity index .
We vary these parameters systematically on a parameter grid and select the best-fit model with the best , where and are the reduced chi-squared between the model and measured different phase and spectrum, respectively.
Remarkably, this simple disk model can reproduce important features in our data, in particular:
-
(a)
Our model can reproduce the double-peaked -line profile (Fig. 7, 1st panel) reasonably well. One line profile characteristic, which is not reproduced by our model concerns the weak asymmetry observed in -line profile, with a slightly stronger red-shifted line wing.
-
(b)
Our AMBER observations (Fig. 7, 2nd panel) reveal M-shaped visibility profiles on two of three baselines (36.7m/ and 53.4m/), indicating that the angular extension of the line-emitting region increases for low gas velocities. This effect is expected for a rotation-dominated velocity field, where the azimuthal velocity decreases as function of radius and the visibility profile shape is reasonably well reproduced by our model for these baselines. On the third baseline (46.6m/), no central visibility drop has been observed. We suspect that this effect is related to more subtle radiative transfer or line broadening effects, which are not included in our simplistic model. The visibilities at low gas velocities (i.e. in the line center) would be most sensitive to such small-order effects and we leave it to future studies using full radiative transfer modeling to investigate this in more detail.
-
(c)
The measured AMBER and CRIRES DPs (Fig. 7, 3rd panel) show very interesting signatures, including asymmetric S-shaped signatures and V-shaped signatures, which appear sometimes in the blue- and sometimes in the red-shifted line wing. These signatures constrain the disk kinematics primarily, but contain also contributions from the continuum photocenter displacement caused by the companion star. Our combined binary star plus Keplerian disk rotation model reproduces the large variety of signatures reasonably well. The strongest residuals between the model and the data are observed at the longest AMBER baselines, where the data is extremely sensitive to small-order kinematical effects, but where the SNR is also reduced due to the lower fringe contrast.
The parameters corresponding to the best-fit model are listed in Tab. 2 and will be discussed in more detail in Sect. 5.2.
We also investigated whether a significant fraction of the emission might be associated with the secondary star (V921 Sco B) instead of the circumprimary disk, possibly indicating active accretion from the circumbinary disk onto the secondary star. Considering the strong measured displacement of the line photocenter in the direction towards the primary (Fig. 6, right) and the good quantitative agreement of the displacement vector with the flux-weighted binary astrometry vector (Sect. 4.1), it is clear that the secondary is not the dominant -emitting component. In order to further quantify these constraints, we introduced the fraction of emission associated with the secondary star to the total -flux as an additional parameter in our kinematical model and find that .
5. Interpretation
5.1. Spectroscopy
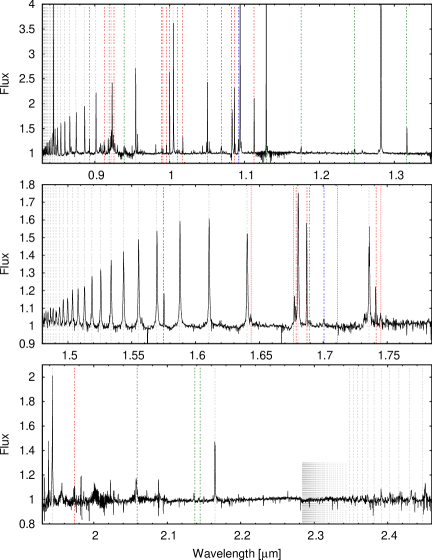
Our FIRE observations (Fig. 8) reveal a very rich near-infrared spectrum. Similar to the optical spectrum (Borges Fernandes et al., 2007), the near-infrared regime is dominated by strong hydrogen line emission. As listed in Tab. 5.1, we detect 27 lines from the Brackett series ( to Br29), 24 lines from the Paschen series (Pa to Pa24), and at least 10 lines from the Pfund series (Pf14-24). Given that the recombination physics of hydrogen is well known, one can use these line decrements in order to derive information about physical conditions of the line-emitting gas.
In order to model the line flux in the optically thin approximation, we extracted from Storey & Hummer (1995) the line emissivities for Case B recombination for all Balmer (), Brackett (), and Paschen () hydrogen line transitions with . The line emissivities include collisional transitions, which makes our computation applicable even for relatively high gas densities. Assuming that the emitting gas is isothermal ( K) and uniformly distributed in the volume , the received line flux at distance is then given by
| (7) |
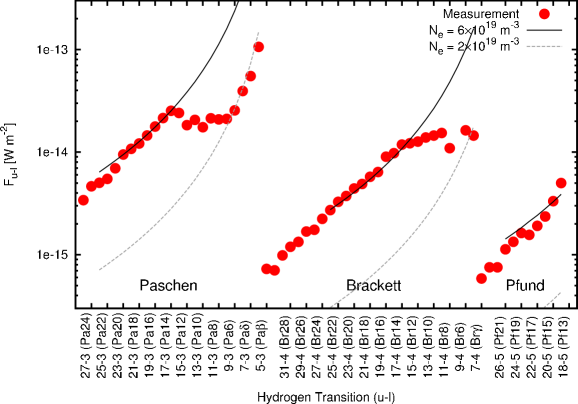
where and are the electron and proton density per unit volume. In order to approximate the emitting volume , we estimate from our spectro-interferometric data the characteristic stellocentric emission radius. For this purpose, we generate a velocity-integrated line map and measure the half-light emission radius to mas=3.5 AU (for kpc). Assuming that the line-emitting gas is located in a hot disk surface layer with a characteristic scale height of , as suggested by the thermally decoupled simulations from Thi et al. (2011), the emitting volume is given by . We employ an iterative procedure, where we start by assuming a low gas density, which is then adjusted in order to reproduce the measured line fluxes.
Then we recompute the line emissivities and repeated the computation until convergence is reached. As shown in Fig. 9, we require rather high gas densities between m-3 and m -3, which supports the scenario that the gas is located in a dense disk instead of a low-density halo. For the high-level transitions (, i.e. Pa14-24, Br13-29, and Pf12-23), the line fluxes can be reproduced well with a single gas density ( m-3), suggesting that the optical thin approximation is well justified. The low-level transitions (, i.e. -Pa13, -Br12) and more consistent with densities around m-3, which might indicating that these transitions originate from more extended disk regions, where the disk surface density is lower. We would like to note that the derived densities depend to some extend also on the assumed gas temperature. Varying the temperature from the assumed K to other realistic values (e.g. 5,000-20,000 K), would change the derived densities by a factor of . Based on our simplistic modeling, the derived density should be treated as an order-of-magnitude estimate and future radiation-hydrodynamic modeling will be required in order to fully exploit the rich information provided by our combined spectro-interferometric and spectroscopic dataset.
It is interesting to compare the derived electron density to the values predicted by state-of-the-art disk models. For instance, for a typical disk around a Herbig Ae star (e.g. AB Aurigae (catalog ), 2.4 ) with a gas surface density of kg m-2, the predicted midplane gas density is m-3 (Dullemond & Monnier, 2010) at the dust sublimation radius (1.1 AU). Our density measurement of m-3 probes similar spatial scales in the V921 Sco disk and is one to two orders of magnitude higher than this value, suggesting that the disk around V921 Sco is exceptionally massive. This result is in line with the study by Henning et al. (1998), who determined the total gas mass in the millimeter cores around 25 Herbig Ae/Be and FU Orionis stars and measured the highest total gas mass in the core around V921 Sco (; core size: ″ or AU at 1.15 kpc). Observations with our spectroscopic & spectro-interferometric approach on a larger sample of protoplanetary disks will be necessary in order determine whether the derived high gas density indicates an intrinsic property of the V921 Sco disk (possibly due to the young age of the source) or simply reflects the predicted disk surface density scaling law with stellar mass (, Calvet et al. 2004).
Besides hydrogen recombination lines, other identified lines include Fe II, [Fe II], C I, He I, O I, N I, Mg II, Al II, which have also been identified in the B[e] stars CI Cam (catalog ) (Clark et al., 1999) and HD 50138 (catalog ) (Jaschek et al., 1992), or in the LBV Car (catalog ) (Damineli et al., 1998; Smith & Davidson, 2001). Besides the total of 90 identified lines, we detect in our spectra a few dozen additional, yet unidentified lines and we encourage detailed follow-up spectroscopic studies in order to investigate the rich chemistry of this source.
Our wavelength range also covers the CO first overtone bandheads between 2.3 and 2.4 m, which allows us to search for the CO first overtone bandheads, which we detect neither in absorption nor emission. This is particularly interesting, since Kraus (2009) suggested that these lines provide a good diagnostic tool to distinguish between a pre- and post-main-sequence evolutionary phase in B[e] stars. According to her computation, observable 13CO bandhead emission can only be produced in evolved stars, but should be absent in pre-main-sequence B[e] stars.
| Wavelength | Line | EW | |
|---|---|---|---|
| [nm] | [ W m-2] | ||
| 0.8304 | Pa24 | -0.053aaThese lines suffer from line-blending, which introduces some uncertainty to the derived EW values. | 14.7 |
| 0.8312 | Pa23 | -0.073 | 20.1 |
| 0.8321 | Pa22 | -0.079 | 21.6 |
| 0.8332 | Pa21 | -0.087 | 23.7 |
| 0.8343 | Pa20 | -0.110 | 29.7 |
| 0.8357 | Pa19 | -0.153 | 41.0 |
| 0.8372 | Pa18 | -0.175 | 46.4 |
| 0.8390 | Pa17 | -0.199 | 52.2 |
| 0.8411 | Pa16 | -0.242 | 62.7 |
| 0.8436 | Pa15 | -0.300 | 76.6 |
| 0.8447 | O I | -1.343 | 340.4 |
| 0.8465 | Pa14 | -0.369 | 92.6 |
| 0.8500 | Pa13 | -0.443 | 108.9 |
| 0.8543 | Pa12 | -0.432 | 103.7 |
| 0.8596 | Pa11 | -0.339 | 79.1 |
| 0.8663 | Pa10 | -0.394 | 88.8 |
| 0.8748 | Pa9 | -0.348 | 75.3 |
| 0.8820 | O I | -0.012 | 2.5 |
| 0.8860 | Pa8 | -0.447 | 92.2 |
| 0.8927 | Fe II | -0.097 | 19.5 |
| 0.9013 | Pa7 | -0.462 | 89.9 |
| 0.9127 | Fe II | -0.074 | 13.9 |
| 0.9177 | Fe II | -0.169 | 31.2 |
| 0.9202 | Fe II | -0.121 | 22.1 |
| 0.9227 | Pa6 | -0.500aaThese lines suffer from line-blending, which introduces some uncertainty to the derived EW values. | 90.8 |
| 0.9256 | Fe II | -0.080aaThese lines suffer from line-blending, which introduces some uncertainty to the derived EW values. | 14.4 |
| 0.9261 | O I | -0.070aaThese lines suffer from line-blending, which introduces some uncertainty to the derived EW values. | 12.6 |
| 0.9392 | N I | -0.071aaThese lines suffer from line-blending, which introduces some uncertainty to the derived EW values. | 12.3 |
| 0.9406 | C I | -0.060 | 10.4 |
| 0.9543 | Pa | -0.660 | 110.1 |
| 0.9893 | Fe II | -0.045 | 6.9 |
| 0.9910 | Fe II | -0.029 | 4.5 |
| 0.9956 | Fe II | -0.070 | 10.7 |
| 0.9997 | Fe II | -0.624 | 94.4 |
| 1.0047 | Pa | -1.132 | 169.9 |
| 1.0108 | Al II | -0.043aaThese lines suffer from line-blending, which introduces some uncertainty to the derived EW values. | 6.4 |
| 1.0174 | Fe II | -0.143 | 21.0 |
| 1.0501 | Fe II | -0.549 | 76.6 |
| 1.0688 | C I | -0.163 | 22.2 |
| 1.0829 | He I | -0.760 | 101.7 |
| 1.0862 | Fe II | -0.503 | 67.1 |
| 1.0917 | He I | -0.207 | 27.4 |
| 1.0935 | Pa | -1.793aaThese lines suffer from line-blending, which introduces some uncertainty to the derived EW values. | 237.2 |
| 1.1127 | Fe II | -0.468 | 60.6 |
| 1.1290 | O I | -1.874aaThese lines suffer from line-blending, which introduces some uncertainty to the derived EW values. | 238.9 |
| 1.1755 | C I | -0.117 | 14.3 |
| 1.2467 | N I | -0.083aaThese lines suffer from line-blending, which introduces some uncertainty to the derived EW values. | 9.6 |
| 1.2815 | Pa | -4.030aaThese lines suffer from line-blending, which introduces some uncertainty to the derived EW values. | 457.5 |
| 1.3166 | O I | -0.321 | 35.6 |
| Wavelength | Line | EW | |
|---|---|---|---|
| [nm] | [ W m-2] | ||
| 1.4798 | Br29 | -0.031aaThese lines suffer from line-blending, which introduces some uncertainty to the derived EW values. | 3.1 |
| 1.4811 | Br28 | -0.030aaThese lines suffer from line-blending, which introduces some uncertainty to the derived EW values. | 3.0 |
| 1.4827 | Br27 | -0.042aaThese lines suffer from line-blending, which introduces some uncertainty to the derived EW values. | 4.2 |
| 1.4844 | Br26 | -0.051 | 5.1 |
| 1.4863 | Br25 | -0.057 | 5.7 |
| 1.4884 | Br24 | -0.072 | 7.3 |
| 1.4907 | Br23 | -0.075aaThese lines suffer from line-blending, which introduces some uncertainty to the derived EW values. | 7.5 |
| 1.4934 | Br22 | -0.096 | 9.6 |
| 1.4963 | Br21 | -0.117 | 11.7 |
| 1.4997 | Br20 | -0.141 | 14.1 |
| 1.5035 | Br19 | -0.161 | 16.1 |
| 1.5078 | Br18 | -0.191 | 19.1 |
| 1.5129 | Br17 | -0.212 | 21.1 |
| 1.5188 | Br16 | -0.250 | 24.8 |
| 1.5256 | Br15 | -0.279 | 27.6 |
| 1.5338 | Br14 | -0.395 | 38.9 |
| 1.5435 | Br13 | -0.430 | 42.1 |
| 1.5552 | Br12 | -0.524aaThese lines suffer from line-blending, which introduces some uncertainty to the derived EW values. | 51.0 |
| 1.5696 | Br11 | -0.544 | 52.6 |
| 1.5750 | Fe II | -0.105 | 10.1 |
| 1.5876 | Br10 | -0.570 | 54.7 |
| 1.6105 | Br9 | -0.631 | 59.9 |
| 1.6403 | Br8 | -0.667aaThese lines suffer from line-blending, which introduces some uncertainty to the derived EW values. | 62.5 |
| 1.6435 | [Fe II] | -0.019aaThese lines suffer from line-blending, which introduces some uncertainty to the derived EW values. | 1.8 |
| 1.6769 | [Fe II] | -0.076aaThese lines suffer from line-blending, which introduces some uncertainty to the derived EW values. | 7.0 |
| 1.6787 | Fe II | -0.046aaThese lines suffer from line-blending, which introduces some uncertainty to the derived EW values. | 4.2 |
| 1.6802 | Br7 | -0.719aaThese lines suffer from line-blending, which introduces some uncertainty to the derived EW values. | 66.2 |
| 1.6873 | Fe II | -0.309 | 28.4 |
| 1.6894 | Fe II | -0.015aaThese lines suffer from line-blending, which introduces some uncertainty to the derived EW values. | 1.4 |
| 1.7006 | He I | -0.032aaThese lines suffer from line-blending, which introduces some uncertainty to the derived EW values. | 2.9 |
| 1.7111 | [Fe II] | -0.013 | 1.2 |
| 1.7357 | Br6 | -0.521 | 47.1 |
| 1.7414 | Fe II | -0.102 | 9.2 |
| 1.7451 | [Fe II] | -0.054aaThese lines suffer from line-blending, which introduces some uncertainty to the derived EW values. | 4.9 |
| 1.9440 | Br | -0.808bbDue to the high -band continuum flux and line brightness, these lines likely reached the non-linearity regime of the FIRE detector, resulting in an underestimation of the real EW. | 70.3 |
| 1.9738 | Fe II | -0.019 | 1.7 |
| 2.0590 | Mg II | -0.219bbDue to the high -band continuum flux and line brightness, these lines likely reached the non-linearity regime of the FIRE detector, resulting in an underestimation of the real EW. | 19.1 |
| 2.1376 | Mg II | -0.051 | 4.5 |
| 2.1447 | Mg II | -0.018 | 1.6 |
| 2.1649 | Br | -0.705bbDue to the high -band continuum flux and line brightness, these lines likely reached the non-linearity regime of the FIRE detector, resulting in an underestimation of the real EW. | 62.5 |
| 2.3532 | Pf23 | -0.028 | 2.5 |
| 2.3591 | Pf22 | -0.036 | 3.2 |
| 2.3657 | Pf21 | -0.036 | 3.2 |
| 2.3731 | Pf20 | -0.054 | 4.9 |
| 2.3815 | Pf19 | -0.064 | 5.8 |
| 2.3912 | Pf18 | -0.078 | 7.0 |
| 2.4023 | Pf17 | -0.075 | 6.7 |
| 2.4151 | Pf16 | -0.092 | 8.2 |
| 2.4300 | Pf15 | -0.114 | 10.2 |
| 2.4477 | Pf14 | -0.162 | 14.4 |
| 2.4687 | Pf13 | -0.245 | 21.5 |
Finally, we investigated whether we find indications for variability of the -line during the months covered by our CRIRES and AMBER observations. For this purpose, we convolved the CRIRES and AMBER HR-K data to the same spectral resolution and overplot the line profiles in Fig. 10, finding no indications for variability, neither in line strength nor line profile.
5.2. The circumprimary disk
Using a temperature-gradient disk model (DISK), we determine the inner continuum disk radius to 1.59 mas. We can compare this value with the expected location of the dust sublimation radius, using the luminosity and distance estimate of Borges Fernandes et al. (2007), and pc. Assuming grey dust opacities and a standard dust sublimation temperature of K, the expected dust sublimation radius (including the effect of backwarming from the disk) is (Dullemond et al., 2001), where denotes the Stefan-Boltzmann constant. With the given large luminosity and distance uncertainties, this corresponds to a value of AU or mas, which is considerably larger than the measured inner disk radius of mas. Assuming higher dust sublimation temperatures of 2000 K ( AU or mas) also does not solve this discrepancy. Therefore, we conclude that V921 Sco belongs to the group of Herbig Be disks that are “undersized” with respect to the size-luminosity relation (Monnier & Millan-Gabet, 2002), as already discussed by Kraus et al. (2008b) and Kreplin et al. (2012). Different physical scenarios have been proposed in order to explain this effect, including gas absorption (Monnier & Millan-Gabet, 2002), the emission from gas located inside of the dust sublimation radius (Eisner et al., 2004; Monnier et al., 2005; Kraus et al., 2008a; Tannirkulam et al., 2008), or the presence of a highly refractive dust grain species (Benisty et al., 2010). Multi-wavelength interferometric studies with even longer baseline lengths as well as detailed gas and dust radiative transfer modeling will be required in order to ultimately settle this question.
We determine the outer disk radius to mas. However, this value should be treated as a lower limit, since colder parts of the disk might extend to larger stellocentric radii. We can compare this derived lower limit with theoretical predictions for the disk truncation radius in binary systems. Artymowicz & Lubow (1994) computed the resonance-induced truncation radius for circumstellar and circumbinary disks and predicts the circumprimary disk to be truncated at % of the orbit major axis (for a binary mass ratio of 0.3), depending on the orbit eccentricity and disk viscosity parameter. This range agrees reasonably well with our derived value of %. For a detailed comparison, a full orbit determination and mid-infrared and sub-millimeter interferometric observations of the colder material in the outer regions of the circumprimary disk and in the circumbinary gas and dust reservoir will be required.
Both theoretical (e.g. Natta et al., 2001; Dullemond et al., 2001; Isella & Natta, 2005) and observational studies (Monnier et al., 2006; Kraus et al., 2009a; Benisty et al., 2011) suggest that the inner dust rim in protoplanetary disks has a complicated, possibly puffed-up vertical structure, which can result in an asymmetric brightness distribution. Interferometric data, such as presented in this study, is able to detect these asymmetries and to constrain the corresponding disk models, in particular using phase-closure capabilities. However, it is clear that the closure phases in our AMBER data are dominated by the signatures of the newly-detected companion, while potential asymmetries due to the vertical disk structure would appear only as secondary effects. Such signatures would appear in particular at long baseline lengths and close to visibility minima, where we also observe some significant deviations from our simple flat disk+companion model (Fig. 5). However, it would be difficult to constrain these more complex physical models with the current uncertainties on the stellar parameters and the limited available -coverage. Therefore, we leave it to future investigations to better constrain the inner dust disk geometry around V921 Sco A. Alternatively, the remaining residuals might indicate the orbital motion of the companion within the five months during which the 2008 AMBER LR-HK data has been recorded (see Tab 1 in Paper I).
Using our kinematical modeling, we show that the velocity field in the disk is in Keplerian rotation (Sect. 4.2) and that the line-emission emerges from a relatively high-density region ( m-3; Sect. 5.1), likely in a hot disk surface layer. Between the high-level (, i.e. Pa14-24, Br13-29, and Pf12-23) and low-level transitions (, i.e. -Pa13, -Br12), we detect a change of slope in the Paschen/Brackett decrements, indicating that the high-level transitions emerge from high-density regions closer to the star than the low-level transitions. In our best-fit model (Tab. 2, Fig. 7), the orientation of the opacity screen is such that the south-western part of the disk appear brighter, which suggests that the north-eastern disk axis is facing towards us (which is also consistent with the orientation of the large-scale bipolar nebula, Fig. 11, A-C). Arguably the most surprising parameter value in our best-fit model concerns the derived stellar mass. For an assumed distance of 1.15 kpc, we yield best agreement with , which is hardly consistent with the spectral classification333It should be noted that the earlier spectroscopic studies were not informed about the binarity of V921 Sco, which has likely also resulted in a somewhat biased spectral classifications of this intriguing source. However, given the extremely rich recombination line spectrum and the presence of He I emission lines, it seems safe to assume that the ionizing central source should be of at least B-type. and the prediction mass of (Borges Fernandes et al., 2007).
In order to explain this surprising result, we propose two plausible scenarios:
-
(1)
The value of kpc (Borges Fernandes et al., 2007) might underestimate the real distance to V921 Sco. This distance has been determined based on the equivalent width of the Na I and Ca II-K interstellar absorption lines and therefore relies on a statistically established calibration. In particular, Lopes et al. (1992) employed the same method (also on the Na I line) and determined the distance to 2.5 kpc. A distance estimate kpc has also been obtained by McGregor et al. (1988) based on optical/near-infrared spectroscopy and photometry. Adopting such a larger distance would result in a stellar mass of 12 (for 2.5 kpc) or 9 (for 2 kpc), which would be more consistent with the spectral classification.
-
(2)
The disk might not be associated with the massive (early B-type) star in the system, but orbit around the intermediate-mass (late B-type) companion instead. This would explain the relatively low derived mass, while the massive primary star could still provide sufficient ultraviolet flux to ionize the disk surface layer and the ambient low-density material resulting in the forbidden line-emission. In this scenario, the accretion would occur from the circumbinary disk onto the disk around the late B-type star. The massive primary would rest closer to the center-of-mass and be effectively shielded from mass-infall by the orbiting companion. A similar dynamical configurations seems also plausible for other Herbig B[e]-star binary systems such as MWC 361 A, where the active accretion is clearly associated with the less massive component in the system (Monnier et al., 2006; Alecian et al., 2008).
In order to distinguish between these scenarios, it will be necessary to accurately measure the flux ratio of the two stars as function of wavelength. Our current measurement yield similar flux ratios between the two stars in the - and -band, with some indications that V921 Sco A (i.e. the star associated with the circumstellar material) is of earlier spectral type (Paper I), favouring scenario (1). However, it should be noted that this color measurement is only significant at the 2-level (, , Paper I) and might be biased, for instance in case of inhomogeneous extinction towards the two stars. In both scenarios, it is clear that a careful re-evaluation of the spectral classification based on the spectral energy distribution and the spectroscopic diagnostics will be necessary, which, is out of the scope of this paper.
Independent of these uncertainties, we can derive new insights on the evolutionary status of V921 Sco from our constraints on the disk gas velocity field. The decretion disks around post-main-sequence supergiant B[e] stars should exhibit a strong outflowing velocity component (Lamers & Pauldrach, 1991), which is not observed in our data. On the other hand, our observation of a Keplerian rotation profile is consistent with the expected velocity field in a viscous accretion disk (Shakura & Sunyaev, 1973) around a pre-main-sequence Herbig B[e] star.
5.3. On the origin of the -emission in Herbig Be stars
Arguably, the most important advancement provided by our observational data set on V921 Sco is that it allows us to constrain simultaneously the geometry of the circumstellar dust disk and the spatial distribution and kinematics of the hot gas in the system (see Fig. 7). Such constraints are important, in particular as earlier spatially unresolved studies have associated the origin of the -line emission with fundamentally different physical mechanisms, including mass infall (e.g. magnetospheric accretion, gaseous inner disks) and mass outflow processes (e.g. stellar winds, X-winds, or disk winds). For V921 Sco, we find that the -emitting gas clearly shows a rotation-dominated velocity field and orbits the star in the same plane (, , see Tab. 2) as the circumstellar dust disk (, ), as illustrated in Fig. 11. On the other hand, Benisty et al. (2010) found for the Herbig Be-star component in the Z CMa (catalog ) binary system that the -line emission was displaced along the outflow axis, i.e. presumably perpendicular to the disk plane. Given that the Z CMa observations were obtained during an exceptionally strong outbursting phase of the Z CMa system in 2008, they likely do not represent typical conditions in a Herbig Be star. Another example is provided by MWC 297 (catalog ), where Weigelt et al. (2011) could reproduce important features of the measured wavelength-differential phases using a magnetospheric disk wind model. These examples, V921 Sco (where was found to trace orbiting gas in the disk plane), Z CMa (where the -emitting gas was observed in a bipolar wind), and MWC 297 (where the -emitting might trace a disk wind), illustrate that the emission is probably not associated with a single astrophysical process, but can trace both mass accretion and outflow processes, as we have already concluded from our small VLTI/AMBER -survey with spectral resolution (Kraus et al., 2008b). Spatially and spectrally resolved observations on a larger object sample will be essential in order to explore under which circumstances the -line traces a certain mechanism and to determine the relation with spectroscopic diagnostics.
6. Conclusions
In this paper, we have investigated the milliarcsecond-scale environment around the B[e] star V921 Sco and constrained the spatial distribution and kinematics of ionized hydrogen gas in the system with a spectral resolution up to . We summarize our findings as follows:
-
•
Our - and -band continuum interferometric images reveal a spatially extended (Gaussian FWHM mas) disk-like structure, seen under an intermediate inclination angle of ∘. Using a temperature-gradient model, we determine the dust sublimation radius to mas and find that the apparent disk size increases with wavelength, consistent with an irradiated dust disk.
-
•
Our VLTI/AMBER () and VLT/CRIRES () observations spatially and spectrally resolve the -line emission from V921 Sco on sub-milliarcsecond scales. Using a model-independent photocenter analysis technique and our detailed kinematical modeling, we find that the line-emitting gas is located in a Keplerian-rotating disk, which extends down to a few stellar radii. We interpret this finding as strong evidence for the pre-main-sequence nature of the object, since the decretion disks in post-main-sequence B[e]-stars are believed to exhibit a significant outflowing velocity component.
-
•
From our disk kinematical modeling, we derive a mass of for the central object. Assuming the distance of 1.15 kpc proposed by Borges Fernandes et al. (2007), we find that this mass is too low to be consistent with the early B-type spectral classification, which might indicate that the distance to V921 Sco is probably considerably larger ( kpc). Alternatively, the disk might be associated with the less massive component in the system. In this dynamical scenario, the material from the circumbinary disk is accreted onto the intermediate-mass (late B-type) component, preventing significant accretion onto the early B-type star. In any case, a careful re-evaluation of the spectral classification of the components in this enigmatic binary system will be required in future studies.
-
•
Our FIRE observations reveal a rich near-infrared emission line spectrum of permitted and forbidden emission lines (Fe II, [Fe II], C I, He I, O I, N I, Mg II, Al II), but show no sign of CO bandhead emission, which supports a pre-main-sequence nature (Kraus, 2009).
-
•
From the FIRE spectra, we derive the line flux for 61 hydrogen recombination lines, including transitions from the Paschen, Brackett, and Pfund series. Utilizing the spatial information provided by our VLTI/AMBER spectro-interferometric data allows us to model the line decrements with a hydrogen excitation model and to derive electron densities for the line-emitting gas. The derived high number densities ( m-3) suggest that the disk around V921 Sco is particularly massive, reinforcing the conclusion of Henning et al. (1998), who derived a total gas mass of for the surrounding millimeter core.
Our combined spectro-interferometry & line decrement modeling approach provides a novel tool to estimate the gas density in the innermost AU of protoplanetary disks. Applying this tool on a larger sample of T Tauri, Herbig Ae/Be, and transitional disks might allow, for instance, to quantify gas depletion as function of disk evolution, or to confirm the expected relations between the mass accretion rate, disk surface density, and stellar mass (e.g. Calvet et al., 2004).
Furthermore, our study demonstrates the power of combining infrared spectro-interferometry with the technique of spectro-astrometry. Spectro-interferometry is indispensable to characterize the continuum geometry (measurement of the dust disk geometry and, for instance, the detection of companions) and to resolve the detailed geometry and kinematics of the circumstellar gas. On the other hand, spectro-astrometry provides a ressource-efficient and straightforward method to measure first-order kinematical information with very high spectral dispersion in the spatially unresolved regime, providing highly complementary constraints for the interpretation of spectro-interferometric signatures.
References
- Acke & van den Ancker (2006) Acke, B., & van den Ancker, M. E. 2006, A&A, 457, 171
- Acke et al. (2005) Acke, B., van den Ancker, M. E., & Dullemond, C. P. 2005, A&A, 436, 209
- Alecian et al. (2008) Alecian, E., et al. 2008, MNRAS, 385, 391
- Artymowicz & Lubow (1994) Artymowicz, P., & Lubow, S. H. 1994, ApJ, 421, 651
- Bailey (1998a) Bailey, J. 1998a, MNRAS, 301, 161
- Bailey (1998b) Bailey, J. A. 1998b, in Presented at the Society of Photo-Optical Instrumentation Engineers (SPIE) Conference, Vol. 3355, Society of Photo-Optical Instrumentation Engineers (SPIE) Conference Series, ed. S. D’Odorico, 932–939
- Benedettini et al. (1998) Benedettini, M., Nisini, B., Giannini, T., Lorenzetti, D., Tommasi, E., Saraceno, P., & Smith, H. A. 1998, A&A, 339, 159
- Benisty et al. (2010) Benisty, M., et al. 2010, A&A, 517, L3+
- Benisty et al. (2011) —. 2011, A&A, 531, A84+
- Borges Fernandes et al. (2007) Borges Fernandes, M., Kraus, M., Lorenz Martins, S., & de Araújo, F. X. 2007, MNRAS, 377, 1343
- Brannigan et al. (2006) Brannigan, E., Takami, M., Chrysostomou, A., & Bailey, J. 2006, MNRAS, 367, 315
- Calvet et al. (2004) Calvet, N., Muzerolle, J., Briceño, C., Hernández, J., Hartmann, L., Saucedo, J. L., & Gordon, K. D. 2004, AJ, 128, 1294
- Cardelli et al. (1989) Cardelli, J. A., Clayton, G. C., & Mathis, J. S. 1989, ApJ, 345, 245
- Chelli et al. (2009) Chelli, A., Utrera, O. H., & Duvert, G. 2009, A&A, 502, 705
- Cidale et al. (2001) Cidale, L., Zorec, J., & Tringaniello, L. 2001, A&A, 368, 160
- Clark et al. (1999) Clark, J. S., Steele, I. A., Fender, R. P., & Coe, M. J. 1999, A&A, 348, 888
- Damineli et al. (1998) Damineli, A., Stahl, O., Kaufer, A., Wolf, B., Quast, G., & Lopes, D. F. 1998, A&AS, 133, 299
- de Winter & The (1990) de Winter, D., & The, P. S. 1990, Ap&SS, 166, 99
- Dullemond et al. (2001) Dullemond, C. P., Dominik, C., & Natta, A. 2001, ApJ, 560, 957
- Dullemond & Monnier (2010) Dullemond, C. P., & Monnier, J. D. 2010, ARA&A, 48, 205
- Eisner et al. (2004) Eisner, J. A., Lane, B. F., Hillenbrand, L. A., Akeson, R. L., & Sargent, A. I. 2004, ApJ, 613, 1049
- Gai et al. (2004) Gai, M., et al. 2004, in Presented at the Society of Photo-Optical Instrumentation Engineers (SPIE) Conference, Vol. 5491, Society of Photo-Optical Instrumentation Engineers (SPIE) Conference Series, ed. W. A. Traub, 528–+
- Goto et al. (2012) Goto, M., Carmona, A., Linz, H., Stecklum, B., Henning, T., Meeus, G., & Usuda, T. 2012, ApJ, 748, 6
- Habart et al. (2003) Habart, E., Testi, L., Natta, A., & Vanzi, L. 2003, A&A, 400, 575
- Hase et al. (2010) Hase, F., Wallace, L., McLeod, S. D., Harrison, J. J., & Bernath, P. F. 2010, J. Quant. Spec. Radiat. Transf., 111, 521
- Henning et al. (1998) Henning, T., Burkert, A., Launhardt, R., Leinert, C., & Stecklum, B. 1998, A&A, 336, 565
- Hillenbrand et al. (1992) Hillenbrand, L. A., Strom, S. E., Vrba, F. J., & Keene, J. 1992, ApJ, 397, 613
- Hutsemekers & van Drom (1990) Hutsemekers, D., & van Drom, E. 1990, A&A, 238, 134
- Isella & Natta (2005) Isella, A., & Natta, A. 2005, A&A, 438, 899
- Jaschek et al. (1992) Jaschek, M., Jaschek, C., Andrillat, Y., & Houziaux, L. 1992, MNRAS, 254, 413
- Kaeufl et al. (2004) Kaeufl, H., et al. 2004, in Society of Photo-Optical Instrumentation Engineers (SPIE) Conference Series, Vol. 5492, Society of Photo-Optical Instrumentation Engineers (SPIE) Conference Series, ed. A. F. M. Moorwood & M. Iye, 1218–1227
- Kraus (2009) Kraus, M. 2009, A&A, 494, 253
- Kraus et al. (2012a) Kraus, S., Calvet, N., Hartmann, L., Hofmann, K.-H., Kreplin, A., Monnier, J. D., & Weigelt, G. 2012a, ApJ, 746, L2
- Kraus et al. (2009a) Kraus, S., Hofmann, K., Malbet, F., Meilland, A., Natta, A., Schertl, D., Stee, P., & Weigelt, G. 2009a, A&A, 508, 787
- Kraus et al. (2008a) Kraus, S., Preibisch, T., & Ohnaka, K. 2008a, ApJ, 676, 490
- Kraus et al. (2008b) Kraus, S., et al. 2008b, A&A, 489, 1157
- Kraus et al. (2009b) —. 2009b, A&A, 497, 195
- Kraus et al. (2012b) —. 2012b, ApJ, 744, 19
- Kreplin et al. (2012) Kreplin, A., Kraus, S., Hofmann, K.-H., Schertl, D., Weigelt, G., & Driebe, T. 2012, A&A, 537, A103
- Lachaume (2003) Lachaume, R. 2003, A&A, 400, 795
- Lamers & Pauldrach (1991) Lamers, H. J. G., & Pauldrach, A. W. A. 1991, A&A, 244, L5
- Lamers et al. (1998) Lamers, H. J. G. L. M., Zickgraf, F., de Winter, D., Houziaux, L., & Zorec, J. 1998, A&A, 340, 117
- Le Bouquin et al. (2008) Le Bouquin, J., Bauvir, B., Haguenauer, P., Schöller, M., Rantakyrö, F., & Menardi, S. 2008, A&A, 481, 553
- Lopes et al. (1992) Lopes, D. F., Damineli Neto, A., & de Freitas Pacheco, J. A. 1992, A&A, 261, 482
- McGregor et al. (1988) McGregor, P. J., Hyland, A. R., & Hillier, D. J. 1988, ApJ, 324, 1071
- Mérand et al. (2006) Mérand, A., Bordé, P., & Coudé Du Foresto, V. 2006, A&A, 447, 783
- Monnier & Millan-Gabet (2002) Monnier, J. D., & Millan-Gabet, R. 2002, ApJ, 579, 694
- Monnier et al. (2005) Monnier, J. D., et al. 2005, ApJ, 624, 832
- Monnier et al. (2006) —. 2006, ApJ, 647, 444
- Natta et al. (1993) Natta, A., Palla, F., Butner, H. M., Evans, II, N. J., & Harvey, P. M. 1993, ApJ, 406, 674
- Natta et al. (2001) Natta, A., Prusti, T., Neri, R., Wooden, D., Grinin, V. P., & Mannings, V. 2001, A&A, 371, 186
- Petrov et al. (2007) Petrov, R. G., et al. 2007, A&A, 464, 1
- Piétu et al. (2007) Piétu, V., Dutrey, A., & Guilloteau, S. 2007, A&A, 467, 163
- Pontoppidan et al. (2011) Pontoppidan, K. M., Blake, G. A., & Smette, A. 2011, ApJ, 733, 84
- Shakura & Sunyaev (1973) Shakura, N. I., & Sunyaev, R. A. 1973, A&A, 24, 337
- Shore et al. (1990) Shore, S. N., Brown, D. N., Bopp, B. W., Robinson, C. R., Sanduleak, N., & Feldman, P. D. 1990, ApJS, 73, 461
- Simcoe et al. (2008) Simcoe, R. A., et al. 2008, in Society of Photo-Optical Instrumentation Engineers (SPIE) Conference Series, Vol. 7014, Society of Photo-Optical Instrumentation Engineers (SPIE) Conference Series
- Smith & Davidson (2001) Smith, N., & Davidson, K. 2001, ApJ, 551, L101
- Storey & Hummer (1995) Storey, P. J., & Hummer, D. G. 1995, MNRAS, 272, 41
- Takami et al. (2003) Takami, M., Bailey, J., & Chrysostomou, A. 2003, A&A, 397, 675
- Tannirkulam et al. (2008) Tannirkulam, A., et al. 2008, ApJ, 677, L51
- Tatulli et al. (2007a) Tatulli, E., et al. 2007a, A&A, 464, 55
- Tatulli et al. (2007b) —. 2007b, A&A, 464, 29
- The et al. (1994) The, P. S., de Winter, D., & Perez, M. R. 1994, A&AS, 104, 315
- Thi et al. (2011) Thi, W., Woitke, P., & Kamp, I. 2011, MNRAS, 412, 711
- Štefl et al. (2009) Štefl, S., et al. 2009, A&A, 504, 929
- Weigelt et al. (2011) Weigelt, G., et al. 2011, A&A, 527, A103
- Whelan et al. (2005) Whelan, E. T., Ray, T. P., Bacciotti, F., Natta, A., Testi, L., & Randich, S. 2005, Nature, 435, 652