Phononic gaps in the charged incommensurate planes of Sr14Cu24O41
Abstract
The terahertz (THz) excitations in the quantum spin-ladder system Sr14Cu24O41 have been determined along the c-axis using THz time-domain, Raman and infrared spectroscopy. Low-frequency infrared and Raman active modes are observed above and below the charge-ordering temperature K over a narrow interval meV ( cm-1). A new infrared mode at meV develops below K. The temperature dependence of these modes shows that they are coupled to the charge- and spin-density-wave correlations in this system. These low-energy features are conjectured to originate in the gapped sliding-motion of the chain and ladder sub-systems, which are both incommensurate and charged.
pacs:
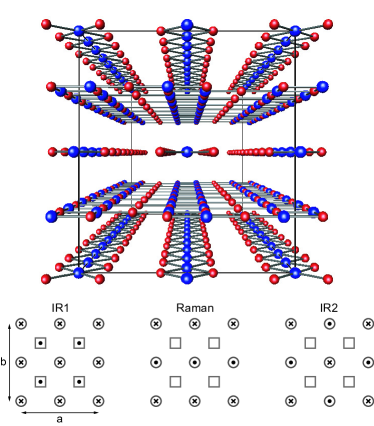
71.45.Lr, 78.30.-j, 78.70.GqMore than three decades ago, new normal modes were predicted to occur in ionic materials with incommensurate (IC) layers which can slide past each other Theodorou and Rice (1978); Theodorou (1980); Axe and Bak (1982); Finger and Rice (1983). These new degrees of freedom allow separate phonons in each subsystem at high frequencies with a crossover to slow oscillations due to relative sliding motions of the two almost rigid subsystems at ultra-low frequencies, leading effectively to an extra acoustic mode. If the IC layers are charged these sliding modes become gapped due to the restoring Coulomb forces. These modes are the ionic complements of the electronic plasmons in metals and their dynamics also resemble the sliding motion in density wave (DW) systems Grüner (1994). Thus far,unambiguous experimental evidence for sliding gapped acoustic mode resonances has remained, to our knowledge, elusive. A promising avenue of investigation is the low-dimensional quantum spin-ladder system Sr14Cu24O41 containing such substructures in the form of Cu2O3 ladders and one-dimensional (1D) CuO2 chains McCarron III et al. (1988); *Siegrist1988. The chains and ladders run parallel along the c-axis with the rungs of the ladders along the a-axis McCarron III et al. (1988); *Siegrist1988, shown in Fig. 1. The two subsystems are structurally IC, resulting in a buckling along the c-axis with a period , where and represent the lattice constants for the chain and ladder subcells, respectively.
This intrinsically hole-doped material exhibits a variety of unusual charge, magnetic and vibrational phenomena Vuletić et al. (2006) that have been probed by several techniques, among them magnetic resonance Takigawa et al. (1998), neutron scattering Matsuda et al. (1999) and resonant x-ray scattering Abbamonte et al. (2004); Rusydi et al. (2006, 2008). The unusual DW order is attributed to cooperative phenomena driven and stabilized by charge and spin correlations, in conjunction with the IC lattice degrees of freedom. Low-energy features spanning frequencies from the kHz to the THz range and associated with the DW dynamics have also been observed. However, while the microwave data have been consistently interpreted in terms of screened DW relaxational dynamics Blumberg et al. (2002); Gorshunov et al. (2002); Gozar et al. (2003); Vuletić et al. (2003), the nature of the excitations in the THz regime, which are seen to be strongly coupled to the charge/spin ordering, remains controversial Blumberg et al. (2002); Gorshunov et al. (2002); Gozar et al. (2003); Vuletić et al. (2003); Abbamonte et al. (2004); Vuletić et al. (2005); Choi et al. (2006); Rusydi et al. (2006, 2007, 2008). An important and open question is, what are the salient spectroscopic features in the meV energy region?
In this Letter we demonstrate using three experimental techniques that low-energy collective modes in Sr14Cu24O41 consist of one Raman and one infrared (IR) active excitation present in the K temperature region, as well as a new mode appearing well below the charge-ordering temperature (T K) whose temperature-dependent behavior is tracked by terahertz time-domain spectroscopy (THz-TDS) Thorsmølle et al. (2007). An intuitive interpretation of these modes in relation to “phononic gaps” opened by Coulomb interactions in IC lattices and coupled to the DW ordering is able to consistently explain the range and relative energies of these excitations which are illustrated in Fig. 1.
Single crystals of Sr14Cu24O41 were grown using the traveling-solvent floating-zone method. The sample was oriented and cut to , with a thickness of 440 m and the a- and c-axes in the plane. The THz-TDS experiments (TPI spectra 1000, TeraView Ltd.) were performed in transmission geometry with the sample mounted inside an optical cryostat capable of reaching 5 K. To obtain the complex conductivity and the transmittance window of the time-domain signals lasting beyond 60 ps (containing several Fabry-Perot internal sample reflections), a complete Drude-Lorentz time-domain analysis study is presented, in contrast to simple frequency-inversion Brauer et al. (2009). The polarized reflectance was measured over a wide frequency range using an in-situ evaporation technique Homes et al. (1993). The complex conductivity is determined from a Kramers-Kronig analysis of the reflectance Dressel and Grüner (2001) requiring extrapolations in the limit; above 250 K a Hagen-Rubens form is employed , while below this temperature the reflectance is assumed to be constant, . The Raman measurements were performed in (cc) and (aa) polarizations as described in Ref. Gozar et al., 2003. The direction of propagation of the light was perpendicular to the a-c plane for all measurements.
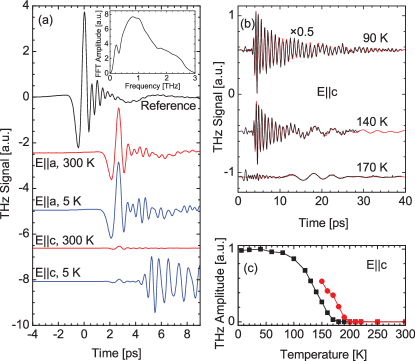
Figure 2(a) shows the electric field of the THz pulse transmitted through the Sr14Cu24O41 sample comparing the response for polarizations along the a- and c-axis at high and low temperatures, as well as a reference signal without a sample. The Fourier transformed (FFT) amplitude spectrum for the reference is shown in the inset. For the electric field polarized along the a-axis, the shape of the THz pulse is essentially the same at 300 and 5 K, characteristic of insulating behavior along this direction. However, for the electric field polarized along the c-axis, the THz signal is barely present at 300 K, indicative of metallic response at higher temperatures. At low temperatures a distinct long-lived ringing is observed with a period of ps. Figure 2(b) shows the transmitted THz pulse polarized along the c-axis for three different temperatures with time-domain fits revealing an additional ps oscillation. The ps period oscillation is observed to appear below K, while the the ps oscillation below K, as shown in Fig. 2(c).
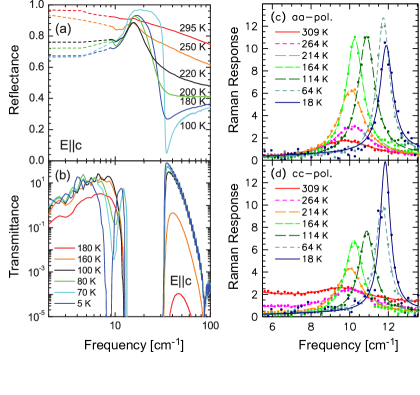
The far-infrared reflectance for light polarized along the c-axis is shown in Fig. 3(a), while (b) shows the transmittance for the electric field polarized along the c-axis of the THz oscillations presented in Fig. 2; Figs. 3(c) and (d) show the aa and cc Raman responses, respectively Gozar and Blumberg (2005); *gozar2005b. A metallic Drude-like behavior is observed in the reflectance above . For the reflectance changes from a metallic to an insulating character, allowing a strong vibrational feature to emerge. For the transmittance shown in Fig. 3(b) there is a sharply defined window where the transmittance is effectively blocked by at least 5 orders of magnitude between cm-1 (1 meV cm-1, 1 THz cm-1), corresponding to the pronounced slow and fast oscillations observed in the time-domain (Fig. 2). As the temperature is raised, the upper limit of this window becomes less effective until , at which point the entire region becomes increasingly opaque. In addition, one also notices an absorption at cm-1 which also decreases with increasing temperature. The loss of the electronic background for signals the transition to a DW ground state and an insulating phase.
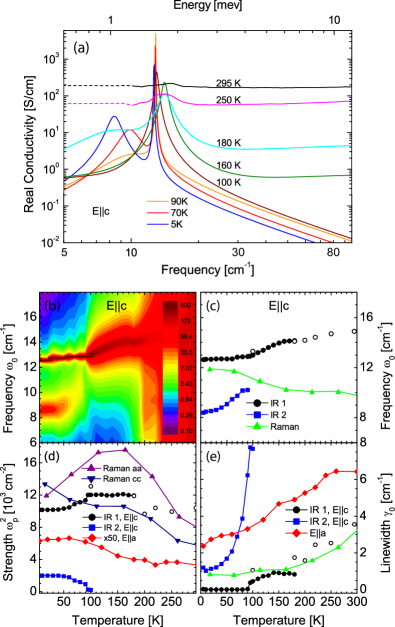
Figure 4(a) shows the temperature-dependence of the real part of the optical conductivity along the c-axis. A metallic response is observed for , while for an insulating response develops. The mode at 14.9 cm-1 narrows and softens to 12.6 cm-1 at low temperature with a slight kink around (we refer to this mode as IR1). The Raman mode seen in aa and cc polarizations has the opposite behavior; its position increases from 9.5 to 12 cm-1 upon cooling from to 5 K. Interestingly, below , a new infrared mode branches off below 10 cm-1 towards lower frequencies, reaching 8.4 cm-1 at K; the temperature dependence of this new mode (which we denote IR2) closely resembles the behavior reported for the weakly-dispersive magnetic chain excitations Matsuda et al. (1999). Along the a-axis the optical conductivity is an order of magnitude smaller than it is along the c axis, confirming the insulating behavior perpendicular to the chains and ladders (not shown); in addition to a number of weak features, a sharp infrared phonon is observed at cm-1. The remaining panels in Figure 4 show the details of the c-axis features in the optical conductivity with (b) a contour plot of optical conductivity as a function of frequency and temperature; (c) the frequency of IR1 and IR2, as well as the frequency of the aa and cc Raman excitations; their respective (d) strengths and (e) linewidths. We note that the total oscillator strength of IR1 and IR2 appears to be conserved [Fig. 4(d)].
It is tempting to relate these excitations to folded phonon modes due to the superstructure. However, using Å and the sound velocity km/s König et al. (1997), one would expect these excitations at energies cm-1. This is a factor of ten higher than what we observe suggesting that a different mechanism is at work.
We then turn our attention to the scenario of the sliding motions of the chain and ladder subsystems presented in Fig. 1. The energy scale and the relative frequencies of the Raman and IR1 modes can be understood qualitatively by taking into account the c-axis incommensurability between the chain and ladder unit cells, , in accordance with recent x-ray studies Gotoh et al. (2003); Zimmermann et al. (2006) which demonstrated that consideration of the super space group is mandatory. We assign , and to the corresponding atomic mass density, unit-cell mass and charge respectively. Using the available crystallographic data we obtain without any fitting parameters
| (1) |
for IR1 Theodorou (1980). Here the chains and ladders are considered uniformly charged and is the experimentally measured contribution of all other higher-energy phonons to the dielectric permittivity. All holes were assumed to be located in the chain system, i.e. and . This is the ionic complement of the electronic zone-center plasmons in metals. In general this mode is acoustic with a diffusive character at long wavelengths but it becomes gapped due to restoring Coulomb forces if the IC systems are oppositely charged Theodorou and Rice (1978); Theodorou (1980); Axe and Bak (1982); Finger and Rice (1983). The Raman mode corresponds to the out-of-phase oscillation of the chain layers, phase shifted by along the b-axis, with the ladders at rest (Fig. 1). Its frequency can be estimated by Eq. (1) in the limit. Hence, which is in good agreement with the experimental observations. Removal of free carriers with decreasing temperature due to the activated nature of the conductivity would reduce screening effects, leading to the Raman mode hardening at low temperatures, also in agreement with our observations.
We suggest that the origin and energy of the IR2 mode can be understood by considering the effects of quasi-2D charge ordering in the chains Matsuda et al. (1999). Once the long-range hole ordering in the chains sets in below K restoring Coulomb forces will oppose the out-of-phase oscillation of adjacent chains. Above 100 K this excitation is expected to have a vanishingly small energy because of the short range charge correlations along the a-axis resulting in the absence of net restoring electrostatic forces in the disordered state. For a long-range sinusoidal charge modulation, the energy of this mode is
| (2) |
with a proportionality factor of the order of unity. Here , and are the distance between two chains, the wavelength and depth of the harmonic charge modulation, respectively. In Sr14Cu24O41 this charge modulation is not a simple sinusoid; however, to first order a harmonic approximation may be used for two coupled chains. Taking , Å and an average charge modulation depth , we find cm-1, again consistent with the experimental data. From Eq. (2) it is seen that IR2 is a direct probe of the charge order. The situation is quite similar to the undoped La6Ca8Cu24O41 where the staggered chain arrangement along the a-axis should generate restoring Coulomb forces -shifted oscillations of adjacent chains and the analog of the IR2 mode in Sr14Cu24O41 is expected to be present at all temperatures. This is in agreement with our experimental observations. A quantitative analysis of the IR2 mode and comparison to crystals of the “14-24-41” family will be the topic of a future study.
In conclusion, we propose that the low-energy Raman and IR1 excitations in Sr14Cu24O41 originate from sliding motions of the IC chains and ladders which are gapped by Coulomb interactions due to the net charge carried by these sub-systems. Long-range charge ordering in the chains will further generate low-energy infrared activity and we suggest this to be at the origin of the new IR2 mode observed in the time-domain THz data below K. The energy of this mode is as such a direct probe of the charge modulation depth as well as of the quasi-2D hole ordering pattern in the chain subsystem.
We gratefully acknowledge useful discussions with T. Maurice Rice and Jason Hancock. We would like to thank H. Eisaki for providing us with samples. Work at Brookhaven was supported by the U.S. Department of Energy, Office of Basic Energy Sciences, Division of Materials Sciences and Engineering under Contract No. DE-AC02-98CH10886. Work at Rutgers was supported by NSF DMR-1104884. Thanks to Prof. H. L. Bhat of IISc, Bangalore for the Indo-French collaborative project, CEFIPRA under project No.3408-4, which supported the crystal growth work at CEA Grenoble.
References
- Theodorou and Rice (1978) G. Theodorou and T. M. Rice, Phys. Rev. B 18, 2840 (1978).
- Theodorou (1980) G. Theodorou, Solid State Commun. 33, 561 (1980).
- Axe and Bak (1982) J. D. Axe and P. Bak, Phys. Rev. B 26, 4963 (1982).
- Finger and Rice (1983) W. Finger and T. M. Rice, Phys. Rev. B 28, 340 (1983).
- Grüner (1994) G. Grüner, Density Waves in Solids (Addison-Wesley, Reading, MA, 1994).
- McCarron III et al. (1988) E. M. McCarron III, M. A. Subramanian, J. C. Calabrese, and R. L. Harlow, Mater. Res. Bull. 23, 1355 (1988).
- Siegrist et al. (1988) T. Siegrist, L. Schneemeyer, S. Sunshine, J. Waszczak, and R. Roth, Mater. Res. Bull. 23, 1429 (1988).
- Vuletić et al. (2006) T. Vuletić, B. Korin-Hamzić, T. Ivek, S. Tomić, B. Gorshunov, M. Dressel, and J. Akimitsu, Physics Reports 428, 169 (2006).
- Takigawa et al. (1998) M. Takigawa, N. Motoyama, H. Eisaki, and S. Uchida, Phys. Rev. B 57, 1124 (1998).
- Matsuda et al. (1999) M. Matsuda, T. Yosihama, K. Kakurai, and G. Shirane, Phys. Rev. B 59, 1060 (1999).
- Abbamonte et al. (2004) P. Abbamonte, G. Blumberg, A. Rusydi, A. Gozar, P. G. Evans, T. Siegrist, L. Venema, H. Eisaki, E. D. Isaacs, and G. A. Sawatzky, Nature 431, 1078 (2004).
- Rusydi et al. (2006) A. Rusydi, P. Abbamonte, H. Eisaki, Y. Fujimaki, G. Blumberg, S. Uchida, and G. A. Sawatzky, Phys. Rev. Lett. 97, 016403 (2006).
- Rusydi et al. (2008) A. Rusydi, P. Abbamonte, H. Eisaki, Y. Fujimaki, S. Smadici, N. Motoyama, S. Uchida, Y.-J. Kim, M. Rübhausen, and G. A. Sawatzky, Phys. Rev. Lett. 100, 036403 (2008).
- Blumberg et al. (2002) G. Blumberg, P. Littlewood, A. Gozar, B. S. Dennis, N. Motoyama, H. Eisaki, and S. Uchida, Science 297, 584 (2002).
- Gorshunov et al. (2002) B. Gorshunov, P. Haas, T. Rõõm, M. Dressel, T. T. Vuletić, B. Korin-Hamzić, S. Tomić, J. Akimitsu, and T. Nagata, Phys. Rev. B 66, 060508(R) (2002).
- Gozar et al. (2003) A. Gozar, G. Blumberg, P. B. Littlewood, B. S. Dennis, N. Motoyama, H. Eisaki, and S. Uchida, Phys. Rev. Lett. 91, 087401 (2003).
- Vuletić et al. (2003) T. Vuletić, B. Korin-Hamzić, S. Tomić, B. Gorshunov, P. Haas, T. Rõ om, M. Dressel, J. Akimitsu, T. Sasaki, and T. Nagata, Phys. Rev. Lett. 90, 257002 (2003).
- Vuletić et al. (2005) T. Vuletić, T. Ivek, B. Korin-Hamzić, S. Tomić, B. Gorshunov, P. Haas, M. Dressel, J. Akimitsu, T. Sasaki, and T. Nagata, Phys. Rev. B 71, 012508 (2005).
- Choi et al. (2006) K.-Y. Choi, M. Grove, P. Lemmens, M. Fischer, G. Güntherodt, U. Ammerahl, B. Büchner, G. Dhalenne, A. Revcolevschi, and J. Akimitsu, Phys. Rev. B 73, 104428 (2006).
- Rusydi et al. (2007) A. Rusydi, M. Berciu, P. Abbamonte, S. Smadici, H. Eisaki, Y. Fujimaki, S. Uchida, M. Rübhausen, and G. A. Sawatzky, Phys. Rev. B 75, 104510 (2007).
- Thorsmølle et al. (2007) V. K. Thorsmølle, B. Wenger, J. Teuscher, J. C. Bauer, and J.-E. Moser, Chimia 61, 631 (2007).
- Brauer et al. (2009) J. C. Brauer, V. K. Thorsmølle, and J.-E. Moser, Chimia 63, 189 (2009).
- Homes et al. (1993) C. C. Homes, M. Reedyk, D. A. Crandles, and T. Timusk, Appl. Opt. 32, 2976 (1993).
- Dressel and Grüner (2001) M. Dressel and G. Grüner, Electrodynamics of Solids (Cambridge University Press, Cambridge, 2001).
- Gozar and Blumberg (2005) A. Gozar and G. Blumberg, in Frontiers in Magnetic Materials, edited by A. V. Narlikar (Spinger-Verlag, 2005) pp. 653–695.
- (26) A. Gozar and G. Blumberg, arXiv:cond-mat/0510193 .
- König et al. (1997) D. König, U. Löw, S. Schmidt, H. Schwenk, M. Sieling, W. Palme, B. Wolf, G. Bruls, B. Lüthi, M. Matsuda, and K. Katsumata, Physica B 237-238, 117 (1997).
- Gotoh et al. (2003) Y. Gotoh, I. Yamaguchi, Y. Takahashi, J. Akimoto, M. Goto, M. Onoda, H. Fujino, T. Nagata, and J. Akimitsu, Phys. Rev. B 68, 224108 (2003).
- Zimmermann et al. (2006) M. v. Zimmermann, J. Geck, S. Kiele, R. Klingeler, and B. Büchner, Phys. Rev. B 73, 115121 (2006).