Present-Day Descendants of Ly-Emitting Galaxies in the
Millennium-II Halo Merger Trees
Abstract
Using the Millennium-II Simulation dark matter sub-halo merger histories, we created mock catalogs of Lyman Alpha Emitting (LAE) galaxies at to study the properties of their descendants. Several models were created by selecting the sub-halos to match the number density and typical dark matter mass determined from observations of these galaxies. We used mass-based and age-based selection criteria to study their effects on descendant populations at , and . For the models that best represent LAEs at , the descendants have a median dark matter halo mass of M⊙, with a wide scatter in masses (50% between and M⊙). Our study differentiated between central and satellite sub-halos and found that of descendants are central sub-halos with . This confirms that central descendants of LAEs have halo masses typical of type galaxies. The satellite sub-halos reside in group/cluster environments with dark matter masses around . The median descendant mass is robust to various methods of age determination, but it could vary by a factor of 5 due to current observational uncertainties in the clustering of LAEs used to determine their typical dark matter mass.
Subject headings:
galaxies: evolution – galaxies: formation – galaxies: high-redshift – large-scale structure of universe1. Introduction
Narrow band surveys have been used to discover Ly-emitting (LAE) galaxies at high redshift (e.g., Hu & McMahon 1996; Cowie & Hu 1998; Steidel et al. 2000; Rhoads et al. 2003) and to study their properties. The galaxies’ strong emission lines reveal a set of young, potentially dust-free galaxies theorized by Partridge & Peebles (1967). LAEs allow us to study galaxy formation beginning with one of the smallest building blocks found so far. At , typical LAEs are low mass galaxies with and little dust extinction, (Gawiser, 2009; Nilsson et al., 2007; Acquaviva et al., 2011a). These objects have been observed at (Venemans et al., 2005; Gawiser et al., 2006; Gronwall et al., 2007; Nilsson et al., 2007) and as far out as (Iye et al., 2006).
Previous papers have studied the evolution of LAEs and other, generally more massive, high-z galaxy populations (e.g. Gilli et al. 2007; Quadri et al. 2007; Salvadori et al. 2010; Yajima et al. 2011) by using clustering properties as a technique to make evolutionary claims between redshifts. The connection between LAEs and present-day galaxies was determined by Gawiser et al. (2007) (hereafter Ga07) by measuring the clustering properties of the LAEs from the sample of Gronwall et al. (2007). Ga07 used the formalism devised by Mo & White (1996) to compute the median dark matter mass of their host halos to be . These authors claimed evolution into present-day type galaxies based upon the analytical conditional mass function (e.g. Hamana et al. 2006; Francke et al. 2008), a result echoed for LAEs at by Guaita et al. (2010) and LAEs at by Ouchi et al. (2010). A weakness of the analytical conditional mass function is its inability to distinguish individual substructures within a halo or to predict the masses of these substructures. N-body simulations fill this gap by producing halo merger trees that allow us to determine properties for the descendant halos and their substructures.
Spectral energy distribution fitting for LAEs reveals a large range in stellar ages (Ga07; Lai et al. 2008; Nilsson et al. 2007; Ono et al. 2010). Ga07 determined the young stellar component to have an age of (Ga07) using a two-stellar population model. This could have two simple interpretations: 1) LAEs occur as a galaxy’s first burst of star formation, which lasts , or 2) LAEs are a recurring phase, where each burst of star formation lasts (Ga07). In both cases, stellar evolution produces dust, which ultimately quenches Ly emission. The old stellar population in the two stellar population model is not well constrained, with an age of up to . A single stellar population model, which observations cannot dismiss, has an age of (Lai et al. 2008; see also Acquaviva et al. 2011a). Acquaviva et al. (2011b) determined stellar ages of for LAEs. Nilsson et al. (2007) found LAE stellar ages of .
These clustering and spectral energy distribution results allow us to create mock LAE catalogs within the Millennium-II Simulation111Data created from the MS-II can be accessed from the Max-Planck Institute and Durham University servers at http://www.mpa-garching.mpg.de/galform/millennium-II using a Structured Query Language (SQL) query. For a merger tree explanation see http://www.g-vo.org/Millennium-II/Help?page=mergertrees. (Boylan-Kolchin et al. 2009, hereafter MS-II) to study the dark matter mass evolution to the present day within a large cosmological simulation. A similar investigation by Coil et al. (2008a) used star-forming galaxies at as a starting point and studied their dark matter halo evolution until the present-day within the Millennium simulation. Section 2.1 describes the MS-II. Section 3 presents specifics of the mock catalogs, while sections 4 and 5 report on the clustering analysis and descendants of the catalogs respectively. All distances reported are comoving, and is assumed throughout.
2. Simulation and Analysis
2.1. Millennium-II Simulation
Our study uses the results of the MS-II run by the Virgo Consortium. The MS-II contains particles in a cube of Mpc on a side. The particle mass is with a minimum halo mass of . MS-II gives us the ability to resolve 125 times less massive sub-halos than those observed within the Millennium Simulation (Springel et al., 2005; Lemson & Virgo Consortium, 2006). LAEs at appear to be hosted within low mass halos, making the improved mass resolution necessary. Although the Millennium Simulation provides 125 times larger volume, MS-II offers robust statistics for spatial clustering of halos in the mass range of interest. Both simulations use a cosmology with values:
All values except and are within of the values reported in the 7-year WMAP results (Larson et al., 2011).
MS-II also offers improved temporal resolution, with dark matter halos selected in 67 timesteps using a friends-of-friends algorithm (Davis et al., 1985) with a linking length of (Boylan-Kolchin et al., 2009). Each FOF group was analyzed for sub-halos using the SUBFIND algorithm (Springel et al., 2001), which identifies gravitationally bound sub-halos within the FOF group. We defined a central sub-halo to be the most massive substructure within an FOF group, and other sub-halos within the group were classified as satellites.
During our age selection (described in §3.2) we found that some of the youngest dark matter halos exhibited rapid mass growth in the range of a factor of 10-1000 during one timestep (approx. 200 Myr). We believe this mass growth is unrealistic and is caused by misidentification of ownership of dark matter particles by the SUBFIND algorithm between neighboring sub-halos. The errant merger trees appear to normalize by merging with the mass theft victim after a couple of timesteps. This allows us to trust the results from our descendants that have had a few timesteps to normalize. Our selection method, that removes fast growing merger trees, computes the dark matter mass ratios between the dark matter halo and its most massive predecessor and between the most massive predecessor and its most massive predecessor. If either of these ratios are greater than 10, then we remove this merger tree from our catalogs. With this filtered set of dark matter halos we produce our models.
2.2. Sub-Halo Abundance Matching
We use Sub-Halo Abundance Matching (SHAM) to determine stellar masses for the descendants of our models. The main principle of the SHAM algorithm is to assign luminosities or stellar masses from a luminosity or stellar mass function to dark matter masses from N-body dark matter simulations monotonically (e.g., Conroy et al., 2006). Dark matter sub-halos are assigned stellar masses by matching the number densities of halos such that
| (1) |
The dark matter masses used in eqn. 1 are sub-halo masses. If the sub-halo is a satellite substructure then we modify the dark matter mass to be the infall mass. Infall mass is defined as the larger of the mass of a central sub-halo before it falls into a larger halo to become a satellite or the satellite mass in the following timestep (See e.g., Conroy et al., 2006). We use the infall mass because it gives a better representation of the current stellar component. Unlike the dark matter particles that are disrupted during infall, the stellar component is deeper in the gravitational potential well and therefore is less likely to be disrupted during infall.
Our algorithm solves eqn. 1 by using a Newton’s method approach where the function and its derivative are
| (2) | |||||
| (3) |
In the above we have used a Schecter function with parameters , and and is the incomplete gamma function. This method allows us to assign stellar masses by solving eqn. 2 for . The large number of sub-halos in the simulation forces us to use a sub-selection technique to determine the stellar mass to dark matter sub-halo mass function. Afterwards we interpolate this function to determine the stellar masses of the descendants from their sub-halo dark matter masses.
3. LAE Mock Catalogs
We created ten LAE mock catalogs from the MS-II using sub-halos at (snapnum222Snapnum is the snapshot (timestep) number from the MS-II. 31) based on mass and age selection. The catalog names and properties are listed in Tables 1 and 2. In the following sections we will discuss the selection criteria and motivation for the different catalogs.
3.1. Mass-based Catalogs
All mass-based catalogs were chosen to reproduce the LAE number density () determined by Gronwall et al. (2007), thus generating models with 3856 sub-halos in the MS-II volume.
-
1.
The mass limit criterion was selected to have a minimum mass of to match that inferred by Ga07 from the observed clustering of LAEs. This approach is similar to the one used by Coil et al. (2008a); their mass limit was chosen to reproduce the clustering of star-forming galaxies. We randomly selected 5.24% of these sub-halos to match the above number density. The Mass limit catalog was designed to reproduce the observed correlation length of LAEs.
-
2.
The Median catalog was selected using the median mass reported by Ga07, , as the catalog’s median mass value. We expanded evenly around the median mass to obtain the observed LAE number density, choosing halos with a range of –. As expected, this catalog and the Mass Limit catalog have similar median masses; it should also reproduce the observed correlation length.
-
3.
The and catalogs were selected and named based on the uncertainty reported by Ga07 in the observed LAE median mass. The median masses of the catalogs are and , respectively. We expand evenly around their respective median masses to obtain the observed LAE number density. The mass ranges for the and catalogs are – and –, respectively. These catalogs were created to study the uncertainty in the descendant properties propagated from the observed clustering uncertainties and are not expected to reproduce the best-fit observed correlation length at .
3.2. Age-based Catalogs
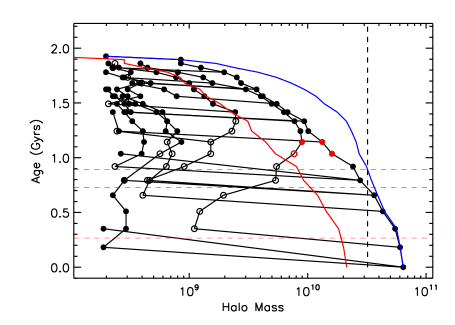
Three age definitions were chosen to study the dependence of descendants’ properties on age selection. The age definitions use merger trees rooted in central sub-halos within FOF halos with , the mass limit criteria. Figure 1 shows an example merger tree showing the formation, assembly and merger ages assigned. Ages are defined as the difference of lookback time chosen and the lookback time at . The three age definitions are as follows:
-
1.
The Formation age (Gao et al., 2004, 2005) quantifies the timescale for mass growth of the most massive dark matter structure. It is assigned by finding the most recent timestep where the sub-halo mass of the most massive progenitor is less than half of the maximum mass in the entire merger tree. If this occurs between two timesteps, we linearly interpolate between these two to estimate the time when half the mass was accreted.
-
2.
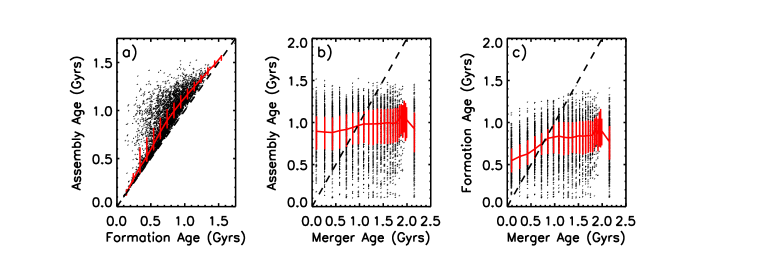
The Assembly age (Navarro et al., 1997) measures when half the maximum mass of a galaxy is present in collapsed sub-halos even if they have not yet merged. This is assigned by finding the most recent timestep where the sum of progenitor sub-halo masses is less than half of the maximum mass in the entire merger tree. If this occurs between two timesteps, we linearly interpolate between these two to estimate the time when half the mass has assembled. Because of these definitions, the Assembly ages are always equal to or greater than the Formation ages. Figure 2 a) shows the relation between Formation and Assembly ages.
-
3.
Merger age searches for the most recent major merger. Our definition was designed to to use a main sub-halo to follow the major merger which is similar to the methods used by Genel et al. (2008). We define a major merger to occur when two central sub-halos have a mass ratio of 3:1 or less in a timestep and the most massive halo within that timestep is involved. The major merger begins when one of the descendants in the next timestep is a satellite of the other descendant or both centrals merge into a single sub-halo. In Figure 1 we have two central sub-halos, around , where the lower mass central sub-halo descends into a satellite belonging to the descendant of the more massive central sub-halo. We track the descendants until the two sub-halos merge, possibly triggering star formation. We average the timestep of this sub-halo merger and the previous timestep to assign the merger time. The infall timescale from the beginning of the 3:1 merger of the two centrals to the final merger of their descendants is comparable to the dynamical friction timescale used by Genel et al. (2008) based on work from Boylan-Kolchin et al. (2008). Figure 2 b) & c) show little to no correlation between Merger age and Assembly or Formation ages.
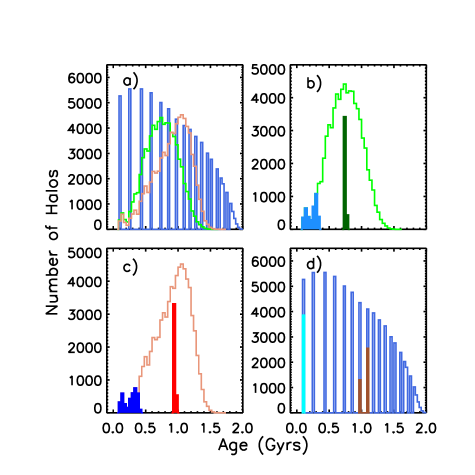
The age distributions are presented in Figure 3 a). The LAE mock catalogs are then created from the ages calculated for all halos with the mass limit criteria by selecting the 5.24% youngest and 5.24% closest to median aged sub-halos. See Figure 3 b), c) & d) for age distributions for all halos and the age distributions of the selected catalogs. Table 2 lists the age properties of the different catalogs with the bold values being age statistics used to select that particular catalog.
All the median age-selected catalogs have median ages of . For star formation triggered by accretion of sub-halos in minor mergers, Formation and Assembly ages should roughly track the age of stars in a galaxy i.e. the population dominating its stellar mass (see e.g., De Lucia & Blaizot, 2007). Since SED fits allow old populations to comprise the majority of stellar mass in LAEs (Ga07; Acquaviva et al. 2011b; Nilsson et al. 2007), the median Formation and Assembly models are feasible models. However, because the merger age should track a young stellar population born in a starburst triggered by the major merger, we cannot reconcile a median merger age with SED results; this rules out the Median Merger model at high confidence. The young Formation and Assembly catalogs are viable models which have median ages of 240 Myr, consistent with ages found for single-population models. The young Merger catalog has a median age of 91 Myr and is consistent with the observed age of the young stellar component.
4. Clustering Analysis of Mock Catalogs
We used the naive estimator (e.g., Landy & Szalay 1993) to calculate the two point auto-correlation function (2PCF) for the models.
Data-data pairs are unique pairs of sub-halos, from a catalog, that are separated and binned by radius . The simple geometry of the simulation, in conjunction with the periodic boundary conditions, allow us to use a geometrical formula for RR, which eliminates uncertainty in the estimator caused by binning random-random pairs.
We applied a correction to our data abscissas to match the effective center of the radial bin using
| (4) | |||
| (5) |
The correction was applied by our fitting algorithm to shift the data point to the radius which corresponds to the average value of the bin. We fit our naive estimator with the power law given by
| (6) | |||
| (7) |
where is the integral constraint found from the power-law term, for the parameters during fitting. We minimized to determine the best fit for the parameters and using
| (8) |
for the variance of the naive estimator (Landy & Szalay, 1993).
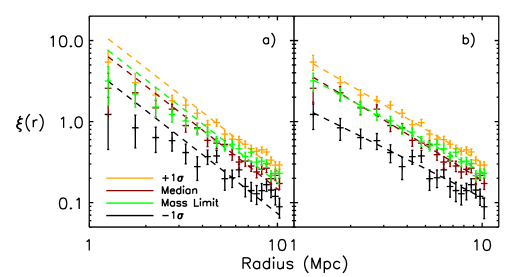
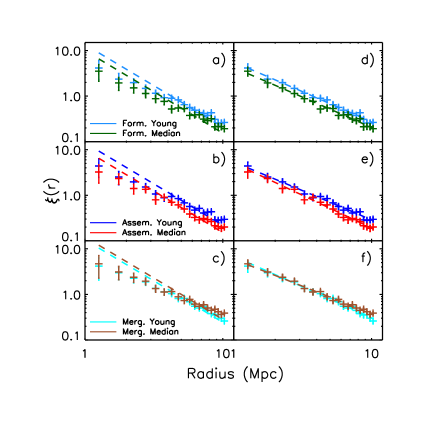
In the following discussion we will fix to compare our results to the observed correlation length for LAEs, (Ga07). Table 1 lists the values found for fixing and also fitting both and as free parameters, while Figures 4 and 5 show the best fit 2PCF for the catalogs.
4.1. Clustering of Mass-Based Catalogs
Figure 4 and Table 1 show the mass-based catalogs’ 2PCFs, correlation lengths, and values. We confirm that correlation lengths increase with median mass in our mass-based catalogs for both fixed and when is allowed to be a free parameter. The Median and Mass limit catalogs have similar median masses and were expected to have the same correlation lengths when ; the correlation lengths are consistent with one another. These two models also have correlation lengths that are consistent with the observed LAE correlation length of , making them good representations of LAEs at . The and models have correlation lengths close to the uncertainty from observed values, as expected. Fixing allows us to compare our results to previous works, but the best fit models are not consistent with this value. We find an average value of , which is consistent with the results from Boylan-Kolchin et al. (2009) at using our fitting range.
4.2. Clustering of Age-Based Catalogs
The similarities of the mass properties of the age-based catalogs (see Table 1) imply that any difference in the clustering properties between age-based catalogs are due to the age definition and selection. The Formation Median and Assembly Median models have similar correlation lengths of and are consistent with the observed LAE correlation length. The Assembly Young and Formation Young have higher correlation lengths of and are barely consistent at the 68% level with the LAE correlation length. We cannot rule out the Young Merger model at 95% confidence. The Median Merger model has a correlation length large enough to be ruled out at 93% confidence. This large correlation length and the high merger ages make the Median Merger model an unrealistic LAE model. No other models are ruled out based on clustering. The observed trend for the Formation and Assembly ages that young aged models have a larger clustering length compared to the median aged models does not disagree with the findings of Gao et al. (2005) that the youngest of halos at cluster less strongly than the oldest . Once we use a similar selection we also find that the oldest halos have higher clustering compared to the youngest.
5. Descendants of Mock LAEs
We used the MS-II merger trees to find the (snapnum 36), (snapnum 45), and (snapnum 67) descendants of the mock LAE catalogs. We report the mass distributions of the descendants based on the mass of the host FOF group, . We prefer M because it determines the evolution of dark matter halos and is used in the Press-Schechter formalism, while the individual sub-halo mass traces the evolution of individual galaxies. We classify the most massive sub-halo within each FOF group as a central and other sub-halos as satellites. All other smaller sub-halos within the FOF group are satellites. The following sub-sections will discuss the descendants of our mock catalogs as reported in Tables 3-5.
5.1. Mass Limit and Median Mass Model Descendants
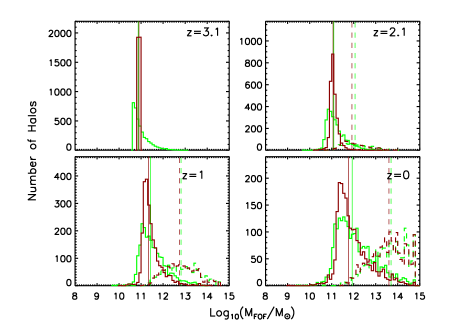
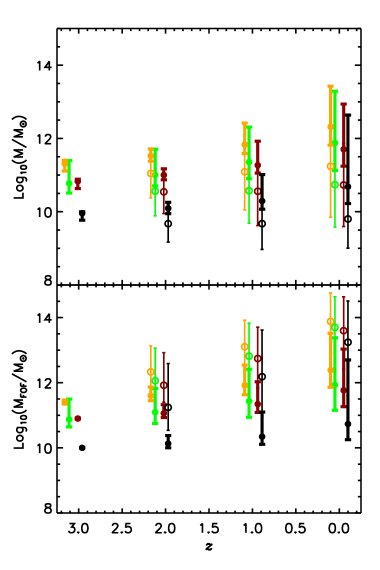
Figure 6 shows an example histograms demonstrating the evolution of the Mass Limit and Median models from to using FOF halo masses. Both models have the same median masses, , at , as also seen in Table 1. All other models evolve in a similar manner. Figure 7 (bottom panel) summarizes this same evolution for all of the mass selected models. The models’ descendants also have similar satellite mass distributions (dashed histograms in figure 6) as they evolve with time. The satellite median masses grow from at to at . The central descendants show evolution towards higher masses, as expected for bottom-up halo growth (Davis et al., 1985), though the 10th percentile in mass stays roughly constant at its value. We find that the catalogs’ central population, which comprise 55-60% of the descendants, has mass growth from at to Milky Way-sized dark matter halos, , at . The median FOF mass for all descendants grows from at to at .
For comparison, Figure 7 top panel shows these descendants in terms of the individual sub-halo mass instead of the mass of the FOF group that the sub-halo resides in. The evolution of mass in this sense is similar to the FOF mass evolution; sub-halos tend to grow in mass towards , but mass loss is seen in the satellite populations. Central sub-halo masses are similar to the FOF masses; therefore, we expect a similar median mass at . We find the central sub-halo median mass to be at . Comparing the top and bottom panels of figure 7 we see that descendants that are satellites reside in massive halos, but the satellite sub-halos are less massive, with a median mass of at .
5.2. Age-Based Model Descendants
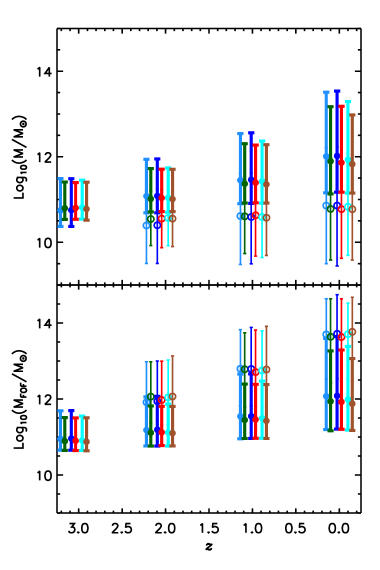
The similarities in the six age-based models’ mass distributions at suggests that we should expect similar descendant distributions. Figure 8 top and bottom panel confirm the similarities among these catalogs’ descendants. The mass evolution represented in figure 8 bottom panel is the mass of the FOF halo where the sub-halo resides while the top panel uses sub-structure mass. The evolution of the mass distributions are all similar and therefore independent of age definition or selection. The descendant central median masses are at , at , and at with a small scatter of less than a factor two. We find that the fraction of central sub-halos for all age-based models is independent of age definition or selection (Tables 3-5). The satellite descendants at comprise of the population and have a median FOF mass of . For all the models the full distribution of descendants have a median FOF mass within a factor of two of at . These FOF masses are in agreement with those found for the Median and Mass limit catalogs described in section 5.1. The sub-halo masses of the age-based models are also similar to the values obtained for the Median and Mass limit models.
5.3. and Model Descendants
The and models were created to quantify the uncertainties within the descendant distributions caused by the uncertainties in the observed clustering analysis. Figure 7 shows the and with the other mass-selected models for comparison using the FOF mass. The central descendant sub-halos have median masses that are a factor of four higher for the model and a factor of ten lower for the model compared with the Median mass catalog’s descendants at . The satellite distributions at have median masses that are a factor of three larger for the and a factor of five smaller for the than the Median model. When we consider the full descendant distribution the median mass of the model is a factor of three larger and the model is six times lower than the Median model. The fraction of central descendant sub-halos is similar between the two models.
6. Determining Stellar Properties of Descendants
Using the SHAM algorithm discussed in section 2.2, we determine the stellar masses for all sub-halos at . We use the Schecter function parameters found by the Sloan Digital Sky Survey (Panter et al., 2007). The parameters are
Figure 9 shows the relationship between infall and stellar masses determined from the SHAM algorithm.
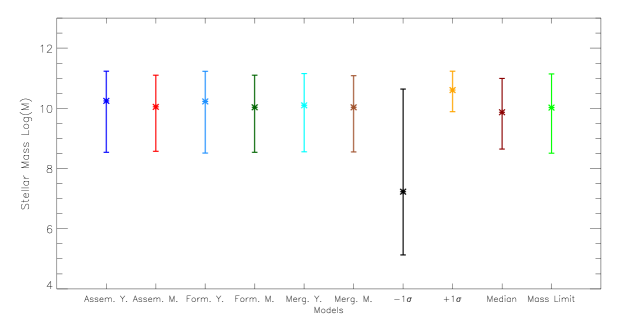
After application of the SHAM algorithm to the entire MSII sub-halo catalog covering dark matter masses ranging from to , we obtained stellar masses ranging from to . The very low stellar masses are attributable to the excess of dark matter sub-structures at low mass compared to the number of galaxies from the stellar mass function, which remains an unsolved problem in galaxy formation. The model is the only model with a significant number of halos in this range. Figure 10 shows the median stellar masses for all the models. The error bars denote the 10th and 90th percentiles. All the models except the and have similar stellar mass distributions. The and models have corresponding shifts in their median stellar masses due to their selection.
7. Discussion and Conclusions
We find that the Median, Mass Limit, Young Formation, Median Formation, Young Assembly and Median Assembly models have correlation lengths within the 68% confidence interval for LAEs at , all though the Young Formation and Young Assembly models have correlation lengths near the limit. As designed, the and catalogs have correlation lengths near the observed correlation length uncertainty. The Young Merger and Median Merger models have large correlation lengths and are not consistent with the clustering measurement. We eliminated the Merger Median model due to the age of Gyr at , in contrast with starburst ages of 20-100 Myr determined from SED fitting. However, SED modeling has not yet constrained the age of LAEs sufficiently to rule out the other age-based catalogs.
We studied the connection between LAEs at and galaxy populations at for which previous studies have determined typical dark matter halo masses. Guaita et al. (2010) found LAEs at to have a median dark matter halo mass of . Their study used bias evolution from the conditional mass function to show that LAEs are possible descendants of LAEs observed by Ga07. All of our models, except the and models, have median dark matter halo masses of the full descendant distributions around at . Hence, LAEs could be direct descendants of LAEs, rather than a new set of halos undergoing their first phase of star formation. However, SED modeling by Guaita et al. (2011) and Nilsson et al. (2011) have found typical starburst ages for LAEs of and . Given these starburst ages, the LAEs would have to be experiencing a subsequent burst of star formation to be descendants of LAEs. Another study by (Adelberger et al. 2005, see their Fig. 2) determined the clustering of BX galaxies at . The clustering result for the least luminous () subset implies a median dark matter mass of . This result is consistent with our descendant median dark matter mass, except for the and models. We find that of the descendants of LAEs are centrals at ; it is unclear whether LAEs and BX galaxies represent a similar mix of centrals and satellites.
We can make a similar comparison from to . The Deep Extragalactic Evolutionary Probe 2 (DEEP2, Davis et al. 2003) measured the clustering bias of color selected galaxies at . For our chosen cosmology, their results (Coil et al., 2008b) imply median dark matter halo masses of and for red and blue galaxies, respectively. The Mass limit, Median, and age-based models have descendant median dark matter halo masses of , consistent with the blue galaxies from the DEEP2 survey. The DEEP2 red galaxy subset are not consistent with being descendants of our LAE catalogs due to their larger dark matter mass. LAEs at are therefore possible progenitors of blue (late-type) galaxies residing in dark matter halos with mass at . We find that of the descendants of LAEs are centrals at ; it is unclear whether the blue DEEP2 galaxies represent a similar mix of centrals and satellites.
The models that best represent LAEs at produce descendants with a median mass around . We find that of the descendants at are central sub-halos, with little variation on the fraction of the central descendants based on model selection. When we study only centrals, the age-based models have median dark matter halo masses at of while the Median Mass and Mass limit catalogs have slightly lower values of . We see no significant dependence on age definition or selection of the descendants’ mass distributions. These results show that the Mass Limit, Median Mass, and age-based catalogs’ descendants have a majority of central sub-halos which reside in type dark matter halos at . However, the and models have descendant masses that are a factor of three larger and seven times smaller than the median mass of the Median model. The factor of five spread in median mass of the and catalogs’ present-day descendants shows that a more precise measurement of the LAE bias is needed to place a stronger constraint on the descendant properties.
References
- Acquaviva et al. (2011a) Acquaviva, V., Gawiser, E., & Guaita, L. 2011a, ApJ, 737, 47
- Acquaviva et al. (2011b) Acquaviva, V., Vargas, C., Gawiser, E., & Guaita, L. 2011b, ArXiv e-prints
- Adelberger et al. (2005) Adelberger, K. L., Erb, D. K., Steidel, C. C., et al. 2005, ApJ, 620, L75
- Boylan-Kolchin et al. (2008) Boylan-Kolchin, M., Ma, C., & Quataert, E. 2008, MNRAS, 383, 93
- Boylan-Kolchin et al. (2009) Boylan-Kolchin, M., Springel, V., White, S. D. M., Jenkins, A., & Lemson, G. 2009, MNRAS, 398, 1150
- Coil et al. (2008a) Coil, A. L., Newman, J. A., Croton, D., et al. 2008a, ApJ, 672, 153
- Coil et al. (2008b) —. 2008b, ApJ, 672, 153
- Conroy et al. (2006) Conroy, C., Wechsler, R. H., & Kravtsov, A. V. 2006, ApJ, 647, 201
- Cowie & Hu (1998) Cowie, L. L. & Hu, E. M. 1998, AJ, 115, 1319
- Davis et al. (1985) Davis, M., Efstathiou, G., Frenk, C. S., & White, S. D. M. 1985, ApJ, 292, 371
- Davis et al. (2003) Davis, M., Faber, S. M., Newman, J., et al. 2003, in Society of Photo-Optical Instrumentation Engineers (SPIE) Conference Series, Vol. 4834, Society of Photo-Optical Instrumentation Engineers (SPIE) Conference Series, ed. P. Guhathakurta, 161–172
- De Lucia & Blaizot (2007) De Lucia, G. & Blaizot, J. 2007, MNRAS, 375, 2
- Francke et al. (2008) Francke, H., Gawiser, E., Lira, P., et al. 2008, ApJ, 673, L13
- Gao et al. (2005) Gao, L., Springel, V., & White, S. D. M. 2005, MNRAS, 363, L66
- Gao et al. (2004) Gao, L., White, S. D. M., Jenkins, A., Stoehr, F., & Springel, V. 2004, MNRAS, 355, 819
- Gawiser (2009) Gawiser, E. 2009, New A Rev., 53, 50
- Gawiser et al. (2007) Gawiser, E., Francke, H., Lai, K., et al. 2007, ApJ, 671, 278
- Gawiser et al. (2006) Gawiser, E., van Dokkum, P. G., Gronwall, C., et al. 2006, ApJ, 642, L13
- Genel et al. (2008) Genel, S., Genzel, R., Bouché, N., et al. 2008, ApJ, 688, 789
- Gilli et al. (2007) Gilli, R., Daddi, E., Chary, R., et al. 2007, A&A, 475, 83
- Gronwall et al. (2007) Gronwall, C., Ciardullo, R., Hickey, T., et al. 2007, ApJ, 667, 79
- Guaita et al. (2011) Guaita, L., Acquaviva, V., Padilla, N., et al. 2011, ApJ, 733, 114
- Guaita et al. (2010) Guaita, L., Gawiser, E., Padilla, N., et al. 2010, ApJ, 714, 255
- Hamana et al. (2006) Hamana, T., Yamada, T., Ouchi, M., Iwata, I., & Kodama, T. 2006, MNRAS, 369, 1929
- Hu & McMahon (1996) Hu, E. M. & McMahon, R. G. 1996, Nature, 382, 231
- Iye et al. (2006) Iye, M., Ota, K., Kashikawa, N., et al. 2006, Nature, 443, 186
- Lai et al. (2008) Lai, K., Huang, J.-S., Fazio, G., et al. 2008, ApJ, 674, 70
- Landy & Szalay (1993) Landy, S. D. & Szalay, A. S. 1993, ApJ, 412, 64
- Larson et al. (2011) Larson, D., Dunkley, J., Hinshaw, G., et al. 2011, ApJS, 192, 16
- Lemson & Virgo Consortium (2006) Lemson, G. & Virgo Consortium. 2006, ArXiv 0608019
- Mo & White (1996) Mo, H. J. & White, S. D. M. 1996, MNRAS, 282, 347
- Navarro et al. (1997) Navarro, J. F., Frenk, C. S., & White, S. D. M. 1997, ApJ, 490, 493
- Nilsson et al. (2007) Nilsson, K. K., Møller, P., Möller, O., et al. 2007, A&A, 471, 71
- Nilsson et al. (2011) Nilsson, K. K., Östlin, G., Møller, P., et al. 2011, A&A, 529, A9
- Ono et al. (2010) Ono, Y., Ouchi, M., Shimasaku, K., et al. 2010, ApJ, 724, 1524
- Ouchi et al. (2010) Ouchi, M., Shimasaku, K., Furusawa, H., et al. 2010, ApJ, 723, 869
- Panter et al. (2007) Panter, B., Jimenez, R., Heavens, A. F., & Charlot, S. 2007, MNRAS, 378, 1550
- Partridge & Peebles (1967) Partridge, R. B. & Peebles, P. J. E. 1967, ApJ, 147, 868
- Quadri et al. (2007) Quadri, R., van Dokkum, P., Gawiser, E., et al. 2007, ApJ, 654, 138
- Rhoads et al. (2003) Rhoads, J. E., Dey, A., Malhotra, S., et al. 2003, AJ, 125, 1006
- Salvadori et al. (2010) Salvadori, S., Dayal, P., & Ferrara, A. 2010, MNRAS, 407, L1
- Springel et al. (2005) Springel, V., White, S. D. M., Jenkins, A., et al. 2005, Nature, 435, 629
- Springel et al. (2001) Springel, V., White, S. D. M., Tormen, G., & Kauffmann, G. 2001, MNRAS, 328, 726
- Steidel et al. (2000) Steidel, C. C., Adelberger, K. L., Shapley, A. E., et al. 2000, ApJ, 532, 170
- Venemans et al. (2005) Venemans, B. P., Röttgering, H. J. A., Miley, G. K., et al. 2005, A&A, 431, 793
- Yajima et al. (2011) Yajima, H., Li, Y., Zhu, Q., et al. 2011, ArXiv e-prints

| NameaaAll models have a number density of . : Centered around ; Mass Limit: Halos with M; Median Mass: Centered around log10M=10.9 M⊙; : Centered around ; Young Formation: Youngest sub-halos based on Formation age; Median Formation: Centered around the median 0.744 Gyr.; Young Assembly: Youngest sub-halos based on Assembly age; Median Assembly: Centered around the median 0.943 Gyr.; Young Merger: Youngest sub-halos based on Merger age.; Median Merger: Centered around the median 1.090 Gyr. | 25th % MassbbMass reported is the mass of the FOF halo where the sub-halo resides, . | Median MassbbMass reported is the mass of the FOF halo where the sub-halo resides, . | 75th % MassbbMass reported is the mass of the FOF halo where the sub-halo resides, . | ccParameters for fits using fixed . | ccParameters for fits using fixed . | /D.O.F. | ddParameters for fits allowing both and as free parameters. | ddParameters for fits allowing both and as free parameters. | /D.O.F. |
|---|---|---|---|---|---|---|---|---|---|
| (M⊙) | (M⊙) | (M⊙) | Mpc | Mpc | |||||
| +1 | 11.36 | 11.40 | 11.44 | 4.67 | 1.80 | 66.53/18 | 4.37 | 1.34 | 9.29/17 |
| Mass Limit | 10.71 | 10.87 | 11.15 | 3.88 | 1.80 | 67.63/18 | 3.33 | 1.24 | 6.80/17 |
| Median Mass | 10.89 | 10.90 | 10.91 | 3.52 | 1.80 | 37.42/18 | 3.15 | 1.40 | 8.95/17 |
| -1 | 10.00 | 10.00 | 10.00 | 2.38 | 1.80 | 44.43/18 | 1.60 | 1.14 | 10.40/17 |
| Formation Age | |||||||||
| Young Formation | 10.74 | 10.95 | 11.27 | 4.25 | 1.80 | 67.12/18 | 3.83 | 1.29 | 9.65/17 |
| Median Formation | 10.72 | 10.89 | 11.17 | 3.58 | 1.80 | 54.55/18 | 3.08 | 1.29 | 7.59/17 |
| Assembly Age | |||||||||
| Young Assembly | 10.75 | 10.96 | 11.28 | 4.37 | 1.80 | 84.68/18 | 3.90 | 1.25 | 13.05/17 |
| Median Assembly | 10.73 | 10.90 | 11.18 | 3.56 | 1.80 | 35.41/18 | 3.19 | 1.41 | 8.41/17 |
| Merger Age | |||||||||
| Young Merger | 10.72 | 10.91 | 11.19 | 4.65 | 1.80 | 62.75/18 | 4.31 | 1.33 | 7.42/17 |
| Merger Median | 10.71 | 10.87 | 11.15 | 5.04 | 1.80 | 121.25/18 | 4.66 | 1.17 | 8.61/17 |
| NameaaModel descriptions found in Table 1. | Form. 25th | Form. 50th | Form. 75th | Assem. 25th | Assem. 50th | Assem. 75th | Merg. 25th | Merg. 50th | Merg. 75th |
|---|---|---|---|---|---|---|---|---|---|
| Gyr | Gyr | Gyr | Gyr | Gyr | Gyr | Gyr | Gyr | Gyr | |
| +1 | 0.523 | 0.696 | 0.857 | 0.644 | 0.864 | 1.033 | 0.583 | 0.978 | 1.454 |
| Mass Limit | 0.569 | 0.748 | 0.921 | 0.724 | 0.946 | 1.110 | 0.583 | 1.090 | 1.527 |
| Median Mass | 0.580 | 0.766 | 0.942 | 0.754 | 0.964 | 1.128 | 0.583 | 1.090 | 1.527 |
| -1 | 0.675 | 0.877 | 1.066 | 0.915 | 1.080 | 1.218 | 0.725 | 1.288 | 1.802 |
| Formation Age | |||||||||
| Young Formation | 0.156 | 0.258 | 0.301 | 0.164 | 0.289 | 0.354 | 0.267 | 0.856 | 1.454 |
| Median Formation | 0.738 | 0.747 | 0.755 | 0.831 | 0.905 | 1.018 | 0.583 | 0.978 | 1.454 |
| Assembly Age | |||||||||
| Young Assembly | 0.158 | 0.270 | 0.324 | 0.164 | 0.289 | 0.345 | 0.583 | 1.090 | 1.593 |
| Median Assembly | 0.684 | 0.785 | 0.847 | 0.936 | 0.946 | 0.956 | 0.583 | 0.978 | 1.454 |
| Merger Age | |||||||||
| Young Merger | 0.419 | 0.553 | 0.686 | 0.693 | 0.897 | 1.069 | 0.091 | 0.091 | 0.091 |
| Merger Median | 0.640 | 0.832 | 0.981 | 0.749 | 0.970 | 1.120 | 0.978 | 1.090 | 1.090 |
Note. — Table reports the 25th, 50th and 75th percentiles for each model using the Formation (Form.), Assembly (Assem.) and Merger (Merg.) age definitions (See section 3.2). Bold entries mark the values in the age definition used to select the age-based models.
| NameaaModel descriptions found in Table 1. | Distribution TypebbCentrals are the most massive sub-halos within their FOF halo. Satellites are all other sub-halos. Full describes the properties of all descendant sub-halos. The median mass values for the central and satellite distributions are shown in Figures 7 and 8. | FractionccFraction of objects within full, central or satellite subset. | 25th % MassddMass reported is the mass of the FOF halo where the sub-halo resides, . | Median MassddMass reported is the mass of the FOF halo where the sub-halo resides, . | 75th % MassddMass reported is the mass of the FOF halo where the sub-halo resides, . |
|---|---|---|---|---|---|
| (M⊙) | (M⊙) | (M⊙) | |||
| +1 | Full | 100% | 11.54 | 11.66 | 11.94 |
| Central | 76% | 11.51 | 11.60 | 11.72 | |
| Satellite | 24% | 12.05 | 12.33 | 12.80 | |
| Mass Limit | Full | 100% | 10.94 | 11.25 | 11.77 |
| Central | 76% | 10.88 | 11.10 | 11.42 | |
| Satellite | 24% | 11.64 | 12.06 | 12.57 | |
| Median Mass | Full | 100% | 11.01 | 11.13 | 11.50 |
| Central | 73% | 10.99 | 11.06 | 11.18 | |
| Satellite | 27% | 11.58 | 11.92 | 12.41 | |
| -1 | Full | 100% | 10.09 | 10.20 | 10.65 |
| Central | 72% | 10.06 | 10.13 | 10.24 | |
| Satellite | 28% | 10.76 | 11.24 | 11.95 | |
| Young Formation | Full | 100% | 11.01 | 11.36 | 11.88 |
| Central | 72% | 10.93 | 11.18 | 11.59 | |
| Satellite | 28% | 11.50 | 11.91 | 12.51 | |
| Median Formation | Full | 100% | 10.94 | 11.25 | 11.74 |
| Central | 77% | 10.88 | 11.11 | 11.43 | |
| Satellite | 23% | 11.65 | 12.06 | 12.52 | |
| Young Assembly | Full | 100% | 11.01 | 11.36 | 11.91 |
| Central | 72% | 10.92 | 11.19 | 11.58 | |
| Satellite | 28% | 11.52 | 11.94 | 12.55 | |
| Median Assembly | Full | 100% | 10.97 | 11.26 | 11.71 |
| Central | 77% | 10.91 | 11.12 | 11.44 | |
| Satellite | 23% | 11.57 | 11.97 | 12.47 | |
| Young Merger | Full | 100% | 10.96 | 11.30 | 11.79 |
| Central | 75% | 10.90 | 11.12 | 11.48 | |
| Satellite | 25% | 11.64 | 12.04 | 12.56 | |
| Merger Median | Full | 100% | 10.94 | 11.24 | 11.76 |
| Central | 76% | 10.89 | 11.10 | 11.40 | |
| Satellite | 24% | 11.65 | 12.06 | 12.58 |
| NameaaModel descriptions found in Table 1. | Distribution TypebbAs defined in Table 3. The median mass values for the central and satellite distributions are shown in Figures 7 and 8. | FractionccFraction of objects within full, central or satellite subset. | 25th % MassddMass reported is the mass of the FOF halo where the sub-halo resides, . | Median MassddMass reported is the mass of the FOF halo where the sub-halo resides, . | 75th % MassddMass reported is the mass of the FOF halo where the sub-halo resides, . |
|---|---|---|---|---|---|
| (M⊙) | (M⊙) | (M⊙) | |||
| +1 | Full | 100% | 11.83 | 12.21 | 12.90 |
| Central | 63% | 11.74 | 11.92 | 12.20 | |
| Satellite | 37% | 12.70 | 13.10 | 13.54 | |
| Mass Limit | Full | 100% | 11.30 | 11.86 | 12.68 |
| Central | 62% | 11.12 | 11.43 | 11.88 | |
| Satellite | 38% | 12.23 | 12.81 | 13.42 | |
| Median Mass | Full | 100% | 11.27 | 11.68 | 12.53 |
| Central | 61% | 11.18 | 11.34 | 11.63 | |
| Satellite | 39% | 12.21 | 12.74 | 13.33 | |
| -1 | Full | 100% | 10.29 | 10.70 | 11.93 |
| Central | 61% | 10.21 | 10.34 | 10.61 | |
| Satellite | 39% | 11.43 | 12.18 | 13.04 | |
| Young Formation | Full | 100% | 11.40 | 12.00 | 12.79 |
| Central | 60% | 11.17 | 11.54 | 12.05 | |
| Satellite | 40% | 12.27 | 12.80 | 13.44 | |
| Median Formation | Full | 100% | 11.30 | 11.84 | 12.63 |
| Central | 63% | 11.13 | 11.45 | 11.89 | |
| Satellite | 37% | 12.21 | 12.78 | 13.38 | |
| Young Assembly | Full | 100% | 11.40 | 12.00 | 12.79 |
| Central | 60% | 11.18 | 11.55 | 12.06 | |
| Satellite | 40% | 12.26 | 12.79 | 13.44 | |
| Median Assembly | Full | 100% | 11.32 | 11.83 | 12.61 |
| Central | 63% | 11.15 | 11.46 | 11.87 | |
| Satellite | 37% | 12.19 | 12.71 | 13.38 | |
| Young Merger | Full | 100% | 11.34 | 11.91 | 12.67 |
| Central | 62% | 11.16 | 11.49 | 11.97 | |
| Satellite | 38% | 12.19 | 12.75 | 13.39 | |
| Merger Median | Full | 100% | 11.27 | 11.83 | 12.61 |
| Central | 63% | 11.12 | 11.42 | 11.87 | |
| Satellite | 37% | 12.23 | 12.78 | 13.45 |
| NameaaModel descriptions found in Table 1. | Distribution TypebbAs defined in Table 3. The median mass values for the central and satellite distributions are shown in Figures 7 and 8. | FractionccFraction of objects within full, central or satellite subset. | 25th % MassddMass reported is the mass of the FOF halo where the sub-halo resides, . | Median MassddMass reported is the mass of the FOF halo where the sub-halo resides, . | 75th % MassddMass reported is the mass of the FOF halo where the sub-halo resides, . |
|---|---|---|---|---|---|
| (M⊙) | (M⊙) | (M⊙) | |||
| +1 | Full | 100% | 12.26 | 12.95 | 13.83 |
| Central | 60% | 12.05 | 12.38 | 12.93 | |
| Satellite | 40% | 13.41 | 13.88 | 14.36 | |
| Mass Limit | Full | 100% | 11.75 | 12.65 | 13.69 |
| Central | 58% | 11.42 | 11.93 | 12.61 | |
| Satellite | 42% | 13.04 | 13.70 | 14.32 | |
| Median Mass | Full | 100% | 11.68 | 12.51 | 13.57 |
| Central | 55% | 11.44 | 11.77 | 12.32 | |
| Satellite | 45% | 12.97 | 13.60 | 14.13 | |
| -1 | Full | 100% | 10.63 | 11.71 | 13.26 |
| Central | 57% | 10.42 | 10.73 | 11.50 | |
| Satellite | 43% | 12.29 | 13.24 | 13.96 | |
| Young Formation | Full | 100% | 11.91 | 12.84 | 13.74 |
| Central | 57% | 11.53 | 12.07 | 12.86 | |
| Satellite | 43% | 13.08 | 13.70 | 14.23 | |
| Median Formation | Full | 100% | 11.79 | 12.64 | 13.66 |
| Central | 56% | 11.45 | 11.94 | 12.55 | |
| Satellite | 44% | 12.99 | 13.63 | 14.22 | |
| Young Assembly | Full | 100% | 11.92 | 12.85 | 13.76 |
| Central | 57% | 11.56 | 12.08 | 12.86 | |
| Satellite | 43% | 13.09 | 13.72 | 14.32 | |
| Median Assembly | Full | 100% | 11.79 | 12.60 | 13.58 |
| Central | 58% | 11.47 | 11.92 | 12.52 | |
| Satellite | 42% | 13.00 | 13.63 | 14.20 | |
| Young Merger | Full | 100% | 11.83 | 12.71 | 13.70 |
| Central | 58% | 11.47 | 11.99 | 12.67 | |
| Satellite | 42% | 13.03 | 13.71 | 14.20 | |
| Merger Median | Full | 100% | 11.75 | 12.56 | 13.73 |
| Central | 58% | 11.42 | 11.88 | 12.51 | |
| Satellite | 42% | 12.96 | 13.77 | 14.37 |