Opinion formation in time-varying social networks:
The case of the naming game
Abstract
We study the dynamics of the naming game as an opinion formation model on time-varying social networks. This agent-based model captures the essential features of the agreement dynamics by means of a memory-based negotiation process. Our study focuses on the impact of time-varying properties of the social network of the agents on the naming game dynamics. In particular, we perform a computational exploration of this model using simulations on top of real networks. We investigate the outcomes of the dynamics on two different types of time-varying data - (i) the networks vary on a day-to-day basis and (ii) the networks vary within very short intervals of time (20 seconds). In the first case, we find that networks with strong community structure hinder the system from reaching global agreement; the evolution of the naming game in these networks maintains clusters of coexisting opinions indefinitely leading to metastability. In the second case, we investigate the evolution of the naming game in perfect synchronization with the time evolution of the underlying social network shedding new light on the traditional emergent properties of the game that differ largely from what has been reported in the existing literature.
pacs:
89.75.-k, 05.65.+b, 89.65.EfI Introduction
Social networks are inherently dynamic. Social interactions and human activities are intermittent, the neighborhood of individuals moving over a geographic space evolves over time, links appear and disappear in the World-Wide-Web. The essence of social network lies in its time-varying nature. Links may exist for a certain time period and may be recurrent. In summary, as time progresses, the societal structure keeps changing. Similarly, with the evolution of time, social conventions, shared cultural and linguistic patterns reshape themselves. Opinions spread, some get trapped into communities, some cross the barrier of local groups/communities and become accepted globally among different communities and some die competing with others. Most of these social phenomena can be modeled and analyzed in a time-varying framework. Almost all previous work is limited to the analysis of the naming game dynamics on static networks baronchelli:06a ; topo ; qu ; dall ; liu ; chaos ; luca ; luc ; yan . Therefore, in this paper, we focus on the competing opinion formation over time-varying real-world social networks. One way of viewing at time-varying networks is as a series of static graphs accumulated over a fixed time interval; however these kind of networks do not always perfectly capture the temporal ordering of the links appearing in the system which may sometimes lead to over/under-estimation of network topologies. Thus, we plan to investigate the opinion formation process on both the accumulated static graphs as well as on its detailed time-resolved counterpart.
In this paper, we focus on the basic Naming Game model (NG) baronchelli:06a to study how opinions spread with time and how societies move towards consensus in the adoption of a single opinion through negotiation or agree upon multiple opinions due to non-uniform interaction pattern among different communities. The evolution of the system in this model takes place through the usual local pairwise interactions among artificial agents that necessarily capture the generic and essential features of an agreement process. This model was expressly conceived to explore the role of self-organization in the evolution of languages steels96aSelf ; steels96selfOrganizing and has acquired a paradigmatic role in semiotic dynamics that studies evolution of languages through invention of new words, grammatical constructions and more specifically, through adoption of new meaning for different words. NG finds wide applications in various fields ranging from artificial sensor network as a leader election model baronchelli:11 to the social media as an opinion formation model.
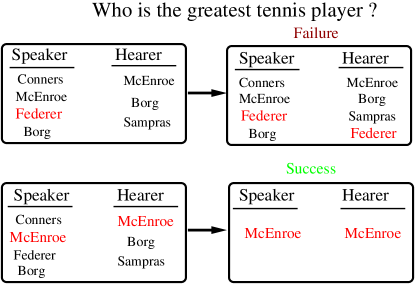
The minimal naming game consists of a population of agents observing a single object in the environment (may be a discussion on a particular topic) and opining for that by means of communication with one another through pairwise interactions, in order to reach a global agreement. The agents have at their disposal an internal inventory, in which they can store an unlimited number of different words or opinions. At the beginning, all the individuals have empty inventories. At each time step, the dynamics consists of a pairwise interaction between randomly chosen individuals. The chosen individuals can take part in the interaction as a “speaker” or as a “hearer.” The speaker voices to the hearer a possible opinion for the object under consideration; if the speaker does not have one, i.e., ̵͑his inventory is empty͒, he invents an opinion͔. In case where he already has many opinions ̵͑stored in his inventory͒, he chooses one of them randomly. The hearer’s move is deterministic: if she possesses the opinion pronounced by the speaker, the interaction is a “success”, and in this case both speaker and hearer retain that opinion as the right one, removing all other competing opinions/words from their inventories; otherwise, the new opinion is included in the inventory of the hearer, without any cancellation of opinions in which case the interaction is termed as a “failure” (see fig 1). The game is played on a fully connected network, i.e., every agent can, in principle, communicate with every other agents, and makes the following assumption. It is assumed that there can be potentially huge number of opinions for a particular topic so that the probability that two players will ever invent the same opinion at two different times is practically negligible and that the environment consists of a single topic of discussion.
Although the system reaches a global consensus through the invention and decay of opinions, it is interesting to note the important differences from other opinion formation models. In Axelrod’s model Axelrod_1997 , each agent is endowed with a vector of opinions, and can interact with other agents only if their opinions are already close enough; in Sznajd’s model sznajdweron and in the Voter model Krapivsky92 , the opinion can take only two discrete values, and an agent takes deterministically the opinion of one of its neighbors. Further in Deffuant01 , opinion is modeled as a unique variable and the evolution of two interacting agents is deterministic. In the naming game model on the other hand, each agent can potentially have an unlimited number of possible discrete states (or opinions) at the same time, accumulating in his/her memory different possible opinions; the agents are able to “wait” before reaching a decision. Moreover, each dynamical step can be seen as a negotiation between a speaker and a hearer, with a certain degree of stochasticity.
Most previous studies of the NG model in semiotic/opinion dynamics have focused on populations of agents in which all pairwise interactions are allowed, i.e., the agents are placed on the vertices of a fully connected graph baronchelli:06a ; baronchelli08 . Apart from this mean-field case, the model has also been studied on regular lattices topo ; qu ; small world networks qu ; dall ; liu ; chaos ; random geometric graphs qu ; lu ; hao ; static luca ; luc ; yan , dynamic and adaptive who and empirical con complex networks.
In this paper, we consider the NG dynamics on two different types of time-varying data; one varying on a day-to-day basis while another varying over very short intervals of time (20 seconds). In the first case, we observe that networks with strong community structures delay the convergence due to co-existence of competing and long-lasting clusters of opinions. In the second case, the games are played in perfect synchronization with the time-evolution of the network. In this case, we observe that the global observables are markedly different from the case where the games are played on the static (and composite) version of the same network as well as from the traditional results reported in the literature.
The rest of the paper is organized as follows. In Section 2, we describe the datasets on which we investigate the naming game dynamics in a time-varying social scenario. Section 3 provides the elaborate model description. In Section 4, we present the results and provide explanations for our findings. Finally, conclusions are drawn in section 5.
II Datasets
For the purpose of the investigation of the NG dynamics on time-varying networks, we consider two specific real-world face-to-face contact datasets and present our results on each of them. Both the datasets are obtained from SocioPatterns Collaboration (http://www.sociopatterns.org/datasets/). The data collection infrastructure uses active RFID devices embedded in conference badges to detect and store face-to-face proximity relations of persons wearing the badges. These devices can detect face-to-face proximity (1-1.5 meter) of individuals wearing the badge with a temporal resolution of 20 seconds. A detailed description of the datasets on which we conduct our experiments are as follows:
SCIENCE GALLERY: The dataset comprises of face-to-face interaction data of visitors of the Science Gallery in Dublin, Ireland during the spring of 2009 at the event of art-science exhibition “INFECTIOUS: STAY AWAY” Isella2011166 .
a) Cumulative data per day (): This comprises of 69 weighted networks of the visitors of the Science Gallery each representing a cumulative static aggregation network of a single day. Each of these daily interaction networks are obtained by aggregating the contact sequences for a period of 24 hours. The nodes in these networks represent visitors of the Science Gallery while an edge is drawn between two nodes if at least one contact was detected between those nodes during the interval of aggregation. Thus, every edge is weighted by the number of 20 seconds intervals during which the corresponding individuals have been in close-range proximity. In other words, if and remain in contact for number of 20s interval then the weight .
b) Time resolved data (): This dataset consists of time-varying versions of the networks for each of the 69 days. On each day, the evolution of the face-to-face interactions of the agents is captured by varying snapshots of the interaction network obtained after every 20 second time interval.
HYPERTEXT, 2009 (): The face-to-face interaction data of the conference attendees of ACM Hypertext 2009 held in Institute for Scientific Interchange Foundation in Turin, Italy, from June to July , 2009, where the SocioPatterns project deployed the Live Social Semantics application. The dataset contains the dynamical network of face-to-face proximity of 113 conference attendees over about 2.5 days.
III The model description
The basic NG Model can be summarized as follows. At each time step ( = 1, 2, ..) two agents are randomly selected to interact: one of them plays the role of speaker, the other one that of hearer. The interactions obey the following rules
-
•
The speaker voices an opinion from his list of opinions to the hearer. (If the speaker has more than one opinion on his list, he randomly chooses one; if he has none, he invents a brand new opinion 111 For implemetation purposes this refers to maintaining a word identification number which is incremented by one for every new invention.)
-
•
If the hearer has this opinion, the communication is termed “successful”, and both players delete all other opinions, i.e., collapse their list of opinions to this one opinion. Therefore, they meet a local agreement.
-
•
If the hearer does not have the opinion transmitted by the speaker (termed “unsuccessful” communication), she adds the opinion to her list of opinions without any deletion.
Note that in this model any agent is free to interact with any other agent, i.e., the underlying social structure is assumed to be fully connected. For the purpose of our analysis however, we assume that the agents are embedded on realistic social networks (i.e., SG and HT) that are continuously varying over time. In this case, although the basic rules of the game remain exactly same, the only issue is to devise a strategy for the speaker-hearer selection. We consider two variants of this selection, the first one being suitable for the dataset and the second one for the and dataset.
Strategy I (weighted version): Here we randomly select a speaker and preferentially choose a hearer among his neighbors. Our intention is to simulate an important criterion: we talk most preferably to those with whom we had already met before. This is implemented as follows:
-
•
The speaker is selected randomly.
-
•
The hearer is chosen from among the neighbors of such that it is more likely that shares a high-weighted link with , i.e., the choice is according to the probability
where (see section II for definition) is the edge weight between the pair and while is the number of neighbors of .
Strategy II (unweighted version): This variant is quite straight-forward. We choose a random speaker and a random hearer among his neighbors to impart equal importance to each pair of connections.
The main quantities of interest which describe the emergent properties of the system are
-
•
the total number of words/opinions in the system at the time (i.e., the total size of the memory);
-
•
the number of different words/opinions in the system at the time ;
-
•
the average success rate , i.e., the probability, computed averaging over many simulation runs, that the chosen agent gets involved in a successful interaction at a given time .
From a global perspective, the quantities which are of interest are the time to reach the global consensus (), the maximum memory required by the agents during the process () and the time required to reach this memory peak ().
IV Results and discussions
In this section, we present the results of the analysis of the NG dynamics on the , and the datasets.
IV.1 Analysis on day-wise dataset
We have studied the opinion formation process on the 69 days of close interactions among the visitors for the dataset. We play the naming game on each of the composite daily networks of 69 days seperately following Strategy I until we reach consensus. Note that we are still playing NG on static and composite versions of the networks obtained at the end of each of the 69 days seperately. The primary focus of this study is to find the day-to-day differences in the behavior of the global quantities obtained by playing the NG until consensus is reached on the top of each of the 69 instances individually. These composite instances can be thought of as 69 different societal structures (with a certain amount of overlap in the nodes between any two consecutive days) and the objective here is to investigate how the day-to-day variability of this structure affect the opinion formation in terms of the global quantities of interest. The sizes of the giant component in these networks are not always . Therefore, for such disconnected networks, the NG will never reach consensus on only one opinion because the network is inherently broken into several connected components with no links among them to propel opinion shift. In particular, never converges to 1. Therefore, in such cases we redefine as the time to reach the following state: and where is the number of disconnected components (signifying one opinion per component as the convergence criteria). In the rest of this section, we shall analyze how the opinion dynamics gets affected as the underlying network structure varies on a day-to-day basis.
IV.1.1 Analysis of
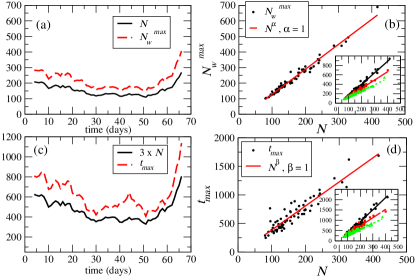
One of the important observables for the NG dynamics is the memory peak, i.e., the maximum memory required by the system during the course of the dynamics. It is interesting to note how this memory peak varies with the population size (see fig 2(a) 222Moving average is a standard smoothing technique for time-series data. Moving average of window size refers to a series of arithmetic means, each of successive observations of the given data and are shown against the midpoints of the time intervals covered by the respective group. For example, to begin with, we take first values (i.e., the window); at the next stage, exclude the first and include the value and so on. We repeat this until we reach the last set of values.) over the days. In particular, this quantity has a linear scaling with the population size (see fig 2(b)). This relationship is in agreement with what has been observed in the literature for small-world, scale-free and random networks luca ; chaos where scales as .
IV.1.2 Analysis of
Another important global quantity of the dynamics is the time required by the population of agents to reach the memory peak (i.e., ). Fig 2(c) once again shows a strong correlation of with the population size . The relationship is further explored in fig 2(d) where a linear scaling is observed between them. This observation is also in perfect agreement with the existing literature.
IV.1.3 Analysis of
The most important observable for the NG dynamics is the time to reach the global agreement . Unlike the other observables, does not show a direct correspondence with the population size (see fig 3(a) and (b)). This behavior of is not in lines of the existing literature where it is usually noted that . Therefore the natural question that needs to be addressed is that what is (are) the property(s) of the underlying network that leads to such a non-conforming behavior of .
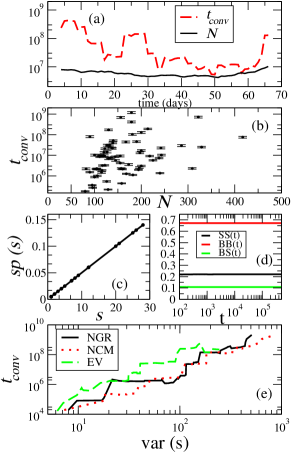
In fact, the answer to this question lies in the common behavior of real-world social networks. These networks typically consist of a number of communities; nodes within communities are more densely connected, while links bridging communities are sparse. The effect of the community structure plays a dominant role with the emergence of long-lasting multi-opinion states at the late stage of the dynamics which has also been observed in luca and con . We observe that each community reaches internal consensus fast but the weak connections between communities are not sufficient for opinions to propagate from one community to the other leading to long multi-opinion states which are also known as “metastable states” in the statistical physics literature. Formally, a metastable state is a state of the dynamics where global shifts are always possible but progressively more unlikely and the response properties depend on the age of the system Mukherjee2011Aging . Community structures are essentially authentic signatures of metastability that inhibits the dynamics leading to very slow convergence.
Presence of community structures slows down the dynamics, however, what renders the system even slower is the presence of different-sized communities. The reason for this is quite straight-forward: the agents that are part of a larger size community have a higher probability of being chosen for a game than those belonging to a smaller size community. This is a reminiscent of the fact that the speakers are always chosen randomly which automatically increases the chances of landing in a larger size community simply because a larger bulk of the population is confined within this community (see fig 3(c)). Therefore, even after consensus is reached in a large community, the system keeps on choosing agents from this community itself mostly resulting in “success with no outcome”. Further, since the inter-community links are weak, and agents from smaller communities are rarely chosen the overall state of the system hardly changes, thereby, always keeping the agents away from the global consensus. This is also supported by the fig 3(d) where we propose three metrics , , representing the fraction of games upto time played by a pair of agents both belonging to smaller communities, both belonging to bigger communities and one belonging to the bigger and other to the smaller community respectively. We see that the games are played mostly by agents both belonging to larger communities followed by agents both belonging to smaller community whereas the games which involve one agent from a large community and the other from a small community are the least in number. This phenomenon is reflected throughout the game dynamics. Further, we report in fig 3(e) the correlation of with the variance of the community sizes. The basic idea is as follows: if a network gets decomposed into m communities each of size then we calculate the statistical variance of this size distribution and plot it against . For the purpose of community analysis, we use three standard algorithms - Newman and Girvan (NGR) NewGir04 , Newman, Clauset and Moore (NCM) Clauset04 and community detection by eigen vector (EV) Newman_2006 and in each case we observe that has a strong positive correlation with the variance of the community sizes (see fig 3 (e)).
IV.1.4 Effect of edge weights
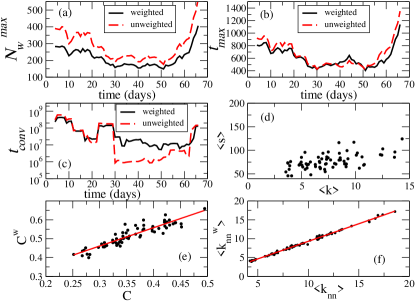
We observe that the naming game dynamics exhibits very similar behavior irrespective of the fact whether the underlying network is weighted or unweighted (see fig 4(a), (b) and (c)). We conjecture that this is because various topological properties of the weighted and unweighted versions of the same network are correlated to a significant extent. For instance, there is a strong correlation between the average degree (unweighted network) and the average strength (weighted network) (fig 4(d)). The weighted clustering coefficient is almost perfectly correlated to the unweighted clustering coefficient (see fig 4(e)). Further, the weighted average nearest neighbor degree and the unweighted average nearest neighbor degree are perfectly correlated with linear dependency in between them (see fig 4(f)). All these observations can be possibly attributed to the fact that a huge majority of the links in the weighted networks have very low weights 333The average of the mean of weight distributions for all these 69 networks is 11 (i.e, majority are low-weight edges) whereas the average standard deviation of these weight distributions is 20.5 which is non-negligible indicating the presence of atleast a few high weight edges. (on an average 67 % of the edges have weights below 5) which make them roughly equivalent in structure to their unweighted counterparts. However, a deeper analysis on this issue remains a part of our future scope.
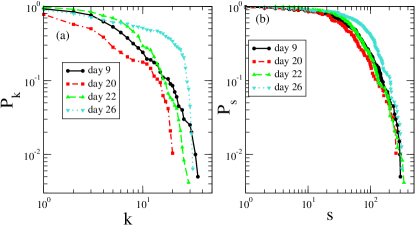
IV.1.5 Examples of individual instances
In this subsection, we dig deeper into the individual snapshots to have a more clear understanding of the on-going dynamics. From the 69 instances, we present four representative cases that roughly capture all the different characteristics found across the instances. The degree and the strength (i.e., weighted degree) distributions of these networks are shown in fig 5. Note that the degree and the strength distributions exhibit very similar behavior for all the four networks - this is in correspondence with the observations made in the previous subsection. Both these distributions roughly indicate a small initial power-law regime followed by a cut-off. Although these statistical distributions look fairly similar, the outcome of the naming game dynamics as we shall see, is largely different across these networks.
Two among these, consist of disconnected components while the other two are single connected components. Further, two of them (one connected and the other disconnected) show fast convergence while the other two (again one connected and the other disconnected) show slow convergence triggered by the presence of community structures leading to metastability. Here we propose two metrics to capture the two distinct behaviors of the convergence time. The first one is the average number of unique words per community which is denoted by and defined as follows:
where is the number of communities and is the list of unique words in community .
The second metric we propose is the average overlap of unique words across communities which is denoted by and defined as follows:
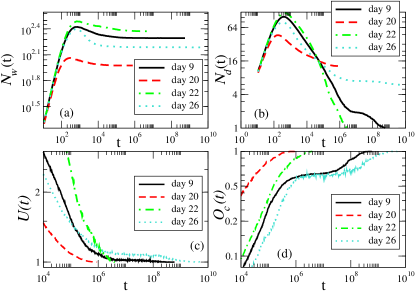
We consider the daily networks of , , and day. The and day network structures consist of a single connected component with 200 and 240 nodes respectively while the and day network consist of multiple disconnected components with 96 and 156 nodes respectively. The evolution of shows a steady growth signifying inventions of new opinions coupled with a series of failure interactions until the maxima is reached (see fig 6(a)). From this point onward, the reorganization phase commences and the players encounter mostly successful interaction resulting in the drop of (fig 6(a)). While for the (disconnected network) and (connected network) day consensus is reached fast, for the (connected network) and the (disconnected network) day the system gets arrested in a long plateau indicating the presence of metastability and strong community structures. The growth of also signifies similar pattern, steady rise followed by steady fall and a plateau (signifying a strong community structure) in case of the and day (see fig 6(b)). To explore the flat plateau region further we report and in fig 6(c) and 6(d) respectively. It is interesting to note that both and show a plateau in case of the and day which is a signature of the fact that the games played in the plateau region predominantly produce success with no deletion of opinions leading to the emergence of metastability. It should be remarked here that one can analyze these two metrices and for the NG dynamics to find signatures of community structures across different social networks.
IV.2 Analysis on the time-resolved dataset
In this section, we consider the datasets containing dynamic face-to-face interactions. We play the naming game on these time-varying networks in complete synchronization with the real time i.e., at each time step = 1, 2 . . . , (the elementary unit of time being second) a game is played among those agents that are alive (having degree atleast 1) at that particular instant of time in the network. In other words, at every time step (i.e., one second) one iteration of the game is played choosing a couple according to Strategy II (a random speaker from the active agents and a random hearer among his neighbors). When the system moves from a given network, say at time , to the next one, at , the portion of the old link structure that still prevails at as well as the opinion states of all the agents are retained.
IV.2.1 Results from dataset
In this section, we present the results of the naming game dynamics on the time-resolved day network from the dataset. Note that the results that we present in the following are very robust and perfectly representative of the results that one would obtain in case of the time-resolved data for any other day.
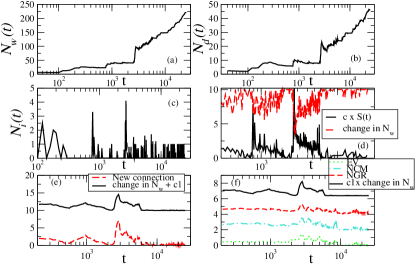
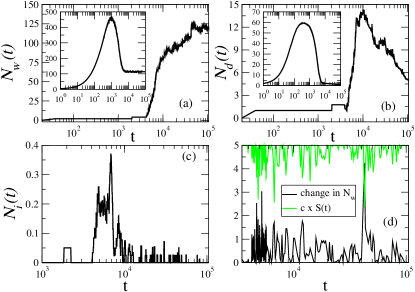
The time evolution of and on the time-varying graph of day 9 (see fig 7(a) and (b)) show a drastically different behavior from the case where these quantities are measured on the static (and composite) counterpart (see fig 6(a) and (b)). The temporal graph shows a slow growth regime followed by a sharp transition, whereas the static counterpart shows steady growth regime followed by a steady fall and finally a long-lasting metastable state (see fig 6(a)). This difference in behavior is due to the fact that in the time-varying case inventions of opinions prevail throughout the dynamics (see fig 7(c)) which prevents the disposal of opinions from the system and hence the memory sizes do not decrease. Further, in fig 7(d) we show how the absolute change in is driven by the success rate; increases with a decrease in while it decreases with an increase in . Fig 7(e) shows the direct dependence of on the number of new connections. Another interesting property which has an impact on the dynamics is the community size. Indeed the variance of the community sizes are in correspondence with (see fig 7(f)). For community analysis, we consider each of the snapshots at 20 seconds interval and apply NGR, NCM and EV individually on these snapshots. Further, we consider only the active nodes (having degree atleast 1) for the purpose of community detection.
Therefore, in a nutshell, the continuous inventions, the influx of new connections (causing more failures) and the fact that the opinions get trapped within local neighborhoods together contribute to the steeply rising memory size over the time evolution of the dynamics.
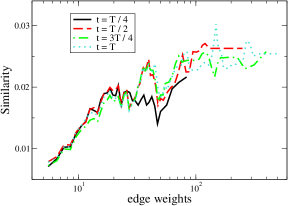
As an additional objective, in fig 8, we show how the frequency of interaction between a pair of individuals predicts the similarity of the opinions among the individuals over different instants of time. We measure the similarity of opinions between a pair of individuals by Jaccard Coefficient (JC) of their inventories. It is formally defined as the size of the intersection divided by the size of the union of the inventories i.e., where is agent’s inventory. From all the graphs, it is evident that there is a trend of having higher similarity in opinions between agents showing higher edge-weights where edge-weight reflects the frequency of interactions between an agent pair till that particular instant of time. Thus, with frequent meetings, individuals tend to share similar opinion. This usually also happens in real-life scenarios where more we meet more is the alignment between us on different opinions.
Control experiments: For the purpose of control experiment, we create simulated versions of the time-varying snapshots of the day network. We randomize the link structure of the empirical real networks at each 20s time interval preserving the average degree of the network. Note that, this method destroys the temporal correlations of successive contact sequences. There have been already some studies as to how to generate synthetic versions of time-varying networks. Starnini et al. rand have put forward three different approaches for synthetic extension of contact sequences preserving certain statistical properties of the real network. The first approach is sequence replication where the contact sequences are extended by repeating them periodically. The second approach is sequence randomization which randomizes the time ordering of the contact sequences. The third approach is statistically extended sequence which generates the sequence by choosing the average number of new connections starting at that time step, randomly from all the conversations. Our method is to some extent similar in spirit to the third approach. We also perform the control experiments preserving the exact degree sequence at each time instant while randomizing the agent ids of the agent who take part in the game at that time instant; nevertheless, the behavior of the observables tend to remain very similar to the previous method (see fig 9 insets). We remark that a detailed analysis of the naming game dynamics on the different variants of synthetic networks is an interesting direction of future research.
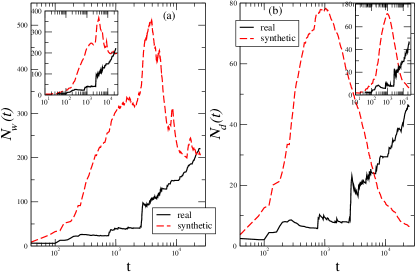
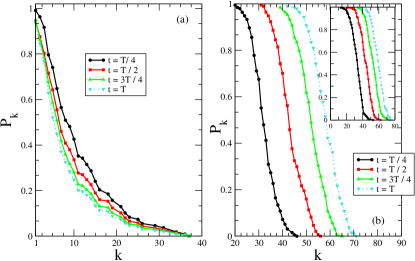
The behavior of the and (see fig 9) are not in the lines of what we observe in the real counterparts. In all the simulated networks, the and behave similarly as in case of static Erdős-Rényi graphs luca . This differences in the NG dynamics is due to the fact that the link structure and the time correlation gets completely lost in synthetic network. This is well supported by the differences in degree distribution at different time instances (, , and ) for the real and synthetic network (see fig 10).
IV.2.2 Results from the dataset
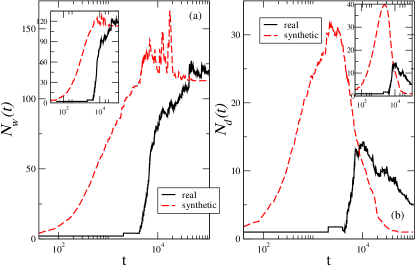
In this section, we consider the second dataset containing dynamic face-to-face interactions among 113 conference attendees. We first study the global behavior of the system through the temporal evolution of three main quantities: the total number N_d(t)$͒, and the rate of success .
The curve corresponding to shows an initial slow growth followed by a sharp transition and finally reaching a steady growth regime (see fig 11(a)). Note that this result is markedly in contrast to what would have been observed if the games were played on the composite network constructed at the end of the conference (see fig 11(a) inset). In fact, this result is in contrast to most of the other results that have been reported in the literature so far indicating that the time-varying nature of the underlying societal structure has a strong impact on the emergent pattern of opinion formation. Similar trends are also observed for - initially a slow growth followed by a sharp transition reaching a peak and finally a steady descent. However, note that the value of does not become one (i.e., convergence criteria is not reached) even after games have been played (see fig 11(b)). This is strikingly in contrast with the case of composite network (see fig 11(b) inset) where becomes one as early as within games.
Initially, as time proceeds, new individuals join the network that increases the number of inventions of new opinions (see fig 11(c)) thus causing a rise in both and . However, later on new inventions stop (fig 11(c)) as the players joining late are less compared to the number that have already joined and are therefore rarely chosen as speakers thus inhibiting new inventions. Hence, is found to drop in the later stage of the dynamics although pointing to a clear existence of multiple opinions. In contrast, doesn’t drop because although new opinions are not formed, old opinions trapped in different groups do not get disposed off the system.
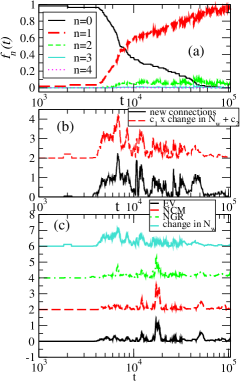
Further, in fig 11(d) we show how the absolute change in is driven by the rate of success of agents; increases with a decrease in while it decreases with an increase in . Finally, an important analysis that is required to complete the picture centers around the precise reason for the steady growth in in the final regime of the dynamics. We attempt to provide a plausible explanation for this through a series of results reported in fig 12.
In fig 12(a), we present the fraction of agents having 0, 1, 2 and more opinions in their inventories. Clearly, with the evolution of system, the fraction of agents with inventory size 0 diminishes; fraction of agents with size 1 increase steadily while that with size 2 is roughly stable; even larger size inventories appear only rarely in the course of the evolution. In addition, we observe that has a direct correspondence with the number of new connections acquired by the network at each time step (see fig 12(b)). These new connections trigger an increase in failure events, thereby increasing ; at the same time success events cannot reduce since in most cases the inventory sizes of the agents are already very low () indicating that most of these success events are actually again “success with no outcome”. This last observation points to the fact that there should be an inherent community structure in the time-varying network and this is made apparent through fig 12(c) where we report the variance of the size of the communities (using three different algorithms as in the previous cases) and show that this is highly correlated to . In summary, the presence of community structure coupled with a continuous influx of new connections (leading to late-stage failures in the system) together lead to the steady growth of in its final regime of evolution.
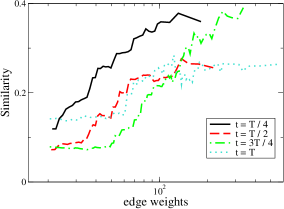
In fig 13, we present mean similarity of opinions among individuals with edge weights at different time instances. In all the instances, there is a positive correlation between similarity of opinions and the frequency of interactions (edge-weights).
Control experiments: For the dataset also, we create synthetic networks using the method outlined previously. We study the two most important observables and by playing naming game on these simulated networks. Both these quantities show a different behavior from their real counterpart. The and in the simulated networks show two distinct two regions - a steady growth and then a fall whereas the curve in the real network show a slow growth zone followed by a sharp transition and finally a zone of steady growth. The simulated networks tend to behave as standard Erdős-Rényi graphs. The difference in the behavior can be precisely attributed to the loss of the link structure and time correlations as in the previous case.
V Conclusions and future work
In this paper, we studied the Naming Game as a model of opinion formation on the time-varying social networks. While considering composite snapshots accumulated over a certain period (e.g., 69 instances of dataset) both the maximum memory () and the time to reach this memory peak () scale as ; however, the time to reach the consensus strongly depends on the presence of community structure (rather than a straight-forward scaling). We also considered the time-evolution of the network in perfect synchronization with the steps of the game (e.g., and dataset) and found that the emergent behavior of the most important observables (i.e., and ) have a nature that is markedly in contrast to what has been reported so far in the literature thus indicating the strong influence of the underlying societal structure on the dynamics of opinion formation. While in case of , we observe that new inventions along with a continuous influx of new agents keeps both and sharply growing, in case of , successful interactions among older agents cause inventions to stop (hence a fall in ) although late-stage failures continue to exist due to influx of new agents thus contributing to a steady growth of in the final phase of the dynamics. The fall of curve is not observed in case of possibly because in this case the games are played over a shorter span of time (1 day) in comparison to where the games are played over 2.5 days so that enough successful interactions could be realized.
There are quite a few interesting directions that can be explored in the future. One such direction could be to incorporate the dominance index of the agents into the model. Not all actors in a society are equally dominant; while some of the actors are more opinionated and dominant the others might be more passive. This characteristic property can be incorporated into the model by ranking those agents that are more successful in their past interactions as more dominant. In this setting, it would be interesting to investigate the scaling relations most naturally under the constraints that the dominant agents are allowed to speak more. Another direction could be to investigate the effect of the flexibility of the agents in adapting to new opinions (traditionally modeled by a system parameter that encodes the probability with which the agents update their inventories in case of successful interactions Baronchelli07 ) when they are embedded on time-varying networks. Finally, a thorough analytical estimate of the important dynamical quantities reported only through empirical evidence here is needed to have a “clear-cut” understanding of the emergent behavior of the system. In fact, there has been some progress already made in this direction in the form of the study that focuses on the consensus of mobile agents using naming game dynamics with local broadcasts mobileNG . Our approach differs with this model in the following way: real world networks are formed by interactions with agents arriving and leaving at different points in time whereas the mobile agents of mobileNG moving on the two-dimensional plane always remain within the system throughout. The networks that are built from these randomly moving agents are very much different from real world networks which show different topological properties that are well distinguished from random networks. Nevertheless, coupling the concept of mobility of agents in the form suggested in mobileNG on top of the time-varying structure presented here can lead to novel and interesting insights and is a part of future investigation.
References
- [1] Andrea Baronchelli, Maddalena Felici, Vittorio Loreto, Emanuele Caglioti, and Luc Steels. Sharp transition towards shared vocabularies in multi-agent systems. Journal of Statistical Mechanics: Theory and Experiment, 2006(06), 2006.
- [2] Andrea Baronchelli, Luca Dall’Asta, Alain Barrat, and Vittorio Loreto. Topology-induced coarsening in language games. Physical Review E, 73(1):015102, 2006.
- [3] Qiming Lu, Gyorgy Korniss, and Boleslaw K. Szymanski. Naming games in two-dimensional and small-world-connected random geometric networks. Physical Review E, 77(1):016111, 2008.
- [4] Luca Dall’Asta, Andrea Baronchelli, Alain Barrat, and Vittorio Loreto. Agreement dynamics on small-world networks. Europhysics Letters, 73(6):969–975, 2006.
- [5] Run-Ran Liu, Chun-Xiao Jia, Han-Xin Yang, and Bing-Hong Wang. Naming game on small-world networks with geographical effects. Physica A: Statistical Mechanics and its Applications, 388(17):3615–3620, 2009.
- [6] Alain Barrat, Andrea Baronchelli, Luca Dall’Asta, and Vittorio Loreto. Agreement dynamics on interaction networks with diverse topologies. Chaos, 17(2):026111, 2007.
- [7] Luca Dall’asta, Andrea Baronchelli, Alain Barrat, and Vittorio Loreto. Nonequilibrium dynamics of language games on complex networks. Physical Review E, 74(3):036105, 2006.
- [8] Luca Dall’Asta and Andrea Baronchelli. Microscopic activity patterns in the naming game. Journal of Physics A: Mathematical and General, 39(48):14851, 2006.
- [9] Han-Xin Yang, Wen-Xu Wang, and Bing-Hong Wang. Asymmetric negotiation in structured language games. Physical Review E, 77(2):027103, 2008.
- [10] Luc Steels. A self-organizing spatial vocabulary. Artificial Life, 2(3):319–332, 1995.
- [11] Luc Steels. Self-organizing vocabularies. In Christopher G. Langton and Katsunori Shimohara, editors, Artificial Life V, pages 179–184, Nara, Japan, 1996.
- [12] Andrea Baronchelli. Role of feedback and broadcasting in the naming game. Physical Review E, 83(4):046103, 2011.
- [13] Robert Axelrod. The dissemination of culture: A model with local convergence and global polarization. Journal of Conflict Resolution, 41(2):203–226, 1997.
- [14] Katarzyna Sznajd-Weron and Jozef Sznajd. Opinion evolution in closed community. International Journal of Modern Physics C, 11:1157, 2000.
- [15] Paul L. Krapivsky. Kinetics of monomer-monomer surface catalytic reactions. Physical Review A, 45(2):1067–1072, 1992.
- [16] Guillaume Deffuant, David Neau, Frederic Amblard, and Gérard Weisbuch. Mixing beliefs among interacting agents. Advances in Complex Systems, 3:87–98, 2001.
- [17] Andrea Baronchelli and Vittorio Loreto. In-depth analysis of the naming game dynamics: The homogeneous mixing case. International Journal of Modern Physics C, 19(5):785–812, 2008.
- [18] Qiming Lu, Gyorgy Korniss, and Boleslaw K. Szymanski. Naming games in spatially-embedded random networks. CoRR, abs/cs/0604075, 2006.
- [19] Hao Jia-Bo, Yang Han-Xin, Liu Run-Ran, Wang Bing-Hong, and Zhang Zhi-Yuan. Effect of geometric distance on agreement dynamics of naming game. Chinese Physics Letters, 27(9):090202, 2010.
- [20] Cecilia Nardini, Balázs Kozma, and Alain Barrat. Who’s talking first? consensus or lack thereof in coevolving opinion formation models. Physical Review Letters, 100(15):158701, 2008.
- [21] Qiming Lu, Gyorgy Korniss, and Boleslaw K. Szymanski. The naming game in social networks: community formation and consensus engineering. Journal of Economic Interaction and Coordination, 4(2):221–235, 2009.
- [22] Lorenzo Isella, Juliette Stehlé, Alain Barrat, Ciro Cattuto, Jean-François Pinton, and Wouter Van den Broeck. What’s in a crowd? analysis of face-to-face behavioral networks. Journal of Theoretical Biology, 271(1):166–180, 2011.
- [23] Animesh Mukherjee, Francesca Tria, Andrea Baronchelli, Andrea Puglisi, and Vittorio Loreto. Aging in language dynamics. PLoS ONE, 6(2), 2011.
- [24] M. E. J. Newman and M. Girvan. Finding and evaluating community structure in networks. Physical Review E, 69(2):026113, 2004.
- [25] Aaron Clauset, Mark E. J. Newman, and Cristopher Moore. Finding community structure in very large networks. Physical Review E, 70(6):066111, 2004.
- [26] Mark E. J. Newman. Finding community structure in networks using the eigenvectors of matrices. Physical Review E, 74(3 Pt 2):036104, 2006.
- [27] Michele Starnini, Andrea Baronchelli, Alain Barrat, and Romualdo Pastor-Satorras. Random walks on temporal networks. Physical Review E, 85:056115, 2012.
- [28] Andrea Baronchelli, Luca Dall’Asta, Alain Barrat, and Vittorio Loreto. Nonequilibrium phase transition in negotiation dynamics. Physical Review E, 76:051102, 2007.
- [29] Andrea Baronchelli and Albert Díaz-Guilera. Consensus in networks of mobile communicating agents. Physical Review E, 85:016113, 2012.