Cycles of the magnetic activity of the Sun and solar-type stars and simulation of their fluxes
E.A. Bruevich a , I.K. Rozgacheva b
Sternberg Astronomical Institute, Moscow, Russia
Moscow State Pedagogical University, Russia
E-mail: ared-field@yandex.ru, brozgacheva@yandex.ru
Abstract. The application of the Wavelet analysis and Fourier analysis to the dataset of variations of radiation fluxes of solar-like stars and the Sun is examined. In case of the Sun the wavelet-analysis helped us to see a set of values of periods of cycles besides ”11-year” cycle: the long-duration cycles of 22-year, 40-50 year and 100-120 year and short-duration cycles of 2-3,5 years and 1,3-year. We present a method of the chromospheric flux simulation using the 13 late-type stars, which have well-determined cyclic flux variations similar to the 11-year solar activity cycle. Our flux prediction is based on the chromospheric calcium emission time series measurements from the Mount Wilson Observatory and comparable solar dataset. We show that solar three - component modeling well explains the stellar chromospheric observations.
KEY WORDS: the Sun, solar-type stars, active areas, cyclic activity, chromospheric emission.
1 . Introduction. The solar-type magnetic activity among the stars
Magnetic activity of the Sun is called the complex of composite electromagnetic and hydrodynamic processes in the solar atmosphere. They create a local active area: plages and spots in the photosphere, calcium flocculi in the chromosphere and prominences in the corona of the Sun. The analysis of active regions is necessary to study the magnetic field of the Sun and the physics of magnetic activity. This task is of fundamental importance for astrophysics of the Sun and the stars. Its applied meaning is connected with the influence of solar flares on the Earth’s magnetic field and the need to solar activity variations and flares forecasts.
It is difficult to predict the the evolution of each active region in details in present time. However, it has long been established that the total change of the active areas is cyclical. The cyclical nature of solar activity allows you to predict the state of the global activity of the Sun.
The duration of the ”eleven-year cycle of solar activity ranged from 7 to 17 years according to 160 years of direct solar observations.
For the first time the quasi-biennial variations of solar activity have been described in the work of the (Vitinsky et al. 1986).
In the recent studies on the subject of quasi-biennial variations of solar radiation (Ivanov-Kholodnyj & Chertoprud 2008; Bruevich & Ivanov-Kholodnyj 2011) the importance of this problem study were emphasized. It turned out that quasi-biennial solar cycles are closely associated with various quasi-biennial processes on the Earth, in particular with quasi-biennial variations of the velocity of the Earth rotation and speed of the stratospheric wind.
The main methods of quasi-biennial solar cycles and the results of their study were more fully described in the monograph (Rivin 1989).
Application of modern mathematical methods (modification of the method of main components, the ”Singular Spectrum Analysis”) for the treatment of long time series of 3032 the monthly averaged values of Wolf numbers gave an opportunity to draw some conclusions about the duration of the cycle and the form of individual quasi-biennial oscillations depending on the duration and power of eleven-year cycle (Khramova et al. 2002).
It was discovered the activity with the cyclicity period of 1,3 years during the last eight of the 11-year cycle. It is best manifested in the phase of maximum of the 11-year cycle and in the early phase of its decline. The axis of the dipole large-scale field at this time is located in the plane of the solar equator (Livshits & Obrydko 2006). These facts show on the independent existence of large-scale magnetic field and its influence on the processes of local magnetic activity.
A comparison of magnetic activity of solar-type stars of different age allows us to check the basic representations of the internal structure and evolution of convective shells of these stars.
Among the hundreds of thousands of stars in the vicinity of the Sun only few thousands fall under the definition of solar-type stars. The relative paucity of such stars is a consequence of their low luminosity. This prevents their detection and observation at a considerable distance from the Sun. Photometric observations of stars with active atmospheres are regularly held in the optical range since the mid of XX century. These observations include the measurement of their radiation in different ranges of the electromagnetic spectrum during the long intervals of time.
In the present work we study the low-amplitude cyclical variability of solar and star’s fluxes, as well as the duration of cycles and their dependence on the physical parameters of the Sun and solar-type stars.
1.1 ”HK-project” of Mount Wilson observatory
One of the first and still the most outstanding program of observations of solar-type stars is the observation programme ”HK-project” of Mount Wilson observatory.
Implementation of this project has led to the discovery of ”11-cycles” activity in solar-type stars. This observation program lasts for more than 40 years.
First O. Wilson began this program in 1965. He attached great importance to the long-standing systematic observations of cycles in the stars (Baliunas et al. 1995; Lockwood et al. 2007).
For this project the stars were carefully chosen according to those physical parameters, which were most close to the Sun: cold, single stars-dwarfs, belonging to the Main sequence. Close binary systems are excluded. All the stars of ”HK-project” almost evenly are distributed on the celestial sphere.
In the framework of the ”HK-project” information about the chromospheric fluxes variations of the Sun was obtained from ground-based observations of the global index of solar activity (the 10,7 cm radio flux) - F10,7, and these observations were subsequently adapted to the same values of star’s fluxes in the chromospheric lines of (396.8nm) and (393.4nm) .
Thus, in our work we use for stars and the Sun S-index (or ) - the relationship of radiation fluxes in the centers of emission lines and (396,8 nm and 393,4 nm) to radiation fluxes in the near-continuum (400,1 and 390,1 nm). This index is a sensitive indicator of the chromospheric activity of the Sun and the stars.
The first results concerning the observations of 91 stars, were published in the (Wilson 1978). Since 1974 the head of the project became A. Vaughan. He constructed a ”HK-spectrometer” of the next generation with the use of more modern technologies and continued observation of several hundred stars. At the same time observations of the same stars with help of the 60-inch telescope took place to determine their periods of rotation.
The results of the joint observations of the radiation fluxes and periods of rotation gave the opportunity for the first time in stellar astrophysics to detect the rotational modulation of the observed fluxes (Noyes et al. 1984). This meant that on the surface of the star there are inhomogeneities those were living and evolving in several periods of rotation of the stars around its axis. In addition, the evolution of the periods of rotation of the stars in time clearly pointed to the fact of existence of the star differential rotations similar to the Sun differential rotations.
Radiation fluxes in the lines of and from the Sun are formed on the upper levels of the solar of chromosphere and they are good indicators of active regions - areas with high magnetic activity.
Because of the remoteness of the stars from us we can’t distinguish the different active regions on their disks. However, the study of the radiation fluxes in the lines of and ., normalized on a nearby continuum, gives us the indirect information about the numbers and sizes of the active regions in the atmospheres of the stars.
To study the cycles of magnetic activity of the atmospheres of the stars we use new dataset of simultaneous observations of variations of the photospheric and chromospheric radiation fluxes of the Sun and of 33 stars of ”HK-project”.
These data were obtained during the last 20 years in Lowell observatory (photometric observations) and during 40 years of observation in chromospheric lines of 111 stars in Smithsonian observatory of Stanford University (Baliunas et al. 1995; Radick et al. 1998; Lockwood et al. 2007).
The authors of ”HK-project” with the help of frequency analysis of the 40-year observations have discovered (Baliunas et al. 1995; Lockwood et al. 2007) the periods of 11-year cyclic activity vary little in size for the same star. So they have determined the resistant variations of chromospheric activity. The durations of cycles vary from 7 to 20 years for different stars. The stars with cycles represent about 30% of the total number of ”HK-project” stars. The determination of quasi-biennial activity of the cyclical nature of the stars by these authors did not take place.
The heterogeneities on the disk of the star, which are responsible for the atmospheric activity outside the flares are spots and plages in the photosphere, flocculi in the chromosphere, prominences and coronal mass ejections in the corona (by analogy with the thoroughly studied formations in the Sun).
For the duration of the existence these active regions vary greatly in time - they can be observed from several hours to several months. The contribution from the active regions should be taken into account in the analysis of observational ”HK-project” data, both as in the lines of H and K, as in photospheric fluxes from the entire disk in broadband filters of photometric system of Lowell observatory, close to the standard UBV - system.
1.2 Cycles of magnetic activity of the Sun
Variations of different indices of solar activity characterize the variation of the radiation fluxes of the solar atmosphere at different altitudes. In the works (Kane 2002; Li & Sofia 2001) was found a strong correlation of the index of EUV (short-wave ultraviolet radiation, satellite observations of AE-E (1977-1980 years), Pioneer Venus (1979-1992 years) and SEM/SOHO (1996-2001 years) with the fluxes in the hydrogen lines , radio fluxes F10,7 and radiation fluxes in the lines of (Beer 2000).
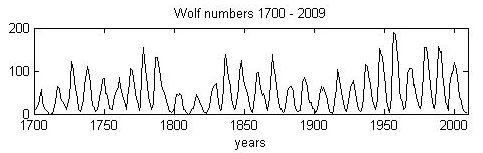
Also, all the indices of solar activity reasonably well correlated with Wolf numbers. In Fig. 1 the annual average variations of Wolf numbers from 1700 to 2005 years are shown. The values of W in the period from 1850 to 2005 years were received as the result of a direct observations of the solar activity with ground-based observatories, and from 1750 to 1850 these values were obtained as a result of indirect estimations.
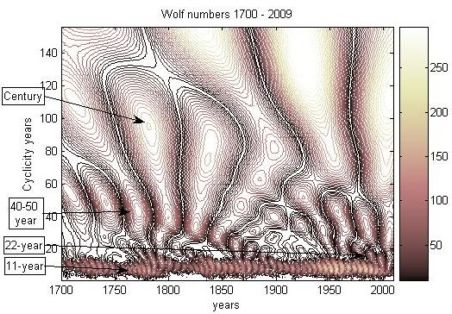
The result of wavelet - analysis (Daubechies wavelet) of series of observations of average annual Wolf numbers (Fig. 2) in the form of many of isolines is shown in Fig. 2. For each isolines the value of the wavelet-coefficients are of the same. The isolines specify the maximum values of wavelet-coefficients, which corresponds to the most likely value of the period of the cycle. There are three well-defined cycles of activity:
- the main cycle of activity is approximately equal to a 10 - 11 years;
- 40-50- year cyclicity;
- 100 to 120-year-old (ancient) cyclicity.
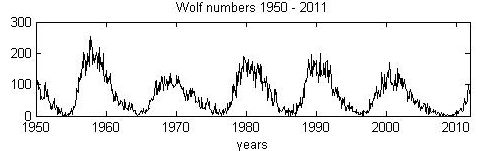
To identify a more short cycles we use the more accurate measurements of Wolf numbers according to observations from 1950 to 2011 years. In Fig. 3 presents monthly averages of Wolf numbers. These values exclude almost rotational modulation of the Sun’s observations, because the rotation period of the Sun on the ”active latitudes” is about 27 days, close to the interval on which performed averaging.
Fourier-analysis of time series of monthly average Wolf numbers can not detect quasi-biennial cycles because of the considerable variation in the duration of quasi-biennial cycles during the ”eleven-year” cycle. Wavelet-analysis gives us that opportunity.
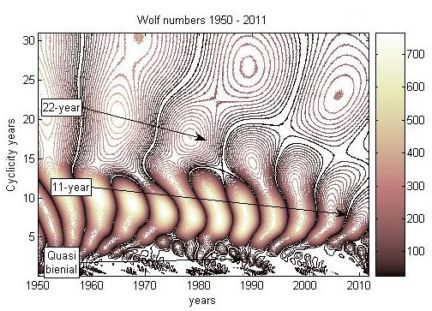
Wavelet-analysis of a number of observations average monthly Wolf numbers with the help of the wavelet Morley (Fig. 4) shows that there is the main cycle of variations is about a 10 - 11 years. We clearly see in Fig. 4 that there are also short cycles: - 5,5- year-old cycles, - quasi-biennial cycles
The values of the duration and amplitude of these short cycles are changing in different intervals of observations. In Fig. 4 shows that the duration of the quasi-biennial cycle is reduced from 3,5 years at the beginning of each ”eleven-year cycle” of up to 2 years at the end of it.
In Fig.5 and Fig.6 we show the results of our wavelet-analysis for the numbers of the Wolf W and fluxes of radio emission F10,7 - the most common indices of solar activity. On the axis of ordinates postponed the duration of the quasi-biennial cycle, the x - axis the time of observation in years.
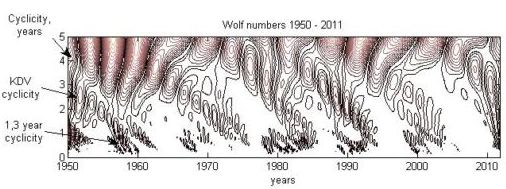
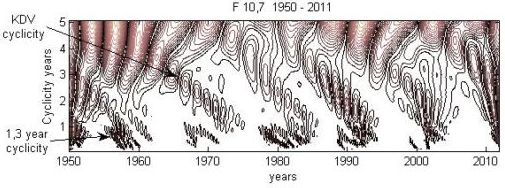
The results of the wavelet-analysis, presented in Fig. 5 and Fig. 6 show that, along with the quasi-biennial cyclicity of solar radiation we can also see and cycles with a period of about 1,3, found earlier in (Livshits & Obrydko 2006)
2. The cyclic activity of solar-type stars on the ”11-year” and quasi-biennial time scales
In the last we can see a large number of works, where low-amplitude variations of the radiation of the stars with active atmospheres are investigated with the help of modern approaches. In the work (Kolah & Olach 2009) were analyzed variations of the radiation of EI Eri - one of the bright solar-type stars. Data of observations were studied with help of Fourier analysis and wavelet-analysis. Variations of the fluxes of radiation of this star are quite stable. Study with help a Fourier analysis or wavelet-analysis gives the similar results: the cycle of variations of the fluxes of radiation is an average of 2,7 years.
| 1 | 2 | 3 | 4 | 5 | 6 | 7 | 8 |
| No | Star | Spectral | , K | , | , | ||
| on the HD | class | (Soon et | (Allen | years | years | years | |
| catalog | al 1996) | 1977) | |||||
| 1 | Sun | G2-G4 | 25 | 5780 | 10,0 | 10,7 | 2,7 |
| 2 | HD1835 | G2,5 | 8 | 5750 | 9,1 | 9,5 | 3,2 |
| 3 | HD3229 | F2 | 4 | 7000 | 4,1 | - | - |
| 4 | HD3651 | K0 | 45 | 4900 | 13,8 | - | - |
| 5 | HD4628 | K4 | 38,5 | 4500 | 8,37 | - | - |
| 6 | HD20630 | G5 | 9,24 | 5520 | 10,2 | - | - |
| 7 | HD26913 | G0 | 7,15 | 6030 | 7,8 | - | - |
| 8 | HD26965 | K1 | 43 | 4850 | 10,1 | - | - |
| 9 | HD32147 | K5 | 48 | 4130 | 12,1 | - | - |
| 10 | HD10476 | K1 | 35 | 5000 | 9,6 | 10 | 2,8 |
| 11 | HD13421 | G0 | 17 | 5920 | - | 10 | - |
| 12 | HD18256 | F6 | 3 | 6450 | 6,8 | 6,7 | 3,2 |
| 13 | HD25998 | F7 | 5 | 6320 | - | 7,1 | - |
| 14 | HD35296 | F8 | 10 | 6200 | - | 10,8 | - |
| 15 | HD39587 | G0 | 14 | 5920 | - | 10,5 | - |
| 16 | HD75332 | F7 | 11 | 6320 | - | 9 | 2,4 |
| 17 | HD76151 | G3 | 15 | 5700 | - | - | |
| 18 | HD76572 | F6 | 4 | 6450 | 7,1 | 8,5 | - |
| 19 | HD78366 | G0 | 10 | 6030 | 10,2 | - | |
| 20 | HD81809 | G2 | 41 | 5780 | 8,2 | 8,5 | 2,0 |
| 21 | HD82885 | G8 | 18 | 5490 | 7,9 | 8,6 | - |
| 22 | HD100180 | F7 | 14 | 6320 | 12 | 8 | - |
| 23 | HD103095 | G8 | 31 | 5490 | 7,3 | 8 | - |
| 24 | HD114710 | F9,5 | 12 | 6000 | 14,5 | 11,5 | 2 |
| 25 | HD115383 | G0 | 12 | 5920 | - | 10,3 | 3,5 |
| 26 | HD115404 | K1 | 18 | 5000 | 12,4 | 11,8 | 2,7 |
| 27 | HD120136 | F7 | 4 | 6320 | 11,6 | 11,3 | 3,3 |
| 28 | HD124570 | F6 | 26 | 6450 | - | - | 2,7 |
| 29 | HD129333 | G0 | 13 | 5920 | - | 9 | 3,2 |
| 30 | HD131156 | G2 | 6 | 5780 | - | 8,5 | 3,8 |
Table 1 and Table 2 present the results of our calculation of the periods of variations of chromospheric radiation of the stars (Bruevich & Kononovich 2011). The method of fast Fourier transform was used to determine periods of the cyclicity of stars.
| 1 | 2 | 3 | 4 | 5 | 6 | 7 | 8 |
| No | Star | Spectral | , K | , | , | ||
| on the HD | class | (Soon et | (Allen | years | years | years | |
| catalog | al 1996) | 1977) | |||||
| 31 | HD143761 | G0 | 17 | 5920 | - | 8,8 | - |
| 32 | HD149661 | K2 | 21 | 4780 | 14,4 | 11,5 | 3,5 |
| 33 | HD152391 | G7 | 11 | 5500 | 10,7 | - | - |
| 34 | HD154417 | F8 | 7,8 | 6100 | 7,4 | - | - |
| 35 | HD155875 | K1 | 30 | 4850 | 5,7 | - | - |
| 36 | HD156026 | K5 | 21 | 4130 | - | 11 | - |
| 37 | HD157856 | F6 | 4 | 6450 | - | 10,9 | 2,6 |
| 38 | HD158614 | G9 | 34 | 5300 | - | 12 | 2,6 |
| 39 | HD160346 | K3 | 37 | 4590 | 7 | 8,1 | 2,3 |
| 40 | HD166620 | K2 | 42 | 4780 | 15,8 | 13,7 | - |
| 41 | HD182572 | G8 | 41 | 5490 | - | 10,5 | 3,1 |
| 42 | HD185144 | K0 | 27 | 5240 | - | 8,5 | 2,6 |
| 43 | HD187681 | F8 | 10 | 6100 | 7,4 | - | - |
| 44 | HD188512 | G8 | 17 | 5490 | - | - | 4,1 |
| 45 | HD190007 | K4 | 29 | 4500 | 10 | 11 | 2,5 |
| 46 | HD190406 | G1 | 14 | 5900 | 8 | - | - |
| 47 | HD201091 | K5 | 35 | 4410 | 13,1 | 3,6 | |
| 48 | HD201092 | K7 | 38 | 4160 | 11,7 | 2,5 | |
| 49 | HD203387 | G8 | 30 | 5490 | - | - | 2,6 |
| 50 | HD206860 | G0 | 9 | 6300 | 6,2 | - | - |
| 51 | HD216385 | F7 | 7 | 6320 | - | 7 | 2,4 |
| 52 | HD219834 | K2 | 43 | 4780 | 10 | 11 | 2,5 |
| 53 | HD224930 | G3 | 33 | 5750 | 10,2 | - | - |
We used data of the observation of (Lockwood et al. 2007) for frequency analysis of time series of S-index of the Sun and 33 of the stars.
In the work (Bruevich and Kononovich 2011) the values of periods of resistant ”11-year” cycles ( - column 7 in Table 1 and Table 2) and periods of quasi-biennial cycles ( - column 8 in Table 1 and Table 2) for the stars from column 2 of Table 1 and Table 2 were determined. A dash in columns 7 and 8 means that the cyclicity was not detected.
Table 1 and Table 2 contain the values of the ”11-year” cycles (column 6), which were determined by authors of the ”HK-project” during the conduct of primary spectral analysis of the data (Baliunas et al. 1995).
Table 1 and Table 2 also show the spectral classes of stars (column 3), their periods of rotation (column 4) and their effective temperatures (column 5).
The data analysis of Table 1 and Table 2 shows that among the stars of the earlier spectral types, and accordingly, faster rotating, the quasi-biennial cycles are found more confident. Note that these cycles we found among the stars, as in the case of existing of ”11-year” cycles, so without them.
3. The cyclic variations of fluxes of radiation from different layers of the solar atmosphere
3.1 Indices of solar activity
The first index, describing the solar activity, was the index of sun spots. At the present time it is called the index of ”Wolf numbers ”. This index of solar activity has the most long-term history of the direct observations. In addition, the rows of Wolf numbers were restored since 1750 according to indirect data, see. Fig. 1. This index characterizes the state of the photosphere of the Sun, so as spots are such heterogeneities of that characterize the active region at the level of photosphere.
Much more objective index of activity of photosphere is the index Total Solar Irradiance (TSI). In addition to the fluxes of photosphere’s radiation (attributable to the visible range of the spectrum) which give the main contribution into the TSI. The fluxes of all the available spectral intervals from x-ray to infrared are summarized in this index.
The most reliable are the data of TSI observations from 1978, with help of the equipment installed on satellites HF, ACRIM-I,II and VIRGO. Creation of the combined database of TSI observations Judith Lean currently coordinates, author of a three-component model of EUV (extreme ultraviolet) radiation of the Sun (Lean et al. 1986).
For monitoring of variations of chromosphere’s radiation of the Sun on the satellites of the NOAA series from 1978 year to the present time the measurements of the (280 nm, core-to wing ratio) index are made. This activity index is very similar to the S-index of solar-type stars, observed in the ”HK-project”, with the difference that in the case of the solar index (280 nm) observations are carried out in the range of radiation, out of reach for the ground-based observatories.
Observations of solar radiation from the top of chromosphere and the bottom of the corona the - index (radio flux at 10,7 cm wavelength) are very important for solar activity study. This activity index has also rather lengthy series of regular direct observations with ground-based observatories (in Ottawa and other) and correlates well with all the rest of the solar indices. Archive data of index are detailed and accessible. In addition, he is sensitive to changes in solar weather, the variation of this index in the cycle of activity make up about 200%, from ( to ) Watt/m2. Therefore, is used for the prognosis and monitoring of the solar activity more often than the other indices.
For observations of coronal activity of the Sun the index of x-ray radiation of 0,1 - 0,8 nm (background of the radiation without flares) is used. This activity index is very variable, even within a small interval of time, because after even small flares the background radiation remains elevated for some time. In a cycle of activity this index varies by two-three orders of magnitude from to Watt/m2.
Also there are another activity indexes associated with the flare activity of the Sun, they are also well correlated with the main solar indices. All activity indexes, characterizing fluxes of radiation from different layers of the solar atmosphere are connected among themselves and are defined ultimately from the major parameter of the activity - activity of the magnetic field.
3.2 Empirical basis for the forecasts of the amplitude of cyclic activity of stars
For the Sun one of the most important tasks is to predict the amplitude of cyclic activity, affecting a number of earth processes. Contribution to the low-amplitude variations of solar radiation occurs from the active processes, simultaneously in the three layers of the atmosphere - photosphere, chromosphere and the corona. It is known that different indices of solar activity are rather closely interrelated. This fact allows us to predict the variation of the solar radiation from different layers, according to the observations of the change in the index of activity from only one layer.
In the present work we use the ideology of the works (Lean et al. 1983; Lean 2001) for the prediction of ”11-year” activity of the stars. We present the full amplitude of the radiation heat flow in the chromosphere’s lines of stars in the form of the composition of three main components of fluxes of radiation, two of which are the constant and inconstant background with the grid of supergranulation, the third is the contribution from the active areas, which smoothly change during the cycle.
For the prediction of the amplitudes of variations of the fluxes of radiation from the stars we chose the values of the fluxes in the lines and of the ”HK-project” stars with the well-identified ”11-year-old” cycles (from 8 to 13 years). It turned out that the cyclical nature of these fluxes is so similar to the solar cycle, that for the forecast of amplitudes of fluxes of radiation from these stars are quite applicable methods used in the practice of solar forecasts (Borovik et al. 1997).
For the successful prediction of variations of the fluxes of radiation from the stars, we should take into account the following characteristics of their ”11-year” activity cycles:
(a) The chromospheric emission lines and , visible on the background of wide and deep profiles of absorption lines contain information about the temperature of the atmosphere. It is established, that the profiles of the lines differ markedly depending on the photospheric substrate (is it the photosphere’s background, or the spot and the plage). The profiles of lines, averaged over the disc of the Sun, depend on the phase of the solar cycle;
(b) According to observations, sun spots are often collected in groups, surrounded by photospheric plages and flocculi fields in chromosphere. The area of spot is in several times less than the total area of the chromospheric flocculi and coronal condensations associated with this spot. The total area of solar spots in the epoch of solar activity maximum occupies an area of 0,5 % of the hemisphere. The total area of the spots in solar-type stars can reach 15 - 20 %;
(c) The surface brightness of the active area increases with its increasing in size and with increase in the number of spots in it. On average, according to measurements at Skylab, (Schriver et al. 1985; Van Driel-Gesztelyi 2006) the surface brightness of active regions is in 3 - 5 times higher than the brightness of the chromospheric net, and a relative increase in luminance (contrast) depends on the wave length;
(d) The variation of shortwave radiation are affected the existence of ”bright spots” - areas of the small bipolar region, in which there are usually 2 - 3 magnetic loops, about 2500 km in diameter and 12,000 km in length (Sheely & Golub 1979). Comparison of x-ray photographs of the Sun, with simultaneous observations in the lines of calcium K and showed that ”the bright x-ray points” localized primarily on the borders of the cells of the chromospheric net and in 83% of cases coincide with prominent elements of the net (Egamberdiev 1983). This testifies to the connection between ”bright x-ray points” and ” bright points” of the net;
(e) Basically, the sources of x-ray radiation of the Sun (in contrast to the ultraviolet radiation) are situated in the coronal loops, which are concentrated in active regions. According to observations of the satellite Skylab in the ultraviolet and x-ray spectral bands all the coronal loops can be grouped into three main groups, (Orral 1981):
the first group are the small arches, coming mainly across the photospheric section of the magnetic polarity, their temperature is about , the concentration of electrons (in the surrounding space );
the second group are the loops which connect the magnetic poles out of the line of section polarities, their temperature of ;
the third group are the cold loops (chromospheric ribbons), which are the bases of the first group, their temperature (these loops are visible in and other chromospheric emission lines).
According to the results of observations of the satellite AE-E Nimbus 7 the three-component model for the prediction of short-wave radiation of the Sun was proposed (Lean et al. 1986). In this model it is assumed that the flux of radiation is defined by three components:
(I) is the constant component - the (BASAL) component, the sources of which are evenly distributed on the solar disk, and do not change in a cycle of activity;
(II) is evenly changing component - the radiation of the ”active” chromospheric net (which are also assumed to be uniformly distributed over the disk, but its occurrence is considered to be caused by the collapse of the Active Regions (AR) and, consequently, its intensity should be proportional to their total areas;
(III) is the rapidly changing component - the intense radiation from the plage areas, coinciding with the active regions.
In accordance with that the flux of radiation is calculated by the formula (Lean et. al 1986):
where is the full flux of chromospheric emission, is the contribution of the constant component (BASAL), is the values of AR contrasts and they are similar to contrasts from (Cook et all., 1980), is the value of ”active network” contrast: they are equal to for continuum and for lines, is part of disk (without AR) that is occupied by the ”active network”.
The second member in the right part of (1) describes emission from all AR on the disk;
are values of their squares, describes the AR position: (where and are the coordinates of AR number ).
describes the relative change of the surface brightness with moving from center to edge of disk.
The relative adding AR contribution to full flux from the different AR is determined by the factor that is linearly changed from the value to depending of the brightness ball of flocculus (according to ball flocculae changes from to ).
So the ”active network” part in all the surface without AR is determined by the AR decay, the next relationship between in time moment and average values in earlier time is right:
where the time-averaging is taken for previous rotation periods, is measured in one million parts of the disk.
Note that:
first, the 27-day variation of the radiation caused by the movement and evolution of active regions;
secondly, the 11-year cyclic changes in the significant contribution to make ”active network”.
4. An empirical model of cyclic variations of the values of fluxes of star’s radiation in the lines of and
From the analysis of long-term variations of the solar streams in the lines of ionized calcium and , it follows that the total fluxes of star’s and Sun’s radiation consist of three main components: From the analysis of long-term variations of the solar streams in the lines of ionized calcium and , it follows that the total fluxes of star’s and Sun’s radiation consist of three main components:
(I) is the constant component, the so-called ”BASAL” in solar physics (below for the stars BASAL = );
(II) is slowly changing in a cycle of activity background, including the constant component , (for chromospheric calcium emission of the stars - );
(III) - active regions on the disk (let’s call this part of the flux of chromospheric radiation of the stars - ).
The total flux is equal to
Between the values of the fluxes of chromospheric radiation for the Sun and the stars and , obviously, there is a close connection that will be used in the future.
According to the data of observations (Lean et al. 1983; Lean 2005), the maximum variation of the background of fluxes of solar radiation in the radio band is about 20%. This agrees well with the model of radiation of the Sun in the line of hydrogen (Borovik et al. 1997), where the maximum amplitude of the background radiation is also the order of 20%.
We introduce the factor of similarity k to forecast of cyclical variations of chromospheric radiation of the stars. It equals to the ratio of maximum amplitudes of the background radiation to the maximum amplitude of the flux of star’s radiation in a cycle of activity:
In accordance with this, each value set in compliance the value . Here the value was obtained from observation data and was presented for the 13 stars with well-determined cycles of chromospheric activity (star’s group ”EXCELLENT”) and the Sun.
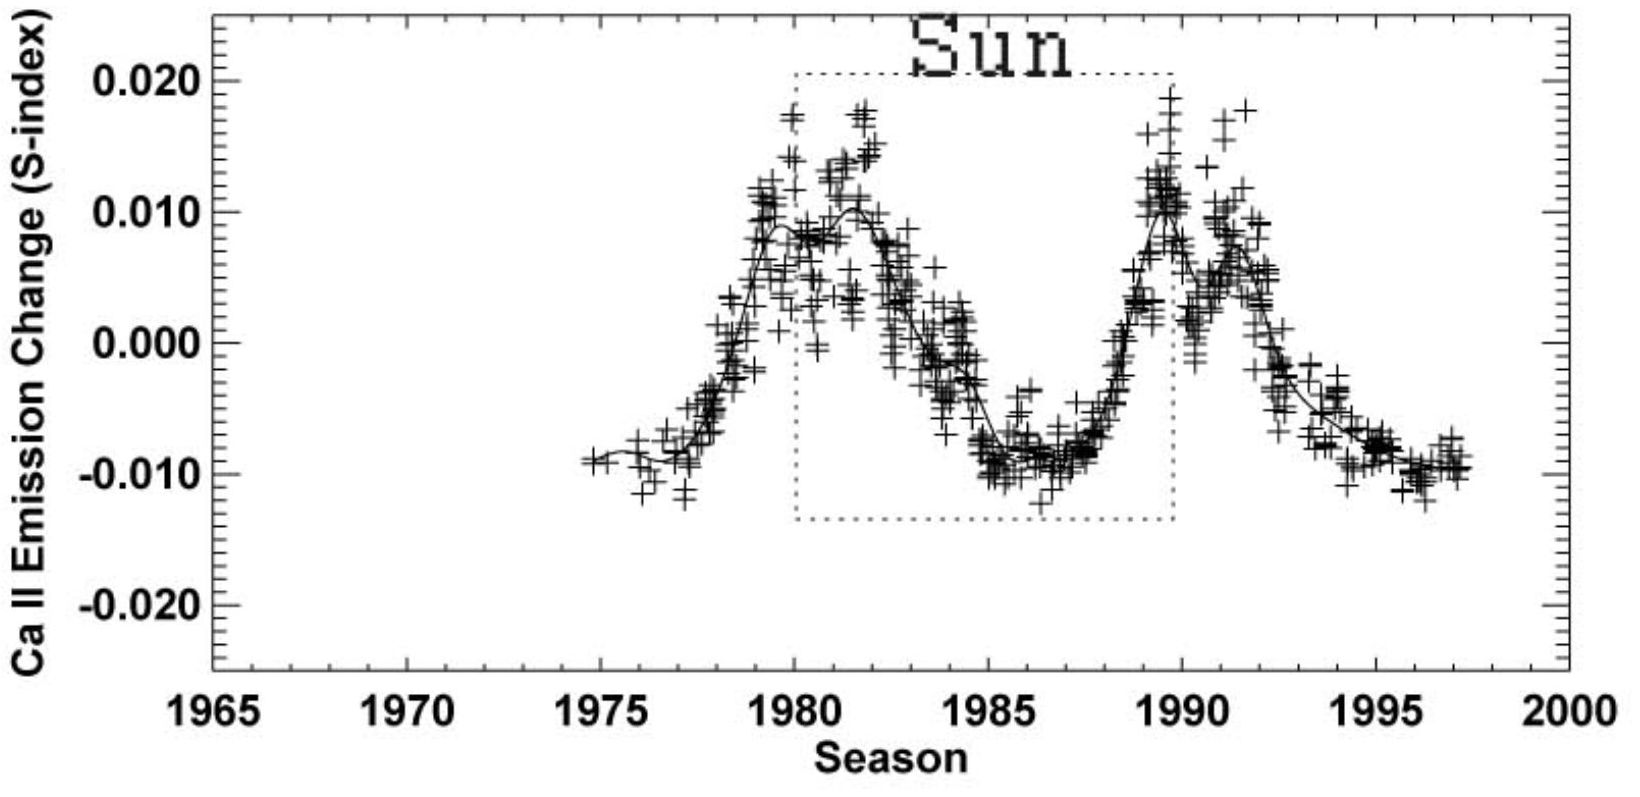
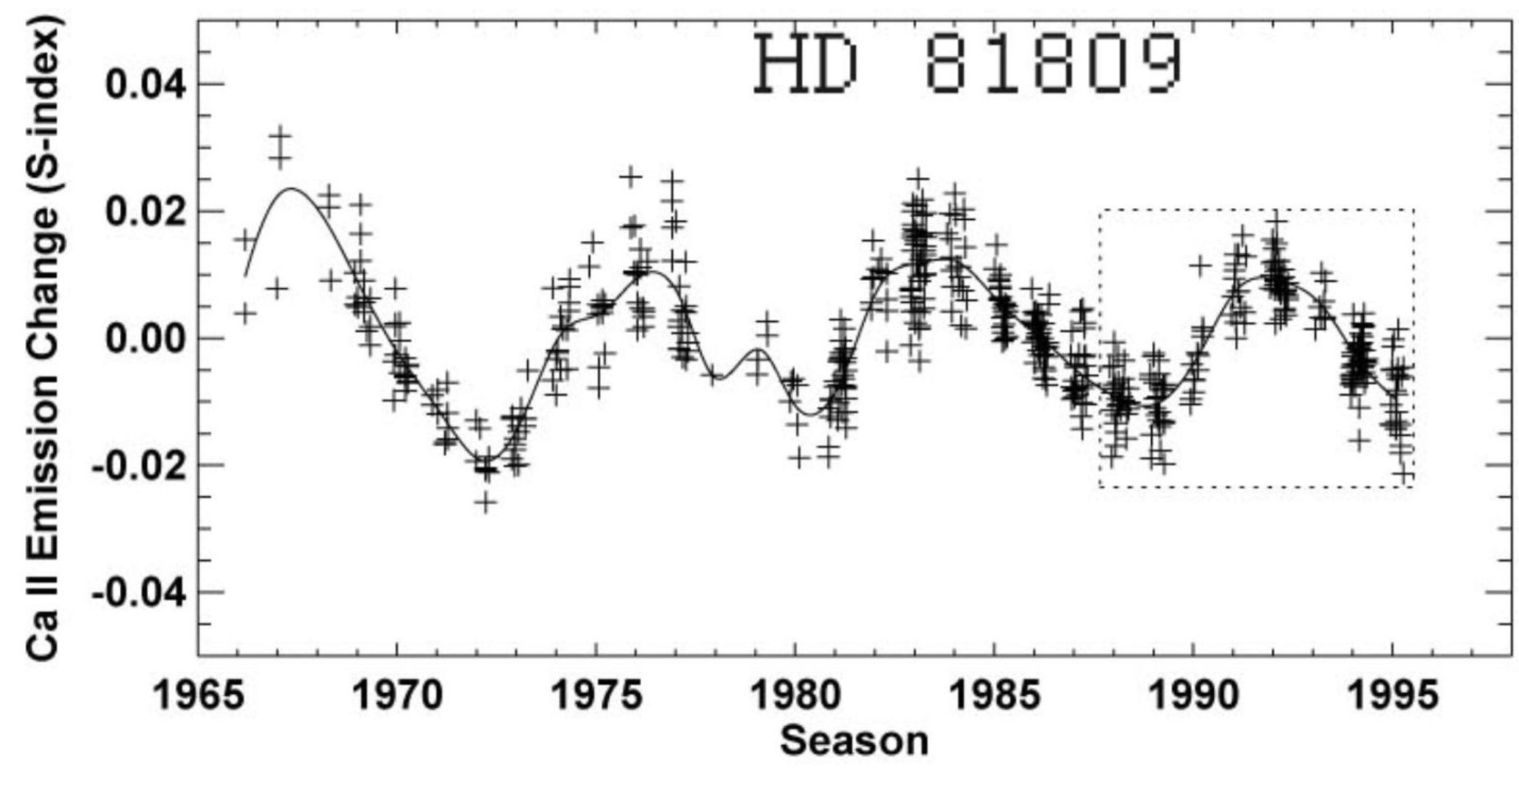
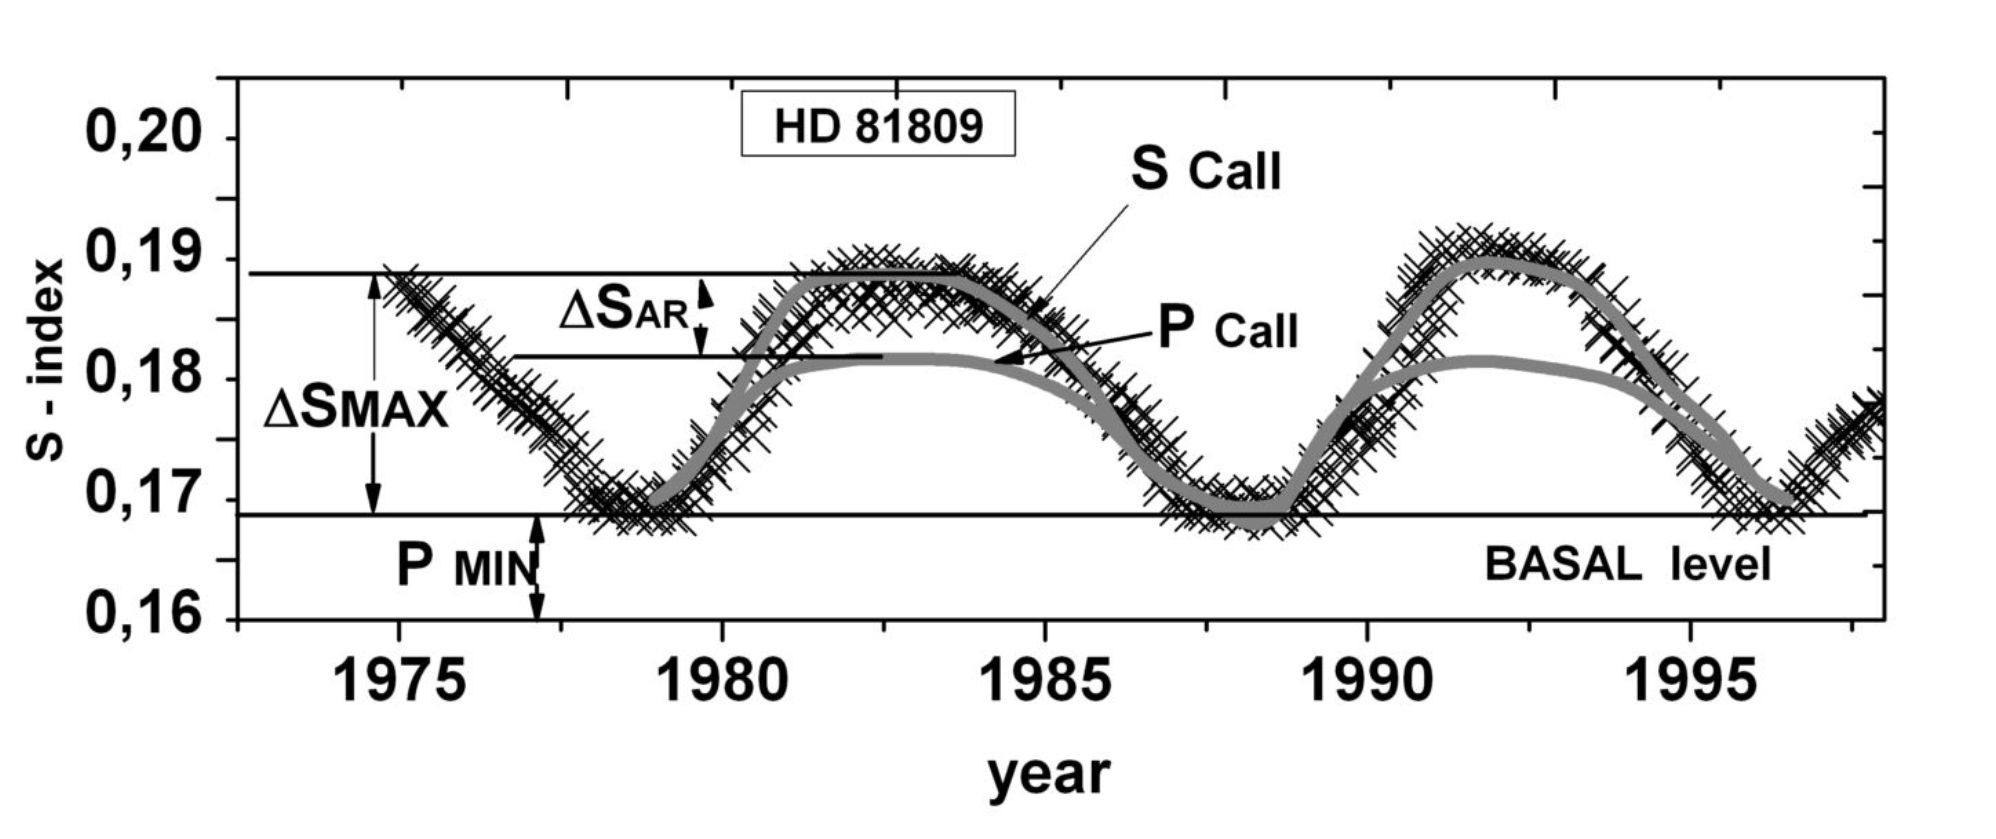
In Fig. 7 and Fig. 8 we present the smoothed curves of variations of the fluxes for the Sun and for one of the studied here stars - the star HD 81809, belonging to the group of ”EXCELLENT” class.
From the observational data of chromospheric radiation (Radick et al. 1998) and knowing the values of the periods of cycles (see Table 2) for all 13 of the stars of the group of ”EXCELLENT” (see for example the data for the HD 81809 star in Figure 8) we can define individual values of the flux of the radiation (with fairly good accuracy, determined by the quality of observations).
Further, with a coefficient of similarity we can estimate these values .
Then for each star we compute the coefficients and of the regression equation (which will be further used for the forecasts of the required moment of time in the future):
Then when predicting the variations of the chromospheric fluxes for the 13 stars (Table 3), we apply the same approach as that used in the work (Bocharova & Nusinov 1983) for the prediction of the solar background radiation in the ”11-year” cycle. Modifying the formula of (Bocharova & Nusinov 1983), we obtain the following expression for the analytical approximation of the values for the background radiation of the stars (Bruevich 1999):
where is the minimum value of the background flow (BASAL), corresponding to the lowest value of the flux of radiation of the stars during the cycles of chromospheric activity and is determined from observations (on Fig. 9 and Fig. 10 the level of BASAL is shown with help of the solid line), - the period of the cycle chromospheric activity.
| Object | B - V | , | a | b | |||
|---|---|---|---|---|---|---|---|
| year | |||||||
| Sun | 0.66 | 10 | 0.162 | 1.19 | -0.031 | 23.4 | 3.4 |
| HD 81809 | 0.64 | 8.2 | 0.155 | 1.13 | -0.020 | 22.6 | 2.6 |
| HD 152391 | 0.76 | 10.9 | 0.32 | 1.56 | -0.180 | 31.6 | 11.3 |
| HD 103095 | 0.75 | 7.3 | 0.17 | 1.23 | -0.040 | 24.7 | 4.7 |
| HD 184144 | 0.80 | 7.0 | 0.19 | 1.45 | -0.085 | 28.9 | 8.9 |
| HD 26965 | 0.82 | 10.1 | 0.18 | 1.39 | -0.07 | 27.8 | 7.8 |
| HD 10476 | 0.84 | 9.4 | 0.17 | 1.61 | -0.104 | 32.4 | 12.3 |
| HD 166620 | 0.87 | 15.8 | 0.175 | 1.43 | -0.075 | 28.6 | 8.6 |
| HD 160346 | 0.96 | 7.0 | 0.24 | 1.88 | -0.21 | 37.5 | 17.5 |
| HD 4628 | 0.88 | 8.4 | 0.19 | 1.96 | -0.183 | 39.4 | 19.4 |
| HD 16160 | 0.98 | 13.2 | 0.19 | 1.61 | -0.116 | 32.6 | 12.6 |
| HD 219834B | 0.91 | 10.0 | 0.17 | 1.92 | -0.157 | 38.2 | 18.2 |
| HD 201091 | 1.18 | 7.3 | 0.51 | 1.85 | -0.434 | 37.2 | 17.2 |
| HD 32147 | 1.06 | 11.1 | 0.22 | 1.67 | -0.147 | 45.4 | 25.4 |
For the stars can vary from 6 to 23 years, according to data(Baliunas et al. 1995). However, for stars of the group ”EXCELLENT” this value varies in a narrow framework and is closed to the solar period in 11 years. The variable is the current time from the beginning of the cycle, expressed as a fraction of cycle (for example,).
Simulated flux for solar-type stars we can calculate from the regression equation (5), using values and , as well as having calculated in advance the value with help of the formula (6).
In the Table 3 we show the results of our calculation of the coefficients and for 13 stars, having a well-determined long-term cyclical variability of their fluxes .
Also we presented the values of relative maximum variation of fluxes in a cycle of activity, as a total fluxes , as well as of that part of the fluxes, which is responsible only for the contribution to the radiation from active regions on the disk .
In Table 3 we present also the relative full flux variation in activity cycle maximum: () and relative AR adding flux in activity cycle maximum: (). The value - that is equal to BASAL emission for different we can determine from (Baliunas et al/ 1995) data, see Fig. 9 and Fig. 10.
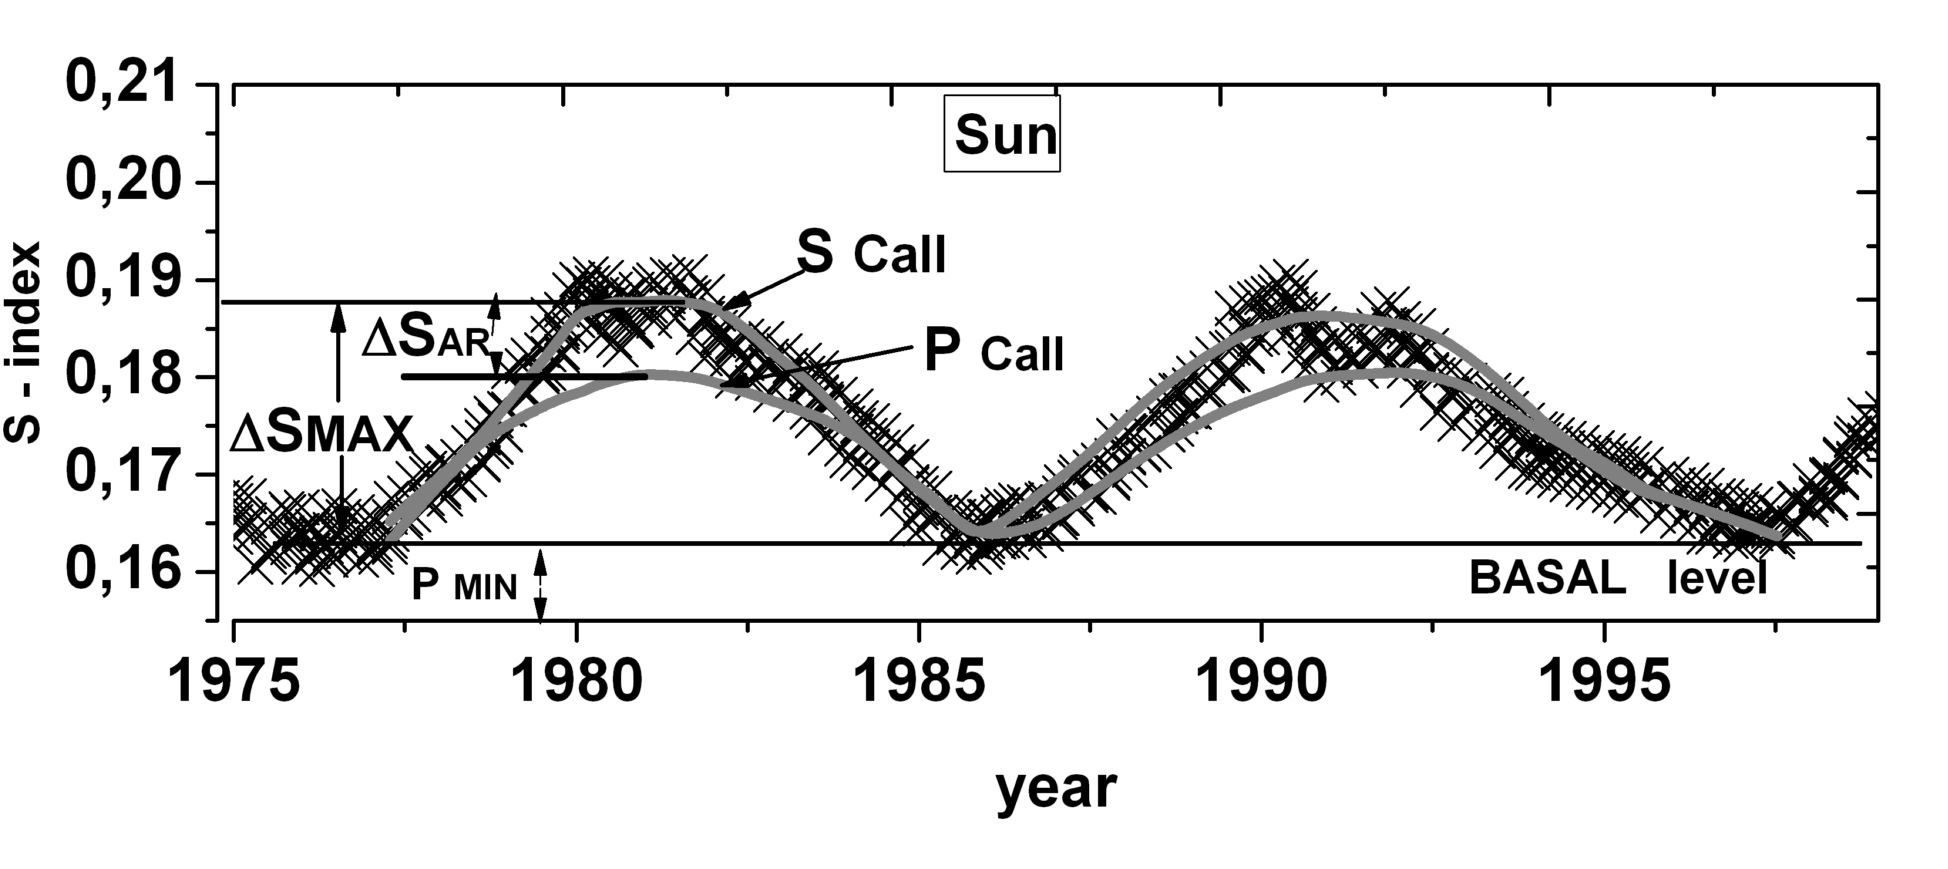
In Table 3 and at Fig. 9 and Fig. 10 we use the following notations:
- the constant component of the radiation of the stars - (BASAL), - the background radiation, changing in a cycle of activity, - the complete flux of radiation , - the maximum amplitude of the variations of radiation in a cycle of activity - the contribution to the total flux of the active regions.
Thus, the procedure of the forecast of model curves of cyclic variations of fluxes of chromospheric radiation of stars in the 11-year time scale consists of the following:
1. For the prediction of the radiation intensity of use data from Table 2 (take the value for the selected stars from column 5). In Fig. 9 and Fig. 10 - the level of BASAL=.
2. From Fig. 10 (star HD 81809) and from (Lockwood et al. 2007) for the stars of the group ”EXCELLENT” we define the moment of the beginning of the chromospheric cycle and for the selected us time of the forecasting flux.
3. Then using equation (6) calculate the value for the moment .
4. Using equation (5) we calculate the forecasting flux for the moment .
5. Conclusions
The large amount of data of regular observation of solar radiation in different spectral ranges does preferred for us the conduct of wavelet-analysis to study the cycles of magnetic activity of the Sun.
The wavelet-analysis helped us to see a set of values of periods of cycles besides 11-year cycle:
- long duration cycles at 22-year, 40-50 year and 100-120 year time scales;
- short duration cycles at quasi-biennial and 1,3-year time scales.
Unfortunately in case of stars we have time series of observations in one - two spectral ranges which are less informative and short in time. This often forcing us to be limited to Fourier analysis in the study of cyclic recurrence of radiation from stars.
When we analyze results of our predictions (in Table 3 we presented the observed values that we’re discussed in this issue and our estimations as and ) some conclusions can be made:
- we can see from the last column of Table 3 that, among the stars of the group ”EXCELLENT” of spectral class K (with the best quality of cyclicity) the active regions may provide the excess above the background flux (consisting of constant for each star BASAL-radiation and of radiation from changing the brightness during the cycle of chromospheric network) in the maximum of the cycle of up to 10-20%;
- the most bright flocculi, which are in 2 times brighter than the unperturbed of chromosphere (cell centers of chromospheric network) should occupy the area of 5 - 10% of the surface of the star;
- in case of the young stars of spectral classes K and M without cycles this value (area that bright flocculi should occupy) is much larger (up to 50%), and for the stars of spectral type G with the well determined cycles of activity, much less (1-3 %). For the Sun this value is only 0,1 %.
References
1. Baliunas, S.L., Donahue, R.A., et al. (1995) Astrophys. J., 438, 269.
2. Beer J., (2000), Space Sci. Rev., 94, 53.
3. Borovik, V.N., Livshitz, M.A., Medar, V.G. (1997) Astronomy Reports, 41, N6, 836.
4. Bruevich, E.A., Kononovich E.V. (2011) Moscow University Physics Bull., 66, N1, 72; ArXiv e-prints, (arXiv:1102.3976v1)
5. Bruevich, E.A., Ivanov-Kholodnyj G.S. (2011) ArXiv e-prints, (arXiv:1108.5432v1).
6. Bruevich, E.A. (1999) Mosc. Univ. Phys. Bull., Ser. 3, No6, 48.
7. Cook, J.W., Brueckner, G.E., Van Hoosier, M.E., (1980) J.Geophys.Res., A85, N5, 2257.
8. Van Driel-Gesztelyi, L. (2006) in: V. Bothmer, A.A. Hady(eds.), Solar Activity and its Magnetic Origin, IAUS 233, 205.
9. Egamberdiev, S. A. 1983, Soviet Astronomy Letters, 9, 385.
10. Ivanov-Kholodnyj, G.S. & Chertoprud, V.E., (2008) Sol.-Zemn. Fiz., 2, 291.
11. Khramova, M.N., Kononovich, E.V. & Krasotkin, S.A., (2002) Astron. Vestn., 36, 548.
12. Kollath, Z., Olah, K. (2009) Astron. and Astrophys, 501, 695.
13. Lean J.L., Scumanich A., (1983) J. Geophys. Res., A88, N7, 5751.
14. Lishits, I.M., Obridko, V.N., (2006) Astronomy Reports, 83, N 11, 1031.
15. Lockwood, G.W., Skif, B.A., Radick R.R., Baliunas, S.L., Donahue, R.A. and Soon W., (2007) Astrophysical Journal Suppl., 171, 260.
16. Noyes, R. W.; Hartmann, L. W.; Baliunas, S. L.; Duncan, D. K.; Vaughan, A. H., (1984) Astrophys. J., 279, 763.
17. National Geophysical Data Center Solar and Terrestrial Physics,
http://www.ngdc.noaa.gov/stp/solar/sgd.html
18. Orral, F.Q. (1981) Space Sci. Rev., 28, N4, 423.
19. Radick, R.R., Lockwood, G.W., Skiff, B.A., Baliunas, S.L. (1998) Astrophys. J. Suppl. Ser., 118, 239.
20. Rivin, Yu. R., (1989) The cycles of The Earth and the Sun, Moscow, Nauka.
21. Schriver, C.J., Zwaan, C., Maxon, C.W., and Noyes, R.W., (1985). Astron. and Astrophys., 149, N1, 123.
22. Sheely, N.R., Jr. Golub, L., (1979) Solar Phys., 63, N1, 119.
23. Vernazza, J.E., Avrett, E.H., Loeser, R., (1981) Astrophys. J.Suppl.Ser., 45, N4, 635.
24. Vitinsky, Yu.I., Kopecky, M., Kuklin, G.B. (1986) The statistics of the spot generating activity of the Sun, Moscow, Nauka.
25. Wilson, O.C., (1978). Astrophysical J., 226, 379.