2 European Space Astronomy Center of ESA, Apartado 50727, 28080 Madrid, Spain
3 Instituto de Fisica de Cantabria (CSIC-UC), 39005 Santander, Spain
4 Istituto di Astrofisica Spaziale e Fisica Cosmica (IASF-INAF), via del Fosso del Cavaliere 100, 00133 Roma, Italy
The X-ray spectrum of NGC 3147. Further insights on the best “true” Seyfert 2 galaxy candidate
Abstract
Context. NGC 3147 is so far the most convincing case of a “true” Seyfert 2 galaxy, i.e. a source genuinely lacking the Broad Line Regions.
Aims. We obtained a observation with the double aim to study in more detail the iron line complex, and to check the Compton-thick hypothesis for the lack of observed optical broad lines.
Methods. The XIS and HXD/PIN spectra of the source were analysed in detail.
Results. The line complex is composed of at least two unresolved lines, one at about 6.45 keV and the other one at about 7 keV, most likely identified with Fe XVII/XIX, the former, and Fe XXVI, the latter. The high-ionization line can originate either in a photoionized matter or in an optically thin thermal plasma. In the latter case, an unusually high temperature is implied. In the photoionized model case, the large equivalent width can be explained either by an extreme iron overabundance or by assuming that the source is Compton-thick. In the Compton-thick hypothesis, however, the emission above 2 keV is mostly due to a highly ionized reflector, contrary to what is usually found in Compton-thick Seyfert 2s, where reflection from low ionized matter dominates. Moreover, the source flux varied between the XMM- and the observations, taken 3.5 years apart, confirming previous findings and indicating that the size of the emitting region must be smaller than a parsec. The hard X-ray spectrum is also inconclusive on the Compton-thick hypothesis. Weighting the various arguments, a “true” Seyfert 2 nature of NGC 3147 seems to be still the most likely explanation, even if the “highly ionized reflector” Compton-thick hypothesis cannot at present be formally rejected.
Key Words.:
Galaxies: active – X-rays: galaxies – Galaxies: Seyfert – Galaxies: individual: NGC 31471 Introduction
NGC 3147 (=0.009346) is at present the most convincing example of a “true” Seyfert 2 galaxy (Bianchi et al. 2008; Shi et al. 2010; Tran et al. 2011). In such sources the lack of detection of broad emission lines in the optical/UV spectra cannot be explained by the obscuration of the Broad Line Regions (BLR) - as it is the case for “normal” Seyfert 2s in the so far very successful Unification models (Antonucci 1993) - but requires their absence.
In fact, simultaneous X-ray and optical spectroscopy have demonstrated that in this source the BLR is lacking at the same time when the nucleus is seen unobscured (Bianchi et al. 2008). The X-ray XMM- observation, albeit rather short (less than 20 ks), was good enough to put a tight constraint on the column density of any obscuring material along the line-of-sight. The same observation also indicated complex iron line emission, but the short exposure time did not permit a detailed analysis.
It has been suggested (Nicastro 2000; Nicastro et al. 2003; Elitzur & Shlosman 2006) that at low accretion rates (and thence low luminosities) the broad line regions (BLR) cannot form. Indeed, NGC 3147 is a low (even if not extremely so) luminosity source accreting at a low rate (bolometric luminosity erg s-1, , Bianchi et al. 2008).
A possible alternative explanation for the peculiar characteristics of NGC 3147 is that the source is Compton-thick. In fact, the simultaneous lack of BLR and absorption can be explained if the absorber is so thick to completely obscure the nuclear emission below 10 keV. In this case, the observed emission should be due to reflection off circumnuclear matter, but X-rays could pierce through the absorbers above 10 keV. The hard X-ray coverage offered by is the best tool at present to test it.
With the dual goal of studying in more detail the iron line emission and to check the Compton-thick explanation for this source, we asked for, and obtained, a long (150 ks) observation.
The paper is organized as follows. The observation and data reduction are described in Sec. 2, while the data analysis is presented in Sec. 3. Results are discussed and summarized in Sec. 4.

2 Observation and data reduction
NGC 3147 was observed by Suzaku on 2010, May 24, for 150 ks (obsid 705054010). X-ray Imaging Spectrometer (XIS) and Hard X-ray Detector (HXD) event files were reprocessed with the latest calibration files available (2011-06-30 release), using ftools 6.11 and Suzaku software Version 18, adopting standard filtering procedures. Source and background spectra for all the three XIS detectors were extracted from circular regions with radius of 167 pixels ( arcsec), avoiding the calibration sources. Response matrices and ancillary response files were generated using xisrmfgen and xissimarfgen. We downloaded the “tuned” non-X-ray background (NXB) files for our HXD/PIN data provided by the HXD team111see ftp://legacy.gsfc.nasa.gov/suzaku/data/background/pinnxb_ver2.0_tuned/ and extracted source and background spectra using the same good time intervals. The PIN spectrum was then corrected for dead time, and the exposure time of the background spectrum was increased by a factor of 10, as required. Finally, the contribution from the cosmic X-ray background (CXB) was subtracted from the source spectrum, simulating it as suggested by the HXD team.
The XIS spectra were fitted between 0.5 and 10 keV. The normalizations of XIS1 and XIS3 with respect to XIS0 were left free in the fits, and always resulted in agreement to within 3%. A constant factor of 1.16 was used instead between the PIN and the XIS0, as recommended for observations taken in the XIS nominal position. In the following, all the PIN fluxes are given with respect to the XIS0 flux scale, which is 1.16 times lower than the HXD absolute flux scale.
In the following, quoted statistical errors correspond to the 90% confidence level for one interesting parameter (), unless otherwise stated. The adopted cosmological parameters are H km s-1 Mpc-1, , and (i.e., the default ones in xspec 12.7.0: Arnaud 1996). We use the Anders & Grevesse (1989) chemical abundances and the photoelectric absorption cross-sections by Balucinska-Church & McCammon (1992).
3 Data analysis and results
The light curve is shown in Fig 1. No significant variability is detected. For the spectral analysis, therefore, we used spectra integrated over the whole observation.
3.1 The XIS spectra
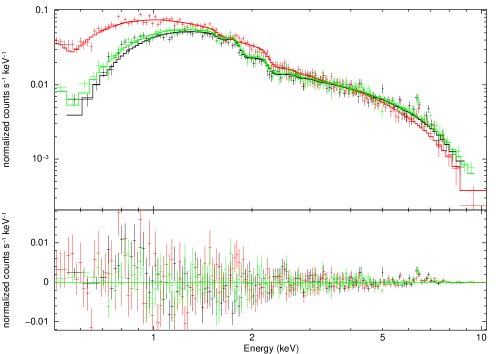
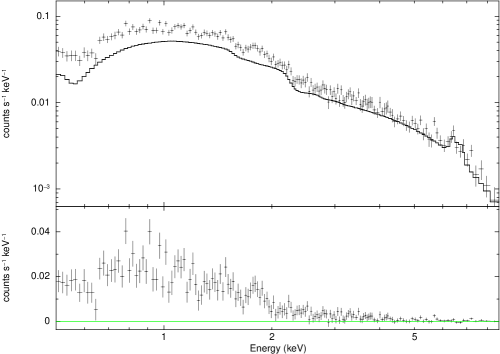
We first analyzed the XIS spectra. A simple power law model (plus Galactic absorption, NH,G=3.64 cm-2, Dickey & Lockman 1990) gives a poor fit (=604.1/482). The most prominent features in the residuals are apparent at the energies of the iron line complex (see Fig. 2). We therefore added two narrow emission lines, with energies free to vary around 6.4 and 7 keV (see next section), which improves significantly the quality of the fit (=496.4/478). The power law index is 1.745. The inclusion of either a warm absorber or a Compton reflection component is not required by the data (=-2.4 and -2.8, respectively), while addition of a second power law improves the fit quality (=481.3/476; the improvement is significant at the 99.94% confidence level, according to the F-test). The power law indices are 3.50() and 1.689(). The 0.5-2 (2-10) keV flux is 8.3910-13 (1.6410-12) erg cm-2 s-1, corresponding to a (absorption corrected) luminosity of 1.81041 (3.21041) erg s-1.
Finally, no intrinsic absorption is detected. The upper limit to the column density of any neutral absorber at the redshift of the source is 5 cm-2.
3.1.1 Comparison with the XMM- results
We then compared the spectrum with the XMM- one (Bianchi et al. 2008). XMM- observed NGC 3147 on 2006, October 6 (i.e. about three and half year earlier), with a net exposure time of 14 ks in the EPIC-pn instrument. We re-extracted the spectrum with the same procedure described in Bianchi et al. (2008), but using the latest version of SAS (11.0.1) and of the calibration files.
According to Bianchi et al. (2008), we fitted the spectrum with a power law absorbed by both Galactic and intrinsic matter, and two narrow guassian lines. The fit is good (=93.6/106). The power law index is 1.620.05, the column density of the local absorber is 3.2 cm-2, the energies of the two lines are 6.471() keV and 6.798() keV and their fluxes are 2.8(1.6) ph cm-2 s-1 (EW of 189 eV) and 2.4(1.5) ph cm-2 s-1 (EW of 172 eV), respectively. All these values are consistent within the errors with those of Bianchi et al. (2008). The 0.5-2 (2-10) keV flux is 5.7810-13 (1.4310-12) erg cm-2 s-1.
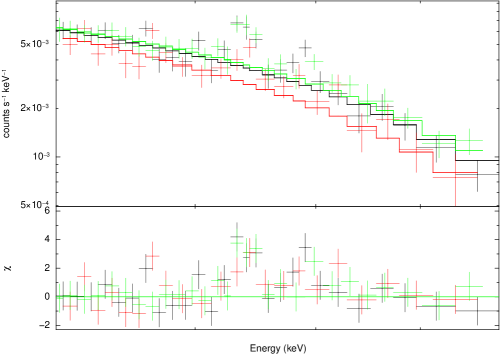
Comparing the XMM- and results, a variation, most prominent in the soft band, is found. This is shown in Fig 3, where the XMM- best fit model is superposed to the Suzaku/XIS1 spectrum. The variation can be explained either as a steepening of the power law component or, better, with different variations of the soft and hard X-ray component, the former varying most. An explanation purely in terms of a variation of the local absorber is, instead, not viable.
This result confirms that the source is variable on time scales of years. In fact, the measured 2-10 keV flux, in units of 10-12 erg cm-2 s-1, has been measured as 1.6 in September 1993 (with ASCA: Ptak et al. 1996), 2.3 in November 1997 (with BeppoSAX: Dadina 2007) and 3.7 in September 2001 (with Chandra: Terashima & Wilson 2003). That the variation cannot be due to a confusing source is demostrated by the fact that the highest flux has been measured by the best spatial resolution satellite.
3.2 The iron line complex
We then studied in more detail the iron line complex. While the iron line properties in the XMM- and observations are roughly consistent, the much better statistics in the observation due to the longer exposure time allows for a more detailed analysis. To this end, we limited for simplicity the analysis to the XIS instruments, and the energy range to the 4-10 keV band. In Fig. 4, the data and best fit model are shown, after removal of any emission line from the fit. The presence of two emission lines is clear, one around 6.4 keV, to be attributed to K emission from neutral or low ionization iron, the other around 7 keV, likely due to either (or both) hydrogen-like (i.e. Fe XXVI) iron emission or K emission from low ionization iron. We therefore fitted the spectrum with a model composed by a single power law plus three narrow (=0) emission lines, with rest-frame energies fixed at 6.4 keV (neutral iron, K), 6.96 keV (hydrogen-like iron, K), and 7.06 keV (neutral iron, K). The fit is good (=116.2/120), but some wiggles are apparent in the residuals around the K neutral iron line. Letting the energy of that line free to vary, a significantly better fit is found (=99.5/119), with a line energy of about 6.45 keV. No improvement, instead, is found letting the width of that line free to vary (63 eV), nor including the He-like iron line (upper limit to the flux of 5.5 ph cm-2 s-1, corresponding to an equivalent width of 35 eV). Not surprisingly, given the narrowness of the line, no improvement is found with a relativistic profile (diskline model), and the inner disc radius is very large (hundreds of gravitational radii). Even in the relativistic line model, an intrinsic line energy at 6.45 keV is strongly preferred by the fit.
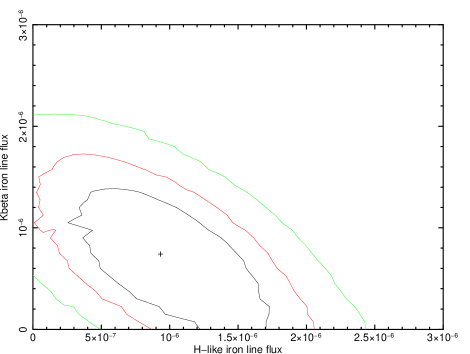
The results are summarized in Table 1. The line fluxes are consistent within the errors to those derived from the XMM- spectra. While the hydrogen-like line is only marginally detected and the K line is formally an upper limit, this of course does not mean that there is no significant line emission at that energy, but simply that the quality of the data is not good enough to accurately determine the parameters of the lines simultaneously. This is best seen in Fig. 5, where the contour plot of the fluxes of the two lines is shown: a simultaneous lack of emission for the two lines is in fact not allowed.
3.2.1 The low ionization iron line
The rest-frame energy of the low ionization K iron line is significantly larger than (and not consistent with) 6.4 keV, the energy for neutral iron. We are not aware of any major problem in the energy calibration of the XIS detectors and indeed, fitting the Mn K doublet and the K in the calibration spectra, we found energies consistent with the intrinsic ones. Letting the energy of the line free to vary independently in the three XISs, similar values are found. We therefore conclude that the iron is truly ionized.
According to House (1967), the best-fit energy corresponds to Fe XVII/XIX, where iron emission should be suppressed by resonant trapping (Ross & Fabian 1993, Matt et al. 1993, 1996). To avoid this effect, the matter should be very optically thin, which is ruled out by the large EW (almost 200 eV), or very turbulent, so reducing the effective optical depth at the line core. Recent and more refined calculations by Garcia et al. (2011), however, show that suppression is not so efficient and that significant emission from the abovementioned ions is possible. In this case, we do not expect any K line emission, because for those ions the M shell is no longer populated, and therefore the line emission at about 7 keV should be entirely due to the hydrogen-like iron line.
3.2.2 The high ionization iron line
Setting the K line to zero, the H-like line flux is 1.44(0.59)10-6 ph cm-2 s-1 (see also Fig. 5), with an equivalent width of about 100 eV222Again, assuming a relativistic profile a fit as good as the one with a gaussian line is obtained, but with a very large inner radius., and =101.5/120. An upper limit of 35:100 to the ratio between helium- and hydrogen-like lines (as derived from the respective fluxes) implies high values of the ionization parameter, such that the EW of the hydrogen line should be, for a solar iron abundance, only a few eV with respect to the total continuum (Bianchi & Matt 2002). The required factor of (at least) 10-20 iron overabundance is rather extreme, even if not fully inconsistent with the EW of the low ionization line (which is a factor 2-3 larger than expected for solar abundances, in agreement with the calculations of Matt et al. 1997 for optically thick matter with a similar iron overabundance).
On the other hand, such large equivalent widths could be explained if the source is Compton-thick and the observed emission comes from reflection in two physically distinct mirrors, one at low and the other at high ionization, and no direct emission. To test this hypothesis, we fitted the spectrum with a power law (representing reflection from highly ionized matter), a Compton reflection component (to account for reflection from low ionized matter), plus two gaussian lines, one free to vary around 6.4 keV and the other fixed to 6.96 keV. The value of , the relative amount of Compton reflection with respect to the power law component, was fixed to 2, which is the value corresponding to the observed EW of the 6.4 keV line. This translates to a 2-10 keV flux from the high ionization reflector 7 times larger than the low ionization component, a quite unusual configuration in Compton-thick sources where it is the low ionization reflection which generally dominates. The fit is good (=107.8/120), even if slightly worse than with a simple power law. The H-like line flux is now 0.97()10-6 ph cm-2 s-1, corresponding to an EW with respect to the high ionized reflection only of about 80 eV, a value consistent with what is expected from the large ionization parameter values implied by the absence of the He-like line (Bianchi & Matt 2002).
Alternatively, this line may be emitted in a high temperature, optically thin thermal plasma. A 0.5-10 keV fit with the mekal model (iron abundance fixed to solar) instead of the 7 keV gaussian line is acceptable (=485.5/476), giving a plasma temperature of 25() keV. The 2-10 keV luminosity of the thermal component is 1.21041 erg/s. The emission measure, , is about 71063 cm-3. Assuming, for self-consistency, that the emitting matter is not optically thick to Thomson scattering, i.e. 1 (with the radius of the emitting region, assumed spherical and with constant density), then a lower limit to of 7.41014 cm (i.e. about 12 Schwarzschild radii if a value of the black hole mass of 2108 solar masses is adopted, Dong & DeRobertis 2006), is obtained (corresponding to an upper limit to of 2109 cm-3). (If the mekal component is used instead of both the hard power law and the highly ionized iron line the fit is still good, the soft power law gets flatter, =2.18() and the thermal plasma 2-10 keV luminosity is 2.21041 erg s-1).
The origin and nature of this putative thermal plasma is however unclear. The accretion rate of NGC 3147 is low (, Bianchi et al. 2008), and therefore accretion could occur in a radiatively inefficient mode (ADAF, Narayan et al. 1995; RIAF, Yuan et al. 2003), where the X-ray emission is expected to be due to bremsstrahlung radiation. However, in such a mode the ion temperature is expected to be extremely high, and no visible line is expected. The thermal emission may be related to hot gas in a starburst region, but the implied luminosities are quite large, and there is no evidence for such an extreme starburst at other wavelengths. Alternatively, the plasma emitting region may be a compact one, in the innermost regions of the AGN. While there is so far no strong evidence of a significant contribution of such a plasma emission to the X-ray spectrum of Seyfert galaxies, it must be recalled that NGC 3147 is likely a peculiar source.
| E | Flux | EW | |
|---|---|---|---|
| (keV) | (10-6 ph cm-2 s-1) | (eV) | |
| Low ionized | 6.452 | 3.270.61 | 19536 |
| H-like | 6.96 | 0.930.89 | 6360 |
| Low ionized K | 7.06 | 111 |


3.3 The hard X-ray emission
One of the goals of the observation of NGC 3147 is to exploit its hard X-ray coverage to test the Compton-thick hypothesis for the unabsorbed X-ray spectrum of this Seyfert 2 galaxy. In fact, if the source is Compton-thick, the spectrum may appear unabsorbed because the primary emission below 10 keV would be completely hidden by the thick absorber, the observed emission being due to reflection from circumnuclear matter. In this scenario, the primary emission could emerge above 10 keV (if the absorber is not too thick, see e.g. Matt et al. 1999) and then be observable with the HXD/PIN. As discussed in the previous section, the observed EWs of the iron lines are consistent with the Compton-thick hypothesis (although in a quite unusual configuration), even if other scenarios are also possible.
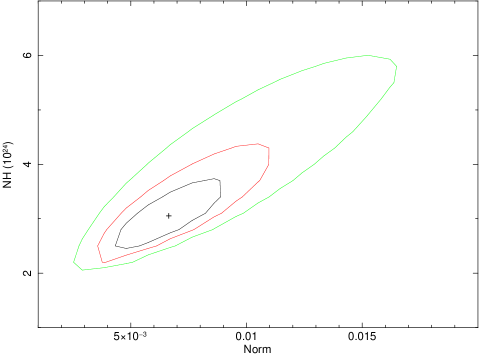
In Fig. 6 (left panel), the PIN spectrum is added to the already analyzed XIS spectra, and a clear excess with respect to the extrapolation of the XIS-only best fit model is apparent (the result is basically the same if a high temperature thermal plasma is used to account for the hydrogen-like iron line). No confusing source is known in the PIN field of view, according to the existing catalogs of bright X-ray sources. Assuming that the excess is due to the nuclear radiation piercing through a Compton-thick absorber, we included in the model the transmission and scattering components expected in such a case (Matt et al. 1999). In practice, we added to the model described in the previous section (which in this case should represent the nuclear emission reflected mostly by highly ionized matter) the transmitted and scattered (by the torus) emission using the MYTorus model (Murphy & Yaqoob 2009; see also http://www.mytorus.com/). The inclination angle of the system was fixed to 90 degrees for simplicity. The values of the absorber column density and of the normalization (at 1 keV) of the intrinsic radiation are strongly correlated, and shown in Fig. 7. The normalization of the unabsorbed (reflected in this scenario) power law is about 410-4 in the same units, which implies that at the 90% confidence level the ratio between primary and reflected components ranges from about 10 to 30, a value somewhat lower than usually found (e.g. Panessa et al. 2006, Marinucci et al. 2012). The 15-100 keV flux of the source is 1.210-11 erg cm-2 s-1. The 2-10/20-100 keV ratio is therefore more typical of Compton-thin sources, according to the diagnostic diagram of Malizia et al. (2007).
This result is only marginally consistent with the upper limit of 1.310-11 erg cm-2 s-1 to the 20-100 keV flux obtained by BeppoSAX (Dadina 2007) and with the upper limit of 710-12 erg cm-2 s-1 to the 20-40 keV flux obtained by INTEGRAL on September/October 2009 (this work). It is inconsistent with the Swift-BAT observation of this source, which provides only an upper limit to the 15-150 keV flux of 410-12 erg cm-2 s-1 (La Parola, private communication). It must be recalled that the PIN spectrum is obtained adopting the standard model for the background, which has an estimated average reproducibility of 3% at 1 (Fukazawa et al. 2009)333The cosmic X-ray background is also highly variable, up to 10%, from place to place on scales of 1 sq degree (Barcons et al. 2000). However, the CXB is only 5% of the total PIN background (Fukazawa et al. 2009).. For individual observations, however, deviations of the background as high as 5% are sometimes observed (Pottschmidt, private communication). A background higher by 3.5% suffices to reduce the 15-100 keV flux to a value consistent with the Swift-BAT upper limit, and in this case no excess is apparent (Fig. 6, right panel). Unfortunately, this observation does not include a period of Earth occultation, so the real level of the background cannot be determined.
4 Conclusions
Based on a short XMM-Newton observation, there were good arguments against the Compton-thick hypothesis for NGC 3147 (Bianchi et al. 2008): the X-ray/[OIII] ratio is typical of unobscured objects, as well as the X-ray spectrum: in Compton-thick sources the 2-10 keV emission is usually much harder, being dominated by the Compton reflection component from low ionization matter and with a neutral iron line of about 1 keV EW.
However, if reflection is from highly ionized matter the spectrum is steeper, but in this case emission from He- or H-like ions is also expected (Matt et al. 1996). Our observation suggests the presence of a strong H-like line. Indeed, the overall line and continuum spectrum below 10 keV is consistent with a Compton-thick scenario in which reflection is mostly (but not entirely) due to a highly ionized mirror. Interestingly, if this is the case, the absorber may not be the torus, which in this source is claimed by Shi et al. (2010) to be seen almost face-on. Strong highly ionized reflectors in Compton-thick Seyfert 2s are rare, and even when observed, as in NGC 1068, their relative importance with respect to the low ionzation reflector is lower (Iwasawa et al. 1997, Matt et. al. 2004). NGC 3147 would therefore be rather extreme. It is worth noting that a larger-than-usual amount of highly ionized reflection may at least partly explain the unusually (for a Compton-thick source) high X-ray/[OIII] ratio, as well as the low primary-to-reflection ratio.
On the other hand, it must also be stressed that alternative hypotheses, like e.g. large iron overabundance or a line emission from a very hot (temperature of about 20 keV), optically thin plasma cannot be ruled out. These characteristics would be unusual in Seyfert galaxies, but NGC 3147, if confirmed as a “true” Seyfert 2 galaxy, would be a peculiar source anyway.
A strong argument against the Compton-thick scenario is provided by the observed flux variation between the and the XMM- observations, obtained 3.5 years apart. Flux variations on yearly time scales were also found comparing earlier observations with ASCA, BeppoSAX and Chandra. These variations indicate that we are looking at an emitting region with a size smaller than a parsec. On the other hand, the argument, albeit strong, is still not decisive. Variations on similar or even smaller time scales have been claimed for NGC 1068, the archetypal Compton-thick Seyfert 2 (Guainazzi et al. 2000, Colbert et al. 2002). Interestingly, in NGC 1068 the variations seems to concern the highly ionized reflector, which in that source is prominent only above about 2 keV (reflection from less ionized matter, possibly related to the Narrow Line Regions, dominates at lower energies). Moreover, there is evidence in some sources, most notably NGC 1365 (Risaliti et al. 2005), of Compton-thick material very close to the central black hole.
If the source is moderately Compton-thick, we expect that the direct emission would pierce through the absorber in hard X-rays. Using the standard background subtraction, an excess in the PIN is observed, which however disappears - becoming consistent with the SWIFT/BAT upper limit - assuming that the background is higher than usual by 3.5%, a not uncommon variation. Therefore, this observation is unfortunately not decisive in this respect.
To conclude, after the new observation the “true” Seyfert 2 nature of NGC 3147 remains the most probable hypothesis. On the other hand, the ionized iron line is best explained in the “highly ionized reflector” Compton-thick scenario, which is still a viable option. Future sensitive hard X-ray observations with NuStar and/or high spectral resolution observations with Astro-H are needed to definitely settle the issue.
Acknowledgements
We thank the anonymous referee for her/his valuable suggestions. Katja Pottschmidt is gratefully acknowledged for her help on the PIN background, and Valentina La Parola for providing the SWIFT/BAT upper limit to the flux of the source.
GM, SB and FP acknowledge financial support from ASI under grants ASI/INAF I/088/06/0 and I/009/10/0, FP also from grant INTEGRAL I/033/10/0. XB’s research is funded by the Spanish Ministry of Economy and Competitivity through grant AYA2010-21490-C02-01.
References
- (1) Anders E., Grevesse N., 1989, Geo. Cosm. Acta, 53, 197
- (2) Antonucci R.R.J., 1993, ARA&A, 31, 473
- (3) Balucinska-Church M., McCammon D., 1992, ApJ, 400, 699
- (4) Barcons X., Mateos S., Ceballos M.T., 2000, MNRAS, 316, L13
- (5) Bianchi S., Matt G., 2002, A&A, 387, 76
- (6) Bianchi S., et al., 2008, MNRAS, 385, 195
- (7) Colbert E.J.M., et al., 2002, ApJ, 581, 182
- (8) Dadina M., 2007, A&A, 461, 1209
- (9) Dickey J.M., Lockman F.J, 1990, ARA&A, 28, 215
- (10) Dong X.Y., De Robertis M.M., 2006, AJ, 131, 1236
- (11) Elitzur M., Shlosman I., 2006, ApJ, 648, L101
- (12) Fukazawa Y., et al., 2009, PASJ, 61, 17
- (13) Iwasawa K., Fabian A.C., Matt G., 1997, MNRAS, 289, 443
- (14) Garcia J., Kallman T.R., Mushotzky R.F., 2011, ApJ, 731, 131
- (15) Guainazzi M., et al., 2000, New Astronomy, 5, 235
- (16) Malizia A., et al., 2007, ApJ, 668, 81
- (17) Marinucci A., Bianchi S., Nicastro F., Matt G., 2012, ApJ, submitted
- (18) Matt G., Fabian A.C. & Ross R.R, 1993, MNRAS, 262, 179
- (19) Matt G., Fabian A.C. & Ross R.R, 1996, MNRAS, 278, 1111
- (20) Matt G., Brandt W.N., Fabian A.C., 1996, MNRAS, 280, 823
- (21) Matt G., Fabian A.C., Reynolds C.S., 1997, MNRAS, 289, 175
- (22) Matt G., Pompilio F., La Franca F., 1999, New As., 4/3, 191
- (23) Matt G., Bianchi S., Guainazzi M., Molendi S., 2004, A&A, 414, 155
- (24) Nicastro F., 2000, ApJ, 530, L65
- (25) Nicastro F., Martocchia A., Matt G., 2003, ApJ, 589, L13
- (26) Murphy M., K. D., Yaqoob, T., 2009, MNRAS, 397, 1549
- (27) Narayan, R., Yi I., Mahadevan R., 1995, Nature, 374, 623
- (28) Panessa F., et al., 2006, A&A, 455, 173
- (29) Ptak A., et al., 1996, ApJ, 459, 542
- (30) Risaliti G., et al., 2005, ApJ, 623, L93
- (31) Ross R.R. & Fabian A.C., 1993, MNRAS, 261, 74
- (32) Shi Y., et al., 2010, ApJ, 714, 115
- (33) Terashima Y. & Wilson A.S., 2003, ApJ, 583, 145
- (34) Tran H.D., Lyke J.E., Mader J.A., 2011, ApJ, 726, L21
- (35) Yuan F., Quataert E., Narayan R., 2003, ApJ, 598, 301