Epidemic Variability in Hierarchical Geographical Networks with Human Activity Patterns
Abstract
Recently, some studies have revealed that non-Poissonian statistics of human behaviors stem from the hierarchical geographical network structure. On this view, we focus on epidemic spreading in the hierarchical geographical networks, and study how two distinct contact patterns (i. e., homogeneous time delay (HOTD) and heterogeneous time delay (HETD) associated with geographical distance) influence the spreading speed and the variability of outbreaks. We find that, compared with HOTD and null model, correlations between time delay and network hierarchy in HETD remarkably slow down epidemic spreading, and result in a upward cascading multi-modal phenomenon. Proportionately, the variability of outbreaks in HETD has the lower value, but several comparable peaks for a long time, which makes the long-term prediction of epidemic spreading hard. When a seed (i. e., the initial infected node) is from the high layers of networks, epidemic spreading is remarkably promoted. Interestingly, distinct trends of variabilities in two contact patterns emerge: high-layer seeds in HOTD result in the lower variabilities, the case of HETD is opposite. More importantly, the variabilities of high-layer seeds in HETD are much greater than that in HOTD, which implies the unpredictability of epidemic spreading in hierarchical geographical networks.
- PACS numbers
-
89.75.Hc, 87.23.Ge, 05.40.-a
Since the discovery of non-Poissonian statistics of human behaviors such as human interaction activities and mobility trajectories, more and more scientists have been paying attention to the role of these patterns in epidemic spreading. Most recent research results showed that both time and space activity characteristics respectively have significant impacts on spreading dynamics. However, it is still unclear to us how the spatiotemporal characteristics affect the prevalence. Indeed, the time characteristics of human activities is closely related to the space characteristics. Recently, some studies have revealed that non-Poissonian statistics of human behaviors stem from the hierarchical geographical network structure, in which we investigate how the scale-free characteristic of human contact activities influences epidemic spreading. We find that, compared with homogeneous contact pattern and null model, correlations between time delay and network hierarchy can remarkably slow down epidemic spreading, and result in a upward cascading multi-modal phenomenon. More importantly, high-layer seeds arouse large variabilities, while low-layer seeds result in several comparable peaks of variabilities, which makes the prediction of epidemic spreading hard. This work provides us further understanding and new perspective in the effect of spatiotemporal characteristics of human activities on epidemic spreading.
I Introduction
In modern society, the intrinsic mechanism of epidemic spreading is a noticeable issue. To understand the spatiotemporal patterns of epidemic spreading, the accurate mathematical models of epidemic spreading are used as the basic conceptual tools. There are various disease models like SIS (susceptible-infected-susceptible) and SIR (susceptible-infected-refractory) Anderson and May (1992); Hethcote (2000). With the booming development of complex network theory Boccaletti et al. (2006), epidemic spreading in complex networks has been strongly catching scientists’ eyes Moore and Newman (2000); Newman et al. (2000); Newman and Watts (1999a, b); Moukarzel (1999); Eguíluz and Klemm (2002); May and Lloyd (2001); Pastor-Satorras and Vespignani (2003); Gallos and Argyrakis (2003); Boguñá et al. (2003); Moreno et al. (2003); Liu and Hu (2005); Huang and Li (2007); Grabowski and Kosiński (2004); Motter et al. (2003); Ravasz et al. (2002); Ravasz and Barabási (2003); Noh (2003); Noh and Rieger (2004); Watts et al. (2002, 2005); Yook et al. (2002); Warren et al. (2002); Gastner and Newman (2006); Németh and Vattay (2003); Huang et al. (2006); Crépey et al. (2006); Zhou et al. (2006). Most studies focus on the effect of network structures on spreading dynamics, including the small world property Moore and Newman (2000); Newman et al. (2000); Newman and Watts (1999a, b); Moukarzel (1999), the scale-free property Eguíluz and Klemm (2002); May and Lloyd (2001); Pastor-Satorras and Vespignani (2003); Gallos and Argyrakis (2003); Boguñá et al. (2003); Moreno et al. (2003), the community structure Liu and Hu (2005); Huang and Li (2007), and the hierarchical structure Grabowski and Kosiński (2004); Motter et al. (2003); Ravasz et al. (2002); Ravasz and Barabási (2003); Noh (2003); Noh and Rieger (2004); Watts et al. (2002, 2005), etc. Besides, both spatial distance Yook et al. (2002); Warren et al. (2002); Gastner and Newman (2006); Németh and Vattay (2003); Huang et al. (2006); Crépey et al. (2006) and contact capacity Castellano and Pastor-Satorras (2006); Zhou et al. (2006) were found to have nontrivial impacts on epidemic spreading.
Since the discovery of non-Poissonian statistics of human behaviors such as human interaction activities Barabási (2005) and human mobility trajectories Brockmann et al. (2006); González et al. (2008), more and more scientists have focused on the role of these patterns in epidemic spreading. Most recent research results showed that both time and space activity characteristics respectively have significant impact on spreading dynamics. On one hand, the non-Poissonian nature of human interactions results in slow spreading in the long time limit Vázquez et al. (2007); Iribarren and Moro (2009); Yang et al. (2011). An analytical prediction was then proposed to understand the emergence of the extremely long prevalence time in spreading dynamics Min et al. (2011). Further investigation revealed that this phenomenon mainly stems from weight-topology correlations and the bursty activity patterns of individuals Karsai et al. (2011). By defining the dynamical strength of social ties, an interesting phenomenon was explained: although bursts hinder spreading at large scales, group conversations favor the local probability of propagation Miritello et al. (2011). On the other hand, the human mobility patterns have a significant influence on epidemic spreading Ni and Weng (2009); Tang et al. (2009a, b); Wang et al. (2009); Balcan and Vespignani (2011); Belik et al. (2011). As human traveling statistics follow the scaling law, the corresponding simulation results showed that the occurrence probability of global outbreaks is determined by human travel behavior Ni and Weng (2009). Considering two distinct individual mobility patterns (i. e., dynamical condensation and object traveling), both theoretical analysis and numerical simulations revealed that these patterns have an essential influence on epidemic spreading in scale-free networks Tang et al. (2009a, b). In the study of the fundamental spreading patterns of mobile virus outbreak, Wang et al. found that a bluetooth virus’s spreading is constrained, which offers ample time for developing and deploying countermeasures Wang et al. (2009). Recent studies presented us that human mobility patterns are often dominated by specific locations and recurrent flows Song et al. (2010). Balcan et al. Balcan and Vespignani (2011) and Brockmann et al. Belik et al. (2011) thus studied contagion spreading in bi-directional movements, and showed that its dynamics is significantly different from random diffusive dynamics.
Although many researchers have studied the effects of time and space characteristics of human behaviors on prevalence, it is still unclear to us how the spatiotemporal characteristics affect the prevalence. Indeed, the time characteristics of human activities is closely related to the space characteristics. Take human contact activities for example. The spatial distance between individuals will inevitably lead to the time delay of their contact activities. In this point of view, more attention needs to be paid to the effect of spatiotemporal characteristics. Recently, some studies have revealed that non-Poissonian statistics of human behaviors stem from the hierarchical geographical network structure Kalapala et al. (2006); Han et al. (2011), in which we investigate how the scale-free characteristic of human contact activities influences epidemic spreading. We find that correlations between time delay and network hierarchy can significantly affect the spreading speed and the variability of outbreaks, and it is very difficult to accurately forecast epidemic spreading in the hierarchical geographical networks.
The paper is organized as follows. In Sec. II, we introduce the hierarchical geographical network model and the propagation processes in two contact patterns. In Sec. III, we investigate the effects of different contact patterns on epidemic spreading. Finally, we draw conclusions in Sec. IV.
II Model Introduction
II.1 Hierarchical Geographical Network Model
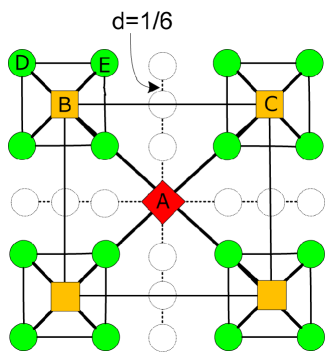
In order to reproduce the scaling law in human trajectories, a hierarchical geographical network model has been proposed Han et al. (2011). In this model, all nodes are organized in layers. Denote as the number of first-layer nodes, and as the branching number of the current-layer nodes. Each of th-layer nodes is connected to its father node, and two th layer node are connected if they have the same father node. In the two dimensional plane, the whole area is divided into sub-regions, and 1st-layer nodes are assigned to locate in the center of them. Then, each of the sub-regions is further divided into sub-sub-regions, with the 2nd-layer nodes locating in the center. Repeating this process until the th-layer nodes are generated. Remarkably, there are strong correlations between the geographical distance and the network hierarchy in this network: the higher layer a node locates in, the farther it is from its father node and the other nodes in the same layer. In Fig. 1, a schematic diagram with is shown. (the distance between the second layer node and its father node ) is twice of (the distance between the third layer node and its father node ), and in the second layer is twice of in the third layer.
When a random walker continuously jump in this network, a power-law-like travel displacement distribution is spontaneously generated in the thermodynamic limit , where is the geometric distance of a random walker jumping at each time step Han et al. (2011).
II.2 Time delay in Contact Process
In various transportation networks, such as railway networks and airline networks, the time delay of human contact is determined by the geometric distance between two neighbors, where time delay is defined as the time interval when message is transmitted from one to the other. However, in communication networks, such as Internet and telephone network, time delay of contact has no relation with the geometric distance. Thus, contact patterns of human activities can be divided into two categories. The first pattern is the heterogeneous time delay (HETD) of contact activities, which depends on the geometric distance. For example, cities far from disease origins are infected later than those near the origins. Thus, the time delay of a contact is proportional to the geometric distance between two neighbors. Obviously, the time delay distribution of contact follows power law, which is consistent with the distribution of time intervals between two successive messages arriving at a given receiver Pica Ciamarra et al. (2008). The second pattern is the homogeneous time delay (HOTD), in which the distance is ignored. For example, in communication networks, computer virus spreading is not restrained by the geometric distance. For this reason, we set the time delay of a contact a constant. To compare effects of different contact patterns on epidemic spreading, we set the mean time delay of all contacts as a fixed value in simulations. It is noted that time delay is generally not an integer such as . We separate its integral and decimal parts as , and then reset the time delay with probability , while with probability . What can be imagined is that these two patterns can result in distinct spatiotemporal patterns of epidemic spreading.
II.3 Propagation Process
We study SI (susceptible-infected) Anderson and May (1992) spreading dynamics in contact process (CP) through numerical simulations. In SI model, ’S’ and ’I’ represents respectively the susceptible (healthy) state and the infected state. At each time step of contact process, each infected node randomly contacts one of its neighbors, and then the contacted neighboring node will be infected with probability if it is in the healthy state, or else it will retain its state. To eliminate the stochastic effect of the disease transmission, we set . In simulations, the propagation processes are as follows: (i) Select a node as the initial infected (i. e., seed) and all other nodes are in S state. (ii) At each time step, the infected node in the active state randomly select one of its susceptible neighbors , and then contact node after time delay . During this period, node is inactive. (iii) After , node is infected by node . Meanwhile, node is reactivated. (iv) The propagation processes will continue until all nodes are in I state.
Based on the above process, we investigate how these two patterns influence spreading speed and variability of prevalence in CP in hierarchical geographical networks. The prevalence is defined as the density of infected individuals at time step , and the spreading speed is defined as new case rate at time step , that is . With the spread of epidemic, new case rate increases to the maximal value , which denotes the occurence of outbreak. In order to analyze the impact of the underlying network topology on the predictability of epidemic spreading, the variability of outbreaks is defined as the relative variation of the prevalence given by Crépey et al. (2006)
| (1) |
denotes all independent dynamics realizations are essentially the same, and the prevalence in the network is deterministic. Larger means worse predictability that a particular realization is far from average over all independent realizations.
III The effect of different contact patterns
III.1 Random seed
In this paper, we study how the different contact patterns (i. e., HOTD and HETD) influence epidemic spreading. We first pay attention to the case of random seed, that is a node selected randomly as the initial seed. Obviously, in Figs. 2 (a) and (b), new cases in HETD has the lower peak value , and the longer full prevalence time , where the full prevalence time is defined as the amount of time that all nodes of the network are infected by a seed. Meanwhile, a upward cascading multi-modal phenomenon in HETD is very intriguing, which is consistent with the results in Ref. Watts et al. (2005); Wang et al. (2009); Grenfell et al. (2001). We suppose that this phenomenon might origin from the correlations between time delay and network hierarchy: time delays of contacts between the high-layer nodes are much greater due to longer distance from each other. To gain insight into the effect of these correlations, we employ null model where time delays are randomly exchanged between randomly chosen links (RNTD), and the time delay-network hierarchy correlations are thus destroyed. In Fig. 2 (a), in RNTD displays almost the same unimodal pattern to that in HOTD, except for a slightly lower spreading (i. e., ). By comparison, we can conclude: although the heterogenous time delay of contact activities can result in slow spreading Vázquez et al. (2007); Iribarren and Moro (2009); Min et al. (2011), the very low spreading is dominated by the time delay-network hierarchy correlations. More importantly, it indicates that these correlations certainly lead to the upward cascading multi-modal phenomenon. In this network, the outbreaks in low-layer sub-regions occur much earlier than that in high-layer sub-regions because low-layer nodes are much closer to each other. Even if the high-layer nodes are infected, outbreaks will not occur in a wider range until their child nodes are infected after a long time. Therefore, the peak values at in Fig. 2 (b) correspond to the outbreaks in the 5th, 4th, 3rd, 2nd, and 1st layer sub-regions, respectively.
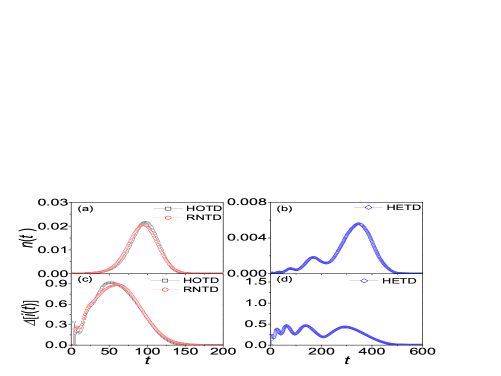
After that, we also investigate the variabilities of outbreaks in the different contact patterns. From Figs. 2 and , we catch two essential differences between HETD and HOTD/RNTD: although the peak value of variability in HETD is one half of in HOTD/RNTD, there are four comparable peaks in HETD. As pointed out in Ref. Crépey et al. (2006), the variability changes coincide essentially with the evolution of the diversity of infected nodes. That is to say, the more homogeneously infected nodes distribute among all layers, the higher variability is. For the case of HOTD/RNTD, the variability is maximal when the diversity of layers of infected nodes is the largest at . In addition, there is a small fluctuation of the variability at because of the rapid spread in the bottom-layer sub-regions (i. e., a complete graph). For the case of HETD, the diversity of infected nodes does not vary monotonically over time, because there is always a maximum value of the diversity when outbreaks occur in the different layer sub-regions. As outbreaks successively occur from the low-layer to the high-layer sub-regions, the variability displays four comparable peaks. It means that the epidemic spreading in HETD has the variability over a long period of time, which brings a huge challenge to disease control.
III.2 Seeds from different layers
To confirm the dynamical centrality of nodes, it is very important to study the effect of different seeds on epidemic spreading Kitsak et al. (2010); Gong et al. (2011). In this section, we investigate how seeds from different layers influence the spreading speed and the variability of outbreaks. In each simulation, a randomly chosen node in the designated layer is set as the seed. From Figs. 3 (a) and (b), in three different contact patterns follow the same rule that the high-layer seeds can accelerate outbreaks. As mentioned in Sec. III. A, the only access to outbreaks in the wider range is across the high-layer nodes. Owing to time delay-network hierarchy correlations, the high-layer seeds doubtlessly make the outbreaks occur much fiercer, which corresponds to the larger peak value. It implies that central cities in transportation networks must be crucial regions for pandemic prevention and control.
Moreover, in HETD displays an essential difference from the other two cases: the peak number of new cases rate is equal to the layer of the initial seed. For instance, there is single peak when a 1st layer node is set as the seed. On the one hand, owing to the characteristic of hierarchy, epidemic spreads from the high-layer nodes to the low-layer nodes, and thus the infected nodes gradually increase with time. On the other hand, the early prevalence is too slow due to time delay-network hierarchy correlations. After virus outbreaks in the the bottom layer, new cases rate rapidly decreases because of the effect of network size. Therefore, the seed from the layer results in only one peak. For the case of seeds from the layer, epidemic spreading from the seed to bottom layer leads to the first outbreak in the seed-centered sub-region, and the first peak value is greater than the new cases rate value for (i. e., ) at . Owing to the farther distance of the seed to both its father node and the same-layer nodes, the second peak corresponds to the outbreak in the wider range, but the second peak value . Similarly, new cases surely have peaks when the seed is in the lth layer. These results have intriguing implications in hierarchical geographical networks: although the high-layer seeds make outbreaks occur much fiercer (i. e., the higher peak), the low-layer seeds make outbreaks occur much earlier (i. e., the earlier peak).
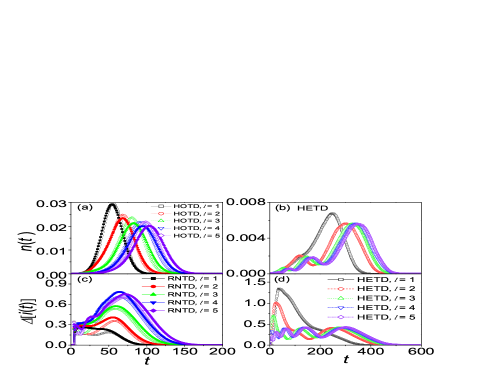
In Figs. 3 and , it is a surprise that the outbreaks with the high-layer seeds in HOTD/RNTD have the lower variabilities, while the case in HETD is just the opposite. For the case of HOTD/RNTD, it takes almost the same amount of time to spread upward or downward due to no relationship between time delay and network hierarchy. When the seed is in the high-layer, epidemic can only spread downward, which has the less optional pathways. Thus, the high-layer seeds result in the less diversity due to the less optional pathways, which corresponds to the lower variability. As this contact pattern reflects the characteristics of information diffusion in communication networks, the above results demonstrate that information from the high-layer nodes have two obvious advantages: the faster diffusion rate and the better predictability.
For the case of HETD, it is very difficult for the virus to spread upward due to the longer distance from their farther nodes. On the contrary, it’s much easier to spread downward, which can arouse the more optional spreading pathways and the greater diversity. Thus, the outbreaks with the high-layer seeds have the higher variabilities. For example, . Intriguingly, the maximum value of the variabilities in HOTD/RNTD is only half of in HETD. It indicates that the time delay-network hierarchy correlations make the predictability of epidemic spreading worse. On the other hand, although the outbreaks with the low-layer seeds have the better predictability, several comparable peaks of the variabilities, which corresponds to several outbreaks in the different ranges, cause a long-term trouble for pandemic prevention and control.
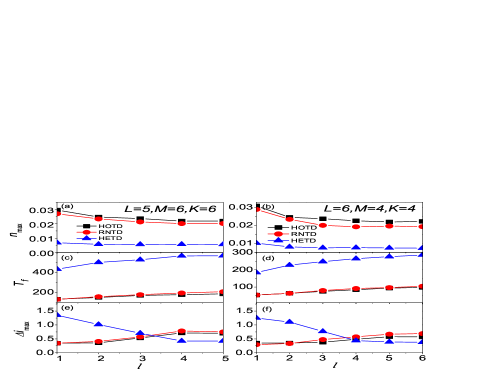
In order to ensure the universality of the above results, other parameters are also chosen to simulate this process. Figs. 4 (b), (d), and (f) show the results for . As expected, all simulations reveal the same conclusion: the trend of variabilities in HETD is completely contrary to that in HOTD/RNTD.
IV CONCLUSIONS AND DISCUSSIONS
In conclusions, we have studied the effects of contact patterns on epidemic spreading in hierarchical geographical networks, and come to a clear understanding that different contact patterns (i. e., HOTD and HETD) can remarkably influence the spreading speed and the variability of outbreaks. First, we focus on the case of the random seed, and find that correlations between time delay and network hierarchy in HETD make epidemic spread much slower than HOTD/RNTD, and induce a upward cascading multi-modal phenomenon. Correspondingly, the variability in HETD is lower, but several comparable peaks make the long-term prediction of epidemic spreading hard. Second, we investigate the effect of seeds from different layers on epidemic spreading. For three contact patterns, the high-layer seeds make outbreaks occur much fiercer, while the low-layer seeds in HETD make outbreaks occur much earlier due to the small distance between nodes in the low-layer sub-regions. Interestingly, three contact patterns display distinct trends of variabilities with the different layers of seeds. The high-layer seeds in HOTD/RNTD result in the lower variabilities, the case of HETD is opposite. It is notable that the variabilities of the high-layer seeds in HETD are much greater than that in HOTD/RNTD, which implies the unpredictability of epidemic spreading in hierarchical geographical networks. To make matters worse, the variabilities of the low-layer seeds have more comparable peaks, which means it is difficult to accurately forecast epidemic spreading for a long time. This work provides us further understanding and new perspective in the effect of spatiotemporal characteristics of human activities on epidemic spreading.
Acknowledgements.
Zhi-Dan Zhao would like to thank Tao Zhou, Duan-Bing Chen, Xiao-Pu Han, Yu Gan, and Jia-Bei He for stimulating discussions. This work is supported by the NNSF of China (Grants No. 11105025, 90924011, 60903073), China Postdoctoral Science Foundation (Grant No. 20110491705), the Specialized Research Fund for the Doctoral Program of Higher Education (Grant No. 20110185120021), and the Fundamental Research Funds for the Central Universities (Grant No. ZYGX2011J056).References
- Anderson and May (1992) R. M. Anderson and R. M. May, Infectious diseases of humans: dynamics and control (Oxford University Press, USA, 1992).
- Hethcote (2000) H. W. Hethcote, SIAM Rev. 42, 599 (2000).
- Boccaletti et al. (2006) S. Boccaletti, V. Latora, Y. Moreno, M. Chavez, and D. Hwang, Phys. Rep. 424, 175 (2006).
- Moore and Newman (2000) C. Moore and M. E. J. Newman, Phys. Rev. E 61, 5678 (2000).
- Newman et al. (2000) M. E. J. Newman, C. Moore, and D. J. Watts, Phys. Rev. Lett. 84, 3201 (2000).
- Newman and Watts (1999a) M. E. J. Newman and D. Watts, Phys. Lett. A 263, 341 (1999a).
- Newman and Watts (1999b) M. E. J. Newman and D. J. Watts, Phys. Rev. E 60, 7332 (1999b).
- Moukarzel (1999) C. F. Moukarzel, Phys. Rev. E 60, R6263 (1999).
- Eguíluz and Klemm (2002) V. M. Eguíluz and K. Klemm, Phys. Rev. Lett. 89, 108701 (2002).
- May and Lloyd (2001) R. M. May and A. L. Lloyd, Phys. Rev. E 64, 066112 (2001).
- Pastor-Satorras and Vespignani (2003) R. Pastor-Satorras and A. Vespignani, in Handbook of Graphs and Networks: From the Genome to the Internet, edited by S. Bornholdt and H. G. Schuster (Wiley-VCH, Berlin, 2003).
- Gallos and Argyrakis (2003) L. K. Gallos and P. Argyrakis, Physica A 330, 117 (2003).
- Boguñá et al. (2003) M. Boguñá, R. Pastor-Satorras, and A. Vespignani, Phys. Rev. Lett. 90, 028701 (2003).
- Moreno et al. (2003) Y. Moreno, J. B. Gómez, and A. F. Pacheco, Phys. Rev. E 68, 035103 (2003).
- Liu and Hu (2005) Z. Liu and B. Hu, Europhys. Lett. 72, 315 C321 (2005).
- Huang and Li (2007) W. Huang and C. Li, J. Stat. Mech. 2007, P01014 (2007).
- Grabowski and Kosiński (2004) A. Grabowski and R. A. Kosiński, Phys. Rev. E 70, 031908 (2004).
- Motter et al. (2003) A. E. Motter, T. Nishikawa, and Y.-C. Lai, Phys. Rev. E 68, 036105 (2003).
- Ravasz et al. (2002) E. Ravasz, A. L. Somera, D. A. Mongru, Z. Oltvai, and A.-L. Barabási, science 297, 1551 (2002).
- Ravasz and Barabási (2003) E. Ravasz and A.-L. Barabási, Phys. Rev. E 67, 026112 (2003).
- Noh (2003) J. D. Noh, Phys. Rev. E 67, 045103 (2003).
- Noh and Rieger (2004) J. D. Noh and H. Rieger, Phys. Rev. E 69, 036111 (2004).
- Watts et al. (2002) D. J. Watts, P. S. Dodds, and M. E. J. Newman, Science 296, 1302 (2002).
- Watts et al. (2005) D. J. Watts, R. Muhamad, D. C. Medina, and P. S. Dodds, Proc. Natl. Acad. Sci. U.S.A. 102, 11157 (2005).
- Yook et al. (2002) S. H. Yook, H. Jeong, and A. Barabási, Proc. Natl. Acad. Sci. U.S.A. 99, 13382 (2002).
- Warren et al. (2002) C. P. Warren, L. M. Sander, and I. M. Sokolov, Phys. Rev. E 66, 056105 (2002).
- Gastner and Newman (2006) M. T. Gastner and M. E. J. Newman, Euro. Phys. J. B 49, 247 (2006).
- Németh and Vattay (2003) G. Németh and G. Vattay, Phys. Rev. E 67, 036110 (2003).
- Huang et al. (2006) L. Huang, L. Yang, and K. Yang, Phys. Rev. E 73, 036102 (2006).
- Crépey et al. (2006) P. Crépey, F. P. Alvarez, and M. Barthélemy, Phys. Rev. E 73, 046131 (2006).
- Zhou et al. (2006) T. Zhou, J.-G. Liu, W.-J. Bai, G. Chen, and B.-H. Wang, Phys. Rev. E 74, 056109 (2006).
- Castellano and Pastor-Satorras (2006) C. Castellano and R. Pastor-Satorras, Phys. Rev. Lett. 96 (2006).
- Barabási (2005) A.-L. Barabási, Nature 435, 207 (2005).
- Brockmann et al. (2006) D. Brockmann, L. Hufnagel, and T. Geisel, Nature 439, 462 (2006).
- González et al. (2008) M. C. González, C. A. Hidalgo, and A.-L. Barabási, Nature 453, 779 (2008).
- Vázquez et al. (2007) A. Vázquez, B. Racz, A. Lukacs, and A.-L. Barabási, Phys. Rev. Lett. 98, 158702 (2007).
- Iribarren and Moro (2009) J. L. Iribarren and E. Moro, Phys. Rev. Lett. 103, 038702 (2009).
- Yang et al. (2011) Z. Yang, A.-X. Cui, and T. Zhou, Physica A 390, 4543 (2011).
- Min et al. (2011) B. Min, K.-I. Goh, and A. Vázquez, Phys. Rev. E 83, 036102 (2011).
- Karsai et al. (2011) M. Karsai, M. Kivelä, R. K. Pan, K. Kaski, J. Kertész, A.-L. Barabási, and J. Saramäki, Phys. Rev. E 83, 025102 (2011).
- Miritello et al. (2011) G. Miritello, E. Moro, and R. Lara, Phys. Rev. E 83, 045102 (2011).
- Ni and Weng (2009) S. Ni and W. Weng, Phys. Rev. E 79, 016111 (2009).
- Tang et al. (2009a) M. Tang, L. Liu, and Z. Liu, Phys. Rev. E 79, 016108 (2009a).
- Tang et al. (2009b) M. Tang, Z. Liu, and B. Li, Europhys. Lett. 87, 18005 (2009b).
- Wang et al. (2009) P. Wang, M. González, C. Hidalgo, and A. Barabási, Science 324, 1071 (2009).
- Balcan and Vespignani (2011) D. Balcan and A. Vespignani, Nature Phys. (2011).
- Belik et al. (2011) V. Belik, T. Geisel, and D. Brockmann, Phys. Rev. X 1, 011001 (2011).
- Song et al. (2010) C. Song, T. Koren, P. Wang, and A.-L. Barabási, Nature Phys. 6, 818 (2010).
- Kalapala et al. (2006) V. Kalapala, V. Sanwalani, A. Clauset, and C. Moore, Phys. Rev. E 73, 026130 (2006).
- Han et al. (2011) X.-P. Han, Q. Hao, B.-H. Wang, and T. Zhou, Phys. Rev. E 83, 036117 (2011).
- Pica Ciamarra et al. (2008) M. Pica Ciamarra, A. Coniglio, and L. De Arcangelis, Europhys. Lett. 84, 28004 (2008).
- Grenfell et al. (2001) B. T. Grenfell, O. N. Bjørnstad, and J. Kappey, Nature 414, 716 (2001).
- Kitsak et al. (2010) M. Kitsak, L. K. Gallos, S. Havlin, F. Liljeros, L. Muchnik, H. E. Stanley, and H. A. Makse, Nature Phys. 6, 888 (2010).
- Gong et al. (2011) K. Gong, M. Tang, H. Yang, and M. Shang, Chaos 21, 043130 (2011).