theDOIsuffix \Volume55 \Month01 \Year2007 \pagespan1 \ReceiveddateXXXX \ReviseddateXXXX \AccepteddateXXXX \DatepostedXXXX
Neutron Resonance Data Exclude Random Matrix Theory
Abstract
Almost since the time it was formulated, the overwhelming consensus has been that random matrix theory (RMT) is in excellent agreement with neutron resonance data. However, over the past few years, we have obtained new neutron-width data at Oak Ridge and Los Alamos National Laboratories that are in stark disagreement with this theory. We also have reanalyzed neutron widths in the most famous data set, the nuclear data ensemble (NDE), and found that it is seriously flawed, and, when analyzed carefully, excludes RMT with high confidence. More recently, we carefully examined energy spacings for these same resonances in the NDE using the statistic. We conclude that the data can be found to either confirm or refute the theory depending on which nuclides and whether known or suspected -wave resonances are included in the analysis, in essence confirming results of our neutron-width analysis of the NDE. We also have examined radiation widths resulting from our Oak Ridge and Los Alamos measurements, and find that in some cases they do not agree with RMT. Although these disagreements presently are not understood, they could have broad impact on basic and applied nuclear physics, from nuclear astrophysics to nuclear criticality safety.
keywords:
Porter-Thomas distribution, random matrix theory.1 Introduction
In 1956, Porter and Thomas [1] proposed a theory to explain the surprising discovery that -wave resonance reduced neutron widths () spanned a very wide range. Starting from seemingly sound and fundamental assumptions, their theory predicted that values follow a distribution with one degree of freedom (), which subsequently became known as the Porter-Thomas distribution (PTD).
Almost since that time, the overwhelming consensus has been that data and theory agree very well. In fact, faith in this theory is so strong that in the past 30 years it has been extremely rare to find a paper in the literature in which new data have been used to test the theory. Instead, standard procedure has been to use the theory to correct new data for experimental deficiencies. In the intervening years, random matrix theory (RMT) [2] was developed and has placed the PTD on more formal footing, broadened the scope and predictions, and provided links between nuclear physics and many other fields, including quantum chaos. As a consequence, the impact of neutron resonance data has become much broader, as such data are routinely cited as some of the best proof of the veracity of RMT.
In this paper, we summarize recent tests of RMT predictions using neutron resonance data. Because all experiments from which such data are obtained have important limitations, we begin by discussing these problems and how they are circumvented in Section 2.
Over the past few years, we have obtained new data [3, 4] at the Oak Ridge Electron Linear Accelerator (ORELA) [5] and Los Alamos Neutron Science Center (LANSCE) [6] facilities that are much better than previous data. We discuss results of using these data to test the PTD in Section 3.
The -matrix analyses from which data are obtained also yield total radiation widths () for these same resonances. These data also can be used to test the PTD and other predictions of theory, but the situation is complicated by limited knowledge of the level density as a function of excitation energy and the photon strength functions needed to model the decay of the resonant capturing states. In Section 4, we discuss some general observations regarding what has been learned from data obtained at ORELA over the past several years, as well as a surprising very recent result [7] discerned from our 147Sm data taken at LANSCE.
In addition to our own data, we have reanalyzed [8] neutron widths in the most famous data set [9, 10], the so-called nuclear data ensemble (NDE). More recently, we have reanalyzed energy spacings for these same resonances, with careful attention to evaluation of uncertainties. We discuss results of these analyses in Section 5.
In almost all cases we have examined so far, we find significant deviations from the PTD or other disagreements with RMT predictions. There also have been several other reported disagreements with the PTD [11, 12, 13, 14, 15], which we briefly describe in Section 6. To our knowledge, those results have never been explained or retracted.
As far as we know, these disagreements with RMT presently are not understood, although our recent results have (re)ignited theoretical interest [16, 17, 18, 19], some of which is closely related to earlier work [20] on non-Hermitian Hamiltonians. We very briefly discuss recent theoretical work in Section 7. Because many models assume that both particle and primary gamma transitions follow the PTD, violation of this assumption could have broad impact on basic and applied nuclear physics, from nuclear astrophysics to nuclear criticality safety.
Reliable separation of small - from large -wave resonances remains the largest barrier to better tests of RMT using neutron resonance data. In Section 8, we very briefly describe new experiment techniques aimed at surmounting this barrier.
We end with a short summary and some conclusions in Section 9.
2 Experiment limitations
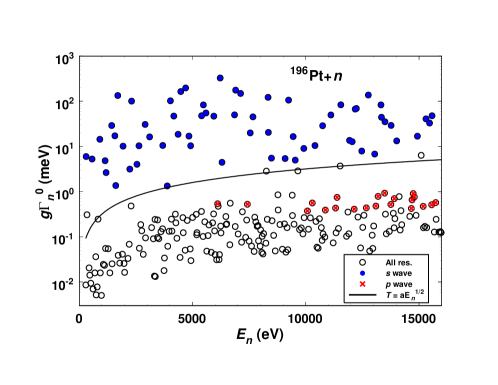
An ideal test of the PTD or other predictions of RMT would involve a complete (no missing resonances) and pure (all resonances having the same parity) data set. Typically, -wave neutron resonances are used because they are largest and hence easiest to observe. Unfortunately, all experiments have a lower limit for observing resonances as well as a threshold below which - and -wave resonances cannot be differentiated. These facts are illustrated in Fig. 1, in which neutron widths for 196Pt resonances from our ORELA measurements are plotted as a function of resonance energy.
To understand how the data in this figure illustrate these facts, it is useful to know the following details. Because 196Pt is a zero-spin target (), all -wave resonance have spin and parity , and statistical spin factor , where is the neutron spin. In contrast, there are two spin/parity values, and , for -wave resonances, for which and 2, respectively. Shown in Fig. 1 are effective reduced neutron widths . For -wave resonances, these are the usual reduced neutron widths which should, on average, be constant. However, for -wave resonances, these effective reduced widths should be, on average, proportional to . Also, according to standard level-density models, the average number of resonances should be proportional to and independent of parity. Therefore, it is expected that there should three times as many - as -wave resonances (i.e., ). Finally, due to the overall larger penetrability for waves and the fact that Pt is near the peak of the - and valley of the -wave neutron strength function, -wave resonances should be much larger than -wave ones at these energies.
These expectations are in qualitative agreement with the data in Fig. 1. For example, it is evident that there is one group of resonances with larger and constant (on average) and another, more populous group, having smaller effective reduced neutron widths with sizes (on average) proportional to . We were able to make firm -wave assignments to almost all resonances in the former group by virtue of their asymmetric shape (due to interference with the comparatively large -wave potential background) in the total cross section. Such resonances are depicted by solid symbols in this figure. Also, we were able to make a few firm (and hence -wave) assignments under the assumption that the total width does not vary by more than a factor of three. These resonances are marked by X’s in Fig. 1. Unfortunately, both techniques for assigning resonance parity cease to work when the neutron width becomes too small. Nevertheless, it is obvious from this figure that if an analysis threshold shown by the solid curve is used, there is only an extremely small chance that a -wave resonance will be included. However, it is still likely that some -wave resonances are below this threshold, so this fact must be accounted for in any subsequent analysis. These data represent some of the best ever acquired for the purpose of testing RMT; by virtue of the excellent sensitivity for observing small resonances, the good separation of - from -wave resonances, and the number of firm parity assignments. Even so, it is vital to realize that a pure and complete set of -wave resonances still could not be obtained.
To avoid systematic errors, these experiment facts must be incorporated into the analysis technique. These problems affect , , and resonance-spacing data in different ways, so each will be discussed separately below.
3 Testing the PTD with data
The maximum-likelihood (ML) technique is most often used to test whether data are consistent with the PTD because it is statistically efficient. Because the PTD is a special case () of the family of distributions, it is assumed that reduced neutron widths are distributed accordingly and the ML method is used to estimate the most likely value of . Given the shape of the distribution as a function of , neglecting the effect of missed -wave resonances below threshold will, in general, lead to a falsely large value of from the ML analysis. Conversely, including even just a few p-wave resonances in an -wave set will, in general, lead to a falsely small value of .
Typically, these difficulties have been surmounted by using an energy-independent threshold as an integral part of the ML analysis, implicitly assuming that all -wave resonances above threshold have been observed. We recently have shown [4] that an energy-dependent threshold (on ) of the form , where is a constant factor and the neutron energy, offers three advantages compared to using an energy-independent threshold. First, p-wave contamination is eliminated equally effectively at all energies. This is because the penetrability factor for p waves differs from waves by (to good approximation) a factor of . Second, experiment thresholds have approximately this same energy dependence; thus possible diffusiveness of the instrumental threshold can be surmounted equally effectively at all energies. Third, statistical precision of the analysis is maximized by allowing the largest p-wave-free set of -wave resonances to be included.
The analysis technique was described in Refs. [4, 8]. Each resonance has an energy and reduced neutron width . The probability density function (PDF) for a distribution is given by:
| (1) |
where is the gamma function for , , and is the average reduced neutron width.
The joint PDF for statistical variables and is defined in a 2D region defined by inequalities and , where is an upper limit of energies . The expression for this PDF reads
| (2) |
The factor , ensuring a unit norm of , is - and -dependent. The ML function was calculated from all pairs within the specified region obtained from the experiment. Specifically,
| (3) |
One problem with many previous tests of the PTD is that they were made using data from nuclides near the peaks of the p- and valleys of the -wave neutron strength functions. As a result, neutron widths for the two parities are nearly equal and hence it is very difficult, if not impossible, to obtain a pure -wave set spanning a sufficiently wide range of neutron widths to be useful for testing the PTD. For this reason, it is much better to work with nuclides near the peaks of the - and valleys of the p-wave neutron strength functions. We recently have made measurements on several such nuclides; 147Sm and 192,194,195,196Pt.
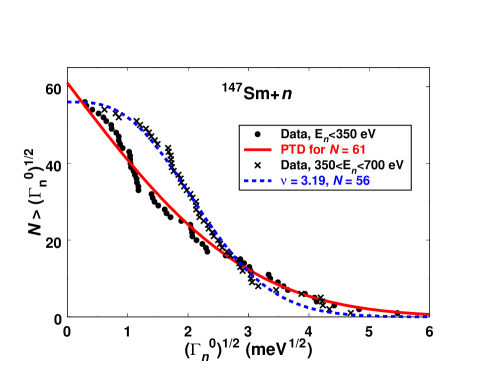
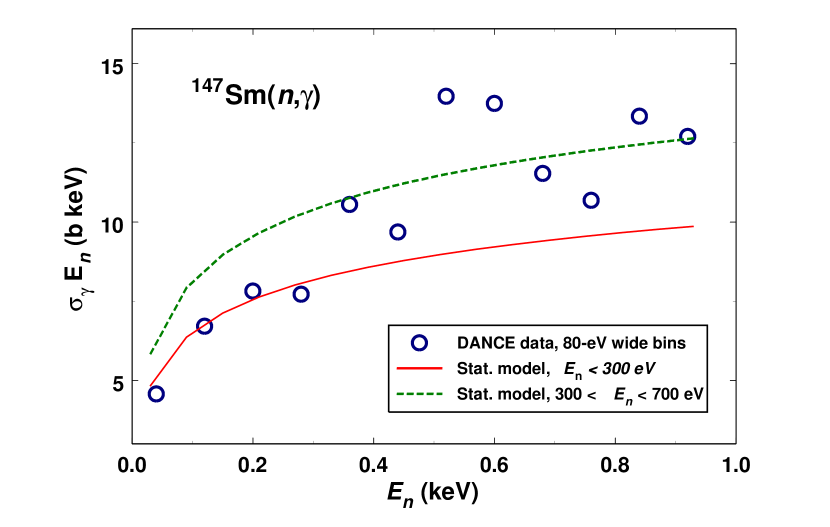
Our 147Sm() measurements [3] were made using the Detector for Advanced Neutron Capture Experiments (DANCE) [21] at LANSCE. One problem working with odd-A nuclides is that there are two possible -wave spin states ( and 4 in the case of 147Sm), and performing the best test of the PTD requires knowing all the resonance spins. Using -ray multiplicity data obtained with DANCE, we developed [3] and improved [22] an new method for separating the two -wave spins, and hence determined spins for nearly all observed resonances for keV. This allowed us to use the combined and 4 data to test the PTD. As shown in Fig. 2, the surprising result was that the data changed from agreeing very well with the PTD () for resonances below 350 eV, to significant disagreement with the PTD () for resonances within the next 350 eV. This change occurs at the same energy as a previously observed [23] non-statistical behavior in the -particle strength function ratio in this nuclide.
Our 192,194,195,196Pt data [4] were taken at ORELA. Neutron capture and total cross sections for isotopically-enriched samples were measured using a pair of C6D6 detectors and a 6Li-loaded glass detector, respectively. The neutron total cross section for a natPt sample also was measured. Resonance parameters were determined from a simultaneous -matrix analysis of the nine sets of capture and total cross sections. Parameters for a total of 1264 resonances were determined, 631 of which could be assigned as wave, accounting for nearly all resonances above the thresholds used in the ML analyses. The 195Pt data were excluded from the main ML analysis because spins could not be determined for enough resonances. The 192,194Pt data each exclude the PTD by nearly three standard deviations ( and , respectively). Results for 196Pt were consistent with 192,194Pt, albeit with reduced statistical precision () due to the smaller number of resonances observed for this isotope. Combined in a very conservative manner, the 192,194Pt data exclude the PTD with at least 99.997% confidence.
4 Testing the PTD with data
The total radiation width for a neutron resonance is the sum of partial widths for the different channels by which the capturing state can decay by emission, . According to RMT, partial widths follow the PTD (). In contrast to the neutron case where there is only a single open neutron channel (elastic scattering) at the relevant energies, there are many open channels through which decay can proceed. Due to the properties of distributions, in the simplest model total radiation widths are predicted to follow a distribution with degrees of freedom given by the effective number of independently-contribution channels, . As , distributions are predicted to be very narrow. Moving beyond this simplest theory requires detailed simulation of the partial radiation widths for primary transitions, which in turn requires accurate knowledge of the relevant level densities and photon strength functions. On the other hand, because distributions are much narrower than the PTD, it might be easier to detect deviations from theory, especially given the limited number of resonances typically available.
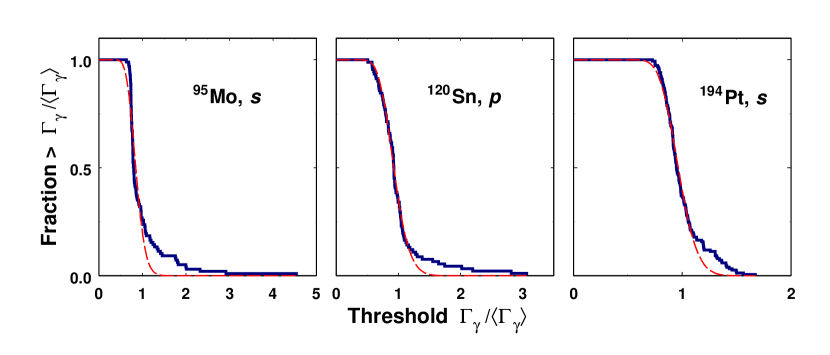
Comparisons [25] we have made to date using our ORELA data for Pt isotopes indicate that measured distributions are broader than those predicted using standard photon-strength-function and level-density models. In addition, as shown in in Fig. 3 distributions for several nuclides measured at ORELA appear to contain extra tails. Although we have observed that simulations within the framework of the nuclear statistical model can lead to significant differences from distributions predicted by the simplest model, we have been unable to simulate tails as large as those shown in Fig. 3. Hence, these tails may be the sign of non-statistical or collective effects.
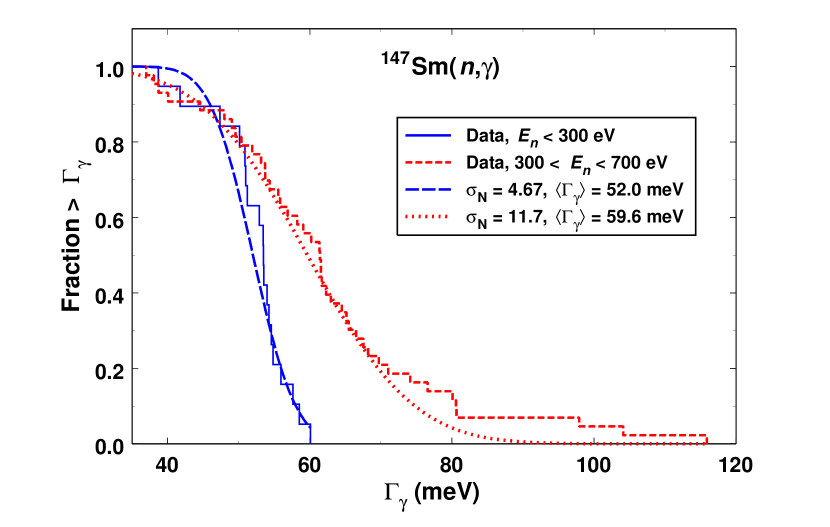
Also, as we very recently reported in Ref. [7] and illustrated in Fig. 5, both the average total radiation width and the width of the distribution increase rather abruptly near eV for resonances in 147Sm. The median (variance) test [26] indicates the null hypothesis that medians (variances) of the distributions in the two energy regions are the same can be rejected at the 99.8% (99.9%) confidence level. In addition, the Smirnov and Cramer-von Mises two-sample tests [26] reveal the null hypothesis that data in the two energy regions were sampled from the same distribution can be rejected with and confidence, respectively. In essence, all these statistical tests indicate that the change in the distribution evident in Fig. 5 is highly statistically significant.
Theoretical interpretation of this change may be aided by estimation of distribution parameters for the two regions. To this end, we used the ML method. As noted above, in the simplest model data are expected to follow a distribution with many degrees of freedom, typically . For such large values of , a distribution is very close to Gaussian in shape. One advantage of using a Gaussian rather than distribution for the analysis is that data uncertainties can easily be included [27].
Therefore, we used the ML technique described in Ref. [27] to estimate most likely values for the means and standard deviations of the distributions in the two energy regions. Resulting ML estimates are , , and , , for the lower- and upper-energy regions, respectively. Hence, these ML results, which take into account the measurement uncertainties, also indicate that distributions in the two energy regions are significantly different. Translated to distributions, these ML results yield and for the distributions in the lower and upper energy regions, respectively.
These changes in the 147Sm distribution occur at the same energy that the neutron-width distribution changes for resonances in this nuclide, as described in Section 3 above. Furthermore, as shown in Fig. 5, these changes in the and distributions appear to be mirrored by increases in the both the average 147Sm() cross section and fluctuations around the average near this same energy. Explaining these energy-dependent effects represents a significant challenge to theory.
5 Testing RMT with the NDE
The NDE [9, 10] is a set of 157 proton and 1250 neutron resonance energies consisting of 30 sequences in 27 different medium-weight and heavy nuclides. The ensemble was assembled to test predictions of RMT. Fluctuation properties of resonance energies in the NDE were found to be in remarkably close agreement with RMT predictions for the Gaussian orthogonal ensemble (GOE). Although there have been several other successful tests of RMT using nuclear resonances, the NDE is perhaps the most important because, as stated in Ref. [2], “As a result of these analyses, it became generally accepted that proton and neutron resonances in medium weight and heavy nuclei agree with GOE predictions.” Hence the NDE routinely is cited as providing striking confirmation of RMT. We have carefully analyzed both neutron-width and neutron resonance-energy data in the NDE and found significant disagreements between these data and RMT predictions. These analyses, results, and an overall assessment of the NDE are described in the next three subsections.
5.1 Testing the PTD with the NDE
RMT for the GOE predicts that data follow the PTD. Reduced neutron widths have been reported for a subset of 1245 resonances in the NDE of Ref. [10], consisting of 14 to 178 measurements for 24 nuclides. Details of the analyses, nuclides included, primary references, number of resonances in each, etc. can be found in Ref. [8].
Analyzing a data set comprised of many different nuclides such as the NDE involves at least two additional potential pitfalls to those mentioned in Section 2 above. First, apparent sensitivities of the various experiments from which the NDE was derived differ by several orders of magnitude. Therefore, if the entire NDE were analyzed as a single set (as was done in Ref. [10]), to avoid systematic error the threshold must be at least as high as the highest apparent individual threshold. However, doing this will exclude so many resonances from the analysis that the statistical precision of the result will be substantially reduced, and hence at least partially negate the reason for assembling the NDE in the first place. Therefore, separate thresholds should be used for each of the NDE nuclides. Second, the average reduced neutron width depends on the shape of the distribution, and this shape may be different for each NDE nuclide. Therefore, it is important to include separate parameters for each NDE nuclide. For these reasons, separate ML analyses must be made for each NDE nuclide, and then the combined result subsequently compared to theory.
For the initial analyses, thresholds just below the smallest observed resonance for each NDE nuclide were used. Because experiment thresholds might not be precisely sharp, it is expected that the resulting values would be systematically a bit large. However, almost all values were less than the PTD value of 1.0. The weighted average of results at minima thresholds for the 24 nuclides in the NDE is , which is 3.8 standard deviations smaller than the predicted result of . Hence these data reject the PTD with a statistical significance of 99.98%. A value significantly less than the PTD could be a sign of interesting physics. However, a more likely explanation is that the NDE contains sizable p-wave contamination.
That the NDE is contaminated by p-wave resonances is evident in many ways. First, many resonances in the NDE have been identified as -wave or of uncertain parity. For example, in Ref. [28], 58 -wave resonances in 232Th were assigned on the basis of -cascade information, 13 of which are in the NDE. One of these 13 resonances also is known [29, 30] to be -wave by its observed parity-violating asymmetry. For over half (14/24) of the NDE nuclides we analyzed, these resonances account for 5% or more of the total, for 10 of the 24 they are at least 10%, and in the three worst cases about 35%. Second, as explained in Ref. [8], that many of the NDE resonances are, in fact, p wave is reinforced by the behavior of the values from the ML analyses as functions of threshold. In many cases, systematically increases with threshold before gradually stabilizing. This is just the behavior expected for a population of -wave resonances contaminated by p-wave resonances.
As explained in Ref. [8], removing effects of these p-wave resonances from the NDE ML analyses is a simple matter of raising thresholds until they are above the largest previously identified p-wave resonance and/or stabilizes as a function of threshold. The resulting weighted average for the NDE is still in conflict with the RMT prediction for the GOE, albeit in the opposite direction from the result using the lowest thresholds: , corresponding to a confidence level of 98.17% for excluding the PTD. Hence, when the NDE is cleansed of p-wave resonances, the data still reject the PTD with high confidence. Furthermore, because our 147Sm and 192,194Pt results show that can be on either side of the PTD value of 1.0, it seems likely that any analysis from which an average is calculated from results for several nuclides may underestimate deviations from the PTD.
In the next subsection, we describe our analysis of the NDE using the statistic. This analysis illustrates several more related problems in the NDE.
5.2 Reexamining for the NDE
The initial claim of excellent agreement between the NDE and RMT was based mainly on the resonance-spacing statistic. Because our analyses described above indicated that the neutron-width data in the NDE do not agree with the PTD, we also examined the statistic for this subset of the NDE data. We will refer to this subset of 1246 neutron resonances as the original NDE, or set . There are 1246 energies but only 1245 neutron widths because one resonance in 182W has a reported energy but no width.
As mentioned above, several of these NDE resonances have been assigned as either definite or probable -wave resonances. Specifically, definite -wave assignments, in a primary reference and/or one of the two compilations [31, 32], include the following 35 resonance energies (in eV): 3333.0 (114Cd), 1702.8 (172Yb), 1634.6 (174Yb), 73135, 100220 and 125130 (64Zn), 196.13, 391.53, 400.86, 411.62, 420.92, 476.30, 540.09, 573.46, 764.7, 820.9, 850.5, 1114.9, 1204.1, 1372.54, 1387.7, and 1848.6 (232Th), and 263.91, 454.1, 555.9, 732.5, 778.8, 1028.6, 1131.1, 1298.1, 1316.5, 1532.3, 1565.1, 1795.5, and 2070.9 (238U). The original NDE after exclusion of above-specified 35 resonance will be referred to as a corrected NDE, or subset .
5.2.1 statistic
Given a selected interval of neutron energies , the statistic is conventionally defined as
| (4) |
Here, is equal to the number of the resonances in the interval , while , where is an expectation value of spacing between energies of neighboring resonances.
Practical implementation of the statistic according to Eq. (4) faces the problem that, except for the maximum value of for a given set of data, there is no unique definition of . That is, except for the maximum value of , there are at least two pairs of and for which can be calculated. To overcome this difficulty, we used a modified statistic, referred hereafter to as . For -th sequence consisting of energies of consecutive resonances of a given nucleus we introduced a function of integer argument and integer parameter satisfying a condition that . Specifically, for
| (5) |
while for or the function equals zero.
Following the approach of Refs. [9, 10], all the individual values for a given were averaged over the range of possible values to obtain an averaged statistic, , which is applicable to any subset of the full set of the available experimental NDE sequences for individual nuclei:
| (6) |
Quantities represented by right-hand sides of Eqs. (4) and (5), as well as the average quantity defined by Eq. (6), depend implicitly on resonance energies. In the spirit of the GOE model, these energies are assumed to be random variables, so that functions according to Eqs. (4), (5) and (6) are indeed statistics. Hereafter, depending on the context, we will refer them either to as functions or statistics.
5.2.2 Calculation of confidence limits
Although the NDE is a fairly large data set, statistical uncertainties in can still be substantial. To evaluate these uncertainties and assess whether these data are in agreement with theory, we employed a Monte Carlo technique to generate a large number (typically 5 to ) of artificial functions using energies generated by the GOE model for all . In this way, we constructed an empirical probability distribution function for at each value of . We compared these simulations to the values calculated from the NDE data to assess whether the NDE is compatible with predictions of the GOE model.
Our implementation of the Monte Carlo technique used GOE matrices. Hence, the independent elements of each matrix were statistically independent normally distributed random variables with zero mean. Variances of the off-diagonal elements were equal to a common value , while those of the remaining elements were equal to .
Generating energies involved the following steps:
-
1.
For a given we chose a value , adjusting for convenience the variance to a value . The largest value of used was less than 1000.
-
2.
We created a random GOE matrix of size and determined its eigenvalues in ascending order, i.e. .
-
3.
Using the expression
(7) where , we transformed the set of eigenvalues to a modified set . This transformation ensures that values of for are distributed uniformly.
-
4.
Finally, from a part of values of , centered around zero, we created neutron energies. For this purpose we adopted a prescription for , where satisfies a condition that and that the length is equal to that for the -th sequence of the NDE of interest.
In this way, we simulated a large number (typically 2 to ) of values, for which the number and the lengths of the sequences are identical to those belonging to either subset or , and from the distributions of these values we calculated confidence limits for .
Through further extensive Monte-Carlo simulations we verified that the limited sizes of the matrices used resulted in less than 0.2% systematic uncertainty in estimating confidence limits.
5.2.3 Results
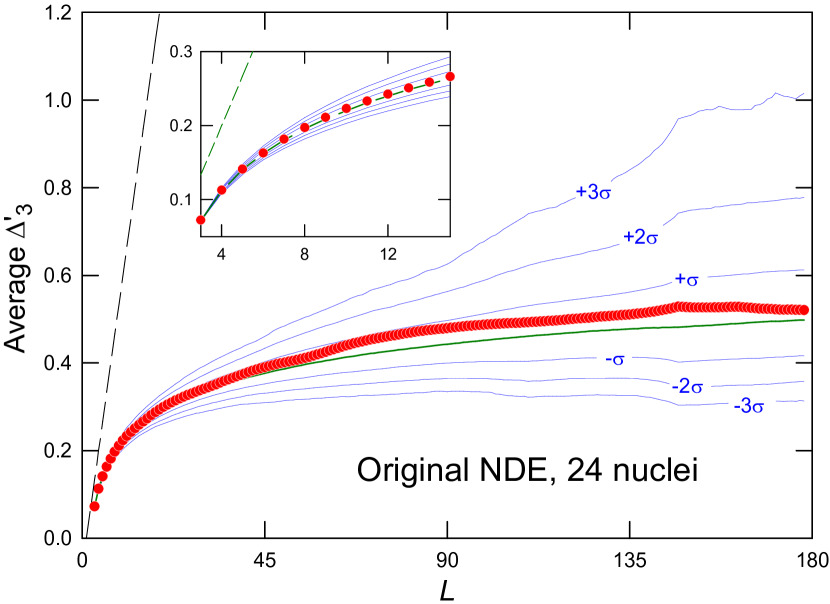
Results of our analysis for case are shown in Fig. 7, where the function is plotted together with confidence limits of . This figure indicates that the original NDE is in remarkably good agreement with GOE predictions for the entire allowed region , essentially confirming the results claimed in Ref. [9].
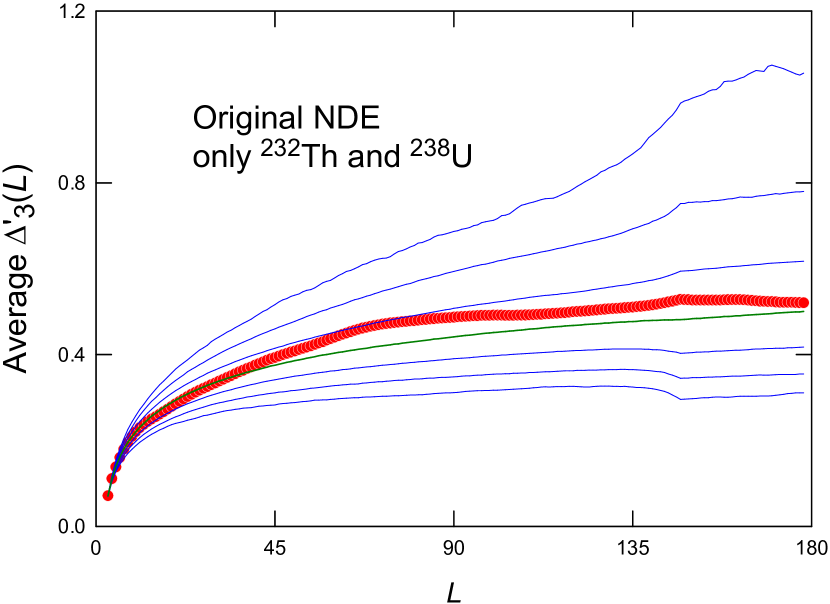
The longest sequences of neutron resonance energies in the original NDE belong to 232Th and 238U. Results of our analysis limited to these two nuclides are illustrated in Fig. 9. Again, agreement between the data and GOE predictions is excellent.
However, when 232Th and 238U are removed from the original NDE, the agreement disappears, as shown in Fig. 9. In this case, validity of the GOE model can be rejected with a confidence level greater than 99.99%. This conclusion is not at variance with the results shown in Figs. 7 and 9, but reflects the large weights with which 232Th and 238U, by virtue of their comparatively long sequences, contribute to . For example, for this weight is greater than 80%.
On the other hand, regarding the average statistic , the data from the original NDE as a whole are inconsistent: one subset of these data is in good agreement with the GOE model (see Fig. 9), while the complement to this subset is in sharp disagreement (Fig. 9). This inconsistency was not be revealed before, as previous analyses [9, 10] were not undertaken separately for subsets of the NDE.

To ascertain whether the results shown in Fig. 9 might be due to the inclusion of -wave resonances, we analyzed the data from the corrected NDE after additional exclusion of 232Th and 238U. Results of the analysis led to the same conclusion as in the previous case: the validity of the GOE model could be rejected with statistical significance of 99.99%. As the excluded -wave resonances accounted for only 1.5% of the total number of resonances (of the corrected NDE, excluding 232Th and 238U), this result was not too surprising.
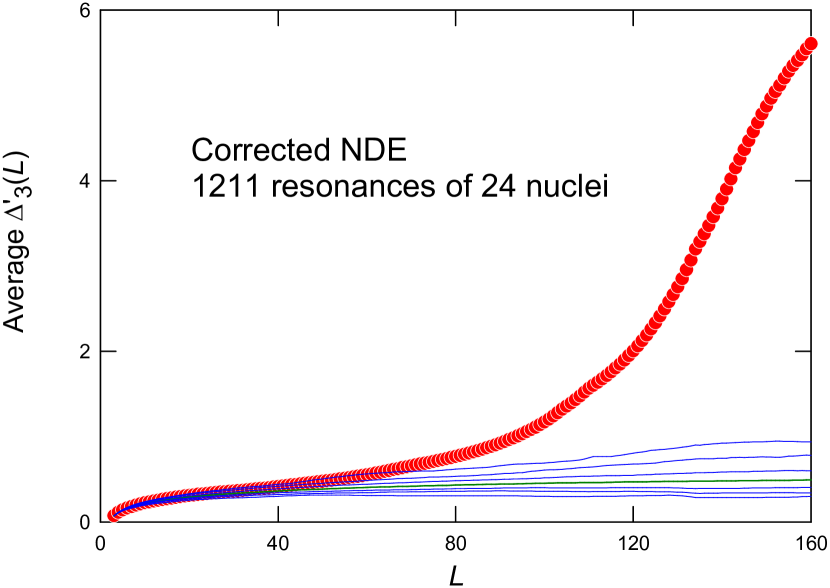
Results of analyzing the full corrected NDE, are illustrated in Fig. 7. As can be seen from this figure, exclusion of firm and probable -wave resonances from the NDE leads to categoric disagreement with predictions of the GOE model for values as small as 70. This disagreement persists even if analysis is further restricted to only 232Th and 238U resonances of the corrected NDE, with unacceptable disagreement again beginning at .
It could be argued that the disagreement shown in Fig. 7 is due to missing -wave resonances and/or inclusion of -wave resonances in the corrected NDE. It is well known that it becomes increasingly difficult to correctly determine resonance parity with increasing energy. Therefore, we repeated the analysis of the corrected NDE after shortening each sequence by factor of 0.5. In this case we found that at the average quantity still deviates appreciably from its expectation value, by . Additional Monte Carlo simulations led to the conclusion that within the GOE model the probability exceeds a confidence limit of 3.2 at one value of is still very small, 0.04 %. So, even with such a drastic reduction the data do not support the GOE model. Acceptable agreement was achieved only at values .
5.3 Overall assessment of the NDE
Given that our analyses of neutron widths as well as energies for the same NDE resonances reveal many disagreements with predictions of RMT for the GOE, it is obvious to ask why the full NDE was found to be [9, 10] in excellent agreement with this theory. As detailed in Ref. [8], the most likely explanation has to do with the fact that many of the data in the NDE were selected using this same theory. Almost all the neutron data in the NDE were obtained by the group at Columbia University. In their papers, they readily admit that they did not have any specific tests for separating - from -wave resonances. Hence, they routinely used measures derived from RMT for the GOE to perform these separations. Given the numbers of total and assigned -wave resonances involved, there typically were astronomically large (e.g. in the case of 232Th [8]) numbers of possible “-wave” sets from which to choose. Hence, it does not seem surprising that at least one set could be found which agrees with the statistics predicted by RMT for the GOE tested in Refs. [9, 10]. In other words, the NDE likely demonstrates that it is possible to take an incomplete data set and make it agree with GOE statistics by also making it impure.
With the experiment techniques available at the time, it was just not possible to obtain a complete and pure set of -wave resonances, especially considering that many of the NDE nuclides are very near the peaks of the - and valleys of the -wave neutron strength functions. Even with the improvements in experiments over the intervening 40 years, it still is not possible to obtain such a pure and complete set of -wave neutron resonances as the NDE is purported to be. The main problem remains the reliable separation of small (neutron width) - from large -wave resonances. In section 8, we briefly describe some new experiment techniques that have greatly improved the ability to make firm resonance spin and parity assignments. Application of these techniques to nuclides near peaks of the -wave neutron strength function should provide much better data.
6 Other reported deviations from the PTD
As noted above, data for the NDE, 147Sm, and 192,194Pt all exclude the PTD with high confidence. In addition, because the 147Sm and 192,194Pt data demonstrate that can be on either side of the PTD value of , the NDE result, which combines analyses of 24 different nuclides, likely underestimates the probability with which the PTD can be excluded. There have been a few other reported significant deviations from the PTD of which we are aware.
There have been several reports [11, 12, 13, 14] that the lowest energy neutron resonances in 232Th deviate strongly from the PTD. Our ML analysis [33] of the data verifies these reports; the data change from disagreeing () to agreeing () with the PTD over the first two groups of 25 resonances. Hence, data for both 232Th and 147Sm indicate that the shape of the distribution can change in a relatively narrow energy region. As described in Ref. [34], our Pt data also suggest that may depend on energy.
The combined data for five odd-A nuclides also were found [15] to deviate strongly from the PTD despite the fact that very few resonances apparently had been missed. As was the case for 147Sm and 232Th, was found to be significantly greater than 1.0 for these nuclides.
7 Brief overview of theory
Our Pt results have inspired a number of theoretical papers [16, 17, 18], some of which have their roots in earlier publications (e.g. see Ref. [20]). Model calculations [35] also have shown that deviations from the PTD may sometimes occur even when spacing statistics such as do not deviate from GOE predictions. However, these latter calculations were for levels near the ground state where collective effects can be important and hence leave unexplained how such effects can manifest themselves at the relatively high excitations corresponding to typical neutron separation energies.
In Ref. [16] it was proposed that the standard transformation from measured to reduced neutron width, =, may be different for nuclides near the peaks of the -wave neutron strength function. However, analysis [36] of our Pt data showed that the new transformation resulted in increased deviations from the PTD. In addition, this proposal could not explain cases such as 232Th which are near minima in the -wave neutron strength function.
Strictly speaking, RMT predictions are valid only for bound states. Possible deviations related to the “openness” of the system above the particle separation energy were, to our knowledge, first explored in Ref. [20]. Recent models in this vein are described in Refs. [17, 18]. The model of Ref. [17] does not appear to be able to explain our Pt result because the required coupling parameter is times larger than that estimated from our data. The model of Ref. [18] results in width distributions broader than the PTD, in agreement with our Pt data. However, it is unclear whether significant deviations from the PTD would remain if more realistic matrix elements were used. This model also predicts fluctuations larger than the PTD for electromagnetic transitions, in qualitative agreement with our data discussed above.
8 New experimental techniques
New techniques [25, 3, 22, 37] for determining spins and parities of neutron resonances should improve the separation of resonances with differing spins and parities and hence help to overcome what has been the largest barrier to better tests of the PTD. All these new methods make use of information contained in the cascade following neutron capture. It is an old idea [38], but improvements in neutron sources, detectors, and data acquisition apparatus has led to large improvements over previous results. For example, in the case of 95Mo neutron resonances, applying these methods with a single pair of low-efficiency C6D6 detectors increased the number of firm resonance assignments from 32 [39] to 218 [25] in this very difficult case.
9 Summary and Conclusions
We have found significant disagreements with predictions of RMT for the GOE in neutron-resonance data for 147Sm, 192,194Pt, 232Th, and the NDE. The main barrier to more and better tests of theory is reliable separation of - from -wave resonances, but new techniques appear to be well on their way to surmounting this barrier. For neutron resonances, tests involving the PTD appear to be the most sensitive and reliable, largely because experiment limitations can be incorporated into the statistical methods in a straightforward manner. Tests involving resonance-spacing statistics such as those in Refs. [9, 10] appear to have ignored these limitations, and the good agreement between data and theory claimed appears to be due to the fact that many of the data used were selected using the theory being tested. Other tests that are purported to be less sensitive to missing or spurious resonances have been proposed [40], but have been shown [41] to lead to ambiguous results for sample sizes typical of nuclear data.
This work was supported by the Office of Nuclear Physics of the U.S. Department of Energy under Contract No. DE-AC05-00OR22725 with UT-Battelle, LLC, and by Czech Research Plans MSM-021620859 and INGO-LA08015. This work has benefited from the use of the LANSCE facility at Los Alamos National Laboratory which was funded by the U.S. Department of Energy and currently is operated by Los Alamos National Security, LLC, under contract DE-AC52-06NA25396.
References
- [1] C. E. Porter and R. G. Thomas, Phys. Rev. 104, 483 (1956).
- [2] H. A. Weidenmüller and G. E. Mitchell, Rev. Mod. Phys. 81, 539 (2009).
- [3] P. E. Koehler, J. L. Ullmann, T. A. Bredeweg, J. M. O’Donnell, R. Reifarth, R. S. Rundberg, D. J. Vieira, and J. M. Wouters, Phys. Rev. C 76, 025804 (2007).
- [4] P. E. Koehler, F. Bečvář, M. Krtička, J. A. Harvey, and K. H. Guber, Phys. Rev. Lett. 105, 072502 (2010).
- [5] R. W. Peelle, J. A. Harvey, F. C. Maienschein, L. W. Weston, D. K. Olsen, D. C. Larson, and R. L. Macklin, Neutron research and facility development at the Oak Ridge electron linear accelerator 1970-1995, Tech. Rep. ORNL/TM-8225, Oak Ridge National Laboratory, 1982.
- [6] P. W. Lisowski, C. D. Bowman, G. J. Russell, and S. A. Wender, Nucl. Sci. Eng. 106, 208 (1990).
- [7] P. E. Koehler, R. Reifarth, J. L. Ullmann, T. A. Bredeweg, J. M. O’Donnell, R. S. Rundberg, D. J. Vieira, and J. M. Wouters, Phys. Rev. Lett. ??, ?? (2012).
- [8] P. E. Koehler, Phys. Rev. C 84, 034312 (2011).
- [9] R. U. Haq, A. Pandey, and O. Bohigas, Phys. Rev. Lett. 48, 1086 (1982).
- [10] O. Bohigas, R. U. Haq, and A. Pandey, Fluctuation properties of nuclear energy levels and widths: Comparison of theory with experiment, in: Nuclear Data for Science and Techology, edited by K. H. Bockhoff (D. Reidel, Dordrecht, 1983), p. 809.
- [11] P. Ribon, Etudes de Quelques Proprietes Des Niveaux Excites Des Noyaux Composes Formes Par L’interaction de Neutrons Lents Avec 103Rh, Xe, 155,157Gd, and 232Th, PhD thesis, Universite de Paris, 1969.
- [12] L. Forman, A. D. Schelberg, J. H. Warren, M. V. Harlow, H. A. Grench, and N. W. Glass, Thorium-232 neutron capture in the region 20 eV - 30 keV, in: Proceedings of the Third Conference on Neutron Cross Sections and Technology, edited by J. A. Harvey and R. L. Macklin (National Technical Information Service, U. S. Dept. of Commerce, Springfield, Virginia, 1971), p. 735.
- [13] L. Forman, A. D. Schelberg, J. H. Warren, and N. W. Glass, Phys. Rev. Lett. 27, 117 (1971).
- [14] F. Rahn, H. S. Camarda, G. Hacken, J. W. W. Havens, H. I. Liou, J. Rainwater, M. Slagowitz, and S. Wynchank, Phys. Rev. C 6, 1854 (1972).
- [15] R. F. Carlton, S. Raman, J. A. Harvey, and G. G. Slaughter, Phys. Rev. C 14, 1439 (1976).
- [16] H. A. Weidenmüller, Phys. Rev. Lett. 105, 232501 (2010).
- [17] G. L. Celardo, N. Auerbach, F. M. Izrailev, and V. G. Zelevinsky, Phys. Rev. Lett. 106, 042501 (2011).
- [18] A. Volya, Phys. Rev. C 83, 044312 (2011).
- [19] G. Shchedrin and V. Zelevinsky, Resonance width distribution for open quantum systems, 2012, arXiv:1112.4919v2.
- [20] P. Kleinwächter and I. Rotter, Phys. Rev. C 32, 1742 (1985).
- [21] R. Reifarth, T. A. Bredeweg, A. Alpizar-Vicente, J. C. Browne, E. I. Esch, U. Greife, R. C. Haight, R. Hatarik, A. Kronenberg, J. M. O’Donnell, R. S. Rundberg, J. L. Ullmann, D. J. Vieira, J. B. Wilhelmy, and J. M. Wouters, Nucl. Instrum. Methods in Phys. Res. A 531, 530 (2004).
- [22] F. Bečvář, P. E. Koehler, M. Krtička, G. E. Mitchell, and J. L. Ullmann, Nucl. Instrum. Methods Phs. Res. A 647, 73 (2011).
- [23] P. E. Koehler, Y. M. Gledenov, T. Rauscher, and C. Frōhlich, Phys. Rev. C 69, 015803 (2004).
- [24] F. Bečvář, Nucl. Instr. Methods Phys. Res. A 417, 434 (1998).
- [25] P. E. Koehler, F. Becvar, J. A. Harvey, M. Krticka, and K. H. Guber, J. Korean Phys. Soc. 59, 2088 (2011).
- [26] W. J. Conover, Practical Nonparametric Statistics (John Wiley and Sons, New York, 1980).
- [27] M. Asghar, C. M. Chaffey, M. C. Moxon, N. J. Pattenden, E. R. Rae, and C. A. Uttley, Nucl. Phys. 76, 196 (1966).
- [28] F. Corvi, G. Pasquariello, and T. V. der Veen, -wave assignment of 232Th neutron resonances, in: Neutron Physics and Nuclear Data for Reactors and Other Applied Purposes, edited by C. Kousnetzoff (Organisation for Economic Co-operation and Development, Paris, 1978), p. 712.
- [29] C. M. Frankle, J. D. Bowman, J. E. Bush, P. P. J. Delheij, C. R. Gould, D. G. Haase, J. N. Knudson, G. E. Mitchell, S. Penttila, H. Postma, N. R. Roberson, S. J. Seestrom, J. J. Szymanski, S. H. Yoo, V. W. Yuan, and X. Zhu, Phys. Rev. C 46, 778 (1992).
- [30] S. L. Stephenson, J. D. Bowman, B. E. Crawford, P. P. J. Delheij, C. M. Frankle, M. Iinuma, J. N. Knudson, L. Y. Lowie, A. Masaike, Y. Matsuda, G. E. Mitchell, S. I. Penttila, H. Postma, N. R. Roberson, S. J. Seestrom, E. I. Sharapov, Y. F. Yen, and V. W. Yuan, Phys. Rev. C 58, 1236 (1998).
- [31] S. F. Mughabghab, Atlas of Neutron Resonances: Resonance Parameters and Thermal Cross Sections Z=1-100 (Elsevier, Amsterdam, The Netherlands, 2006).
- [32] S. I. Sukhoruchkin, Z. N. Soroko, and V. V. Deriglazov, Low Energy Neutron Physics (Springer-Verlag, Berlin, 1998).
- [33] P. E. Koehler, Reduced neutron widths in the nuclear data ensemble: Experiment and theory do not agree, in: CNR*09 Second International Workshop on Compound Nuclear Reactions and Related Topics, edited by L. Bonneau, N. Dubray, F. Gunsing, and B. Jurado (EPJ Web of Conferences, Paris, 2009), p. 05001.
- [34] P. E. Koehler, we never knew you, in: 14th International Symposium on Capture Gamma-Ray Spectroscopy and Related Topics, edited by P. Garrett (World Scientific, Singapore, 2012), p. ??
- [35] Y. Alhassid and A. Novoselsky, Phys. Rev. C 45, 1677 (1992).
- [36] P. E. Koehler, F. Becvar, M. Krticka, H. A. Harvey, and K. H. Guber, Comment on ”Distribution of partial neutron widths for nucldi close to maximum of the neutron strength function, 2010, http://arxiv.org/abs/1101.4533.
- [37] B. Baramsai, G. E. Mitchell, U. Agvaanluvsan, F. Becvar, T. A. Bredeweg, A. Chyzh, A. Couture, D. Dashdorj, R. C. Haight, M. Jandel, A. L. Keksis, M. Krticka, J. M. O’Donnell, R. S. Rundberg, J. L. Ullmann, D. J. Vieira, and C. L. Walker, Phys. Rev. C 85, 024622 (2012).
- [38] C. Coceva, F. Corvi, P. Giacobbe, and C. Carraro, Nucl. Phys. A117, 586 (1968).
- [39] S. A. Sheets, U. Agvaanluvsan, J. A. Becker, F. Bečvář, T. A. Bredeweg, R. C. Haight, M. Krtička, M. Jandel, G. E. Mitchell, J. M. O’Donnell, W. E. Parker, R. Reifarth, R. S. Rundberg, E. I. Sharapov, I. Tomandl, J. L. Ullmann, D. J. Vieira, J. M. Wouters, J. B. Wilhelmy, and C. Y. Wu, Phys. Rev. C 76, 064317 (2007).
- [40] L. Leviandier, M. Lombardi, R. Jost, and J. P. Pique, Phys. Rev. Lett. 56, 2449 (1986).
- [41] C. R. Bybee, G. E. Mitchell, and J. J. F. Shriner, Z. Phys. A 355, 327 (1996).