Electronic structure near quantum critical point
Abstract
We studied the evolution of the electronic structure across the quantum critical point in V doped Cr employing high resolution photoemission spectroscopy. Experimental results exhibit signatures of pseudogap and orbital Kondo resonance peak at low temperatures for all the compositions studied suggesting a scenario of spin density wave quantum criticality corresponding to orbital Kondo effect. The pseudogap and the Kondo peak gradually reduces with V doping but remains finite at the quantum critical point indicating their relevance in widely discussed quantum phases in correlated electron systems. The spectral lineshape near the Fermi level exhibit dependence evidencing deviation from Fermi liquid behavior.
pacs:
75.40.-s, 75.30.Fv, 75.47.Np, 79.60.-iQuantum phase transition sachdev , the quantum fluctuations induced phase transition at zero temperature, has attracted a lot of interests due to its implication in various interesting electronic properties such as Kondo effect, heavy fermion behavior, superconductivity etc. Usually, a non-thermal control parameter such as pressure, magnetic field or composition is varied to achieve the quantum critical point friedemann . Different studies on wide range of materials in the vicinity of quantum critical point shows the breakdown of Landau’s Fermi liquid theory, particle-hole asymmetry etc.Anderson ; RaviEPL Probing microscopic origin of such novel phenomena is often hindered by complexity of the materials involved. Recently, it was shown that quantum phase transition can be achieved yeh in elemental Cr by V substitution. Cr is an incommensurate spin density wave-type antiferromagnet below a transition temperature, = 311 K Fawcett . gradually reduces with V substitution and becomes zero around 3.5% V concentration, which is defined as quantum critical point (QCP) due to the finding of non Fermi liquid behavior in the electronic properties. These experimental results were interpreted considering the pinning of the Fermi level, at the minimum of the electronic density of states (DOS) bandstructure and importance of the antiferromagnetic spin fluctuations spinfluc1 ; spinfluc2 .
Enormous efforts (both experimental and theoretical) have been put forward to understand the underlying physics exhibiting varied scenario even in the parent compound, Cr such as suggestion of multiple gaps in an infrared reflectivity study boekelheide , presence of pseudogap in a theoretical study pepin , orbital Kondo resonance in a scanning tunneling spectroscopic study Yu ; Yuprb etc. Conflicting scenarios such as Kondo interactions, electron-phonon coupling, Shockley-type surface state formation, etc. have been proposed to capture the complex electronic properties of Cr wiesendanger ; donath ; CrAPL ; klebanoff ; gewinner . Photoemission studies indicated two back-folded band below in the incommensurate state and one back-folded band in the commensurate phase review1 ; review2 ; review3 ; schafer . The incommensurability in the antiferromagnetic phase was found to increase with increasing V content krupin . Signature of non-Fermi liquid behavior was not detected in this study with an energy resolution of 30 meV krupin suggesting necessity of better experimental conditions to probe the behavior near QCP. Here, we employed high energy resolution in the photoemission spectroscopy to probe the electronic structure around quantum criticality in V-doped Cr. The experimental results exhibit signature of a pseudogap and a Kondo resonance peak in Cr that persists across the quantum critical point. The evolution of the spectral DOS at with V doping is consistent with the bulk results yeh . The lineshape of the low temperature spectral function exhibit evidence of non-Fermi liquid behavior.
The samples of V-doped Cr were prepared by congruent melting of stoichiometric amount of Cr and V in a high purity argon atmosphere using an water cooled arc-furnace and the homogeneity was achieved by long sintering. The V concentration was determined by energy dispersive analysis of -rays (EDAX) and found to be close to the starting compositions. All the samples were characterized by -ray diffraction (XRD) exhibiting single phase. The magnetic measurements on Cr and Cr0.98V0.02 exhibit incommensurate spin density wave-type antiferromagnetic transition at 311 K and 150 K, respectively. No magnetic transition was observed in 3.5% and 5% doped compositions consistent with the earlier results yeh . The photoemission experiments were performed on scraped surface in a spectrometer equipped with SES2002 Gammadata Scienta analyzer, monochromatic He I ( = 21.2 eV), He II ( = 40.8 eV), Al ( = 1486.6 eV) photon sources and an open cycle helium cryostat LT-3M from Advanced Research Systems. The energy resolutions were fixed to 2.5 meV, 5 meV and 350 meV for He I, He II and Al measurements, respectively. Experiments were carried out at a base vacuum better than 310-11 torr and temperature down to 10 K.
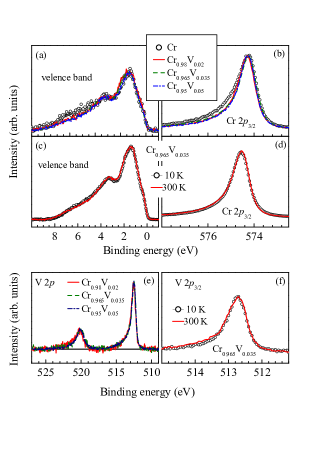
In Fig. 1(a), we show the room temperature valence band spectra of various compositions using Al radiations, which exhibit two distinct peaks around 1 eV and 3 eV binding energies due to and bands CrAPL . The spectral lineshape is almost identical for all the samples studied; this is not unexpected as the V substitution is small and large resolution broadening in the -ray spectroscopy. The Cr 2 core-level spectra of the whole series is shown in Fig. 1(b). The asymmetry in the 2 spectrum of Cr is larger than that of the doped samples. The asymmetry in the core level spectra of a metal arises due to the low energy excitations across associated to the photo-excitation process doniach-sunjik . The decrease in asymmetry with V doping indicates poorer degree of low energy excitation in the doped compositions and/or reduction in bandwidth presumably due to the disorder induced localization of the electronic states disorder1 ; disorder2 . The influence of the change in temperature on the -ray photoemission spectra has been investigated for all the samples. We did not observe any change in the spectral lineshape - a typical case is shown in Fig. 1(c) and 1(d), where we show the valence band and Cr 2 core level spectra of Cr0.965V0.035 at 10 K and 300 K suggesting large energy scale changes to be negligible in these systems.
In Fig. 1(e), we show the V 2 core level spectra exhibiting two peaks around 512.5 eV and 520 eV binding energies corresponding to V 2 and 2 photoemission - spin-orbit splitting is found to be about 7.5 eV and the branching ratio (2/2 intensity ratio) is about 1:2 as expected from the multiplicity of 2 levels. The 2 spectra are found to be almost identical in the whole composition range. Change in temperature does not have significant influence in the spectral lineshape as evidenced in a typical case of the 2 spectra of Cr0.965Cr0.035 in Fig. 1(f).
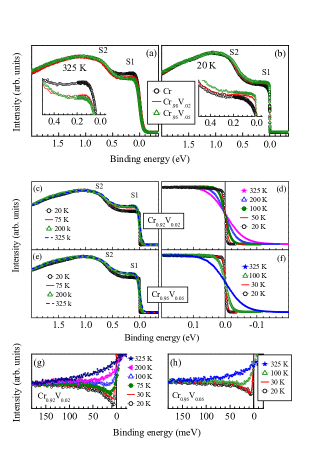
In order to investigate the electronic states close to with better energy resolution, we show the He I valence band spectra for Cr, Cr0.98V0.02, Cr0.95V0.05 at 325 K and 20 K in Fig. 2(a) and 2(b), respectively. The valence band spectra exhibit four features - the features around 0.7 eV (S2) and near (S1) represent the photoemission signals of the surface electronic structure donath ; CrAPL ; klebanoff ; gewinner . S2 possesses -character and S1 has dominant d-character. The bulk features appear at about 1 eV and 3 eV binding energies consistent with the -ray photoemission data. From Fig. 2(a) it is clear that in the paramagnetic state, the intensity of the feature S1 reduces gradually with the increase in V-content, while all other features remains almost similar. This is shown in the inset in an expanded scale. Since, V contains one less electron than Cr, V substitution in Cr reduces electron counts in the valence band. Thus, the decrease in intensity near may be attributed to such effective hole doping. However, the sharp change in intensity with 2% substitution and subsequent weaker change at 5% doping seems anomalous.
The 20 K spectra shown in Fig. 2(b) exhibit a different scenario. While the intensity of S1 is significantly reduced compared to its intensity in the 325 K spectra in every case, the decrease in the doped case is much smaller. Interestingly, the change in intensity near exhibit trend opposite to that found at 325 K. The surface contribution at is known to be negligible in the low temperature spectra of Cr due to the increase in exchange interaction strength leading to a shift of the states above klebanoff . With the increase in V substitution, the magnetic ordering temperature reduces drastically and 5% doped sample does not show magnetic order. This is clearly manifested in Fig. 2(c) and 2(e), where we show the He I spectra of Cr0.98V0.02 and Cr0.95V0.05 at different temperatures. In both the compositions, the feature S1 exhibit reduction with temperature, but the reduction is weaker in Cr0.95V0.05 that leads to an opposite trend in the low temperature spectra.
We now turn to the spectral evolution in the vicinity of the Fermi level with high energy resolution shown in Fig. 2(d) and 2(f) for Cr0.98V0.02 and Cr0.95V0.05 respectively. The lineshape of the spectra at different temperatures indicate evolution akin to a simple Fermi liquid system in both the cases. We have extracted the spectral density of states (SDOS) by dividing the experimental data by the resolution broadened Fermi Dirac Distribution Function at corresponding temperature. The resulting SDOS are shown in Fig. 2(g) and 2(h) for Cr0.98V0.02 and Cr0.95V0.05, respectively. The intensity around in the 325 K data increases gradually with the decrease in binding energy indicating the presence of a peak at or above . The decrease in temperature leads to a reduction in the spectral intensity gradually. Signature of a dip around appears below the antiferromagnetic transition temperature, = 150 K in Cr0.98V0.02. Interestingly, the SDOS of non-magnetic Cr0.95V0.05 also exhibit a dip below 100 K as observed in varieties of other compounds lab6 ; cuprates . In fact, the magnetic moment is negligible at this composition although the carrier density and magnetic susceptibility exhibit a higher value yeh . A careful look at the intensity change indicates that the lowest intensity does not appear at , instead the spectral function exhibit an upturn indicating the presence of a peak above in both the cases.

In Fig. 3, we present the data collected using He II photon energy. Since, valence band of Cr and V-doped Cr primarily consists of 3 electronic states, the change in photoemission cross-section due to the change in photon energy will have negligible influence in the spectral lineshape except a small enhancement in bulk sensitivity csvo . In Fig. 3(a) and 3(c), we show the valence band spectra at different temperatures for Cr and Cr, respectively. As observed in Fig. 2, the intensity of S1 reduces gradually with respect to S2 for both the compositions and the rate of decrease is less significant in the 5% doped sample. In Fig. 3(b) and 3(d), we show the spectra very close to after normalizing them around 200 meV binding energy. The temperature evolution appears quite similar to the He I spectra. The SDOS obtained by dividing the experimental data with the resolution broadened Fermi-Dirac function are shown in Fig. 3(e) and 3(f) for Cr and Cr, respectively. In Fig. 3(e), the intensity distribution around is somewhat flat. A distinct dip appears at 50 K, which is below the antiferromagnetic transition temperature. The SDOS of the 5% doped sample also exhibit a dip near as observed in the He I spectra.
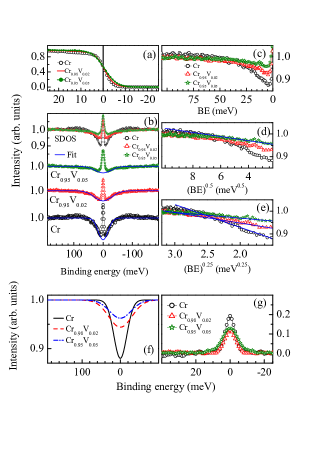
From the above results, it is evident that the low temperature spectral function of all the samples studied exhibit a dip at and a peak. While the dip can be attributed to the long range ordering in the magnetic samples CaSrRuO , the presence of such dip in 5% doped sample is unusual. It is also important to investigate the spectral evolution across the quantum critical point. In Fig. 4, we study the 20 K data of all the compositions in more detail to understand this phenomena. The raw data, the corresponding SDOS obtained by symmetrization and SDOS obtained by the division of the resolution broadened Fermi Dirac function are shown in Fig. 4(a), 4(b) and 4(c), respectively. Subtle change in the spectral lineshape is observed in Fig. 4(a). This is most evident in SDOS shown in Fig. 4(b) and 4(c). Fig. 4(c) exhibits a large dip just below in Cr, which gradually reduces with the increase in V concentration. In addition, a peak like structure is observed at .
Although the symmetrization smears out asymmetry relative to , such an exercise is often useful to inspect the SDOS around that provides a lower bound of the width of the pseudogap and/or peak appearing above . Most importantly, the intensity at are estimated quite accurately in this process. Thus, we investigate the symmetrized SDOS in Fig. 4(b) exhibiting a sharp peak at in addition to the dip representing the pseudogap. We have estimated the pseudogap by fitting the data with a polynomial as shown by solid lines superimposed over the SDOS. These lines are redrawn together in Fig. 4(f). The pseudogap gradually reduces with the increase in V doping. From the bulk measurements, it has been found that the carrier density and magnetic susceptibility exhibit an increase at the quantum critical point, where the magnetic moment and vanishes yeh . The reduction of the pseudogap shown in Fig. 4(f) is consistent with this picture.
The sharp feature at is delineated by subtracting the pseudogap lineshape from the SDOS shown in Fig. 4(b) - the resulting spectra are shown in Fig. 4(g). A sharp peak at is evident in the case of Cr due to the orbital Kondo effect Yu ; Yuprb ; CrAPL . Interestingly, the Kondo resonance peak appears to survive across the quantum critical point and does not become stronger in the paramagnetic phase. A typical Doniach phase diagram, representing competition between Kondo effect and long range order in a correlated electron system, is somewhat different. Here, the Kondo peak is strong in the non magnetic Fermi liquid phase (strong coupled regime) and gradually decreases in intensity as one moves towards the long range ordered phase. The peak often vanishes at the quantum critical point, termed as local quantum criticality localQCP . The persistence of Kondo resonance peak within the long range ordered phase Ce2MSi3 manifests the other scenario, namely, spin density wave quantum criticality. The observation of Kondo peak and long range antiferromagnetic order in low V doped compositions in the present case resemble a similar scenario corresponding to orbital Kondo effect.
In order to probe the origin of non-Fermi liquid further, we plot the SDOS as a function of different exponents of the binding energy, ; linear in Fig. 4(c), in Fig. 4(d) and in Fig. 4(e). Clearly, the best linearity of the lineshape is observed in Fig. 4(e) for all the cases. If disorder play the dominant role, the exponent is found usually 0.5 altshuler ; DDdisorder . In the case of higher degree of magnetic interactions, electron-magnon coupling etc, the exponent found to be higher than 0.5, and often it is 1.5 bairo3 . In the present case, we find much smaller exponent ( 0.25), which indicates significant deviation from the Fermi liquid behavior. To our knowledge, such spectral lineshape is unusual and clearly needs further study for an understanding.
In summary, the high energy resolution employed in this study revealed interesting subtle features in the vicinity of quantum critical point. Experimental data exhibit signature of a Kondo peak in the spin density wave phase that gradually reduces in intensity with V doping across QCP. The existence of Kondo peak within magnetically ordered phase and its persistence at QCP indicates a scenario of spin density wave quantum criticality in the case of orbital Kondo effect. In addition, we observe a pseudogap in Cr, which gradually decreases with increase in V doping. Such a change leads to an overall increase in the density of states at the Fermi level consistent with the bulk results. The spectral lineshape in the vicinity of the Fermi level exhibit dependence - an evidence of the deviation from Fermi liquid behavior.
References
- (1) S. Sachdev, Quantum Phase Transitions (Cambridge Univ. Press, Cambridge, 1999).
- (2) S. Friedemann et al., Nat. Phys. 5, 465 (2009).
- (3) P. W. Anderson, Nat. Phys. 2, 626 (2006).
- (4) K. Maiti, R. S. Singh, and V. R. R. Medicherla Europhys. Lett. 78, 17002 (2007).
- (5) A. Yeh, Y.-A. Soh, J. Brooke, G. Aeppli, T. F. Rosenbaum, and S. M. Hayden, Nature 419, 459 (2002).
- (6) E. Fawcett, Rev. Mod. Phys. 60, 209 (1988).
- (7) K. Hirai, J. Phys. Soc. Jpn 62, 690 (1993).
- (8) J. B. Staunton, J. Poulter, B. Ginatempo, E. Bruno, and D. D. Johnson, Phys. Rev. Lett. 82, 3340 (1999).
- (9) S. M. Hayden, R. Doubble, G. Aeppli, T. G. Perring, and E. Fawcett, Phys. Rev. Lett. 84, 999 (2000).
- (10) Z. Boekelheide, E. Helgren, and F. Hellman, Phys. Rev. B 76, 224429 (2007).
- (11) C. Pépin and M. R. Norman, Phys. Rev. B 69, 060402(R) (2004).
- (12) O. Yu. Kolesnychenko et al., Nature 415, 507 (2002).
- (13) O. Yu. Kolesnychenko et al., Phys. Rev. B 72, 085456 (2005).
- (14) T. Hänke, M. Bode, S. Krause, L. Berbil-Bautista, and R. Wiesendanger, Phys. Rev. B 72, 085453 (2005).
- (15) M. Budke, T. Allmers, M. Donath, and M. Bode, Phys. Rev. B 77, 233409 (2008).
- (16) G. Adhikary, R. Bindu, S. Patil, and K. maiti, Appl. Phys. Lett. 100, 042401 (2012).
- (17) L. E. Klebanoff, S. W. Robey, G. Liu, and D. A. Shirley, Phys. Rev. B 30, 1048(R) (1984).
- (18) G. Gewinner, J. C. Peruchetti, A. Jaéglé, and R. Pinchaux, Phys. Rev. B 27, 3358 (1983).
- (19) F. Schiller et al., Phys. Rev. B 70, 174444 (2004).
- (20) E. Rotenberg et al., New J. Phys. 7, 114 (2005).
- (21) E. Rotenberg, O. Krupin, and S. D. Kevan, New J. Phys. 10, 023003 (2008).
- (22) J. Scher, E. Rotenberg, G. Meigs, S. D. Kevan, P. Blaha, and S. H fner, Phys. Rev. Lett. 83, 2069 (1999).
- (23) O. Krupin, E. Rotenberg, and S. D. Kevan, Phys. Rev. Lett. 99, 147208 (2007).
- (24) S. Doniach and M. Šunjić, J. Phys. C: Solid State Phys. 3, 285 (1970).
- (25) P. W. Anderson, Phys. Rev. 109, 1492 (1958).
- (26) E. Abrahams, P. W. Anderson, D. C. Licciardello, and T. V. Ramakrishnan, Phys. Rev. Lett. 42, 673 (1979).
- (27) V. R. R. Medicherlaet al., Appl. Phys. Lett. 90, 062507 (2007); R. Bindu et al., New J. Phys. 12, 033026 (2010); ibid, Phys. Rev. B 84, 052407 (2011).
- (28) A. Kanigel et al., Nat. Phys. 2, 447 (2006); N. Mannella et al., Nature (London) 438, 474 (2005).
- (29) K. Maiti et al., Phys. Rev. B 73, 052508 (2006).
- (30) R. S. Singh, V. R. R. Medicherla and K. Maiti, Appl. Phys. Lett. 91, 132503 (2007).
- (31) Q. Si, S. Rabello, K. Ingersent, and J. L. Smith, Nature (London) 413, 804 (2001).
- (32) S. Patil et al., Phys. Rev. B 82, 104428 (2010); ibid, J. Phys.: Condens. Matter 22, 255602 (2010); ibid, Europhys. Lett. 97, 17004 (2012).
- (33) B. L. Altshuler and A. G. Aronov, Solid State Commun. 30, 115 (1979).
- (34) D. D. Sarma et al., Phys. Rev. Lett. 80, 4004 (1998); M. Kobayashi et al., Phys. Rev. Lett. 98, 246401 (2007).
- (35) K. Maiti et al., Phys. Rev. Lett. 95, 016404 (2005); ibid, Phys. Rev. B 76, 165128 (2007); R. S. Singh et al., Phys. Rev. B 77, 201102(R) (2008).