The growth of galactic bulges through mergers in CDM haloes revisited. I. Present-day properties
Abstract
We use the combined data-sets of the Millennium I and II cosmological simulations to revisit the impact of mergers in the growth of bulges in central galaxies in the CDM scenario. We seed galaxies within the growing CDM haloes using semi-empirical relations to assign stellar and gaseous masses, and an analytic treatment to estimate the transfer of stellar mass to the bulge of the remnant after a galaxy merger. We find that this model roughly reproduces the observed correlation between the bulge-to-total () mass ratio and stellar mass () in present-day central galaxies as well as their observed demographics, although low-mass (bulgeless) galaxies might be scarce relative to the observed abundance. In our merger-driven scenario, bulges have a composite stellar population made of (i) stars acquired from infalling satellites, (ii) stars transferred from the primary disc due to merger-induced perturbations, and (iii) newly formed stars in starbursts triggered by mergers. We find that the first two are the main channels of mass assembly, with the first one being dominant for massive galaxies, creating large bulges with different stellar populations than those of the inner discs, while the second is dominant for intermediate/low-mass galaxies and creates small bulges with similar stellar populations to the inner discs. We associate the dominion of the first (second) channel to classical (pseudo) bulges, and compare the predicted fractions to observations. We emphasize that our treatment does not include other mechanisms of bulge growth such as intrinsic secular processes in the disc or misaligned gas accretion. Interestingly, we find that the evolution of the stellar and gaseous contents of the satellite as it spirals towards the central galaxy is a key ingredient in setting the morphology of the remnant galaxy, and that a good match to the observed bulge demographics occurs when this evolution proceeds closely to that of the central galaxy.
keywords:
galaxies: formation – galaxies: evolution – galaxies: bulges – galaxies: interactions – galaxies: structure.1 Introduction
In the Cold Dark Matter (CDM) cosmogony, galactic discs generically form inside the growing CDM haloes, while spheroids (bulges and elliptical galaxies) are thought to grow through mergers, by disc secular internal processes, and/or by mis-aligned/perturbed infalling gas (Mo et al., 2010, and references therein). Several arguments collected over the past decades suggest that major mergers of galactic discs produce prominent spheroids that are gravitationally supported by random motions. Spheroids built this way might constitute the present population of elliptical and classical bulge-dominated galaxies (e.g., Toomre, 1977; White, 1978; Gerhard, 1981; Schweizer, 1982; Negroponte & White, 1983; Barnes, 1988; Hernquist, 1992). The demographics of these (early-type) galaxies are thus expected to be tightly connected to their past galaxy merger activity, which is linked to the major merger history of their haloes. An open question is whether the observed morphological distribution of galaxies, globally measured by the bulge-to-total mass () ratio, and its evolution with redshift, is consistent with the halo merger rates predicted by the CDM cosmogony.
In order to answer this question, it is necessary to understand how tight is the relation between the growth of spheroids and the merger histories of their host haloes. The merger-driven growth of spheroids along the evolutionary path of galaxies is more complex than assuming that this growth is proportional to the history of halo mergers with a mass ratio above a given threshold. This caused by both, the non-linear relation between halo mass and stellar mass(e.g., Conroy & Wechsler, 2009; Moster et al., 2010; Behroozi et al., 2010; Firmani & Avila-Reese, 2010; Leauthaud et al., 2012; Yang et al., 2011) and the connection between progenitor gas fractions and spheroid formation in mergers (e.g. Barnes & Hernquist, 1996; Springel & Hernquist, 2005; Governato et al., 2009; Hammer et al., 2009; Hopkins et al., 2009b; Stewart et al., 2009).
During a merger, the bulge in the primary galaxy may grow not only by acquiring stars from the merging satellite (the secondary), but also by violently relaxed stars transferred from the primary disc, and by newly created stars formed in starbursts. In Hopkins et al. (2009a, hereafter H09a), the authors developed analytic prescriptions to describe these physical processes with the aim of predicting the amount of stellar material that is finally deposited into the bulge of the remnant. The parameters of these prescriptions were calibrated to roughly agree with the outcome of a large suite of full hydrodynamical simulations.
Numerical simulations (e.g. Athanassoula, 2005; Avila-Reese et al., 2005; Combes, 2009, and references therein) show that bulges can also grow through intrinsic secular transport of angular momentum and dynamical heating of the stellar disc, giving rise to the so-called pseudobulges. In contrast with classical bulges, pseudobulges have more rotational support and share some of the properties of the inner discs (for reviews see Kormendy & Kennicutt, 2004; Fisher & Drory, 2008). Demographics of bulge types in the very local environment show that low-mass galaxies have small ratios () with spheroids that mostly belong to the pseudobulges category. This has been raised as a potential issue for CDM which would seemingly predict higher fractions of merger-driven bulges, that typically have higher ratios and are of the classical type (Kormendy et al. 2010; Fisher & Drory 2011, hereafter FD11, see also Weinzirl et al. 2009, hereafter W+09). However, when the stellar mergers have a low mass ratio (see Section 3.2), the bulge may actually be predominantly populated by stars in the primary disc that are transferred to the centre and dynamically heated by instabilities induced by the merger. This is the dominant effect in this kind of merger rather than the addition of stars coming from the secondary. It is thus possible that bulges formed in minor/minuscule stellar mergers look like pseudobulges.
Several studies have aimed to establish the connection between the halo merger history with the final galaxy ratio (morphology). Some of these works are based on the semi-empirical halo occupation framework (Stewart et al., 2009; Hopkins et al., 2009b, 2010a), while others are based on semi-analytic models (SAMs) (Khochfar & Silk, 2006; Parry et al., 2009; Benson & Devereux, 2010; De Lucia et al., 2011; Fontanot et al., 2011). The most general results of these works are that: (i) the mapping of halo-halo mergers to stellar galaxy-galaxy mergers is far from linear and strongly depends on mass and redshift, (ii) the inclusion of the galaxy gas content in mergers significantly reduces the final ratio, specially for low-mass galaxies and at higher redshifts, and (iii) the ratio predicted in the CDM scenario increases with stellar mass in a similar way as observations, although there seems to be fewer predicted bulgeless galaxies than observed.
Our goal is to revisit the merger-driven bulge formation in the context of the CDM cosmogony and to compare the results with the observed bulge demographics. Here, we focus only on present-day central galaxies, although the population of satellites is considered along the evolution of central galaxies. The backbone of our model is an approach where, along the mass aggregation histories (MAHs) of haloes taken from the Millennium Simulations (MS, Springel et al., 2005; Boylan-Kolchin et al., 2009), the galaxy stellar and gas masses are assigned according to to semi-empirically inferred average and relations. The galaxy evolutionary tracks are quite different to the halo MAHs and are such that at each there is a transition stellar mass, , above which the growth has halted and below which is actively growing (Firmani & Avila-Reese, 2010). The former happens at earlier epochs for more massive galaxies (archaeological downsizing) and for the latter, less massive galaxies are more active at late epochs (downsizing in specific star formation rate). Note that our approach is different to that of SAMs since instead of modeling the complex galactic physics, the main galaxy properties are assigned at each epoch according to empirical relations.
The paper is organised as follows. In Section 2 we describe the way we estimate the central halo-halo merging time, and our semi-empirical approach to seed baryonic central galaxies into the growing progenitors of the halo population. In §§3.1, we present the stellar merger fractions as a function of mass and redshift and compare them with recent observational estimates. In §§3.2, we give our main predictions related to: (i) the growth of bulges as a function of mass, and the contribution to this growth from the different mechanisms of bulge assembly; and (ii) the demographics of central galaxies at . In §§3.2.3, our predictions are compared with current observational results. Finally, a summary and our conclusions are given in Section 4.
2 Semi-empirical model of bulge growth
2.1 N-body simulations
We use the combined data-sets of the Millennium (MS-I) and Millennium II (MS-II) simulations (Springel et al., 2005; Boylan-Kolchin et al., 2009) that share the same particle number () and were done on the context of a WMAP1 cosmology with parameters: , , , and ; where and are the contribution from matter and cosmological constant to the mass/energy density of the Universe, respectively, is the dimensionless Hubble constant parameter at redshift zero, is the spectral index of the primordial power spectrum, and is the rms amplitude of linear mass fluctuations in spheres at redshift zero. The MS-II has a box size ( Mpc on a side) that is 5 times smaller than the one of the MS-I, and thus it has a mass resolution limit 125 times smaller: . Combining both simulations we can follow up to high redshift () the merger and accretion histories of haloes having a wide mass range at : .
We should note that the WMAP1 cosmological parameters used in the simulations are different to those currently preferred by the 7-year WMAP results. In particular, is lower and is higher in WMAP7 which produces compensating effects in the abundance and clustering of dark matter haloes. Guo et al. (2012) studied the impact of both cosmologies on galaxy formation using a SAM and found that both predict a similar evolution in the galaxy properties since with only a slightly lower autocorrelation function at separations Mpc, particularly for lower masses, and also a lower fraction of satellites. Hence, a slightly lower merger rate between satellites and centrals (producing remnants with lower ratios) would be expected if a WMAP7 cosmology was used instead of the one we adopt here. The difference however is not expected to be significant.
2.2 Subhalo merger histories and central merger times
Since our goal is to analyse the impact of mergers in the growth of the spheroidal component (bulges) of central galaxies, we extract the subhalo merger histories of the principal branches of a population of main subhaloes defined at . A main subhalo is the most massive structure within the hierarchy of subhaloes of a friend-of-friends (FOF) halo, and henceforth we refer to it as a distinct or main halo. We explicitly reject all subhaloes that coexist within a main halo at as being part of its merger history; although they will likely merge with the central object in the future, these subhaloes have no impact for the central bulge at . We also discard mergers within progenitors not associated with the main branch of the host halo. By following this procedure, our analysis is closer to the actual merger history of a population of central galaxies at than an alternative method based on FOF halo merger histories.
We have randomly selected two samples of main haloes at , having 1347 and 1500 members with masses larger than and for the MS-I and MS-II, respectively. Both samples (properly normalized to account for the fractional volume they cover relative to the whole simulation boxes) follow the mass function of the full halo population. For each halo in the samples, we obtain their subhalo merger history using the MS on-line databases111http://gavo.mpa-garching.mpg.de/Millennium/. For details in the construction of these merger trees see Springel et al. (2005).
A given merger event is defined by three epochs:
-
1.
the start of the merger (), i.e., when the subhalo was part of an independent FOF halo for the last time. The halo mass ratio of the merger is defined by using the subhalo and main halo masses at this time, ;
-
2.
the “dissolution” of the subhalo (), i.e., when the merged subhalo at time can no longer be resolved as an independent self-bound structure at the following time ;
-
3.
the coalescence of the subhalo with the centre of the main halo (). To compute this time, we adopt a dynamical friction time formula just after the subhalo has been dissolved in episode (ii) (Binney & Tremaine, 1987):
| (1) |
where encloses information on the subhalo orbit, is the virial velocity of the host, and are the mass and position of the subhalo relative to the host just before dissolution, and is the Coulomb logarithm with the virial mass of the host. We take (Boylan-Kolchin et al., 2008), where is the orbital circularity of the subhalo relative to the halo centre222The subhalo has specific angular momentum and energy , and is the specific angular momentum of a circular orbit with the same energy and with a radius .. The final cosmic time of the halo-halo central merger, , is the sum of ; we consider that is a good approximation to the actual galaxy-galaxy merger epoch.
2.3 Galaxy occupation
Although the merger histories of haloes may provide a basis for determining the morphology of their central galaxies, the impact of a merger does not depend directly on the halo mass ratio at the start of the merger but rather on the central dynamical masses (inner dark matter, gas and stars) that interact in the final stages of the galactic merger.
To follow the stellar and gas mass assembly of galaxies inside the main haloes, as well as the processes that affect the gas and stars during mergers, we use a semi-empirical approach close to that one in Hopkins et al. (2009b, 2010a). This approach yields stellar mass assembly histories that are consistent, by construction, with observational trends. In Appendix A we describe in detail this method and its implementation. In summary, for each present-day main halo in our MS samples we do the following:
-
1.
extract the main branch of its merger tree;
-
2.
seed a central galaxy, the primary, at with stellar and gas masses given by the semi-empirical relations and (Appendix A.1);
-
3.
identify for each halo merger along the main branch () and assign a galaxy to the infalling halo, the secondary, according to and ;
-
4.
either assume that the stellar and gas content of the secondary does not evolve until final coalescence, or follow its evolution (the star formation, SF, and SF-driven outflow processes) by means of semi-analytic recipes (Appendix A.3);
-
5.
compute the galaxy-galaxy (central halo) merging time, , using Eq. (1) for ;
-
6.
estimate the bulge and disc masses of the primary galaxy after coalescence at , using physical recipes calibrated by numerical simulations (Appendix A.2);
-
7.
repeat the process for the central galaxy until reaching , taking care of each merger and updating at each the properties of the central galaxy according to the and relations.
Note that in our scheme galaxies are initially pure discs, and that the only channel of bulge growth is through mergers. We begin testing our model by comparing the evolution of the galaxy merger rate with observational constraints.
3 Results
3.1 Stellar merger fractions
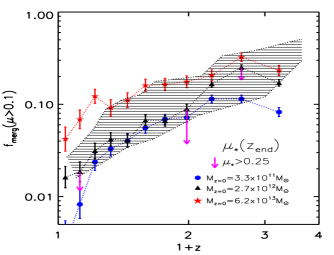
Fig. 1 shows , the fraction of main halo progenitors that suffer at least one central stellar merger with , relative to the total number of main progenitors in a temporal bin of Gyr, i.e., is equivalent to the merger rate per halo and per Gyr. The blue, black, and red lines (circle, triangle and star symbols, respectively) are the median values for three different halo mass bins, defined at , centered in , and , respectively; the error bars are the corresponding scatters of the distributions. The mergers (including their stellar mass ratio) are defined at the time when the secondary galaxy finally coalesces with the central one (). In Fig. 1 we have actually used , which is the maximum redshift used to infer the halo-to-stellar mass relation.
The figure shows that the fraction of progenitors with on-going mergers grows with , which is a trend inherited from the well known growth with of the halo-halo merger rates (e.g., see right panel, Fig. 3 of Fakhouri et al., 2010). We can also see that depends on : galaxies in the most massive haloes have in average a higher fraction of mergers than those in the less massive ones; at the level of halo mergers, this dependence is quite weak.
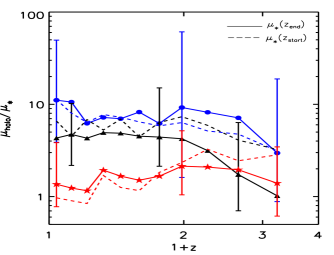
It is interesting to remark, as noted elsewhere (Stewart et al., 2009; Hopkins et al., 2010a), that there is a dramatic change in the merger fraction as a function of mass and depending in which mass ratio is used to define the merger. If we use instead of , there is an overall drop in the fraction of main progenitors with major mergers, and the dependence of on mass increases, specially for the largest masses. This is mainly produced by the shape of the relation: at masses below the knee of this relation, a merger is actually related to a merger (because ), which is more rare than a halo merger; at masses above the knee, where , an opposite behavior is in principle expected. The stellar growth of the merging galaxies from until also contributes to the changes in the merger fraction. To give an impression of this, we show in Fig. 2 the median values of ()/() as a function of for the mergers corresponding to Fig. 1, in the case where the secondaries evolve according to a simple SAM (see Appendix A.3). The MS samples were divided into the same three present-day bins as in Fig. 1. The error bars show the scatters. On average, a ()=0.1 halo merger corresponds to a stellar merger for low-mass galaxies. Interestingly, notice that in our model of secondary evolution, the ratios are roughly the same whether they are measured at the beginning (, dashed lines) or at end of the merger (, solid lines). This means that in average, the secondary increases its stellar mass (semi-analytically calculated) roughly by the same amount as the primary (semi-empirically assigned) during the period from infall to coalescence.
In the case of the baryonic (stars + cold gas) merger-mass ratio, the fraction of haloes having mergers with increases relative to that based on stellar major mergers. This is because the fraction of cold gas is significantly high for galaxies with low stellar masses, specially at high redshifts. A significant fraction of mergers with are actually major baryonic mergers just because the secondaries have larger cold gas fractions than the primaries. Morphology-based techniques for estimating merger rates are more sensitive to baryonic than to stellar mergers, and indeed they find higher merger rates than with pair-based techniques (Lotz et al., 2011).
The shaded area in Fig. 1 encompasses the observed major-merger fractions compiled by Hopkins et al. (2010a); Hopkins et al. (2010b). Most of the observational results do not have a well-defined mass selection and are based on different merger identification criteria. Very roughly, the stellar mass of the primary galaxies covers a range at low redshift, with a larger minimum mass at high . For measurements based on pair samples (pre-merger), , while for measurements based on morphology samples (post-merger), . The lower (upper) bound of the shaded region is dominated by the pair (morphology) samples, and therefore reflects merger fractions with ().
Fig. 1 shows that there is a reasonable agreement between predictions and observations333We note that while our predictions refer to evolutionary tracks of individual galaxies defined at , observations refer to samples above a constant at all epochs. For very massive galaxies, changes little since , but for intermediate and low-mass galaxies, is smaller at higher redshifts. Hence, the prediction for the merger fraction above a certain threshold, constant at all epochs, would be curves slightly steeper than the ones shown in Fig.1, particularly for the intermediate and low-mass bins.. If we limit the mergers to (), then the fraction falls below the lower limit of observational estimates for (magenta arrows for the intermediate mass bin where most galaxies have ()). In a recent study based on the 30-band photometric catalogue in COSMOS, complemented with the spectroscopy of the zCOSMOS survey to define close pairs, López-Sanjuan et al. (2012) report the merger fraction evolution () of massive galaxies, (corresponding to ), for . The predicted merger fraction evolution is in reasonable agreement with these observations.
3.2 Merger-induced bulge growth and its dependence on satellite evolution
After showing that the CDM-based galaxy merger fractions (rates) are roughly consistent with observations, we concentrate now in the growth of bulges during mergers through the following processes (see Appendix A.2):
- (a)
-
the total acquisition of stars from the secondary,
- (b)
-
the violent relaxation and transport to the centre of a fraction of stars in the primary disc, and
- (c)
-
the newly formed stars in central starbursts produced by a fraction of the gas from the merging galaxies (Eq. A2).
To calculate the amount of stars added to the bulge through processes (a)–(c), we estimate the dynamical (stars, gas, inner dark halo) masses of the merging galaxies. As mentioned above, the empirical and relations are used for this whenever is possible. These relations hold for the primary at any point before final coalescence and shortly afterwards. For the secondary however, they are only valid before the start of the halo merger. As the secondary spirals inwards towards the centre, different physical processes alter its stellar and gaseous contents. To study how important some of these processes are, we first analyse the case where the gas and stellar masses in the secondary are “frozen” at the values they had at the time the halo merger started (§§3.2.1), and we later move to the more realistic case of stellar and gaseous evolution in the satellite (§§3.2.2).
In order to use both MS data-sets without introducing a bias due to numerical resolution, we consider only those mergers with in what follows. At this level, both simulations capture the majority of the halo mass contributed by mergers and statistically match each other in their overlapping mass range. This could raise the concern that by missing all mergers with , the growth of bulges might be affected significantly. However, due to the shape of the relation, halo-halo mergers with , imply galaxy-galaxy mergers with at low masses and at large masses (see Fig. 2). Thus, it is only for the most massive systems that some relatively large stellar mergers are being excluded, which are in any case not very relevant since the bulk of the bulge is formed during the largest merger events (see e.g. Fig. 8 of Hopkins et al. 2010a). For massive haloes, we have nevertheless checked the role of including those events with , only possible in the MS-II, and found that the results change very little.


3.2.1 Case 1: non-evolving secondary
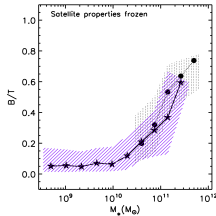
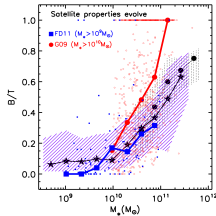
The upper left panel of Fig. 3 shows as a function of () for the central galaxies seeded into the MS-I and MS-II haloes (circle and star symbols, dotted and full-line shaded regions, respectively) in the case where secondaries have, at coalescence, the same and they had when their haloes became subhaloes (extreme SF quenching). Since mergers are more frequent in massive galaxies and since the gas fraction is a decreasing function of , it is expected that massive galaxies will be more prone to develop large bulges. Several studies in the past have shown the behavior depicted in Fig. 3 for a diverse class of models (e.g. Hopkins et al., 2009b, 2010a; De Lucia et al., 2011). Below a few times M⊙, most galaxies have . This is partially an effect of the high gas fractions of low-mass galaxies, which make the bulge growth less efficient.
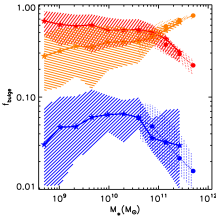
The middle panels of Fig. 3 show the contribution of the three merger-driven processes of bulge growth mentioned above, as a function of . The bulge mass fraction assembled through processes (a), (b), and (c) is shown with orange, red and blue, respectively. In the right panels of Fig. 3, we compare the fraction of stars violently relaxed in the primary (which is a function of the effective dynamical mass ratio, , see Eq. 2) to the fraction of stars acquired from the secondaries (which is equal to the stellar mass ratio ) for each merger. We have divided the events according to the mass of their descendant at : massive galaxies with M⊙ (circles and dotted region) and low-mass galaxies with M⊙ (stars and dashed region).
In the case of no satellite evolution, the bulges of galaxies grow overwhelmingly through stars transferred from the primary rather than by stars acquired from the secondary with (i.e., the stellar mergers are essentially always minor). This is mainly because the secondaries are gas dominated in most of the cases. For the same reason, we see in the middle panel (upper row) that the contribution from starbursts (blue) for galaxies of this mass is also more important than the one from stars in the secondaries (orange). Nevertheless, starbursts never contribute more than to the present-day mass bulge, and they are essentially negligible for massive galaxies due to their very low gas content.
For galaxies with , it is possible to have mergers with , and when these mergers reach , then the dominant channel of bulge growth is stars directly added from the secondary. Thus, the difference between galaxies of different mass in the right panel of Fig. 3 explains clearly the trends seen in the middle panel between the red and orange distributions. This is ultimately connected to the shape of the relation.
3.2.2 Case 2: evolving secondary
The effect of including SF and SN feedback in the evolution of the secondary in its travel to the centre of the primary (Appendix A.3) is explored in the lower panels of Fig. 3. These processes augment the stellar mass of the secondary and reduce its gas fraction. They are of course more relevant when the supply of gas at the start of the merger is high and thus, they considerably affect low-mass galaxies and are nearly irrelevant for massive galaxies. In what follows we take this model as our fiducial one. Note that this case also implies some level of SF quenching since once a galaxy becomes satellite, there is no newly accreted gas.
The ratio of low-mass galaxies is on average slightly higher in this case. Continuous SF increases the stellar mass of the secondary at the time of coalescence relative to the start of the merger, making the contribution from stars in the secondaries to the bulge growth much more significant (orange region, middle panels of Fig. 3). Galaxy outflows from SN feedback attenuate slightly this effect by removing gas from low-mass secondaries. On the other hand, the other two mechanisms (b) and (c), are diminished because is reduced due to the loss of gas (compare right panels of Fig. 3).
Bulge stars formed in merger-induced starbursts contribute on average less than to the total masses of present-day bulges, the largest contribution being in galaxies with masses . H09a and Hopkins et al. (2010a) report a larger contribution, particularly for low-mass galaxies, reaching (see Fig. 14 of Hopkins et al. 2010a). This difference is partly caused by the model in Hopkins et al. (2010a) being closer to our previous model where the gas fractions are not allowed to decrease while the satellite merges. Moreover, we also speculate that an additional cause of the discrepancy is the different treatment of the extrapolation of the gas fraction to lower masses and higher redshifts: we have put an upper limit on based on the maximum observed value in the compilation of observations given by Stewart et al. (2009): , whereas Hopkins et al. (2010a) uses a less restrictive limit (see Appendix A.1). We found that the latter case indeed creates a larger contribution from starbursts in low-mass galaxies, although not to the level reported in Hopkins et al. (2010a). It also creates more destructive mergers (more massive bulges), simply because there is more SF prior to the final coalescence. Because of this, it is hard to increase the contribution from starbursts while at the same time keeping the distribution consistent with observations.
In spite that the contribution of stars from the secondaries is increased compared to the case of no satellite evolution, the contribution from stars violently relaxed in the primary continues to be dominant for . For , and , on average 60%, 55%, and 45% of the final bulge mass was accreted through this channel, respectively. This implies that the smaller the galaxy, the more their bulges share properties of their stellar population with their discs. Notice that this is an important result since it suggests that bulge growth due to secular evolution and that induced by mergers cannot be distinguished only by looking at the similarity of the stellar populations of the disc and the bulge, as is sometimes assumed. There are however some small galaxies with bulges mostly assembled by stars from the secondaries; we can see that this happens when the mergers with dominate (right panel of Fig. 3, lower row).
3.2.3 Comparison with observations: demographics
. The simulation data is shown with histograms and the observational data with stars and circles for G09 and FD11, respectively.
We first remark that the bulge/disc decomposition of observed galaxies and the characterization of a spheroid as classical or pseudo-bulge are very difficult tasks (see e.g., Graham, 2001; MacArthur et al., 2003; Allen et al., 2006; Laurikainen et al., 2007; Fisher & Drory, 2008; Tasca & White, 2011; Simard et al., 2011). There are only a few studies of bulge/disc decomposition applied to volume limited samples that can be used to obtain fair statistics on the distribution as a function of . We compare our predictions with a couple of these studies in the following.
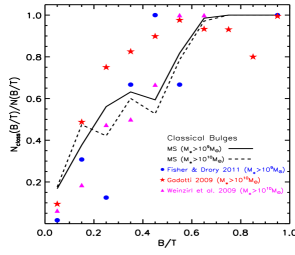
In the lower left panel of Fig. 3 we have included two observational samples. The first (shown in red) is a volume-limited sample of local galaxies from the Sloan Digital Sky Survey (SDSS) with M⊙ taken from Gadotti (2009) (hereafter G09). Since we are modeling central galaxies only, we have removed satellites from this sample by cross-correlating the original sample with the SDSS galaxy group catalog constructed by Yang et al. (2007). We find that of the original sample are satellites, centrals, and the rest are unidentified. We keep the latter two for comparison with our mock sample (we note however that we did not find a significant difference between the distribution of central/unidentified galaxies and that of satellites: the latter is just slightly more peaked at than the former). The median values of for the sample of central galaxies (solid red circles) increase with mass more steeply than our predictions, with median values larger by factors up to 1.5, although the scatter in the observational sample is very large. In particular, there is a significant fraction of observed galaxies with .
The second sample (shown in blue) is from FD11, which is a volume-limited sample of galaxies within the local 11 Mpc volume. We have selected only those galaxies with M⊙ (a total of 99 galaxies). Unfortunately, for this sample we do not know which galaxies are central/satellites. At masses log(/), the observed median values of are close to those of our predictions, well within the statistical scatter. However, at lower masses, the median ratios of our mock galaxies tend to be larger than those of the FD11 sample.
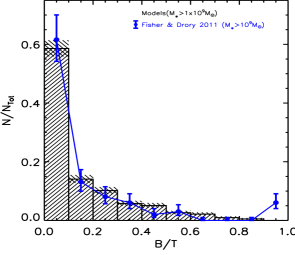
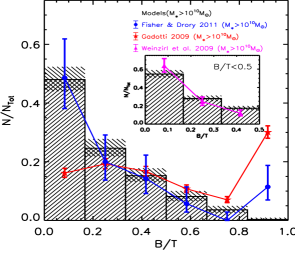
In the top panels of Fig. 4 we show the distribution for galaxies with above a certain threshold (M⊙ and M⊙ for the left and right panels, respectively) for a combination of the MS-I and MS-II samples. To obtain this combined MS sample, we used the latter up to and the former for haloes with higher masses but with a number count renormalized to match the mass function of the MS-II sample in the mass bin where both samples have neither a completeness nor a low number statistics problem. We have checked that the results do not change significantly if the samples are taken separately in their respective mass range of completeness. The statistical error bars shown in the figure are Poissonian, employing the definition given by Lukić et al. (2007): , where is the number of main haloes in a given bin. We also show the observational samples from FD11 (blue), G09 (red) and W+09 (magenta). These panels show what was apparent in the left panels of Fig. 3: the distribution strongly depends on the mass cut-off of the sample. For representative samples with a threshold of M⊙, which are dominated by low-mass galaxies, the fraction of galaxies with is 20% higher than for samples with a threshold of M⊙.
The distribution of our mock galaxies roughly agrees with the one from the FD11 sample; although the latter has a higher fraction of galaxies with and slightly lower with . We recall, however, that the FD11 sample is very local and hence, massive galaxies (with typically high values) are undersampled. These massive galaxies are represented better in the G09 sample, which shows a flatter distribution than the one from FD11, and compared to our results, it has a smaller fraction of galaxies with and a larger fraction of galaxies with . The sample of W+09 has a morphological selection criterion that excludes elliptical galaxies, and this is why we have restricted the comparison to ; for lower values of , this sample has a similar distribution to the one from FD11, and thus, agrees with our predictions. If we assume that bulge-dominated galaxies () correspond to E/S0 morphological types, then the fraction of such types predicted by our model is for . This is slightly lower than what was found observationally in Baillard et al. (2011), where of galaxies are of E/S0 type at (for a sample with a completeness above for ). Our fraction could be larger if one considers that some S0 galaxies actually have (Kormendy & Bender, 2012).
We note that our model is not able to produce galaxies with . For the most massive galaxies, this could be because the primordial galaxies seeded at are assumed to be discs, which implies that some fraction of these initial discs survives even after major mergers. In fact, several pieces of evidence suggest that the most massive galaxies (ellipticals with ) formed very early () and have not grown in mass by in situ SF since then (e.g., Thomas et al., 2005; Collins et al., 2009). If we were to assume that the most massive of our modelled galaxies where spheroids instead of discs at , we would have a few massive galaxies.
We also remark that in our scheme a disc may remain even after a merger with a very large mass ratio, contrary to some SAMs that assume that in these cases all the baryons end in a stellar spheroid (e.g., Parry et al., 2009; De Lucia et al., 2011). It should also be noted that (i) the semi-empirical and relations refer to average trends where additional dependencies on environment are not considered, and (ii) we do not follow the morphological evolution of satellite galaxies. According to the SAM results in De Lucia et al. (2011), the latter is not relevant to obtain galaxies. Instead, the possibility of disc conversion into a spheroid due to intrinsic disc instabilities (see e.g. Parry et al., 2009), which is something we did not take into account in our modelling, contributes to the difference with our predictions. While intrinsic secular evolution is a reasonable mechanism to produce pseudo-bulges in dynamically cold discs, it is a matter of debate if it could transform most of a massive stellar disc into an elliptical galaxy or destroy a small disc embedded into a dynamically hot spheroid.
On the observational side, it is important to notice that in many cases of bulge/disc decomposition in elliptical galaxies, adding a small disc does not improve the statistical significance of a pure bulge model, and a value of is simply assigned. However, several studies provide evidence to argue that most ellipticals contain small discs (e.g. Ferrarese et al., 1994; Lauer et al., 2005).
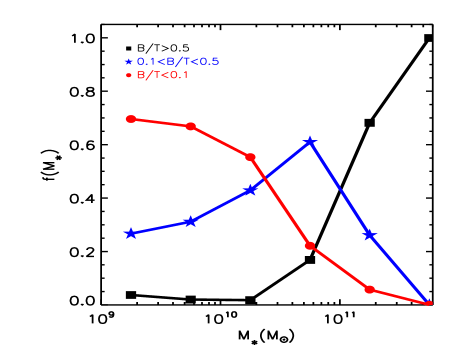
Fig. 5 is another way of showing the predictions of our model. Here we plot the fractions of galaxies in different bins divided according to their ratios: (filled circles, red line), (stars, blue line), and (squares, black line). Roughly, these three groups can be associated to irregulars (types later than Sc), intermediate disc-dominated (Sa to Sc types), and bulge-dominated (E/S0) galaxies, respectively. At , of our model galaxies have , at more than 50% have , while at , galaxies with dominate. These predictions are roughly consistent with estimates of the local morphological mix. The predicted mass fractions of stars contained in discs ( ) is 57% and the rest is in spheroids, consistent with observations. The fraction of stars in galaxies with is , while the fraction of stars (both in the disc and the spheroid) in galaxies with (spheroid-dominated) is .
3.2.4 Comparison with observations: bulge composition
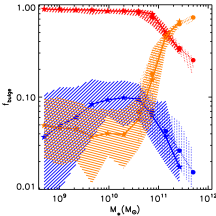
We study the fraction of galaxies whose bulges were assembled mostly by stars from the secondaries (contributing to the bulge mass fraction by more than ). This fraction as a function of is shown in the bottom left panel of Fig. 4 (solid and dashed lines for M⊙ and M⊙, respectively). Because this channel of bulge growth is dominant when stellar major mergers dominate the bulge mass assembly (see right panels of Fig. 3), we will nominally refer to these bulges as classical-like (CL). On the contrary, those bulges where more than 50% of their stars come from the primary will be nominally defined as pseudo-like (PL) bulges. Notice that this division is well motivated: classical (pseudo) bulges are thought to be formed by major mergers (disc secular evolution/minor mergers). Thus, one expects that classical (pseudo) bulges are dominated by stars acquired from the secondaries (primary discs). Moreover, the kinematics of the bulge stars, often regarded as one of the key discriminants between pseudo and classical bulges, are expected to be consistent with this division: (i) bulges whose stars come predominantly from the secondaries will have more random orbital orientations (not necessarily aligned with the disc) and a bias towards radial anisotropy, (ii) bulges where most of the stars were scattered by instabilities resonantly excited by mergers (or formed “in situ” in the starburst) will have the bulge preferentially aligned with the disc, with more rotation, and tangentially biased orbits.
We find that most of the bulges in our mock galaxies with are CL, while the ones of small galaxies are typically PL. For , only of the bulges are CL. The red stars, blue circles and magenta triangles on this figure correspond to the observational samples of G09, FD11 and W+09, respectively, where the bulge class is determined from the light profile (photometry). Our prediction roughly agrees with these observational samples, although it slightly under(over)-predicts the abundance of classical bulges in the intermediate (low) range.
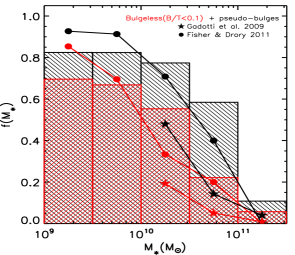
In the bottom right panel of Fig. 4 we show the fraction of galaxies with (which we call “bulgeless”, red histogram) as a function of . For the black histogram we add to this fraction those galaxies with that have PL bulges. The circles and stars correspond to the respective fractions for the samples of FD11 and G09, respectively. The deficit of CL bulges for intermediate values shown in the lower left panel appears in this figure as an overprediction of PL bulges for galaxies with M⊙ by a factor of .
Our model seems to underpredict the fraction of bulgeless galaxies by less than at . At larger masses, the agreement is good although there is an excess of bulgeless galaxies, which actually grows to more than a factor of , once we compare with the G09 sample; compared to the W+09 sample however ( disc galaxies), our predicted fraction is slightly lower. Thus, it seems that the potential problem of too few bulgeless galaxies is related only to galaxies with . We recall that the FD11 sample contains both central and satellite galaxies, while our results refer only to the former. Because centrals have a higher probability to suffer mergers than satellites, with the difference being larger for smaller , we expect that bulgeless galaxies are more frequent in low-mass satellites than in centrals. Indeed, using the Wang et al. (2008) SAM and the H09a procedure to estimate bulge growth, Fontanot et al. (2011) found that, at a given mass, low-mass satellites are more likely to be bulgeless than centrals. Unfortunately, we do not know the fraction of satellites in the FD11 sample, but if we could exclude it, it is likely that the bulgeless fraction would be lower than the one shown in the bottom right panel of Fig. 4.
The predicted fraction of bulgeless galaxies could also decrease if one takes into account the effect of intrinsic disc instabilities, although Fontanot et al. (2011) found that this is only a minor effect for low-mass central galaxies. Despite that this effect is more relevant for massive galaxies, most of these already have large () ratios due to major mergers.
4 Summary and Conclusions
We present a scenario of bulge growth in central galaxies based on: (i) the mass aggregation and merger histories of CDM distinct haloes randomly selected from both Millennium simulations (§2), (ii) the use of -dependent empirical relations, () and (), to seed galaxies into the growing (sub)haloes (§2.3, Appendix A1), and (iii) the implementation of a physically motivated model to calculate the bulge stellar mass after a galaxy-galaxy merger (Appendix A2). By construction, the stellar mass assembly of our mock galaxies follows on average the general downsizing trends inferred from observations (see Firmani & Avila-Reese 2010).
In our approach, bulges grow through galaxy mergers characterized by the dynamical mass ratios of the merging galaxies at the coalescence time. The latter is estimated following the orbit of the subhalo until its number of particles falls below the resolution of the simulations, and later applying a tested approximation of the dynamical friction time (Eq. 1). The stellar and gas masses of the secondaries at the moment of coalescence are either assumed to be the same they had when their haloes became subhaloes (extreme satellite quenching) or their further evolution until coalescence is estimated using a simple model of SF and SN-driven outflows (Appendix A.3), under the assumption that there is no further gas accretion. The bulge stellar mass increases after a merger by three contributions: (1) all the stars from the secondary, (2) a fraction of stars transferred from the primary disc, and (3) stars formed in a central starburst triggered by the condensation of cold gas from both merging galaxies. While the first contribution is expected to be related to a classical bulge, the other two are associated to a pseudobulge, i.e. a bulge that shares properties with the disc.
Our goal has been to revisit and explore in detail the predictive power of the CDM paradigm to explain, through the halo-halo merger histories mapped in a non-trivial way to galaxy-galaxy merger histories, the properties and demographics of the bulges of central galaxies with . We highlight the following results and conclusions:
Mock galaxies with have on average , while for more massive galaxies, increases rapidly with . This is mainly because the stellar major merger rate history increases with mass. For , nearly 60% of galaxies have , while for galaxies with dominate. The driver of bulge growth in massive/high- galaxies are major/intermediate () stellar mergers. Instead, for low-mass/low- galaxies, bulges grow mainly through minor/minuscule stellar mergers (), although the corresponding dynamical merger ratios are larger, . The latter implies that the bulges of galaxies have grown mostly from stars of the primary disc.
Bulges are composite, growing in several episodes through concomitant channels of stellar mass acquisition: from the secondaries, from the primary disc, and from starbursts. The first (second) of these contributions increases (decreases) monotonically with . For , and , approximately 60%, 55%, and 45% of the bulge mass was assembled by stars from the primary, respectively. For , the stars acquired from the secondaries contribute to the bulge mass. Bulge stars formed by central starbursts contribute to the bulge mass on average. Although intrinsic disc instabilities were not taken into account as a mechanism of (pseudo)bulge formation, the merger-induced disc instabilities produce a similar effect regarding bulge mass acquisition. Since this mechanism dominates at low , the stars of the bulges of small galaxies are predicted to have similar properties, including their kinematics, than the stars of their discs. We can nominally consider that when stars from the secondaries contribute more (less) than to the final bulge mass, then the bulge is classical-like (pseudo-like). The fraction of classical-like bulges is for galaxies with . Galaxies with smaller values have mostly pseudo-like bulges.
The evolution of the satellites from the time of infall until final coalescence influences the ratio of the central galaxy and significantly affects the ratio of secondaries-to-primary stars in the remnant bulge. In the extreme case of total SF quenching in the satellites, low-mass galaxies end up with smaller ratios than in the case where SF/feedback is allowed. In the former case, the contribution of stars from the secondaries to the growth of the bulge falls to , resulting in a negligible fraction of classical-like bulges for galaxies with , which is in conflict with observations. On the contrary, if satellites keep and transform their gas into stars too efficiently, then the mergers would be very destructive and the central galaxies would end up with ratios that are too high. An intermediate case between the previous two extreme cases is the standard SAM we have used to follow SF/feedback in the satellites (see Appendix A.3); it assumes that their hot gas is completely stripped as they merge with the host444If environmental processes such as ram pressure stripping not only remove all the hot gas from the satellites but also their cold gas discs, then star formation will be further suppressed and it would be more difficult to reproduce the observations.. For this case, it turns out that on average, the stellar mass of a satellite of a given mass grows in a similar way as that of a central galaxy of the same mass, with the latter being determined by the evolution of the () relation. Since this case is quite successful, as we summarize below, the latter finding is also very useful as a reference to infer merger rates from observations based on pair samples at relatively large separations.
Are our results in agreement with observations of bulge/disc demographics? Firstly, we checked that the predicted stellar merger rates as a function of mass and are actually consistent with observational measurements (Fig. 1). Then, we compared our results with the observational samples of FD11, G09, and W+09 regarding the dependence on (Fig. 3), the distribution and the fractions of galaxies with a given and (including the fractions of classical- and pseudo-like bulges; Fig. 4). Despite the large observational uncertainties, the overall consistency between our CDM-based predictions and observations is remarkable. In particular, it is quite relevant that a large fraction of the pseudo-like bulge population can be explained in a merger-induced scenario without introducing pure intrinsic secular instabilities on the disc. We also find an agreement in the fractions of galaxies within a given interval, which can be roughly associated to different morphological types (the morphological mix, Fig. 5), as well as in the fractions of stars in the disc and bulge components. While overall our prediction for the distribution is consistent with observations, in detail we have detected some potential disagreements:
-There are no mock galaxies with , while observers assign to a small fraction of (discless) galaxies. We argue that this apparent disagreement rather than a failure of the model could be a prediction: even the giant ellipticals should have small hidden discs.
-At the mass range , there are fewer mock galaxies with than observed in the local 11 Mpc volume sample of FD11. The latter, however, is likely to contain a non-negligible number of satellites that increase the fraction of bulgeless galaxies (satellites are expected to have smaller ratios than centrals of the same mass). On the other hand, the fraction of low-mass mock galaxies can easily be increased if the low-mass end of the relation is such that at higher redshifts the values of for a given are smaller than those used here (see Appendix B).
We conclude that the implementation of a reasonable semi-empirical model of galaxy occupation into growing CDM haloes is able to predict the present-day demographics and mass dependence of the galaxy ratios. At the basis of our results are the CDM halo merger rates, the merger-driven bulge growth model, and the way galaxies assemble their gas and stars, with a downsizing trend and a bell shaped (low) stellar formation efficiency.
Although these results might be interpreted as a positive test of the CDM model, we remark that we have only included merger-driven mechanisms of bulge growth. Discs instabilities such as bars and spiral arms also lead to secular processes of pseudobulge growth, in particular, the ”peanut-shaped”/boxy bulges are thought to be a byproduct of bar formation (e.g. Kuijken & Merrifield, 1995). There are other two possible mechanisms of bulge formation: (i) fragmentation of the gas-rich disc into clumps that migrate towards the center forming a large bulge at high redshifts (Dekel et al., 2009, although stellar feedback might suppress this mechanism, see , Hopkins et al.2011), and (ii) misalignment of the angular momentum of the disc with that of the newly-accreted gas (Sales et al., 2011). All these non-merger processes would probably increase the ratios of our mock galaxies, decreasing the population of bulgeless galaxies. Since our predictions are already in marginal agreement with observations of low-mass galaxies, the addition of these mechanisms might pose a challenge for the CDM model.
Acknowledgments
We are grateful to the reviewer, Philip Hopkins, for a very thorough and constructive report. We would like to thank Simon D. M. White, Michael L. Balogh, Dimitri Gadotti, Francesco Shankar and Dave Wilman for interesting comments and suggestions. JZ is supported by the University of Waterloo and the Perimeter Institute for Theoretical Physics. Research at Perimeter Institute is supported by the Government of Canada through Industry Canada and by the Province of Ontario through the Ministry of Research & Innovation. JZ acknowledges financial support by the Joint Postdoctoral Program in Astrophysical Cosmology of the Max Planck Institute for Astrophysics and the Shanghai Astronomical Observatory, and from a CITA National Fellowship. VA acknowledges PAPIIT-UNAM grant IN114509. MBK acknowledges support from the Southern California Center for Galaxy Evolution, a multicampus research program funded by the University of California Office of Research.
Appendix A Semi-empirical model of galaxy occupation
A.1 Stellar and gas mass relations
Along the evolution of each halo we assign stellar masses by using semi-empirically determined average stellar-to-halo mass relations at different epochs. By means of the abundance matching technique, Behroozi et al. (2010) determined the – relations for central galaxies in the range and then extended these relations to . These authors presented two different fitting formulae to their results, one for each redshift range. Because these formulae are disjoint at , we use instead the function presented in Firmani & Avila-Reese (2010), who modified them in order to obtain a continuous function from to .
Each galaxy is assigned a certain cold gas mass by drawing values from a Gaussian distribution with a mean and standard deviation according to the stellar-to-gas mass function (fitted to observations) given by Stewart et al. (2009). The extrapolation of this function to very low masses can produce unrealistic gas fractions. To avoid such cases, Stewart et al. (2009) proposed to assign an upper limit to the gas fraction given by such that . The value of was probably chosen because is the minimum mass for which a measurement of the cold gas fraction was inferred in the work of Stewart et al. (2009). Given the high degree of uncertainty in the values of for low-mass galaxies, increasingly higher for higher , we opt to simply set , which is the maximum observed value reported in Stewart et al. (2009).
As a halo grows, the stellar and cold gas masses of its central galaxy are given by the aforementioned relations (with the new stellar mass added to the disc component), except during a period of time after final coalescence in a galaxy-galaxy merger. In this case, there is an “instantaneous” increase of the stellar mass of the remnant that is naturally higher than the value given by the mean relation. In such cases, the halo-to-stellar mass relation is only restored in the future once the halo has grown sufficiently. For some cases, this moment has not happened yet by and thus, the final sample of mock galaxies has slightly higher stellar masses than predicted by the relation. We have verified that the shape of the stellar mass function that we recover at is roughly in agreements with that of the observed relation by comparing to the best Schechter fit reported in Panter et al. (2007). Overall, the values are always within a factor of with a spread that is larger for higher masses (because in average, more massive galaxies have more recent major mergers).
The redshift we choose to seed the galaxy population is since for higher redshifts, the stellar and cold gas mass assignment becomes highly uncertain. Galaxies are seeded as pure discs at , thus, we are effectively neglecting their previous morphological evolution. This is partially justified observationally since the fraction of disc-dominated galaxies gets larger with higher redshift. In particular, at , Pannella et al. (2009) report a transition stellar mass of M⊙ below which disc-dominated galaxies dominate the galaxy population. Similarly, from extrapolating the results of Oesch et al. (2010) to , we estimate that of all galaxies with M⊙ are disc-dominated (), whereas for larger masses, the mix is approximately and for disc- and bulge-dominated galaxies, respectively. For , the mix would be even more in-balanced towards mostly disc-dominated systems.
A.2 Channels of merger-driven bulge growth
A.2.1 Transfer of stars from the primary and secondary into the bulge.
In its orbit through the primary, the secondary looses energy and angular momentum sinking to the center due to dynamical friction. In the last stages of coalescence, the surviving mass of the secondary (dark matter + baryons) collides with the central region of the primary, of mass . During this process, the collisionless components of both systems are subjected to rapid changes of the gravitational potential that broaden their energy distributions leading towards an equilibrium state. This violent relaxation process drives the stars originally rotating in discs towards random orbits forming a spheroidal remnant. The stars in the primary disc affected by the dynamical action of the secondary are expected to be those within a radius enclosing the mass . The stars at larger radii in the disc are also perturbed but likely they are re-arranged into final configurations that are not far from the original ones (for instance, one of the effects of the merger is to vertically heat the galactic disc). It is then reasonable to expect that approximately a fraction:
| (2) |
of stars in the primary plus all the stars in the secondary will pass through violent relaxation and be transferred into the primary bulge. Due to the highly non-linear nature of mergers, they are better studied with numerical simulations, like those carried out in H09a. They seem to confirm the approximation described before, although a more detailed -but uncertain- accounting of the efficiency of violent relaxation as a function of radius suggests a slightly non-linear dependence on . The correction factor to Eq. (2) suggested in Hopkins et al. (2009b) is , with . We adopt this correction and use for our fiducial model, noting that the values of are thus smaller than those given by Eq. 2, making violent relaxation less efficient in the primary disc and slightly decreasing the final values of , particularly at low masses.
A.2.2 Starburst from the transport of cold gas into the centre of the primary.
A fraction of the cold gas in the galaxies looses angular momentum because the gravitational interaction during final coalescence generates a non-axisymmetric response in the galactic discs that morphologically resembles a bar. The resulting stellar and gaseous bars are however out of phase because gas is collisional and stars are not. Because of this, the stellar bar torques the gas bar draining its angular momentum. In this way, the cold gas is effectively removed from the original discs and transformed into stars, during a starburst, in the bulge of the remnant. This process is efficient within a region internal to a critical radius and thus, the fraction (assuming that the discs have exponential surface density profiles) is given by:
| (3) |
where is an effective gaseous disc scaling radius, and is a normalization factor. The ratio of the critical to effective scale radius depends on the merger mass ratio and relative orientation and orbit of the progenitors, as well as their stellar and gaseous content. A parameterization of this ratio is given in Eq. A2 of Hopkins et al. (2009b). We find that using Eq.(3) with gives a reasonable match to the simulation results shown in Fig. 7 of H09a. We note however that the precise value of the normalization is not very relevant for our results (unless ). This is because the cold gas mass that participates in the starburst is usually subdominant compared to the stellar mass that is violently relaxed in the primary and secondary.
The total mass of the stellar disc and bulge of the remnant after a merger are then given by:
| (4) | |||||
where the superscripts and refer to the primary and secondary, and all the quantities on the right are defined just before coalescence; it is then necessary to estimate the dark matter and baryonic mass of the galaxies at this time.
For the primary, the effective dark matter mass is that of the most bound material just prior to coalescence, which is well approximated by replacing the real density distribution by a NFW radial density profile and computing the mass interior to a radius , where is the halo concentration (the c(,) relation of Gao et al. (2008) is used). At this stage, its baryon content is simple given by the and relations defined earlier.
The effective dark matter mass of the secondary is computed from the properties its halo had when it was about to enter the virial radius of the host. Due to tidal striping, most of its dark matter mass will be lost before final coalescence, but the most bound material should survive. Because of this process, the subhalo mass in the final stages of the merger is an unreliable tracer of the potential well that shaped the properties of the satellite galaxy. For this reason, the empirical and relations only apply to the secondary before it enters the virial radius of the main halo, and not afterwards as it spirals inwards. Modeling the evolution of the stellar and gaseous components of the secondary is an important element of the semi-empirical model we have used in this paper; we discuss it below.
A.3 Evolution of satellite galaxies
A first simplistic approach would be to assume that the amount of cold gas and stars in the satellite just before coalescence is the same as in the moment the merger started (the results in the first row of Fig. 3 are obtained using this approach). A more physically-motivated treatment, used in our fiducial model, is to assume that there is no further gas accretion (due to environmental processes such as starvation, ram pressure and tidal striping) but the satellite suffers SF and feedback processes. For the former, we assume the Kennicutt-Schmidt law (Kennicutt, 1998) for gas surface densities above a critical density :
| (5) |
Initially, the disc has an an exponential gas surface density with an effective scale length given by times the effective radius of the disc, which we take to be given by the following empirically motivated relation555Hopkins, P., private communication, based on the results of Shen et al. (2003).:
| (6) |
We then apply Eq. (5) for azimuthally averaged values of in rings to obtain the mass of new stars formed in a time interval as a function of galactocentric radius :
| (7) |
where is the area of the annulus at radius , and is the fraction of the mass in stars that is instantaneously returned to the cold gas. This formula is reasonable as long as is smaller than the overall time scale of SF.
For our fiducial model, we also adopt a recipe for a SN feedback-driven outflow following the energy-driven wind case of Dutton & van den Bosch (2009). The amount of cold gas ejected in each annulus is then given by:
| (8) |
where ergs is the energy of one SN, is the number of SN produced per solar mass of stars, and is the escape velocity at radius given by the gravitational potential of baryons and dark matter. The kinetic energy of the wind is assumed to be a fraction of the SN energy.
Using Eqs. (5-8) we estimate the gas and stellar content of the satellite at the time of coalescence (recall that the merging time-scale is described in section 2.2).
Since our model is not aimed to follow the bulge growth of satellites, we cannot assign values to them. This impacts the amount of cold gas in the secondary that participates in the central starburst during a merger. By testing extreme values for the satellite, from pure discs to pure bulges, we find that, in most cases, the morphology of the satellite is not a significant factor in the final morphology of the remnant. This is mainly because the mass that participates in the starburst is usually lower that the stellar mass that is violently relaxed in the merging galaxies (see also Fig. 14 of Hopkins et al. 2010a).
Appendix B Variations of the semi-empirical model
We study now, in an almost qualitative way, the variations to some of the relevant ingredients of the semi-empirical model of galaxy occupation, concentrating on the statistical changes to the morphological mix of galaxies at .
Changes in . A substantial change in the evolution of the relation has consequences for the efficiency of bulge growth through mergers. We explored this using the relation reported in Yang et al. (2011) for case 12 in their Table 3. At , the difference between this formula and that of Firmani & Avila-Reese (2010) is not significant, except at the low-mass end where the former predicts lower values of for a fixed halo mass. At high redshift however, both formulae differ significantly in the low-mass end, with the Yang et al. (2011) formula predicting lower stellar masses for a given halo mass. This means that secondaries will be less destructive for central galaxies. The net effect is an overall reduction in the values of , except for the most massive galaxies, whose morphologies are typically shaped by massive secondaries. Thus, by using a relation with systematically lower stellar masses in the low-mass end, the morphological mix changes towards a more extreme dominion of bulgeless galaxies in this mass regime. For example, for the case analysed, we find that at , of galaxies have , which is times more than in our fiducial case, whereas there is essentially the same morphological mix for .
Gas fraction limit. The empirical relation from Stewart et al. (2009) that we have used to assign a gas fraction to our mock galaxies can be trusted up to down to M⊙ (see Fig. 2 of Stewart et al. 2009). For higher redshifts and lower masses, there is essentially no data to constrain this relation. In our fiducial model, a higher value of at the start of the merger implies that the secondary will have more material available for SF as it spirals inwards towards the primary, resulting in a more destructive merger. We investigate the impact of a limiting value of different to the one used in the fiducial model (). This alternative value is given by the cosmic baryon fraction: with . In this case, all of our mock galaxies end up being more massive at , the change being significant for the least massive galaxies and negligible for the most massive ones. The values of are systematically higher, specially in the low-mass end, which produces a morphological mix that is deficient in bulgeless galaxies. For instance, at , the models predict that only of the galaxies have , while for , there is essentially no change compared to our fiducial model.
SF and feedback recipes for the secondary. The satellite evolution that we have chosen in our fiducial model is based on the assumption that the Kennicutt-Schmidt law is valid at all redshifts.It is possible however, that this law changes with , being steeper and with lower normalization at higher (e.g., see Fig. 3 of Gnedin & Kravtsov 2010). A lower SF rate at higher will result in satellites with higher gas fraction at the moment of final coalescence and thus, in mergers that are less destructive. We find that within the range of values of the normalization, exponent and threshold of the Kennicutt-Schmidt law at , the values of do not change significantly when varying these parameters: slightly higher ratios are obtained for higher values of the normalization and the exponent, and lower values of the gas density threshold for SF. Only a very extreme deviation from the Kennicutt-Schmidt law at high redshifts would have a significant impact on the morphological mix of central galaxies at . Another ingredient in the satellite evolution is that of feedback-driven outflows, which are more effective for low-mass galaxies. If we remove this mechanism, the values increase in the low-mass end because SF is more efficient in this case. At , a model without feedback predicts a fraction of bulgeless galaxies of . At masses higher than , there are no changes in the morphological mix.
Finally, we note that in our fiducial model we have assumed that once the satellite enters the virial radius of the host, all its hot gas corona, is immediately stripped. This is not realistic for the most massive satellites that will be able to retain some of its gas for some time after accretion. If the cooling time of this hot gas is lower than the merging time, then the gas will condense to the center of the satellite and contribute to the cold gas mass and also to SF. Although without a proper model, it is not possible to know the impact to our results, we speculate that satellites, specially the massive ones, will likely be more destructive resulting in a morphological mix with more bulge-dominated galaxies at high masses.
References
- Allen et al. (2006) Allen P. D., Driver S. P., Graham A. W., Cameron E., Liske J., de Propris R., 2006, MNRAS, 371, 2
- Athanassoula (2005) Athanassoula E., 2005, MNRAS, 358, 1477
- Avila-Reese et al. (2005) Avila-Reese V., Carrillo A., Valenzuela O., Klypin A., 2005, MNRAS, 361, 997
- Baillard et al. (2011) Baillard A., Bertin E., de Lapparent V., Fouqué P., Arnouts S., Mellier Y., Pelló R., Leborgne et al., 2011, A&A, 532, A74+
- Barnes (1988) Barnes J. E., 1988, ApJ, 331, 699
- Barnes & Hernquist (1996) Barnes J. E., Hernquist L., 1996, ApJ, 471, 115
- Behroozi et al. (2010) Behroozi P. S., Conroy C., Wechsler R. H., 2010, ApJ, 717, 379
- Benson & Devereux (2010) Benson A. J., Devereux N., 2010, MNRAS, 402, 2321
- Binney & Tremaine (1987) Binney J., Tremaine S., 1987, Galactic dynamics
- Boylan-Kolchin et al. (2008) Boylan-Kolchin M., Ma C., Quataert E., 2008, MNRAS, 383, 93
- Boylan-Kolchin et al. (2009) Boylan-Kolchin M., Springel V., White S. D. M., Jenkins A., Lemson G., 2009, MNRAS, 398, 1150
- Collins et al. (2009) Collins C. A., Stott J. P., Hilton M., Kay S. T., Stanford S. A., Davidson M., Hosmer M., Hoyle et al., 2009, Nature, 458, 603
- Combes (2009) Combes F., 2009, in S. Jogee, I. Marinova, L. Hao, & G. A. Blanc ed., Galaxy Evolution: Emerging Insights and Future Challenges Vol. 419 of ASP Conference Series, Secular Evolution and the Assembly of Bulges. p. 31
- Conroy & Wechsler (2009) Conroy C., Wechsler R. H., 2009, ApJ, 696, 620
- De Lucia et al. (2011) De Lucia G., Fontanot F., Wilman D., Monaco P., 2011, MNRAS, 414, 1439
- Dekel et al. (2009) Dekel A., Sari R., & Ceverino D., 2009, ApJ, 703, 785
- Dutton & van den Bosch (2009) Dutton A. A., van den Bosch F. C., 2009, MNRAS, 396, 141
- Fakhouri et al. (2010) Fakhouri O., Ma C., Boylan-Kolchin M., 2010, MNRAS, pp 857–+
- Ferrarese et al. (1994) Ferrarese L., van den Bosch F. C., Ford H. C., Jaffe W., O’Connell R. W., 1994, AJ, 108, 1598
- Firmani & Avila-Reese (2010) Firmani C., Avila-Reese V., 2010, ApJ, 723, 755
- Fisher & Drory (2008) Fisher D. B., Drory N., 2008, AJ, 136, 773
- Fisher & Drory (2011) Fisher D. B., Drory N., 2011, ApJ, 733, L47+
- Fontanot et al. (2011) Fontanot F., De Lucia G., Wilman D., Monaco P., 2011, MNRAS, pp 1098–+
- Gadotti (2009) Gadotti D. A., 2009, MNRAS, 393, 1531
- Gao et al. (2008) Gao L., Navarro J. F., Cole S., Frenk C. S., White S. D. M., Springel V., Jenkins A., Neto A. F., 2008, MNRAS, 387, 536
- Gerhard (1981) Gerhard O. E., 1981, MNRAS, 197, 179
- Gnedin & Kravtsov (2010) Gnedin N. Y., Kravtsov A. V., 2010, ApJ, 714, 287
- Governato et al. (2009) Governato F., Brook C. B., Brooks A. M., Mayer L., Willman B., Jonsson P., Stilp A. M., Pope L., et al., 2009, MNRAS, 398, 312
- Graham (2001) Graham A. W., 2001, AJ, 121, 820
- Guo et al. (2012) Guo Q., White S. D. M., Angulo R. E., Henriques B., Lemson G., Boylan-Kolchin M., Thomas P., Short C., 2012, arXiv:1206.0052
- Hammer et al. (2009) Hammer F., Flores H., Puech M., Yang Y. B., Athanassoula E., Rodrigues M., Delgado R., 2009, A&A, 507, 1313
- Hernquist (1992) Hernquist L., 1992, ApJ, 400, 460
- Hopkins et al. (2010a) Hopkins P. F., Bundy K., Croton D., Hernquist L., Keres D., Khochfar S., Stewart K., Wetzel A., Younger J. D., 2010a, ApJ, 715, 202
- Hopkins et al. (2009a) Hopkins P. F., Cox T. J., Younger J. D., Hernquist L., 2009a, ApJ, 691, 1168
- Hopkins et al. (2010b) Hopkins P. F., Croton D., Bundy K., Khochfar S., van den Bosch F., Somerville R. S., Wetzel A., Keres D., Hernquist L., Stewart K., Younger J. D., Genel S., Ma C.-P., 2010b, ApJ, 724, 915
- Hopkins et al. (2009b) Hopkins P. F., Somerville R. S., Cox T. J., Hernquist L., Jogee S., Kereš D., Ma C., Robertson B., et al., 2009b, MNRAS, 397, 802
- (37) Hopkins P. F., Keres D., Murray N., Quataert E., & Hernquist L., 2011, arXiv:1111.6591
- Kennicutt (1998) Kennicutt Jr. R. C., 1998, ApJ, 498, 541
- Khochfar & Silk (2006) Khochfar S., Silk J., 2006, MNRAS, 370, 902
- Kormendy & Bender (2012) Kormendy J., Bender R., 2012, ApJS, 198, 2
- Kormendy et al. (2010) Kormendy J., Drory N., Bender R., Cornell M. E., 2010, ApJ, 723, 54
- Kormendy & Kennicutt (2004) Kormendy J., Kennicutt Jr. R. C., 2004, ARA&A, 42, 603
- Kuijken & Merrifield (1995) Kuijken K., & Merrifield M. R., 1995, ApJ, 443, L13
- Lauer et al. ( 2005) Lauer T. R., Faber S. M., Gebhardt K., et al., 2005, AJ, 129, 2138
- Laurikainen et al. (2007) Laurikainen E., Salo H., Buta R., Knapen J. H., 2007, MNRAS, 381, 401
- Leauthaud et al. (2012) Leauthaud A., Tinker J., Bundy K., et al. 2012, ApJ, 744, 159
- López-Sanjuan et al. (2012) López-Sanjuan C., Le Fèvre O., Ilbert O., Tasca L. A. M., Bridge C., Cucciati O., et al. 2012, ArXiv e-prints
- Lotz et al. (2011) Lotz J. M., Jonsson P., Cox T. J., Croton D., Primack J. R., Somerville R. S., Stewart K., 2011, ApJ, 742, 103
- Lukić et al. (2007) Lukić Z., Heitmann K., Habib S., Bashinsky S., Ricker P. M., 2007, ApJ, 671, 1160
- MacArthur et al. (2003) MacArthur L. A., Courteau S., Holtzman J. A., 2003, ApJ, 582, 689
- Mo et al. (2010) Mo H., van den Bosch F. C., White S., 2010, Galaxy Formation and Evolution
- Moster et al. (2010) Moster B. P., Somerville R. S., Maulbetsch C., van den Bosch F. C., Macciò A. V., Naab T., Oser L., 2010, ApJ, 710, 903
- Negroponte & White (1983) Negroponte J., White S. D. M., 1983, MNRAS, 205, 1009
- Oesch et al. (2010) Oesch P. A., Carollo C. M., Feldmann R., Hahn O., Lilly S. J., Sargent M. T., Scarlata C., Aller M. C., et al., 2010, ApJ, 714, L47
- Pannella et al. (2009) Pannella M., Gabasch A., Goranova Y., Drory N., Hopp U., Noll S., Saglia R. P., Strazzullo V., et al., 2009, ApJ, 701, 787
- Panter et al. (2007) Panter B., Jimenez R., Heavens A. F., Charlot S., 2007, MNRAS, 378, 1550
- Parry et al. (2009) Parry O. H., Eke V. R., Frenk C. S., 2009, MNRAS, 396, 1972
- Sales et al. (2011) Sales L. V., Navarro J. F., Theuns T., Schaye J., White S. D. M., Frenk C. S., Crain R. A., Dalla Vecchia C., 2012, MNRAS, 423, 1544
- Schweizer (1982) Schweizer F., 1982, ApJ, 252, 455
- Shen et al. (2003) Shen S., Mo H. J., White S. D. M., Blanton M. R., Kauffmann G., Voges W., Brinkmann J., Csabai I., 2003, MNRAS, 343, 978
- Simard et al. (2011) Simard L., Mendel J. T., Patton D. R., Ellison S. L., McConnachie A. W., 2011, ApJS, 196, 11
- Springel & Hernquist (2005) Springel V., Hernquist L., 2005, ApJ, 622, L9
- Springel et al. (2005) Springel V., White S. D. M., Jenkins A., Frenk C. S., Yoshida N., Gao L., Navarro J., Thacker R., et al., 2005, Nature, 435, 629
- Stewart et al. (2009) Stewart K. R., Bullock J. S., Wechsler R. H., Maller A. H., 2009, ApJ, 702, 307
- Tasca & White (2011) Tasca L. A. M., White S. D. M., 2011, A&A, 530, A106+
- Thomas et al. (2005) Thomas D., Maraston C., Bender R., Mendes de Oliveira C., 2005, ApJ, 621, 673
- Toomre (1977) Toomre A., 1977, in B. M. Tinsley & R. B. G. Larson D. Campbell ed., Evolution of Galaxies and Stellar Populations Mergers and Some Consequences. p. 401
- Wang et al. (2008) Wang J., De Lucia G., Kitzbichler M. G., White S. D. M., 2008, MNRAS, 384, 1301
- Weinzirl et al. (2009) Weinzirl T., Jogee S., Khochfar S., Burkert A., Kormendy J., 2009, ApJ, 696, 411
- White (1978) White S. D. M., 1978, MNRAS, 184, 185
- Yang et al. (2007) Yang X., Mo H. J., van den Bosch F. C., Pasquali A., Li C., Barden M., 2007, ApJ, 671, 153
- Yang et al. (2011) Yang X., Mo H. J., van den Bosch F. C., Zhang Y., Han J., 2012, ApJ, 752, 41