Impact of the Great East Japan Earthquake on Hotel Industry in Pacific Tohoku Prefectures
Abstract
This paper investigates the impact of the Great Japan Earthquake (and subsequent tsunami turmoil) on socio-economic activities by using data on hotel opportunities collected from an electronic hotel booking service. A method to estimate both primary and secondary regional effects of a natural disaster on human behavior is proposed. It is confirmed that temporal variation in the regional share of available hotels before and after a natural disaster may be an indicator to measure the socio-economic impact at each district.
1 Introduction
Since people in the world are also products of nature, the physical effects of natural environment on our society are remarkable. Specifically, natural disasters often affect our societies significantly. Therefore, we need to understand the subsequent impact of natural disasters on human behavior from both economical and social perspectives.
The first Great East Japan Earthquake hit at 14:46 on 11 March 2011 in Japanese local time (05:46 in UTC). Within 20 minutes after shaking, huge tsunamis had devastated cities along Japan’s northeastern coastline. In fact, destruction was largely physical, but social infrastructures have been damaged. Currently, it is considerably significant for us to understand its subsequent impact on our socio-economic activities.
According to Sigma 2/2011 from Swiss Re, significant insurance losses are expected from the 11 March Tohoku Earthquake (and subsequent tsunami), which resulted in the death and disappearance of more than 23,000 people [1]. Economic activities before and after the Great East Japan disaster completely changed due to the physical destruction observed in many industrial sectors. The fiscal cost of this disaster to Japan has been conservatively estimated at $200 billion. Actually, the short-term impact on Japanese growth is likely to be negative and potentially quite large. Nevertheless, reconstruction efforts are likely to get underway, which will provide a substantial boost to growth by the end of this year.
Monitoring regional human behavior may provide decision-makers with useful insights on the management of re-establishment after disasters. However, in general, it is not so easy to collect large-scale data on human activities before and after the natural disasters with both a high level of detail and a large number of samples. In this case, it is important to find an adequate proxy variable.
Tourism demand is particularly sensitive to security and health concerns. Estimation of the economic impact of changes in the demand for tourism has typically been investigated with several methods. Blake et al. analyzed the effects of crisis using a computational general equilibrium model of the US and also examined potential and actual policy responses to the crisis [2]. Moreover, the problem of estimating demand from censored booking data has been recognized for many years in the hotel industry. Patrick et al. developed parametric regression models that consider not only the demand distribution, but also the conditions under which the data were collected [3]. Sato investigated regional patterns of Japanese travel behavior by using the EM algorithm for finite mixtures of Poisson distributions [5].
Furthermore, understanding what motivations influence people’s travel habits and destination selections is crucial to predicting their future travel patterns. A review of the literature on tourist motivation reveals that a model that views motivations on the two dimensions of “push” and “pull” factors has been generally accepted [4]. The idea behind this two-dimensional approach is that people travel because they are pushed by their own internal forces and pulled by the external forces of the destination attributes [6]. The pull factors originate from the destination properties (supply). The push factors belong to consumers (demand). More recently, Tkaczynski et al. applied the stake-holder theory, a management theory proposed by Freeman (1984) [8], to a destination in tourism [7]. The existence of hotel accommodations implies that pull factors are present in the district where they are located.
Therefore, we may assume that changes of demand and supply in the hotel industry can reflect both the social and economic impact of natural disasters on human behavior. In this article, the use of data on hotel availability collected from an electronic hotel booking service is suggested for this purpose. Hotel opportunities are handled in real-time and the geographical coverage of hotel locations seems high. Spatio-temporal dependence of hotel availability can be analyzed from physical point of view.
According to a recent report by Japan Tourism Agency in the Ministry of Land, Infrastructure, Transport and Tourism, the total number of accommodations, including hotels, Japanese inns, and pensions all over Japan, is estimated as 53,468 during 2010 [9]. Specifically, in the prefectures that have been damaged by the earthquake and tsunami (Iwate, Miyagi, and Fukushima), it is estimated that there are 3,846 accommodation facilities. Notably, hotels in this area are so densely located that we can use the data to measure the socio-economic impact. Based upon this idea, the number of available hotels before and after the Great East Japan Earthquake is examined in this study. Hotel availability is assumed to be a proxy variable of human mobility, so comparative analysis before and after the disaster is conducted.
2 Data and methods
We used data collected from a Japanese hotel booking site named Jalan via a Web API (Application Programing Interface) [13]. The Jalan is one of the most popular hotel reservation services in Japan. The Web API is an interface code set that is designed to simplify development of application programs.
In order to estimate both economic and social damages in three Tohoku prefectures (Iwate, Miyagi, and Fukushima), we focus on the number of available hotels in each district before and after the Great East Japan Earthquakes and Tsunami. We selected 21 districts in three prefectures, as shown in Table 1 and two periods, one before and one after the disaster.
The data on hotels in this area cover about 31% of the potential hotels. Therefore, we have to estimate the uncensored states from these censored booking data. If we assume that the hotels in the data are sampled from uncensored data in a homogeneous way, then the relative frequency of the available accommodations from censored data can approximate the true value, computed from uncensored data.
In order to conduct a quantitative study, let be the number of available hotels in district at day in period . Then the relative frequency at district can be calculated as
| (1) |
Let us consider a ratio of the relative frequencies after and before a specific event
| (2) |
where and represent the relative frequencies after and before the event, respectively. Obviously, Eq. 2 can be rewritten as
| (3) |
by using and , which are the number of available hotels in district within the period and the total number at that moment, respectively. Since is independent of , should be proportional to the ratio of the number of hotels after and before the event.
3 Analysis
The 3rd column in Table 1 shows , where the term represents May 2010 (before the disaster), and the term May 2011 (after the disaster), respectively. Since the value of is related to damages to hotels in district , implies that available hotels decreased after the earthquake at , compared to the ratio of the total number of hotels. Similarly means that they increased or maintained at .
From this it is estimated that Sanriku Kaigan, Oshu, Hiraizumi, Ichinoseki, Sendai, Matsushima, Shiogama, Fukushima, Nihonmatsu, Soma, Koriyama, Iwaki and Futaba were significantly damaged by the earthquake and tsumani. We may assumed that the decrease of at district results from both a decrease in supply and an increase in demand. The decrease in supply is caused by the physical destruction of infrastructure in this case. The increase in demand comes from behavior of individuals. The regional dependence of supply can be estimated from the number of destroyed houses in each district.
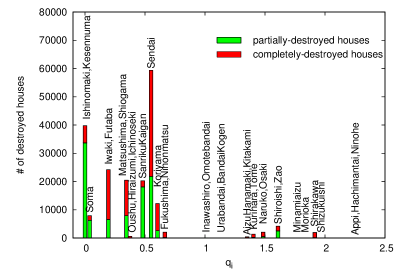
To do so, we calculated the numbers of both completely destroyed and partially destroyed houses in each district from the data downloaded from a Web page of National Research Institute for Earth Science and Disaster Prevention [14]. The numbers were calculated by summing the number of destroyed houses in a town or city included in each district. Table 1 shows the numbers of destroyed houses. From this histogram, it can be seen that house damages were concentrated in the maritime area of these prefectures.
We can confirm that the damages to houses were serious in Sanrikukaigan, Sendai, Matsushima, Shiogama, Ishinomaki, Kesennuma, Soma, Koriyama, Iwaki and Futaba. The highest number of completely destroyed houses in Ishinomaki and Kesennuma, with 33,661 homes destroyed. The second-highest is 21,789, in Sendai. The third-highest is 18,098, in Sanrikukaigan. The highest number of partially destroyed houses is 37,522, in Sendai. The second-highest is 17,614, in Iwaki and Futaba. The third-highest is 12,185, in Koriyama.
From an official report by each Prefecture [10, 11, 12] the number of evacuees who have stayed at public refuge holes is counted at each district. The 6th column in Table 1 shows the number of evacuees as confirmed at 1st May 2011. The number of evacuees in each district is proportional to the number of completely destroyed houses. It is found that physical damages were not serious from both the number of destructed houses and evacuees in Oushu, Hiraizumi, Ichinoseki and Fukushima, Nihonmatsu. The degree of damages which is measured by physical damages is consistent with a value of computed by the proposed method except these districts.
The Figure 1 shows correlation among the number of destroyed houses and . In fact, where the ratio is greater than 1, the number of destroyed houses is not significant. We confirmed that the ratio may measure the degree of damage to economic activities through the travel industry. However, it was not confirmed that the significant physical damages to houses in Oushu, Hiraizumi, Ichinoseki, Fukushima, and Nihonmatsu even have a ratio less than 1. It may be thought that hotels in Oushu, Hiraizumi, and Ichinoseki were used by works and evacuated victims of the disaster. The decrease in available hotels in Fukushima and Nihonmatsu may be related to the accidents at the Fukushima Daiich nuclear power plant.
The number of evacuated victims of the disaster in each prefecture according to an official announcement by Japanese Cabinet Office on 3 June 2011 is shown in Table 2. In the case of the Fukushima prefecture, 17,874 evacuated people were in hotels at that moment. Although we could not collect correct data on hotel booking on these two districts, we may assume that hotels in these districts were occupied by individuals (refugees, workers, volunteers and civil groups).
Consequently, we concluded that the physical damage to buildings constructions is estimated to be small if the ratio is larger than 1. Moreover, it is found that regional distribution of evacuated victims and workers may influence the ratio. This represents the secondary effects of natural disasters on human behavior.
| prefecture | district | ratio | complete collapse | partial collapse | evacuees |
| Iwate | Shizukuishi | 1.970 | 0 | 0 | 372 |
| Morioka | 1.834 | 0 | 4 | 366 | |
| Appi,Hachimantai,Ninohe | 2.250 | 3 | 0 | 0 | |
| Hanamaki,Kitakami,Tohno | 1.350 | 27 | 364 | 853 | |
| SanrikuKaigan | 0.481 | 18,098 | 2,166 | 12,896 | |
| Oushu,Hiraizumi,Ichinoseki | 0.374 | 83 | 533 | 338 | |
| Miyagi | Sendai | 0.550 | 21,789 | 37,522 | 3,608 |
| Matsushima,Shiogama | 0.345 | 7,895 | 12,581 | 5,115 | |
| Ishinomaki,Kesennuma | 0.0 | 33,661 | 6,083 | 23,840 | |
| Naruko,Osaki | 1.484 | 486 | 1,577 | 929 | |
| Kurihara,Tome | 1.404 | 224 | 1,105 | 1,049 | |
| Shiroishi,Zao | 1.608 | 2,522 | 1,644 | 1,612 | |
| Fukushima | Fukushima,Nihonmatsu | 0.665 | 168 | 1,898 | 1,321 |
| Soma | 0.038 | 6,279 | 1,618 | 1,969 | |
| Urabandai,BandaiKogen | 1.134 | 0 | 0 | 2 | |
| Inawashiro,Omotebandai | 1.009 | 10 | 12 | 303 | |
| Aizu | 1.352 | 4 | 27 | 266 | |
| Minamiaizu | 1.768 | 0 | 0 | 14 | |
| Koriyama | 0.604 | 2,596 | 12,185 | 2,489 | |
| Shirakawa | 1.915 | 135 | 1,820 | 418 | |
| Iwaki,Futaba | 0.195 | 6,550 | 17,614 | 2,115 |
| prefecture | A: public places | B: hotels | C: others | A+B+C |
|---|---|---|---|---|
| Aomori | 0 | 78 | 777 | 855 |
| Iwate | 9,039 | 2,007 | 14,701 | 25,747 |
| Miyagi | 23,454 | 2,035 | - | 25,489 |
| Akita | 128 | 619 | 909 | 1,656 |
| Yamagata | 305 | 779 | 2,366 | 3,450 |
| Fukushima | 6,105 | 17,874 | - | 23,979 |
4 Transient behavior
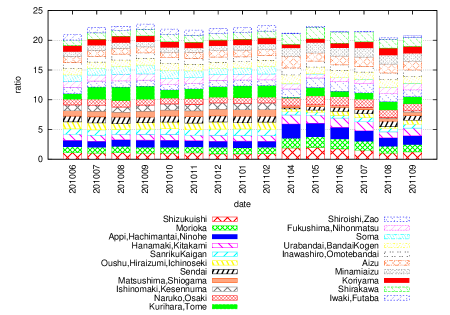
In this section, we investigate temporal development of hotel availability before and after the Great East Japan Earthquake. By using Eqs. (2) and (3), we compute on the basis of the regional share of available hotels in May 2010. Fig. 3 shows , where represents May 2010, and the period from May 2010 to September 2011. It is found that the ratios are stable and take values around 1 at all the districts except Kurihara and Tome until February 2011.
However, after the earthquake (from April 2011) the ratios drastically changed. Fig. 3 shows the ratios of several districts. The ratio in April 2011 reflects the degree of physical damage just after the earthquake, as shown in Section 3. Therefore, the temporal variation can be assumed to show the degree of both physical and social damage.
In Fig. 3, we see that 22.6% of the hotels in Sendai had recovered by April 2011, 55% by May 2011, 66.9% by June 2011, 67.6% by July, 88.8% by August 2011 and 75.8% by September 2011, in comparison with May 2010. Hotels along the coastlines (Sanrikukaigan, Matsushima, Shiogama, Ishinomaki, Kesennuma and Iwaki) are eventually recovering, though more slowly than at Sendai. In the case of Ishinomaki and Kesennuma, the hotels completely disappeared in April 2011, but 20.1% of the hotels had recovered by September 2011. In contract to these areas, hotels at Soma had not recovered by the time this text was written, in September 2011.

5 Conclusion
A method to measure changes in human activities before and after a natural disaster from both social and economic perspectives with data collected from an electronic booking site was proposed. Regional shares of the number of available hotels were introduced and a ratio of the share after the disaster to that before it was defined. Hotel availability before and after the Great East Japan Earthquake and Tsunami was analyzed through a comparison of the number of destroyed houses with the ratio. As a result, we confirmed that the physical damage to buildings constructions is estimated to be small if the ratio is larger than 1. Moreover, it is found that regional distribution of evacuated victims and workers may influence the ratio. This represents the secondary effects of natural disasters on human behavior.
Acknowledgements
The author thanks the Yukawa Institute for Theoretical Physics at Kyoto University. Discussions during the YITP workshop YITP-W-11-04 on “Econophysics 2011: The Hitchhiker’s Guide to the Economy” were useful in completing this work. The author are thankful to Prof. Hideaki Aoyama and Prof. Zdzisław Burda for valuable suggestions. The author also thanks Mr. Sigehiro Kato, Mr. Hiroshi Yoshimura, Mr. Kotaro Sasaki and Ms. Yoko Miura of Recruit Cooperation for their stimulating discussions.
References
- [1] Sigma 2/2011, Swiss Re. http:www.swissre.com/publications/.
- [2] \JLAnnals of Tourism Research, 30, 2003, 813
- [3] \JLJournal of Revenue and Pricing Management,1, 2002, 1, 121
- [4] \JLJournal of Travel Research, 34, 1995, 33
- [5] International Review of Financial Analysis (2011) in press
- [6] \JLAnnals of Tourism Research, 4, 1977, 184
- [7] \JLJournal of Travel Research, 49, 2010, 139
- [8] R.E. Freeman, Strategic Management: A Stakeholder Approach (Boston, Pitman, 1984)
- [9] The data is downloaded from a Web page of Japan Tourism Agency in Ministry of Land, Infrastructure, Transport and Tourism: http://www.mlit.go.jp/kankocho/siryou/toukei/index.html (31 Aug 2011).
- [10] The data is downloaded from a Web page of Iwate Prefecture: http://www.pref.iwate.jp/~bousai/taioujoukyou/201105011700hinanbasyo.pdf
- [11] The data is downloaded from a Web page of Miyagi Prefecture: http://www.pref.miyagi.jp/kikitaisaku/higasinihondaisinsai/pdf/5011900.pdf
- [12] The data is downloaded from a Web page of Fukushima Prefecture: http://www.pref.fukushima.jp/j/hinanjolist0501.pdf
- [13] The data is collected from Jalan Web Service: http://www.jalan.net/.
- [14] The data is downloaded from a Web page of National Research Institute for Earth Science and Disaster Prevention: http://www.j-risq.bosai.go.jp/ndis/ (31 Aug 2011).