Two-Dimensional Magnetohydrodynamic Simulations of Barred Galaxies
Abstract
Barred galaxies are known to possess magnetic fields that may affect the properties of bar substructures such as dust lanes and nuclear rings. We use two-dimensional high-resolution magnetohydrodynamic (MHD) simulations to investigate the effects of magnetic fields on the formation and evolution of such substructures as well as on the mass inflow rates to the galaxy center. The gaseous medium is assumed to be infinitesimally-thin, isothermal, non-self-gravitating, and threaded by initially uniform, azimuthal magnetic fields. We find that there exists an outermost -orbit relative to which gaseous responses to an imposed stellar bar potential are completely different between inside and outside. Inside this orbit, gas is shocked into dust lanes and infalls to form a nuclear ring. Magnetic fields are compressed in dust lanes, reducing their peak density. Magnetic stress removes further angular momentum of the gas at the shocks, temporarily causing the dust lanes to bend into an “L” shape and eventually leading to a smaller and more centrally distributed ring than in unmagnetized models. The mass inflow rates in magnetized models correspondingly become larger, by more than two orders of magnitude when the initial fields have an equipartition value with thermal energy, than in the unmagnetized counterparts. Outside the outermost -orbit, on the other hand, an MHD dynamo due to the combined action of the bar potential and background shear operates near the corotation and bar-end regions, efficiently amplifying magnetic fields. The amplified fields shape into trailing magnetic arms with strong fields and low density. The base of the magnetic arms has a thin layer in which magnetic fields with opposite polarity reconnect via a tearing-mode instability. This produces numerous magnetic islands with large density which propagate along the arms to turn the outer disk into a highly chaotic state.
Subject headings:
magnetohydrodynamics — galaxies: ISM — galaxies: kinematics and dynamics — galaxies: nuclei — galaxies: spiral — ISM: general — shock waves1. Introduction
One of the characteristic features of barred galaxies is the existence of gaseous substructures such as a pair of dust lanes, a nuclear ring, and nuclear spirals, visible in optical images and radio maps (e.g., Pease 1917; Sandage 1961; Sanders & Huntley 1976; Buta & Combes 1996; Martini et al. 2003a, b; Prieto et al. 2005; Martinez-Valpuesta et al. 2006; Comeròn et al. 2009; Hsieh et al. 2011). Dust lanes located at the leading side of the bar are interpreted as shocks in the gas flows, as evidenced by the enhanced radio emissions and sharp velocity jumps across them (see, e.g., Buta & Combes 1996 and references therein). The curvature of dust lanes depends on the bar strength and aspect ratio, while largely independent of its pattern speed and galaxy mass (Knapen et al., 2002; Comeròn et al., 2009). Nuclear rings are the regions of high gas density and usually populated with numerous H II regions, indicative of recent starburst activities (e.g., Buta 1986; Heller & Shlosman 1994; Maoz et al. 2001; Mazzuca et al. 2008; Hsieh et al. 2011). They have a size typically of , but appear to be larger and wider in galaxies with less compact mass distribution (Mazzuca et al., 2011). Nuclear spirals located inside the rings are believed to be a channel for gas inflows to the galaxy center, potentially powering active galactic nuclei (AGN) (e.g., Shlosman et al. 1990; Regan & Mulchaey 1999; Knapen et al. 2000; van de Ven & Fathi 2010).
Since the gas flows shaping bar substructures are intrinsically nonlinear, numerical simulations have been a powerful tool to study their formation, evolution, and associated dynamics (e.g., Sanders & Prendergast 1974; Athanassoula 1992b; Piner et al. 1995; Englmaier & Gerhard 1997; Patsis & Athanassoula 2000; Regan & Teuben 2003, 2004; Maciejewski 2004; Ann & Thakur 2005; Thakur et al. 2009). In particular, Athanassoula (1992b) showed that a non-axisymmetric bar potential induces dust-lane shocks at downstream from the bar major axis and that the shocks become more straight under a stronger bar. Dust lanes tend to become shorter and located closer to the bar major axis when the gas sound speed is larger (Englmaier & Gerhard, 1997; Patsis & Athanassoula, 2000). The shocked gas at dust lanes loses angular momentum and flows inward to form a nuclear ring at the position where the external gravity is balanced by the centrifugal forces (Shlosman et al., 1990; Piner et al., 1995; Regan & Teuben, 2003). Using a smoothed particle hydrodynamics method, Ann & Thakur (2005) and Thakur et al. (2009) showed that the formation of strong nuclear spirals supported by shocks requires a large sound speed and the presence of a central black hole (BH), although their models were unable to resolve weak spirals in the nuclear regions due to a small number of particles (see also Maciejewski 2004).
Very recently, Kim et al. (2012, hereafter Paper I) ran high-resolution simulations using the grid-based CMHOG code on a cylindrical geometry. Paper I found that the original CMHOG code used by Piner et al. (1995) contained errors in the evaluation of the bar forces, compromising their numerical results as well as others (e.g., Regan & Teuben 2003; Maciejewski 2004) who unknowingly adopted the original code with the errors. Using a corrected version of the code, Paper I found that when the gas sound speed is small, nuclear rings are narrow and decoupled from nuclear spirals, making the mass inflow rates toward the galaxy center extremely small (). On the other hand, strong thermal perturbations in models with high make the rings broad, leading to . Paper I also found that the shape and strength of nuclear spirals depend sensitively on the gas sound speed and the BH mass such that they are leading if both and are small, weak trailing if is small and is large, and strong trailing if both and are large: nuclear spirals are readily destroyed by the ring material on eccentric orbits when is large and is small.
While aforementioned work improved our understanding on gas dynamics associated with bar substructures, they are without one of the most important ingredients of the interstellar medium (ISM), namely magnetic fields that are pervasive in disk galaxies (e.g., Beck et al. 1996; Beck 2009). By observing barred galaxies in radio polarized emissions, Beck et al. (2005) found that magnetic fields are strong in dust lanes and nuclear rings, suggesting that they are dynamically important in shaping bar substructures (see also Beck et al. 1999, 2002). Some barred galaxies such as NGC 1365, NGC 1097, NGC 1365 are observed to possess “magnetic arms” characterized by stronger fields and lower density than surrounding regions (Beck et al., 2002, 2005). In addition, magnetic fields exert torque that is much larger than gravitational torque, providing an efficient means to transport gas from a nuclear ring inward to feed an AGN (Beck et al., 2005). Therefore, the effect of magnetic fields on structure and evolution of barred galaxies should not be ignored.
There have been a number of numerical studies on magnetic field distributions in barred galaxies. Depending on how magnetic fields are treated, they can be categorized into two groups: (1) those based on mean-field dynamo theories (e.g., Otmianowska-Mazur et al. 1997, 2002; Moss et al. 1998, 1999, 2001, 2007) and (2) those using full magnetohydrodynamic (MHD) simulations (Kulesza-Żydzik et al., 2009, 2010; Kulpa-Dybeł et al., 2011). Although numerical models from the first group are successful in obtaining synthetic polarization maps and overall field morphologies comparable to observations, they rely on parameterized turbulent terms in the induction equation that are uncertain. More importantly, the mean-field dynamo models take velocity fields from hydrodynamic or -body sticky-particle simulations and evolve magnetic fields passively, without considering the back reaction of magnetic fields to the gas. On the other hand, MHD models in the second group naturally handle gas responses to the embedded magnetic fields. For instance, Kulesza-Żydzik et al. (2010) found that dynamical effects of magnetic fields lead to the formation of low-density magnetic arms in the regions outside the bar, which is clearly unseen in the mean-field dynamo models (see also Kulesza-Żydzik et al. 2009; Kulpa-Dybeł et al. 2011). Even without the prescription for the mean-field dynamo, magnetic energy in these MHD models grows due to shear and compression by a factor of about 15 relative to the initial value over a 1 Gyr period (Kulesza-Żydzik et al., 2009).
Because the MHD models mentioned above focused on magnetic structures in the outer regions, however, the effects of magnetic fields on bar substructures and mass inflow rates have yet to be explored. Can magnetic fields make dust lanes stronger? Do they make nuclear rings smaller or larger? Do nuclear spirals survive in the presence of magnetic fields? How do the mass inflow rates change as the field strength varies? In order to address these questions, we in this paper run high-resolution MHD simulations using the Athena code (Gardiner & Stone, 2005; Stone et al., 2008; Stone & Gardiner, 2009). This work is a straightforward extension of Paper I by including magnetic fields. Our models are two dimensional, assuming a razor-thin disk. This allows to better resolve the in-plane direction than in the three-dimensional models considered by Kulesza-Żydzik et al. (2010). On the other hand, our two-dimensional models are unable to capture the dynamical consequences of Parker instability and other processes that involve the vertical direction. In addition to studying the magnetic effects on substructures in the bar regions, we identify an MHD dynamo mechanism that amplifies magnetic fields, eventually leading to magnetic arms in the outer regions.
This paper is organized as follows. In Section 2, we describe our numerical methods and model parameters, and present numerical resistivity of the Athena code. In Section 3, we make a comparison between the results of the Athena and CMHOG codes on hydrodynamic models with identical parameters. In Section 4, we present the results of MHD simulations on the bar regions, focusing on the effects of magnetic fields on bar substructures and mass inflow rates. In Section 5, we study evolution of gas and magnetic fields in the outer regions. In Section 6, we conclude with a summary and discussion of our numerical results.
2. Models and Methods
We consider a magnetized gaseous disk and study its responses to an imposed non-axisymmetric bar potential. Gas dynamics without the effect of magnetic fields was presented in Paper I. As in Paper I, the disk is initially uniform, isothermal, vertically-thin, and non-self-gravitating. The bar is assumed to rotate rigidly about the galaxy center with a fixed pattern speed . We solve the dynamical equations in the frame corotating with the bar in the plane. The equations of magnetohydrodynamics in the rotating frame integrated along the vertical direction are
| (1) |
| (2a) | |||||
| (3) |
Here, , , and denote the surface density, velocity in the rotating frame, and the sound speed in the gas, while represents the midplane value of the three-dimensional magnetic field times the square root of the ratio of surface density to midplane volume density (e.g., Kim & Ostriker 2001). Note that the induction equation (3) in the rotating frame has the same form as in the inertial frame (e.g., Koldoba et al. 2002). The velocity in the inertial frame is obtained from . We do not consider star formation and the associated gas recycling in the present work.
The external gravitational potential, represented by in equation (2), and the associated rotation curve are taken identical to those in Paper I. Here we describe these briefly. The external potential consists of four components: a stellar disk modeled by a Kuzmin-Toomre disk, a central bulge modeled by a modified Hubble profile with central density , a non-axisymmetric bar modeled by a Ferrers (1887) spheroid with central density , and a central supermassive BH with mass . Without a BH, the rotation velocity rises steeply with the galactocentric radius and attains a more-or-less constant value of at . The presence of a BH affects near the central parts, resulting in at . The bar has a patten speed of , which places the corotation resonance (CR) at . In order to avoid abrupt responses of the gas due to a sudden introduction of the bar, we increase linearly with time over one bar revolution time of Myr, while keeping the net density fixed. This ensures that shape of averaged along the azimuthal direction is not changed much with time.
Our model disks initially have uniform surface density and isothermal sound speed of . Magnetic fields are initially in plane, uniform, and purely azimuthal. The field strength is parameterized by the dimensionless plasma parameter
| (4) |
where and are the midplane values of volume density and three-dimensional magnetic field strength. In terms of dimensional units
| (5) |
where is the scale height of the gaseous disk. Note that the initial disk with constant has a mass-to-flux ratio that is increasing linearly with .
In order to focus on the effects of magnetic field strength and rotation curve at the central parts, we consider eight models with differing and , as listed in Table 1. The strength of magnetic fields is chosen to vary from sub-equipartition () to equipartition () values with thermal energy. We also consider hydrodynamic models with to make comparisons with the results of Paper I. Models with a prefix bh7 possess a central BH with , with the curve attaining the local maximum and minimum at and , respectively (see Paper I). The bh7 models have only a single inner Lindblad resonance (ILR) at where . On the other hand, bh0 models with no BH have two ILRs at and , and the curve peaks at . We take Model bh7MHD01 with and as our standard model.
| Model | ||
|---|---|---|
| bh7MHD01 | 1 | |
| bh7MHD03 | 3 | |
| bh7MHD10 | 10 | |
| bh7HD | ||
| bh0MHD01 | 0 | 1 |
| bh0MHD03 | 0 | 3 |
| bh0MHD10 | 0 | 10 |
| bh0HD | 0 |
We solve the time-dependent ideal MHD equations (1)-(3) using a modified version of the Athena code in Cartesian coordinates (Gardiner & Stone, 2005; Stone et al., 2008; Stone & Gardiner, 2009). Athena utilizes a higher order Godunov scheme which conserves mass, momentum, and magnetic flux within machine precisions. It also provides several different schemes for integration in time, spatial reconstruction, and solution of the Riemann problem. We take the van Leer algorithm with piecewise linear reconstruction and first order flux correction. For a Riemann solver, we use the exact nonlinear solver for hydrodynamic models and an approximate HLLD-type nonlinear solver for MHD runs.
Our simulation domain is a square box with side in each direction. We set up a uniform Cartesian grid with zones over . The corresponding grid spacing is , about an order magnitude smaller than models in Kulesza-Żydzik et al. (2010). These high-resolution runs are necessary to explore properties of bar substructures in detail. We apply the outflow boundary conditions at the domain boundaries (i.e., at or ). To measure the mass inflow rates toward the galaxy center, we place a central hole with radius of 20 pc and define a density floor inside the hole. At each time, we calculate the gas mass flown into the hole by integrating the excess interior density as , and then reset the interior density to . The mass inflow rate is then obtained from , where is the computational timestep. In this paper, we present the results with , but we checked that is insensitive to the choice of as long as it is taken sufficiently small.
The inflowing gas may carry magnetic fields to the galaxy center, as well. In order to allow for -field accretion, we let the magnetic fields vanish inside the central hole while preserving the divergence-free condition. This is achieved by calculating the vector potential at each time, cutting it off to a constant value inside the hole, and then recalculating the vector from the modified vector potential. We note that taking arbitrarily inside the hole sometimes makes -fields bend abruptly near the hole boundary. In addition, density in the vicinity of the hole frequently becomes very small, greatly limiting the computational timestep by increasing the Alfvén speed. In order to minimize these spurious effects, we utilize the non-ideal Ohmic dissipation term included in Athena by taking magnetic resistivity in the circular region at , while the rest of the simulation domain is kept non-resistive. This results in a gradual dissipation of -fields in the region surrounding the hole, allowing us to run simulations for a long period of time.
Finally, we remark on the numerical resistivity of the Athena code that we use. It is difficult to estimate the magnetic diffusivity of the real ISM accurately since it is very clumpy and diffusivity changes a lot between the different phases with different temperature and different degree of ionization. If turbulence dominates the diffusion and dissipation of the magnetic fields, it is perhaps of the order of (e.g., Parker 1971; Camenzind & Lesch 1994; Kulesza-Żydzik et al. 2009). The associated magnetic Reynolds number is , much larger than unity, so that taking the limit, as we do in the present work except for the small central regions, is a useful starting point. Nevertheless, we note that there is non-zero (but small) numerical diffusivity over the entire simulation domain introduced by the numerical scheme. In Appendix, we use linear-amplitude magnetosonic waves to evaluate the coefficients of numerical viscosity as well as magnetic diffusivity of the Athena code. For and the wavelength typical for the tearing-modes of magnetic reconnection occurring in the outer regions (see Section 5), the numerical resistivity is estimated to be , about three orders of magnitude smaller than . The associated magnetic diffusion time is , indicating that the non-ideal effect of numerical resistivity on the -field evolution can be important if the field strength changes considerably over the grid scale.
3. Comparison between CMHOG and Athena Results
As mentioned above, Paper I explored hydrodynamical models of barred galaxies using the corrected version of the cylindrical CMHOG code that originally contained a bug in calculating the bar forces (Piner et al., 1995). On the other hand, the present calculations make use of the Athena code on a uniform Cartesian grid. Since the current models include two hydrodynamic models with the same parameters as in Paper I, it is interesting to compare the results from two different codes. This will check not only the reliability of the Athena runs but also the validity of the corrected bar forces in Paper I. Note that by employing a non-uniform grid, the CMHOG models in Paper I has a higher (lower) spatial resolution at () than the current Athena runs with a uniform grid spacing.
Overall evolution of hydrodynamic models is described in Paper I: here we summarize the main features. As the bar potential is slowly introduced, initially-circular gas orbits are perturbed, forming a pair of overdense ridges at the downstream side of the bar major axis. As the bar potential grows further, the overdense ridges eventually develop into shocks, appearing as dark dust lanes in optical images of barred galaxies. Gas loses a significant amount of angular momentum at the shocks and thus moves radially in, forming a nuclear ring at the position where the centrifugal force balances the external gravity. In addition, these shocks are curved and thus able to generate vorticity. Vorticity grows secularly with time by the successive passages across shocks. When it achieves substantial amplitudes, it causes the shock fronts to wiggle, producing small clumps with high vorticity. The whole process of clump formation is analogous to the wiggle instability of spiral shocks identified by Wada & Koda (2004) (see also Kim & Ostriker 2006). These clumps are added to the nuclear ring. As clumps collide with each other, the ring becomes homogeneous gradually.
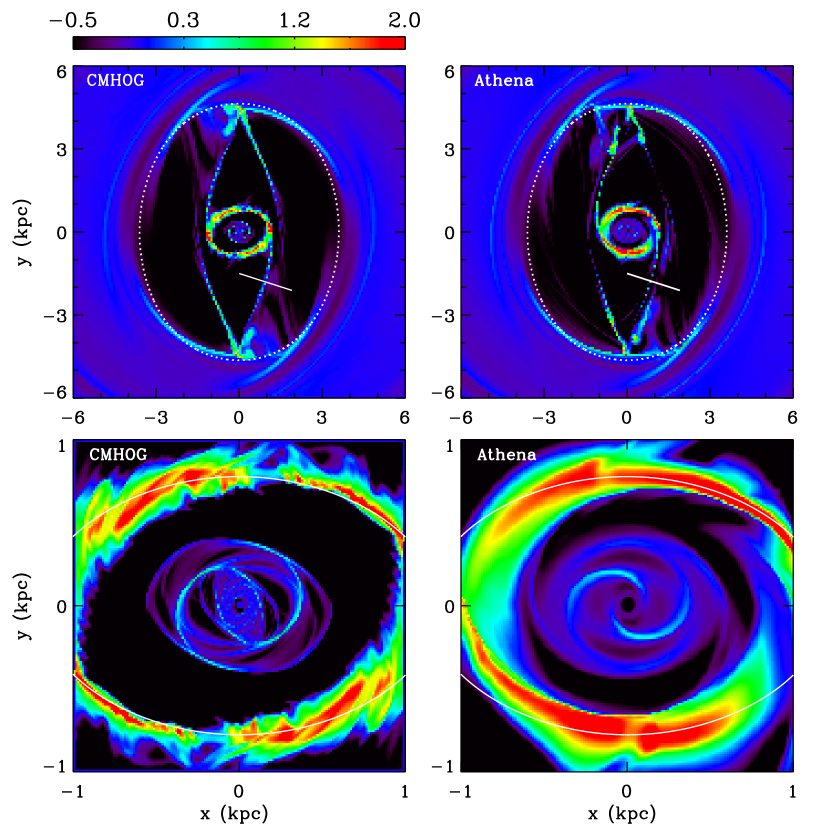
Figure 1 compares the snapshots of Model bh0HD in the present work with those of Model cs05bh0 from Paper I at Myr when the bar substructures reach a quasi-steady state. The bar is oriented vertically along the -axis, and the gas inside (outside) the CR at is rotating in the counterclockwise (clockwise) direction. The images in the upper panels cover the whole region inside the corotation, while the lower panels enlarge the central regions. In the upper panels, dotted curves draw the outermost -orbit that cuts the - and -axes at and , respectively, and has a Jacobi energy of under our adopted external potential (e.g., Athanassoula 1992a). Inside this orbit, there are families of closed - and -orbits that cross each other, resulting in shocks at the leading side of the bar major axis. As gas loses angular momentum at the shocks and moves toward the central parts, the bar regions becomes gradually evacuated. Outside the outermost -orbit, no closed orbit exists: gas there simply moves on slightly perturbed, near-circular orbits, without inducing shocks. The gas moving in slowly due to the bar torque from outside is subsequently trapped in the outermost -orbit, and stays in it. Therefore, the outermost -orbit acts as a barrier that inflowing gas cannot penetrate. Other than weak trailing spirals produced by the bar toque that emerge from the downstream side of the bar ends, the outer regions are almost featureless in hydrodynamic models.
In the lower panels, solid curves draw an -orbit with that approximately follows the nuclear ring. The morphological agreement between the CMHOG and Athena results is fairly good, although the ring in the CMHOG run is more clumpy and slightly larger. This is because the Athena run has a higher resolution at where dust lanes form. This makes the dust-lane shocks in the Athena runs better resolved, leading to higher angular momentum loss and a smaller ring than in the CMHOG counterpart. In addition, the wiggle instability of the dust lanes is more vigorous in the Athena run since it grows faster at smaller scales. Hence, the Athena run produces more clumps that collide frequently, resulting in a smoother ring than in the CMHOG run. Since the Athena run has a lower resolution at , on the other hand, it harbors weaker nuclear spirals than in the CMHOG run, as Figure 1 shows. The peak density relative to the mean and the pitch angle of the spirals at are and in the Athena run, which can be compared with and in the CMHOG run.
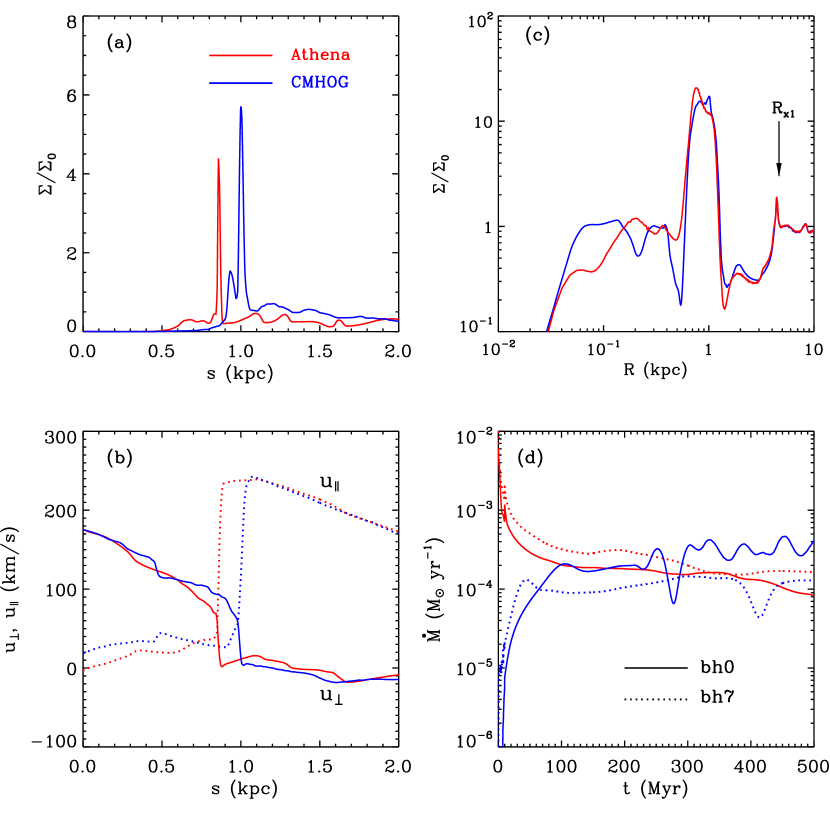
Figure 2 provides more quantitative comparisons between the Athena and CMHOG results. Figure 2a,b plot the distributions of surface density and velocities along the slit indicated in Figure 1. The slit starts from and ends at . The dust-lane shocks in Athena are slightly weaker and located closer to the bar major axis than in CMHOG. This is consistent with a smaller nuclear ring in the Athena run, since the inner ends of the dust lanes are connected to the nuclear ring. The overall velocity profiles as well as the amount of the velocity jumps from the Athena and CMHOG runs agree well with each other. Figure 2c compares the radial profiles of the mean density averaged both azimuthally and temporally over Myr. Although the density-weighted ring radius is slightly smaller in the Athena run, the difference is only , again demonstrating good agreement between the CMHOG and Athena results. The black arrow marked by indicates the maximum radial extent of the outermost -orbit, outside of which density is relatively unperturbed. A small spike of the mean density around is caused by the trapping of inflowing gas from outside.
Finally, Figure 2d compares the mass inflow rates for bh0 and bh7 models as functions of time. Because of difference in the way handling fluid variables inside the central hole, the temporal behavior of at early time is quite different between the Athena and CMHOG results, although it rapidly converges to a more-or-less constant value. In the CMHOG runs, the bh0 model has larger at Myr than in the bh7 model, while the former has slightly smaller in the Athena runs. Nevertheless, at Myr from the Athena and CMHOG runs agrees with each other, on average, within a factor of 2, implying that the current method of measuring by placing a central hole is reliable.
To conclude this section, despite the CMHOG and Athena codes are quite different in terms of coordinate geometry as well as ways of updating fluid variables, the results from both codes are in good agreement. This confirms not only that the revised force transformation in CMHOG used in Paper I is correct, but also that dynamics of a rotating disk can be reliably handled by the Cartesian Athena code that we use.
4. Bar Regions
We now turn to the effects of magnetic fields on bar substructures and mass inflow rates. Evolution of the gas outside the outermost -orbit is quite distinct from that inside. In this section we focus on the bar regions (i.e., inside the outermost -orbit): the changes of magnetic structures in the outer regions will be presented in Section 5.
4.1. Overall Evolution
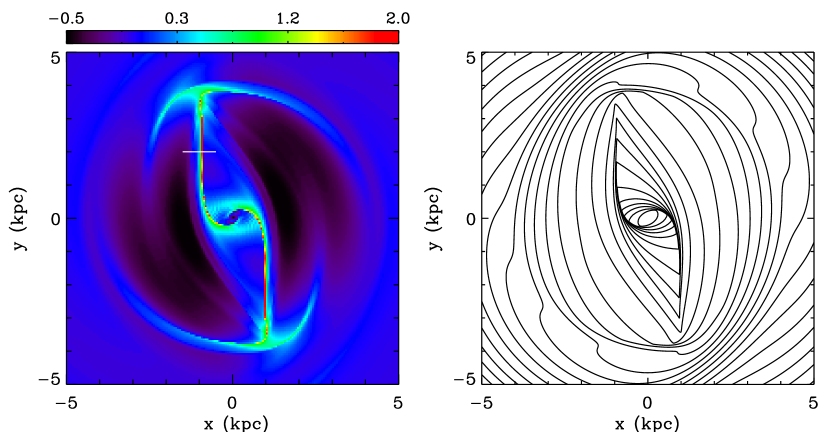
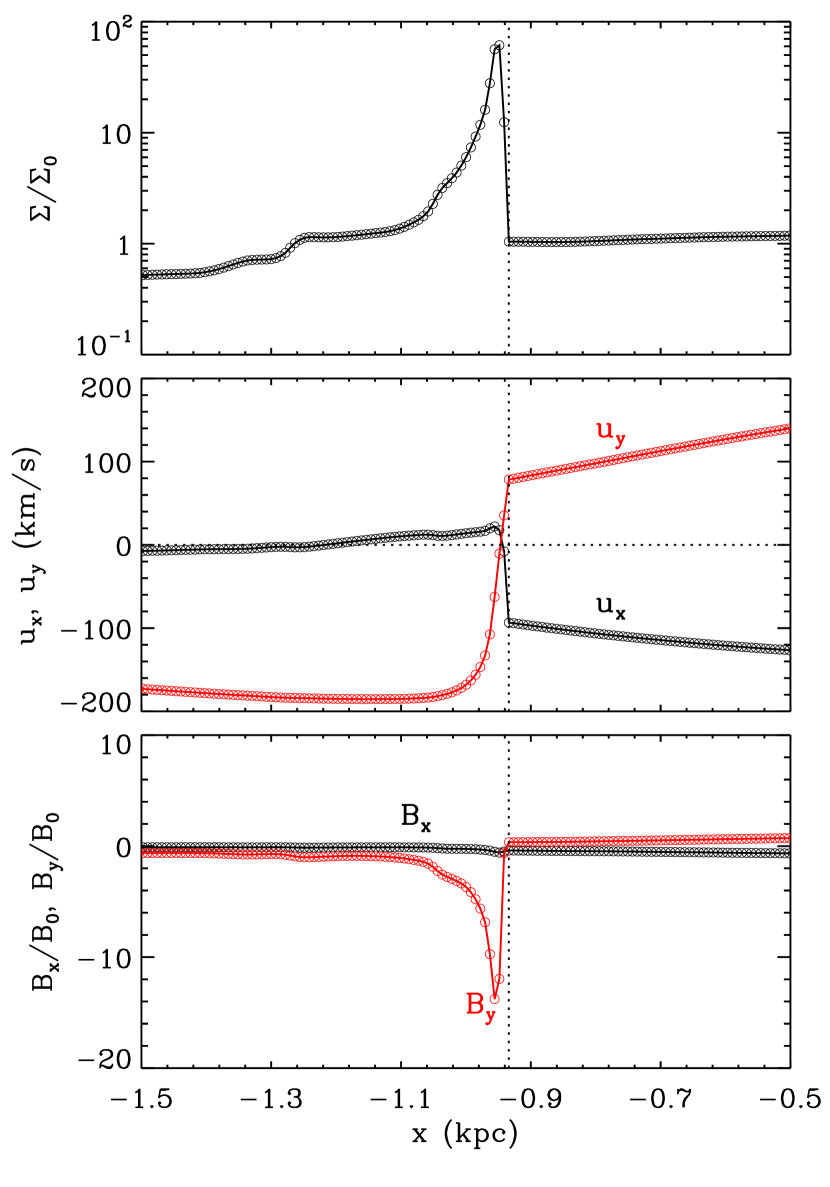
Early evolution in the bar regions of our standard model bh7MHD01 (with and ) is not much different from the hydrodynamic counterpart in that the bar potential induces crowding of gas orbits to create overdense ridges that develop into dust-lane shocks. The presence of magnetic fields (1) reduces the shock density and (2) provides Maxwell stress for the gas at the shocks, further removing angular momentum from it. To illustrate this, Figure 3 plots a surface density snapshot together with the magnetic field configuration of Model bh7MHD01 at Myr. Note the magnetic field lines are approximate proxy to instantaneous gas streamlines. Figure 4 plots the variations of gas surface density, velocities, and magnetic fields along the slit at shown in Figure 3. Each circle corresponds to an individual grid point. At this time, the shocks are almost parallel to the -axis, and are moving toward the bar major axis at velocity relative to the bar.
The perpendicular Mach number of the flows along the slit relative to the shock is . Here and hereafter, the subscripts and denote the preshock and postshock value, respectively. With , the usual jump condition for one-dimensional stationary MHD shocks111 For perpendicular isothermal shocks, the density compression factor is a positive root of the quadratic equation (e.g., Priest 1982). yields the compression factor and . Figure 4 shows that and , and , indicating that the density compression of the dust-lane shocks is more than steady one-dimensional shocks allow. More importantly, the sign of is reversed across the shock. This is because the shocks are intrinsically two dimensional in the sense that the streamlines diverge before the shock and bend abruptly to align themselves parallel to the dust lanes immediate after the shock. The bending of the streamlines at the shock is caused by a strong inflow of the gas along the dust lanes from the bar ends. This postshock inflow rotates the magnetic fields at the shock, making the sign of reversed. Magnetic tension forces from the bent -fields are highly efficient to remove angular momentum from the gas moving across shocks, as we will show below.
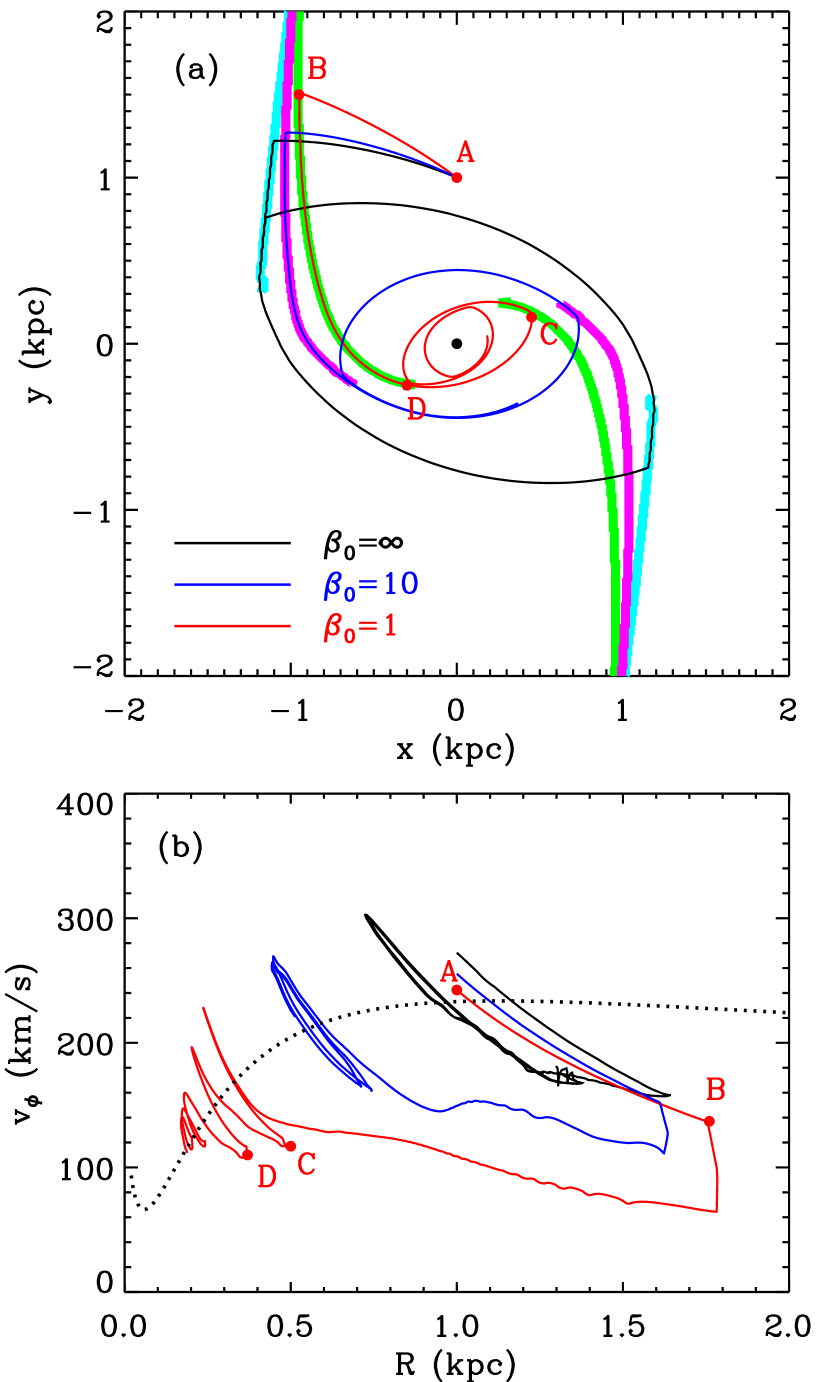
The gas moving on -orbits just inside the outermost -orbit collides with that on the 4/1-resonant family, subsequently switching to lower -orbits (e.g., Contopoulos & Grosbøl 1980; Englmaier & Gerhard 1997; Paper I). Gas on these lower -orbits is continually perturbed by strong total (thermal plus magnetic) pressure near the bar ends, and after many revolutions it eventually transits to a trajectory that crosses the dust lane shocks. Figure 5a plots instantaneous streamlines of such gas that passes through Point A at before hitting a dust lane in Models bh7MHD01, bh7MHD10, and bh7HD at Myr. The locations of the dust lanes are indicated as thick lines. The solid lines in Figure 5b plot the change of the rotational velocity along the trajectories shown in Figure 5a, while the dotted line draws the rotation curve in initial equilibrium. The gas hits the shock at Point B and loses a significant amount of angular momentum there. Note that in magnetized models experiences a dramatic drop at the shock due largely to magnetic tension forces from the bent field lines. Coriolis force makes the shocked gas rotate faster gradually as it moves radially in along the dust lane. In MHD models, magnetic stress in the dust lanes continuously removes angular momentum from the inflowing gas, causing to increase more slowly and thus making it move further in than in the unmagnetized model.
Figure 5 shows that in models with , the instantaneous streamlines make an almost closed loop after hitting the dust lane at the opposite side, forming a nuclear ring in a position where the centrifugal force balances the gravity (i.e., where achieves its initial value). Due to significant angular momentum loss at the shocks, on the other hand, the streamline in Model bh7MHD01 with is closed only after successively hitting the dust lane at the opposite side (Point C) and then the first one again (Point D), allowing the gas to move in very close to the galaxy center. With a large supply of gas near the central parts, magnetized models would have mass inflow rates greatly enhanced compared to unmagnetized models, as will be shown in Section 4.5.
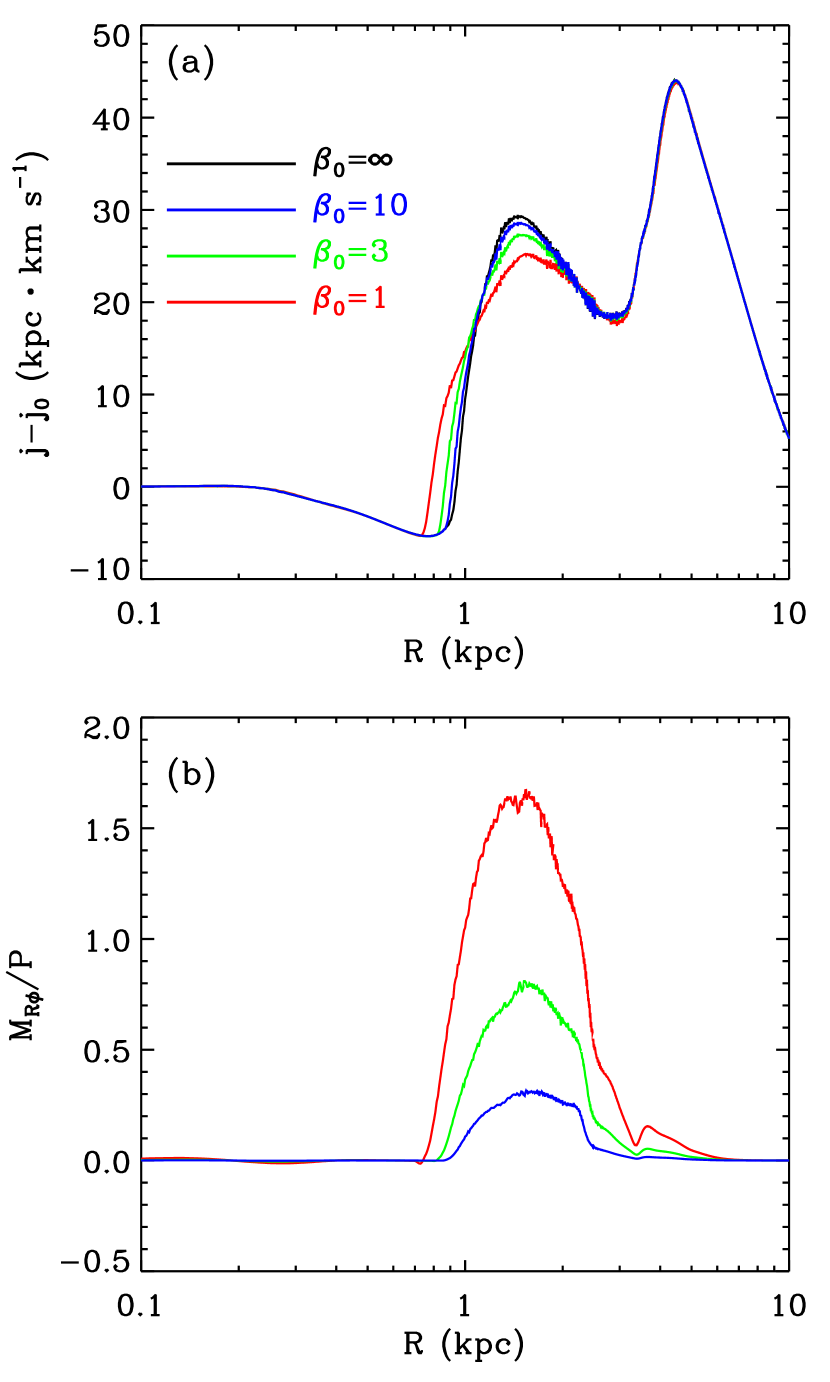
Is the magnetic stress really responsible for further infall of the shocked gas toward the galaxy center? To check this, Figure 6 plots the radial distribution of the angle-averaged, specific angular momentum relative to the initial value as well as the the ratio of the angle-averaged Maxwell stress to the mean thermal pressure at Myr for bh7 models. Note that at for all models. This is primarily because gas with high angular momentum at large has moved inward where is lower.222In our models, a portion of the bulge potential is slowly replaced by the bar potential, with the combined central density held fixed. A small mismatch between the shapes of the bar and bulge potentials causes the gas in the central regions to temporarily expand slightly, leading to at . If the magnetic stress is important in transporting angular momentum outward, would change according to , (e.g., Balbus & Hawley 1998). The peak value of the magnetic stress in Model bh7MHD01 is at . Assuming a constant rate of the angular momentum loss, the net change in expected over an interval of Myr is , which is very close to the difference in between Models bh7MHD01 and bh7HD at . This demonstrates that the magnetic stress accounts for further loss of angular momentum and hence a smaller ring size in magnetized models.
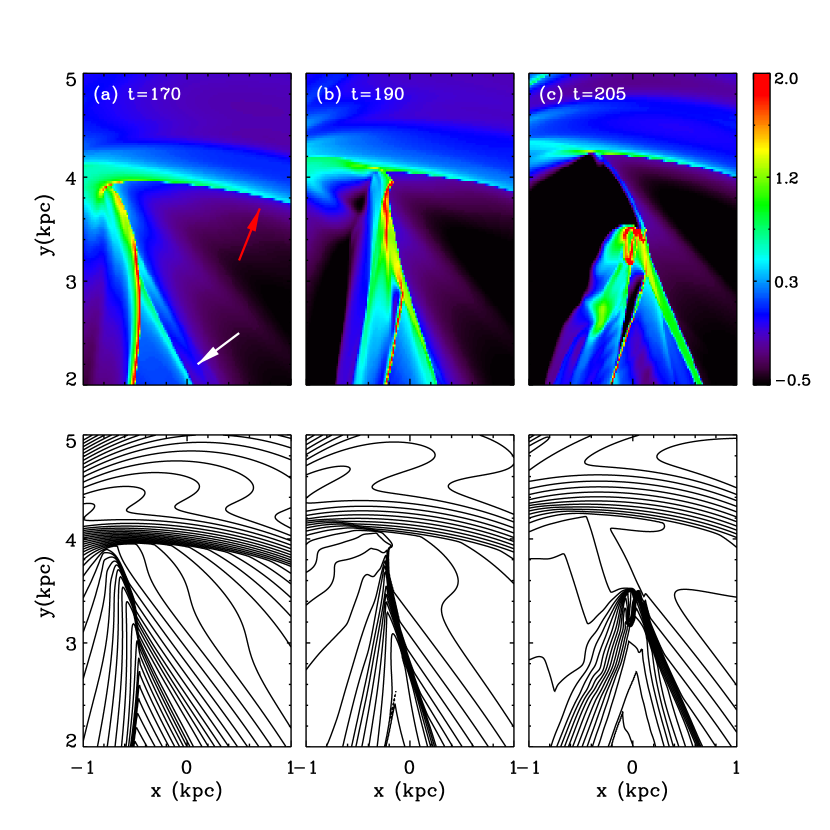
The density and magnetic field structures in the bar-end regions are quite complicated. Figure 7 shows a few snapshots of density and magnetic fields in the upper bar-end regions with and of the standard model. The 4/1-spiral shock that forms via the collisions of gas on -orbits and on the -resonant family is indicated as the red arrow. Also indicated as the white arrow is a dense ridge of gas, called “smudge”, created by the convergence of streamlines at the backside of the dust lanes (Patsis & Athanassoula 2000; Paper I). Compressed magnetic fields in the smudge bend abruptly at the dust-lane shock, developing a “”-shaped magnetic wedge that exerts exceedingly large tension force ( Myr). At the same time, the dust lane moves toward the bar major axis and becomes shorter in extent. A blob of high-density gas at ) near the bar end that was previously supported by the dust-lane shock becomes loose at Myr, and starts to move radially in due to the strong tension force in the magnetic wedge. This produces a strong non-steady flow that rotates about the galaxy center on -orbits just outside the dust lanes. This non-steady flow, which is stronger in models with smaller , dies out slowly as it loses mass near the bar ends when hitting the dust-lane or 4/1-spiral shocks, with the lost mass funneled to a nuclear ring along the dust lanes. At about Myr, the overall flow pattern reaches a quasi-steady state where fluid quantities do not change much over time.
4.2. Dust Lanes
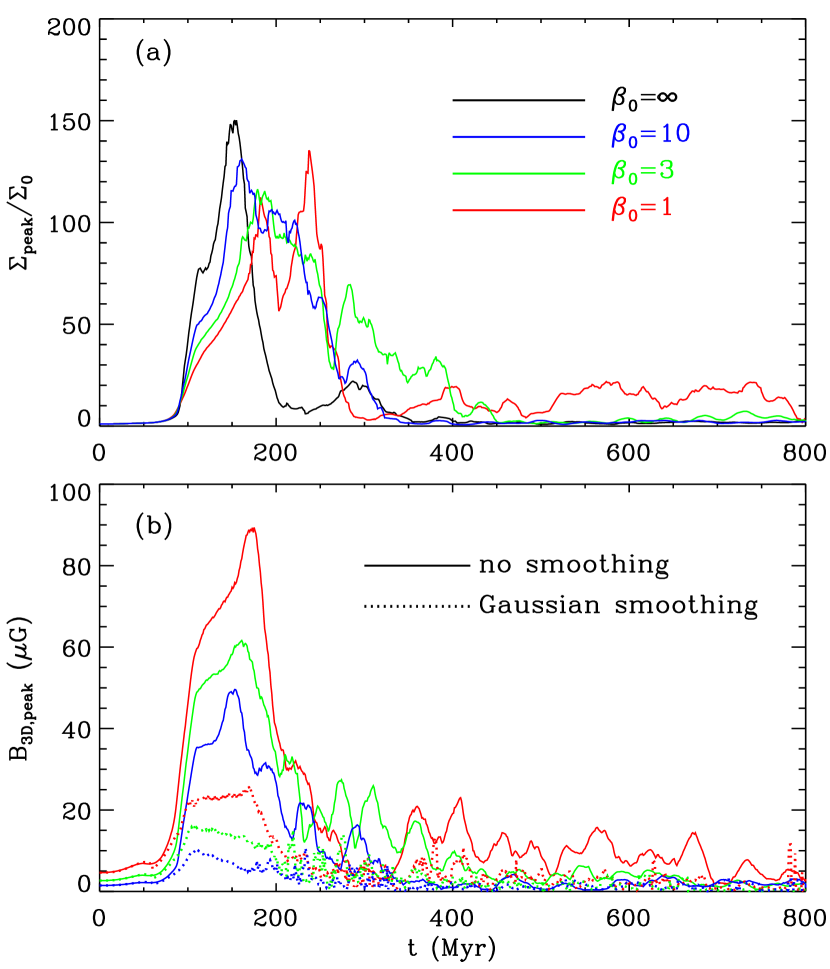
The primary response of gas to the imposed bar potential is the formation of dust-lane shocks at the leading side of the bar. Of course, the degree of density and -field compression depends on the initial field strength. Figure 8 plots the temporal evolution of the peak density and magnetic field of the dust lanes measured at for bh7 models. Since the dust lanes are away from the center, they are unaffected by the BH mass.
| Model | (kpc) | (kpc) | (kpc) | () | ||
|---|---|---|---|---|---|---|
| bh7MHD01 | 0.03 | 0.71 | 0.34 | 29.5 | 18.6 | 14.8 |
| bh7MHD03 | 0.24 | 0.82 | 0.51 | 29.4 | 20.5 | 20.5 |
| bh7MHD10 | 0.33 | 0.79 | 0.56 | 32.9 | 21.3 | 15.1 |
| bh7HD | 0.57 | 0.99 | 0.76 | 34.2 | 17.5 | 0.0 |
| bh0MHD01 | 0.08 | 0.87 | 0.39 | 24.7 | 11.2 | 26.1 |
| bh0MHD03 | 0.25 | 0.81 | 0.51 | 33.8 | 20.8 | 25.8 |
| bh0MHD10 | 0.31 | 0.80 | 0.56 | 32.7 | 21.4 | 13.4 |
| bh0HD | 0.59 | 1.07 | 0.80 | 32.1 | 15.2 | 0.0 |
Note. — and are the inner and outer radii of the ring defined by the positions where , with being the maximum density; is the mass-weighted ring radius; is the mean density of the ring; is the peak strength of magnetic fields inside the ring.
The peak density of the dust lanes starts to rise rapidly from Myr when the bar potential attains a substantial amplitude. Magnetic fields reduce the shock compression, making smaller with decreasing . As the gas moves in along the shocks due to angular momentum loss, the bar region inside the outermost -orbit is progressively evacuated, limiting the growth of . Models with stronger magnetic fields have dust lanes closer to the bar major axis. This makes the gas density in models with smaller more centrally concentrated, causing to increase for a longer period of time. In the model, the second increase of at Myr is caused mainly by the non-steady gas inflows initiated from near the bar ends explained above.
Due to shock compression, dust lanes are also regions of strong magnetic fields. Figure 8b plots the temporal variations of the peak -field strength in the dust lanes at . In Model bh7MHD01, reaches before it declines rapidly as the gas and magnetic fields are advected to the central regions. Since the dust lanes are extremely narrow with thickness of in our models, the observed field strength of dust lanes is likely to depend sensitively on the telescope beam size. We illustrate this by plotting as dotted lines the field strength after Gaussian smoothing with FWHM of , which is about times weaker than the value without smoothing.
4.3. Nuclear Rings
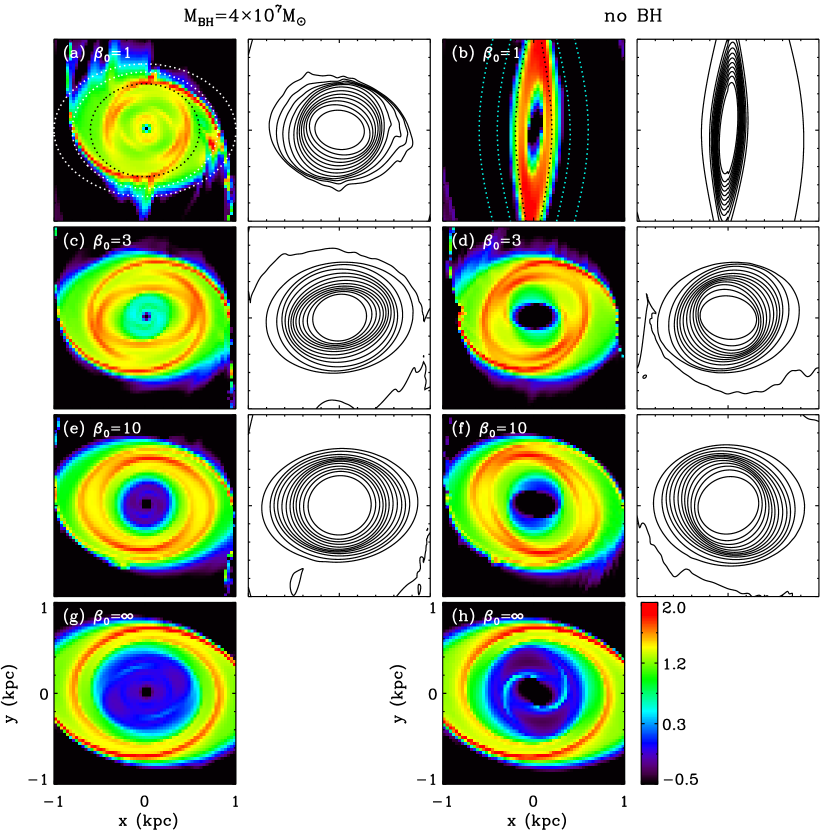
Figure 9 shows the distributions of surface density and magnetic fields in the central regions of all models at the end of the runs ( Myr). Three dotted curves in Figure 9a represent -orbits with , and , while those in Figure 9b are for -orbits with . It is apparent that except for Model bh0MHD01, the shape of a nuclear ring is well described by -orbits. Why is the shape of the ring in Model bh0MHD01 at quasi-steady state so different from the rest? To address this question, we first present how the ring forms and evolves in Model bh7MHD01, and then compare it with the case of Model bh0MHD01.
4.3.1 Ring Formation
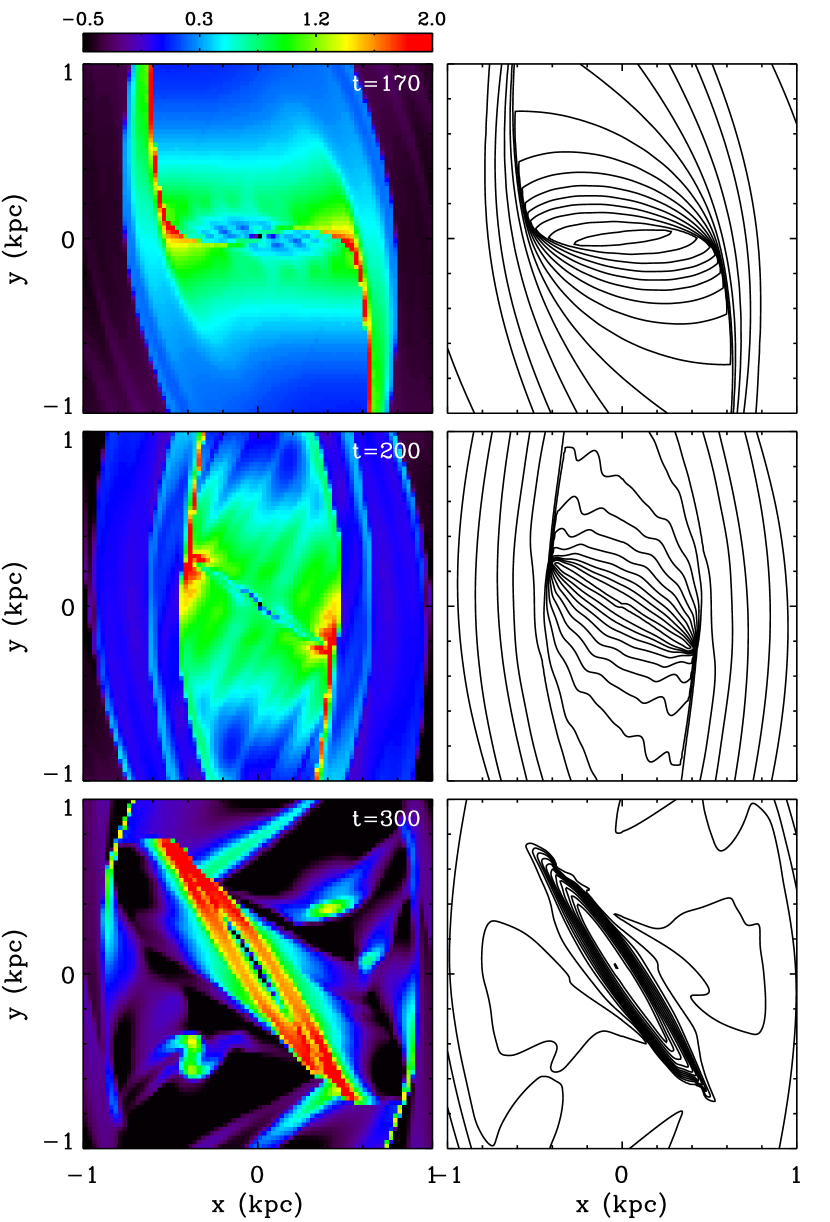
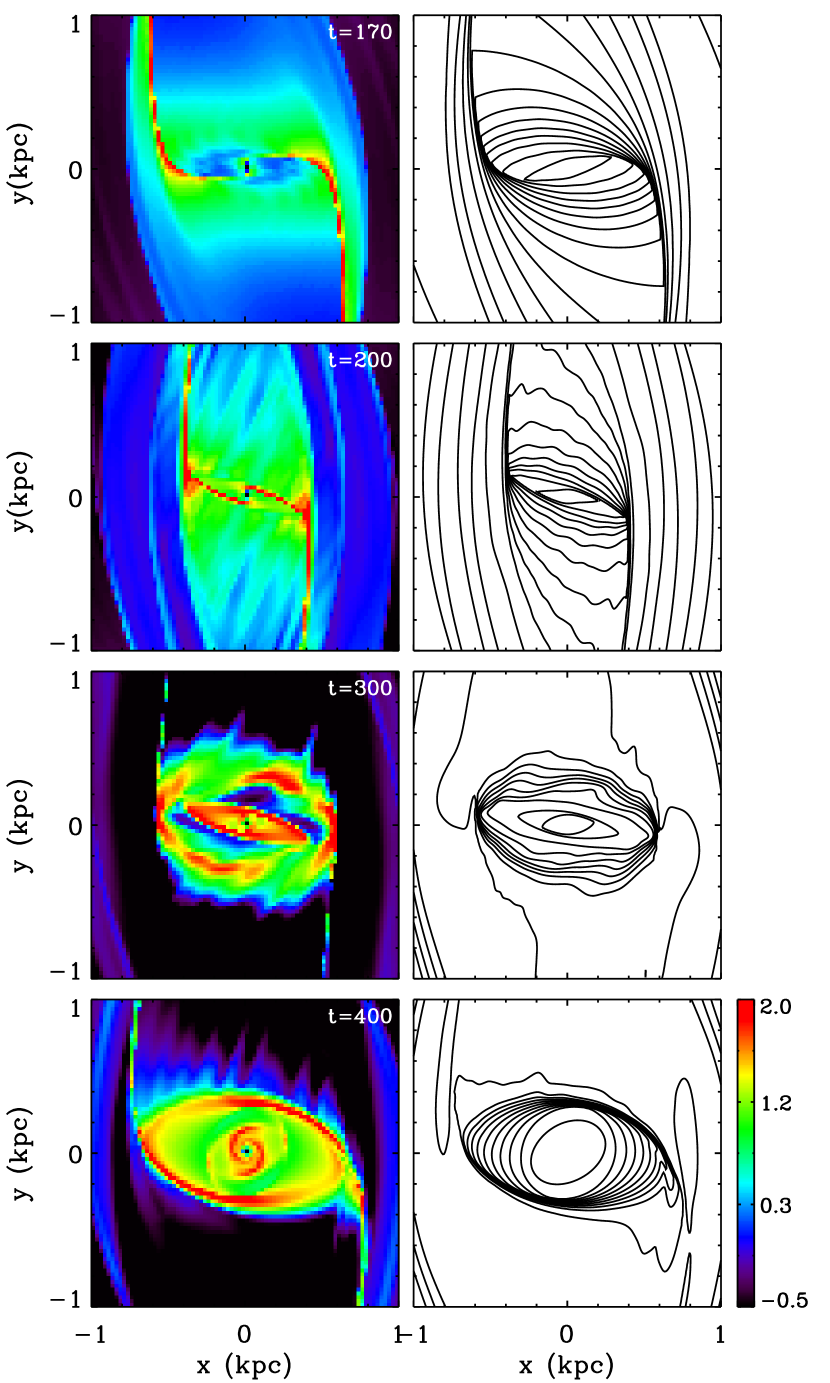
Figure 10 plots evolutionary changes in gas morphologies and field configurations in the central parts of Models bh7MHD01. As the bar potential grows at early time, dust-lane shocks become stronger and tend to move toward the bar major axis. The amount of angular momentum loss at the shocks becomes correspondingly larger with time. At Myr, angular momentum loss at the shocks due to magnetic tension is so large that the gas moving in along the dust lanes makes a sharp turn near the -axis directly toward the galaxy center. This causes the dust lanes to bend into an “L” shape, with the inner (outer) ends aligned perpendicular (parallel) to the bar major axis. This is unlike in hydrodynamic models where angular momentum loss at small is almost negligible, so that most of the gas moving radially in forms a ring at . The inner ends of the L-shaped dust lanes, which are also shocks, come very close together near the center. In Model bh7MHD01, they never make contact with each other because of centrifugal barrier provided by a central BH. Near the center, gas jumps successively from one inner end to the other at the opposite side, and thereby keeps losing angular momentum and moving toward the BH. In a sense, the inner ends of the dust lanes act as “a bar within a bar” proposed by Shlosman et al. (1989), although the inner bar in our models is a gaseous one.
Both inner and outer dust lanes become stronger with time as the bar potential continues to grow until Myr. At this time, angular momentum loss at the outer dust lanes is so large that the gas falls in toward the BH even before arriving at the -axis, making the inner ends rotate slightly in the clockwise direction ( Myr). The central gas that hits the inner dust lanes is accreted to the BH by losing angular momentum further. On the other hand, out-lying gas whose orbits do not cross the inner dust lanes encircles the center largely by following -orbits, gradually transforming to a nuclear ring. As the amount of gas accreted to the BH increases, the inner dust lanes become detached from the ring, forming a bar structure within the nuclear ring at Myr. This inner, perpendicular bar feature persists for Myr. Since the inner bar is just gaseous structure unsupported by any gravitational potential, it decays progressively with time, turning into weak trailing spirals at around Myr. These spirals are continuously affected by pressure perturbations in the ring, weakening slowly with time.
Similarly to in Model bh7MHD01, the dust lanes in Model bh0MHD01 with no BH bend into an “L” shape at Myr, as shown in Figure 11. Unlike in the former where a central BH provides a strong centrifugal force for the inflowing gas, however, the gas in the latter is almost unresisted and can flow in directly to the center. This allows the inner ends of the dust lanes to merge together at the origin ( Myr). As a large amount of gas is accreted to the center during this process, the perpendicular parts of the dust lanes start to dissolve rapidly with time.
As in Model bh7MHD01, the contact points between the dust lanes and nuclear ring in Model bh0MHD01 tend to move upstream along the outer dust lanes. With the inner ends of the dust lanes dissipated away, the gas near the central part of Model bh0MHD01 follow highly eccentric orbits that connect the contact points, resulting in an inclined eccentric ring ( Myr). These eccentric orbits are ballistic, implying that gas dynamical effect is not significant in the ring. The inclined ring precesses slowly in the clockwise direction due to the bar torque that tends to align the semimajor axis of the ring parallel to the bar major axis. The ring in Model bh0MHD01 eventually reaches an equilibrium position at Myr where the ring gas follows an -orbits and feels zero net torque from the bar.
Less-strongly magnetized models with also form “L”-shaped dust lanes, with the inner ends connected to each other at the center when there is no BH. Because angular momentum loss at the dust-lane shocks is not so significant as in the model, however, the contact points are always located nearly on the -axis. The gas orbits connecting the contact points are not so eccentric as in the model, either, with their semimajor axes almost parallel to the -axis. With negligible net bar torque, the ring does not precess in these weak -field models. As the ring continuously interacts with the gas moving in along the dust lanes, it becomes gradually less eccentric and more distributed radially, with its shape remaining similar to an -orbit.
4.3.2 Ring Properties
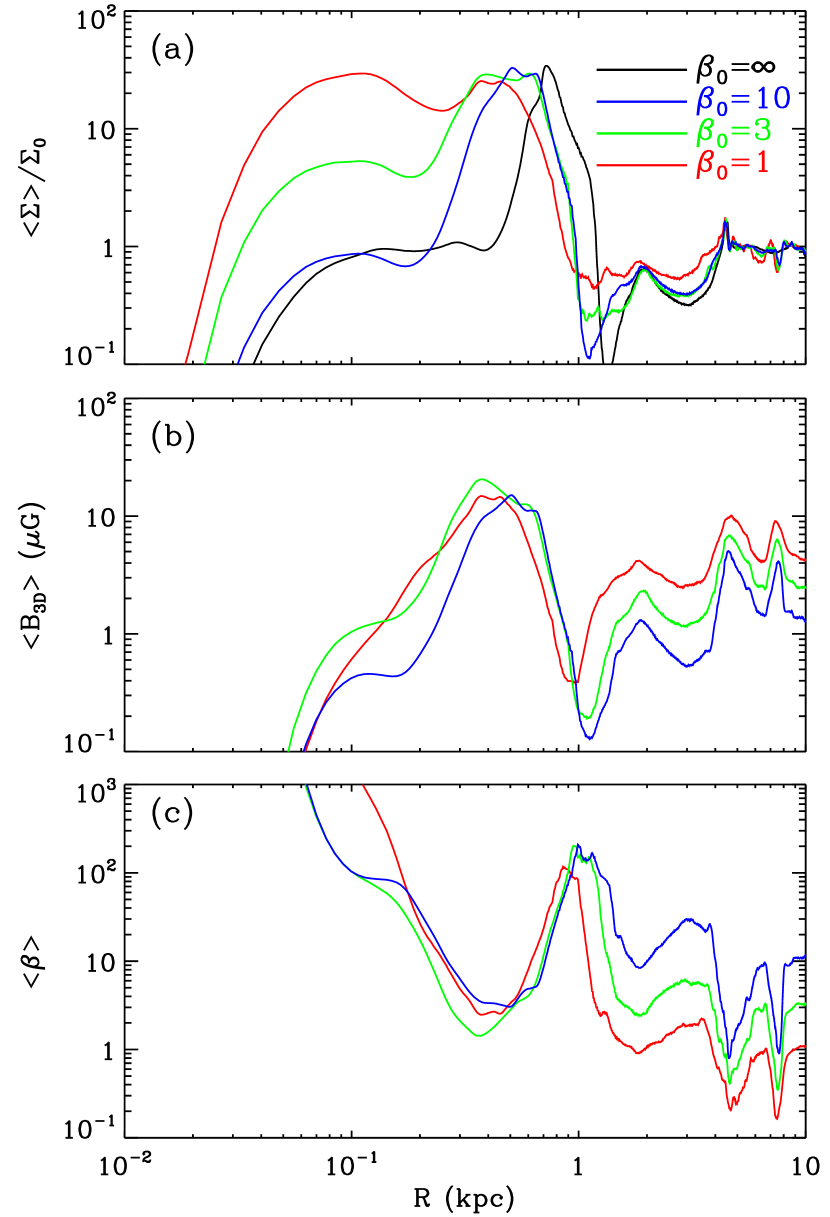
Careful inspection of Figure 9 reveals that the ring becomes smaller as decreases. The density and magnetic fields in the ring are not uniform, often exhibiting weak trailing spiral features connected to the lower ends of the dust lanes. The pitch angle of these spirals, notably in Model bh7MHD01, is less than . To quantity the mean properties of the rings, Figure 12 plots the radial profiles of surface density , magnetic fields , and plasma averaged both azimuthally and temporally over yr for all bh7 models. Table 2 gives the inner and outer radii, and , of the ring, the mass-weighted ring radius , the peak density , the mean density , and the peak magnetic field strength inside the ring in each model. Here, and are defined as the radii where , as in Paper I. The ring becomes smaller and more centrally distributed due to larger angular momentum loss in more strongly magnetized models. Small values of in magnetized models imply that a large quantity of gas is brought in by magnetic torque, readily available for accretion to the central BH.
In our models, the accretion of magnetic fields to the galaxy center is realized by removing magnetic fields inside a central hole together with including the Ohmic dissipation at . Figure 12b,c show that the strength of -fields in the ring (, or equivalently ) in bh7 models does not vary sensitively to the initial since the loss of magnetic flux via accretion to the galaxy center is larger in models with stronger initial fields. While surface density in models with is more or less uniformly distributed inside , magnetic fields peak at and become weaker at smaller . The decline of inward of was caused by the field accretion as well as the Ohmic dissipation occurred at Myr (see Section 4.5).
4.4. Nuclear Spirals
Figure 9 shows that all of the magnetized models do not possess well-defined nuclear spirals at the end of the runs. Only Model bh7MHD01 has short spiral-like features that are remnants of the dissipating inner ends of L-shaped dust lanes. This is in contrast to the hydrodynamic results of Paper I that showed that when the gas is unmagnetized and cold with , bh0 models have strong leading spirals, while bh7 models allow weak (but recognizable) trailing spirals. The absence of nuclear spirals in magnetized models is primarily due to the fact that rings are smaller in size and more centrally concentrated than in hydrodynamic models. The ring material is continuously perturbed by the infalling gas at the contacted points. The associated thermal pressure and magnetic forces inhibit growth and maintenance of any coherent structures in the central parts.
4.5. Mass Inflow Rates
It has been widely accepted that a galactic bar is an efficient means to transport the disk gas all the way to the center to fuel a central BH. Paper I showed that this happens only when the gas has an effective speed of sound . In this case, large thermal pressure at the contact points spreads out the ring material by perturbing gas orbits away from -orbits, some of which on eccentric orbits flow in directly to the center. On the other hand, the gas with forms a narrow nuclear ring that prevents further inflows of the gas to the center.
| Model | ||
|---|---|---|
| bh7MHD01 | ||
| bh7MHD03 | ||
| bh7MHD10 | ||
| bh7HD | ||
| bh0MHD01 | ||
| bh0MHD03 | ||
| bh0MHD10 | ||
| bh0HD |
Note. — Time average of is taken over Myr.
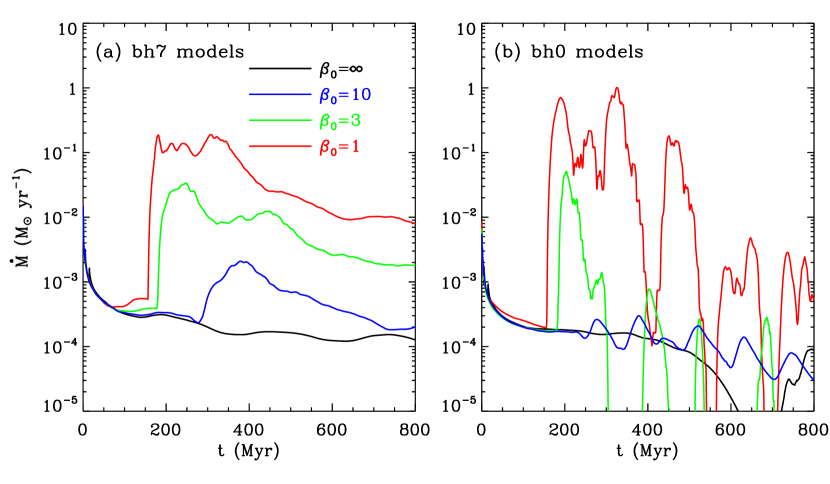
We have seen earlier that magnetic stress in the dust lanes removes a significant amount of angular momentum from the gas in the dust lanes and thus causes it to move in close to the galaxy center, potentially increasing the mass inflow rates. To quantify the effect of magnetic fields on , Figure 13 plots temporal changes of for all models. The time-averaged value of and its standard deviation over Myr are given in Table 3. A sudden increase of at Myr in models is due to the direct inflows of the gas through the inner ends of the L-shaped dust lanes. This happens later in models with weaker fields since it takes the gas longer to reach the galaxy center due to lower angular momentum loss at the shocks. On average, in models is larger by more than two orders of magnitude than in the unmagnetized counterpart. This is of course because nuclear rings in the former are more centrally concentrated and have a much larger interior density than the latter.
The presence of a central BH in bh7 models circularizes surrounding gas orbits and thus makes the initial increase of less dramatic than in the bh0 counterpart where infalling gas can plunge directly into the central hole. With more-or-less circular orbits, the gas in bh7 models flows in continuously to the hole, exhibiting sustained mass inflows. On the other hand, the rapid mass inflows in bh0 models consume the neighboring gas almost completely, lowering temporarily before fresh gas is supplied from the outer parts. When the central regions are filled in, the mass inflows resume. This makes relatively intermittent in bh0 models.333Assuming a slow and steady inflow due to magnetic torque, Beck et al. (2005) estimated , very close to the peak value in Model bh0MHD01, although mass inflows in our models occur mostly by gas on non-steady eccentric orbits rather than steady near-circular ones.
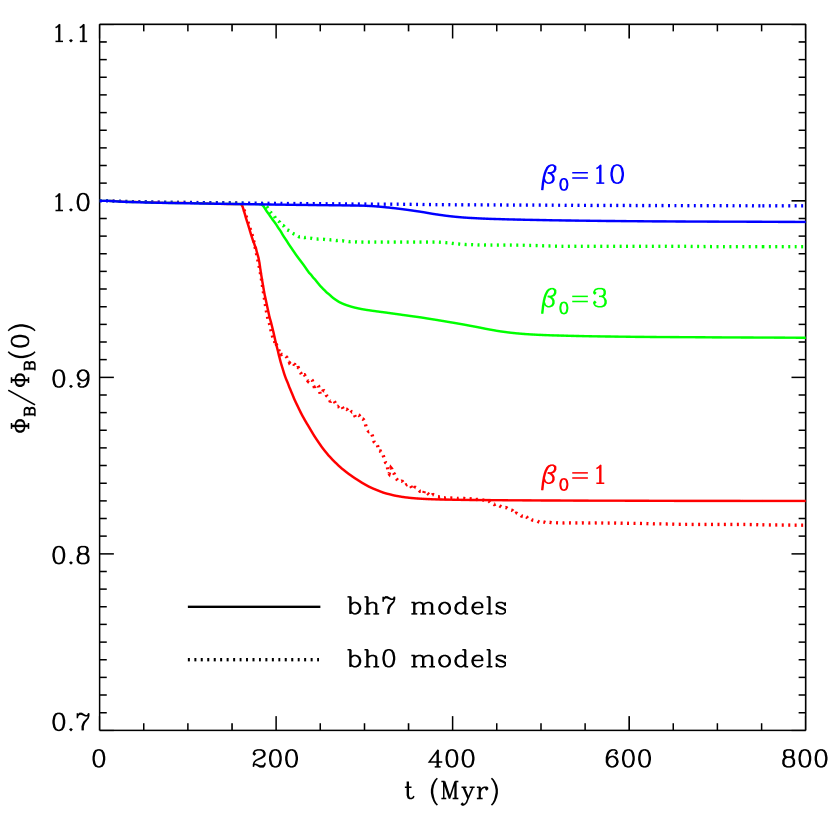
To quantify the amount of magnetic fields removed (via accretion or Ohmic dissipation), we plot in Figure 14 temporal changes of magnetic flux relative to the initial value for all magnetized models. A sudden drop in occurs almost at the same epoch as the steep rise of , after which remains almost constant. This is because magnetic fields in the central regions remain very weak after the rapid accretion phase, so that the magnetic flux carried in by the gas afterward is not appreciable. The decrease of in bh7 models amounts to , and relative to the initial value for models with , and 10, respectively, suggesting that the loss of magnetic flux can be significant depending on the field strength.
5. Outer Regions
As explained in Section 3, the outermost -orbit divides a galactic disk essentially into two dynamically disconnected regions. Gas responses inside it are highly dynamic, exhibiting dust-lane shocks and significant angular momentum loss leading to the formation of a nuclear ring. With no crossing of closed gas orbits, however, the evolution of gas outside the outermost -orbit does not involve shocks and is thus much less dramatic. In unmagnetized models, the gas at experiences a weak bar torque and moves radially in only slightly, piling up at the outermost -orbit.
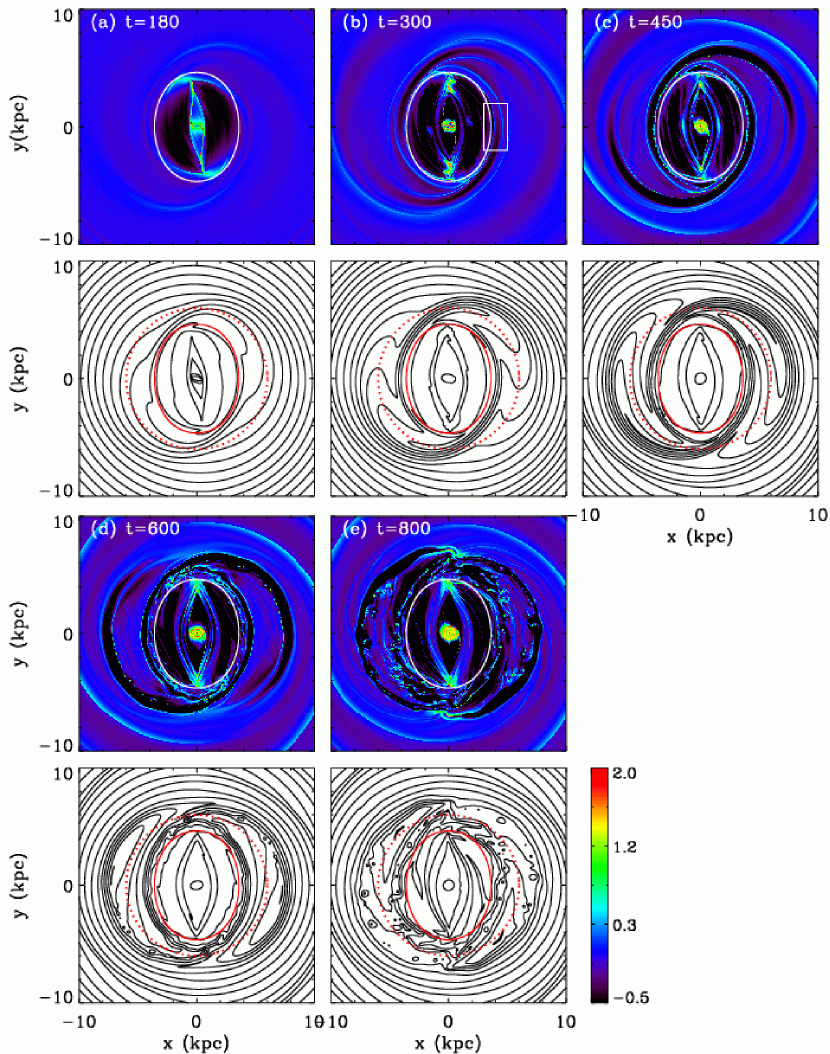
The presence of magnetic fields makes the gas responses in the outer regions completely different from that of unmagnetized cases. Figure 15 shows snapshots of surface density (logarithmic colorscale) and magnetic fields (contours) in Model bh7MHD01. The boxes extend to on either side of the center. The solid oval in each panel draws the outermost -orbit, while dotted circles in the lower panels with contours indicate the CR. At Myr, magnetic fields at are relatively unperturbed compared to those inside. They closely follow the outermost -orbit near and are slightly compressed along the weak trailing spirals emerging from the leading side of the bar ends.
Note that the field lines are distorted near the CR and inward of it. This arises by the combined action of the bar potential and background shear in such a way that small radial gas motions induced by the bar potential create the radial component from the azimuthal component of the initial magnetic fields, which is then stretched by background shear to generate new that is going to turn to again by the radial motions. The whole process makes a closed cycle, resulting in a secular growth of magnetic fields in the outer regions. This is an ideal MHD dynamo, as opposed to the mean-field dynamo, that does not require the parametric terms in the induction equation. In our models, the MHD dynamo occurs naturally under a combined action of the bar potential and galactic shear. Figure 15 shows that the MHD dynamo operates most efficiently near the CR regions along the bar minor axis.
Through magnetic stress, the distorted field lines transport angular momentum from inside to outside, causing gas and newly generated field lines at smaller (larger) to move radially inward (outward). Since the field lines do not move across the outermost- orbit, those moving in are continuously accumulated there and increase the field strength at the base of the trailing spiral arms, while those moving outward are swept by galaxy rotation and added to the outer parts of the arms ( Myr). Although less apparent in Figure 15b, the MHD dynamo is also effective near the bar ends just inside the outermost -orbit where both and shear are strong: is stretched by the gas flows just outside the dust lanes, generating new that moves radially outward and is added to the base of the spiral arms.
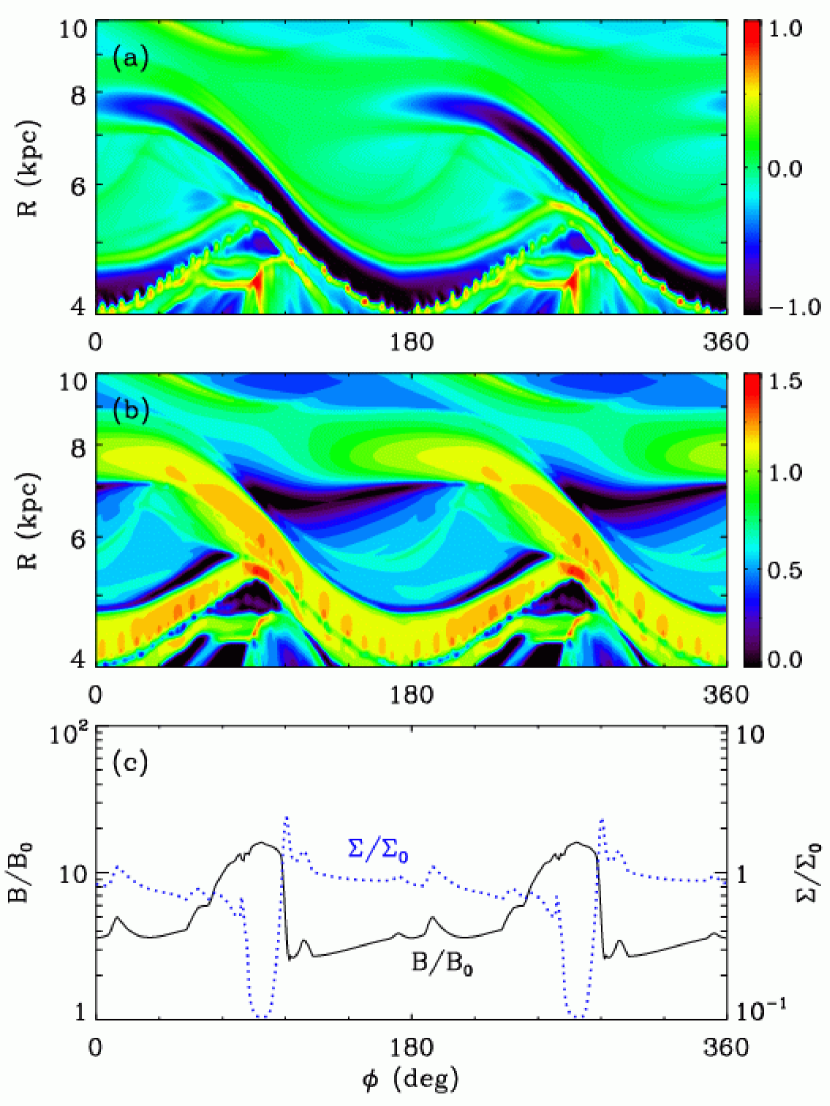
Due to the MHD dynamo action occurring near the CR, the spiral arms become increasingly more magnetized. The associated strong magnetic pressure expels the gas away from the arms, eventually forming “magnetic arms” that are characterized by stronger magnetic fields with lower density than the surrounding region at Myr. This confirms the results of Kulesza-Żydzik et al. (2009, 2010) who first found that the bar potential develops magnetic arms in outer regions. Figure 16 plots gas surface density and magnetic field strength in the – plane as well as the their cut profiles at for Model bh7MHD01 at Myr. It is apparent that the magnetic arms at are approximately logarithmic in shape with a pitch angle of . The peak -field strength of the magnetic arms at is , occurring at the location where gas surface density is minimized at . The gaseous arms produced by the expelled gas from the magnetic arms have the peak density and lead the magnetic arms by in the azimuthal angle. The magnetic arms keep growing in strength as the MHD dynamo continues operating. Since the added fields are preferentially azimuthal, the outer ends of the arms curl back in ( Myr) and touch the bar end at the opposite side ( Myr).
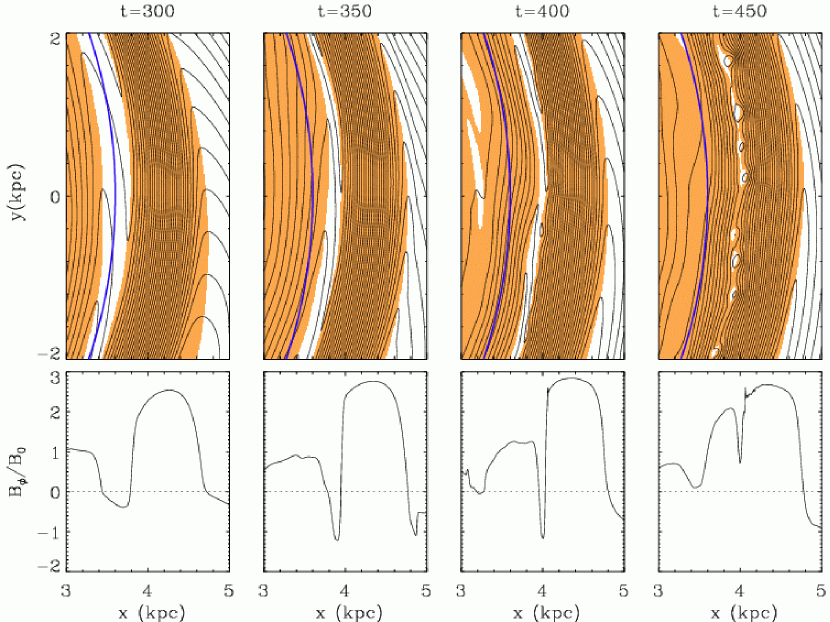
Figure 15e shows that surface density and magnetic fields in the outer regions of Model bh7MHD01 become quite chaotic at the end of the run. This is caused by reconnection of magnetic fields occurring at the base of the magnetic arms. Figure 17 illustrates how magnetic fields reconnect in the rectangular section shown in Figure 15b from to 450 Myr. The shaded (unshaded) regions in the upper panels represent domains with positive (negative) , with the interfaces representing the reversal of the field direction. The thick blue line in the upper panels indicates a part of the outermost -orbit. The lower panels plot the profiles of along the cut. At Myr, the shaded region at the right side of the outermost -orbit corresponds to a segment of the magnetic arms. The sheared magnetic fields with negative to the left of the magnetic arms are pushed outward as the inner regions expand due to the pressure gradient ( Myr). With the base of the magnetic arms acting as a rigid wall, this squeezes the magnetic fields of opposite polarity into a very narrow layer, developing a thin current sheet at ( Myr). Non-zero numerical resistivity allows the fields to reconnect in the current sheet through a tearing-mode instability, producing numerous magnetic islands distributed along the base of the arms ( Myr). Magnetic islands that are also sites of density compression move along the magnetic arms in the course of galaxy rotation, and interact with the surrounding gas to produce chaotic density and magnetic structures in the outer regions.
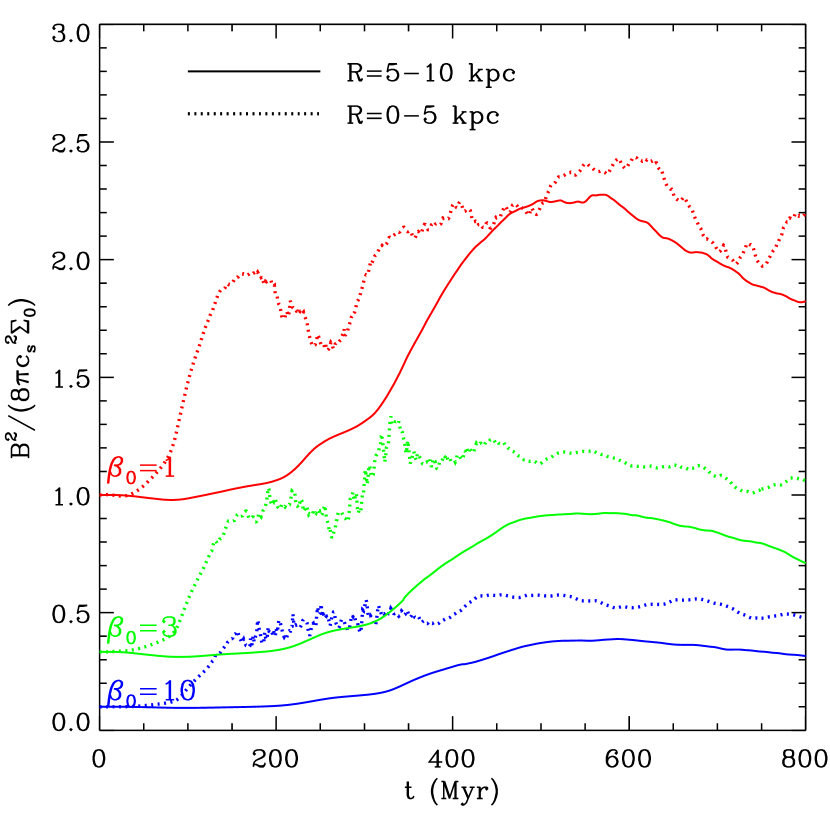
Figure 18 plots the temporal evolution of the mean magnetic energy density relative to the initial thermal energy density for bh7 models. The solid and dotted lines are for an annulus with and its interior at , respectively. The initial rise of in the interior region at Myr is due to the formation of dust lanes where -fields are compressed, while the second rise at is due to the MHD dynamo occurring at the bar ends. The MHD dynamo operating near the CR is responsible for the growth of in the annulus for Myr. The corresponding increase of the magnetic energy density is a factor of for models and for models. The ensuing decrease of results from the magnetic reconnection that not only reduces magnetic energy but also makes the outer disk chaotic.
6. Summary and Discussion
6.1. Summary
We run high-resolution MHD simulations using a modified version of the Athena code to study the effects of magnetic fields on bar substructures and the mass inflow rates in barred galaxies. This work directly extends Paper I in which we explored the case of unmagnetized disks using the CMHOG code. Most previous studies on magnetic fields in barred galaxies employed the mean-field dynamo, ignoring the back reaction of magnetic fields that evolve passively according to the velocity fields obtained from hydrodynamic runs (see Section 1 for references). On the other hand, Kulesza-Żydzik et al. (2009, 2010) and Kulpa-Dybeł et al. (2011) performed three-dimensional simulations using ideal MHD models, but they focused mainly on the formation of magnetic arms in the outer regions and their morphological changes due to varying rotation frequency and sound speed. While our models are two-dimensional, they have about 10 times higher resolution in the in-plane direction than the three-dimensional models of Kulesza-Żydzik et al. (2010), enabling detailed study of the bar and nuclear regions.
We consider an infinitesimally-thin, isothermal, rotating, magnetized gas disk with initially uniform surface density. The magnetic fields are initially purely azimuthal and uniform with strength measured by the dimensionless plasma parameter . We fix the sound speed to and vary as well as the mass of a BH that controls the rotation curve near the galaxy center. The main results of the current paper can be summarized as follows.
1. Comparisons between the results of hydrodynamic models using the CMHOG and Athena codes show that except for small differences in the ring size and location of dust lanes, two results are in good agreement with each other. The differences are most likely due to the fact that the Athena runs with a uniform Cartesian grid have higher spatial resolution at , so that the dust-lane shocks are a bit stronger, resulting in larger angular momentum loss than in the CMHOG runs that use a non-uniform cylindrical grid. On the other hand, the CMHOG runs resolve the central regions much better and thus have stronger nuclear spirals than in the Athena runs. The close agreement between the results from the difference codes confirms not only that the bar forces are correctly implemented in the CMHOG code used in Paper I, but also that the Cartesian Athena code is reliable in handling dynamics of rotating flows.
2. Our adopted model for the external gravitational potential has an outermost -orbit that crosses the - and -axes at and , respectively, and has a Jacobi energy , relative to which gas responses to the bar potential is completely different between inside and outside. Inside this orbit (i.e., in the bar regions), there exist families of closed - and -orbit that cross each other, so that gas on these orbits collides to produce shocks that eventually develop into dust lanes and a nuclear ring. As the gas loses angular momentum and moves toward the galaxy center, the bar regions becomes progressively emptied, decreasing the strength of the dust lanes. Outside this orbit, on the other hand, there is no closed orbit and the bar forces are weak, resulting in much milder gas responses than in the bar regions.
3. Even in the presence of magnetic fields, the bar regions produce a pair of dust-lane shocks at the leading side of the bar and a nuclear ring, just like in unmagnetized models. However, magnetic fields make several quantitative changes in the properties of bar substructures and mass inflow rates. First, magnetic fields compressed in dust lanes tend to reduce the peak density of the shocks compared to the unmagnetized counterpart. Second, the post-shock inflows immediate behind of the shocks along the dust lanes rotate magnetic fields abruptly at the shock fronts. The bent field lines exert magnetic tension forces to the gas moving across the shocks, removing further angular momentum from it. This causes the infalling gas to move closer to the galaxy center, forming a nuclear ring that is smaller in radius and more centrally distributed than in the hydrodynamic model. Third, small centrally-concentrated rings in magnetized models destroy coherent perturbations in the nuclear regions that would otherwise grow into nuclear spirals in magnetized models. Fourth, the enhanced density in the nuclear regions increases the mass inflow rates greatly. For instance, magnetized models with have a time-averaged mass inflow rate of , which is larger by more than two orders of magnitude than that in the unmagnetized models.
4. In models with , a rapid loss of angular momentum caused by magnetic stress at dust-lane shocks causes them to bend transiently into an “L” shape, with the lower ends pointing roughly perpendicular to the bar major axis. The lower ends of the dust lanes essentially play a role of “bars within bars” since the gas moving across them keeps losing angular momentum, moving toward the galaxy center. Unsupported by any gravitational potential, this bar-within-a-bar phase does not persist, lasting only for about . As the central gas is lost via accretion to a BH, the lower ends of the dust lanes dissipate gradually, turning to trailing nuclear spirals in models with that decay with time.
5. The shape of a nuclear ring at the end of the run can be completely different depending on the parameters. In our models, all nuclear rings that form follow an -orbit closely except for Model bh0MHD01 (with and no BH) in which the ring shape is described rather by an -orbit elongated along the bar major axis. In the latter model, there is no centrifugal barrier associated with a central BH, so that the lower ends of the L-shaped dust lanes come very close together to merge at the center, after which they dissolve rapidly with time. The remaining gas forms a highly eccentric ring that is inclined with respect to the bar minor axis. The inclined ring under the bar torque precesses slowly in the clockwise direction to align its long axis parallel to the bar major axis.
6. In hydrodynamic models, the regions outside the outermost -orbits are almost featureless other than possessing a pair of weak trailing spirals that emerge from the leading side of the bar ends. In magnetized models, however, the outer regions are dynamically active involving an MHD dynamo, magnetic arms, and field reconnection. The MHD dynamo occurs near the CR and bar-end regions where both the bar forces and background shear are strong, so that the bar potential induces the radial velocity perturbations, producing from . Background shear then stretches to generate that subsequently turns into due to the radial velocity perturbations, closing the loop of the MHD dynamo cycle. The increase of magnetic energy due to the MHD dynamo is about a factor of with a larger value corresponding to stronger initial fields. The amplified fields move inward/outward radially, adding to fields in the trailing spiral arms as well as their base. As the arms become more magnetized, the arm gas is expelled by strong magnetic pressure, forming magnetic arms that have stronger fields but lower density than the surrounding regions. Magnetic fields with opposite polarity produced by the MHD dynamo are compressed into a thin layer at the base of the magnetic arms. With non-zero numerical resistivity, the fields start to reconnect in the layer via conventional tearing-mode instability, producing numerous magnetic islands with large density. These magnetic islands propagate along the magnetic arms to make the outer regions highly chaotic.
6.2. Discussion
Our numerical results show that the density and magnetic fields in dust lanes remain strong only for 100 Myr around the time when the bar potential achieves the full strength. The rather rapid decline of the strength of dust lanes is primarily due to the fact that the gas located outside the outermost -orbit is trapped there and unable to move further in. As the gas inside this orbit experiences shocks and falls in toward the center, the bar regions become evacuated and the density in the dust lanes drops accordingly. Observations indicate that most barred galaxies without inner rings possess a pair of prominent dust lanes (e.g., Kormendy & Kennicutt 2004) that are nearly straight in strong bars (Knapen et al., 2002; Comeròn et al., 2009). Our results suggest that barred galaxies with strong dust lanes should have a stellar bar that is dynamically young, or there should be mechanisms replenishing the gas in the bar regions. Candidate mechanisms for the latter include a spiral-arm potential outside the CR that perturbs gas orbits to send it in across the outermost -orbit and infalls of halo gas in the form of galactic fountains (e.g., Fraternali & Binney 2006, 2008).
Radio polarization observations of barred spiral galaxy NGC 1097 (Beck et al., 1999, 2005) reveal that (1) radio ridges roughly coincide with the dust lanes in the bar region; (2) the direction of the magnetic fields changes strongly in the upstream side, making the polarized emission almost absent there; (3) the equipartition strength of the regular plus anisotropic random magnetic fields is G in the nuclear ring; (4) G in the dust lanes; (5) the regular fields pass through the nuclear ring, with an inclination angle of , which appears to deviate from the streamlines of the gas flow around the ring; and (6) the regular fields in the nuclear region have a spiral shape with large pitch angles. Points (1)-(3) are entirely consistent with our numerical results. Point (4) appears consistent with our results provided that the bar in NGC 1097 is dynamically young; otherwise density and magnetic fields of the dust lanes would not be strong enough to be observed. Again, rejuvenation of the dust lanes due to gas inflows by spiral arms and/or galactic fountains would be an alternative possibility. Points (5) and (6) appear inconsistent with our results that show that magnetic fields follow the nuclear rings very closely with a pitch angle less than and nearly circular in the central parts (see Fig. 9). These discrepancies may owe to the fact that our models are limited to a two-dimensional razor-thin geometry with purely azimuthal initial fields, and thus are unable to capture the potential effects of poloidal fields and other dynamical processes that may be important in three dimensions. In addition, star formation and associated small-scale turbulent dynamo occurring in nuclear rings of real galaxies may considerably affect the field configurations in the central regions.
The concept of “bars within bars” was introduced by Shlosman et al. (1989) to overcome the difficulty, caused by the formation of a narrow nuclear ring, of a single large-scale bar in bringing the disk gas all the way to within from the galaxy center to feed an AGN. Near-infrared and/or CO observations of nearby barred galaxies indeed show that a substantial fraction of disk galaxies exhibit double bars (e.g., Shaw et al. 1995; Friedli et al. 1996; Erwin & Sparke 1999; Garcia-Burillo et al. 1998; Maciejewski & Sparke 2000), with the extent of the secondary (nuclear) bars typically 5 to 7 times shorter than that of the primary bar. The origin of secondary bars is yet unclear. They may arise from gravitational instability of a disk containing both stars and gas (e.g., Friedli & Benz 1993; Combes 1994; Heller & Shlosman 1994), or be due to crowding of stellar orbits perturbed by gravity of a nuclear ring (e.g., Shaw et al. 1993), or be produced by an unstable gaseous disk in the central part (e.g., Shlosman et al. 1989; see also Athanassoula 2000 and references therein). Using a dynamically-possible doubly-barred galaxy model, Maciejewski et al. (2002) showed that a hydrodynamic response of the gas to a self-consistent, secondary-bar potential is much weaker than that to the primary bar and is thus unable to enhance the mass inflow rates much. Our numerical results show that magnetic fields naturally produce, albeit transiently, a bar-within-bar structure that greatly enhances the mass inflow rates even without invoking the secondary stellar bar potential. In our models, the secondary bar (or inner dust lanes) is almost corotating with the outer primary bar and lasts only for Myr before turning to weak trailing spirals. Since we include the effect of stars via a fixed gravitational potential, we are of course unable to consider the back reaction of stars to the gaseous gravity.
Our models show that MHD dynamo action due to a bar potential combined with background shear produces magnetic arms in the outer regions, consistent with the results of Kulesza-Żydzik et al. (2009, 2010) and Kulpa-Dybeł et al. (2011) who reported that magnetic arms drift into interarm regions due to a lower angular velocity than gaseous spirals. In most external disk galaxies, magnetic field directions based on polarized synchrotron radiation follow optical spiral structures fairly well, with stronger total (regular plus turbulent) fields inside the arms than outside (e.g., Beck et al. 1996; Fletcher et al. 2011). However, there are some exceptional galaxies such as IC 342 (e.g., Krause 1993) and NGC 6946 (e.g., Beck & Hoernes 1996) that are known to have strongest magnetic fields at magnetic spiral arms that lie in between optical arms. Proposed mechanisms for magnetic arms include MHD density waves in two dimensions (Fan & Lou, 1996; Lou & Fan, 1998) and mean-field turbulent dynamo (Moss, 1998; Shukurov, 1998; Rohde et al., 1999). The MHD wave theory invokes a systematic phase-shift between fast and slow MHD modes responsible for optical and magnetic arms, respectively (Lou & Fan, 1998), although this requires rigid-body rotation over a wide range of radii. In addition, MHD waves are subject to a buoyant instability when the vertical degree of freedom is allowed (Shukurov, 2005). On the other hand, the mean-field dynamo theory argues that optical arms have stronger turbulent motions hence larger turbulent magnetic diffusivity, resulting in weaker fields than interarm regions, although it relies on uncertain parameters including the dynamo number and ignores the dynamical effects of magnetic fields on the gas.
Can the MHD dynamo occurring in the outer regions of our numerical models account for observed magnetic arms in IC 342 and NGC 6949? We think this is unlikely since the connection between bar-induced magnetic arms and those observed is quite uncertain. First of all, the disk galaxies with observed well-defined magnetic arms are not strongly barred (e.g., Regan & Vogel 1995). In addition, the spiral arms in NGC 6949 have weak, modes, whereas the bar potential preferentially amplifies arms. Moreover, it is uncertain if the MHD dynamo in three dimensions occurs similarly to in two-dimensional in-plane geometry, studied in this work. Nevertheless, the MHD dynamo as a mechanism for field amplification in barred galaxies is quite attractive in that it uses only natural ingredients (bar potential and galactic shear) without making any assumption. It may have something do with relatively weak magnetic arms observed in outer regions of barred galaxies such as NGC 1365 (Beck et al., 2002), NGC 1097 and NGC 1365 (Beck et al., 2005), although it is questionable if the gaseous arms in these galaxies are driven solely by a bar potential. While our models considered only a bar potential as a perturbing agent for simplicity, real galaxies also have spiral arms in the regions outside a bar. It would be interesting to study how the MHD dynamo due to a bar potential conspires with a spiral-arm potential to generate and shape magnetic fields in outer regions.
Appendix A Numerical Viscosity and Magnetic Diffusivity of the Athena Code
In this Appendix we evaluate numerical viscosity and magnetic diffusivity of the Athena code by using the damping rates of traveling magnetosonic waves. We begin by writing the MHD equations for isothermal, viscous, and resistive plasma
| (A1) |
| (A2) |
| (A3) |
where and are the coefficient of kinematic viscosity and magnetic diffusivity, respectively. Other symbols have their usual meanings.
For the purpose of measuring the numerical values of and of the Athena code used in this work, we limit ourselves to magnetosonic waves propagating along the direction perpendicular to the initial magnetic fields through an initially static, uniform medium with density . We consider small-amplitude perturbations , , and to the density, velocity, and magnetic fields, respectively. Assuming , and , we linearize equations (A1) – (A3) to obtain a set of the perturbed equations
| (A4) |
| (A5) |
| (A6) |
We now seek for the plane-wave solutions with wavenumber and frequency . Plugging these into equations (A4) – (A6) and eliminating and in favor of , we obtain the dispersion relation
| (A7) |
where is the Alfvén speed. It is trivial to show that when , equation (A7) is reduced to the relation
| (A8) |
for magnetosonic waves. The corresponding (real) eigensolutions are
| (A9) |
where is the amplitude of the perturbations in the absence of viscosity and magnetic diffusivity.
When and are non-zero but small (i.e., ), equation (A7) yields
| (A10) |
implying that viscosity and magnetic diffusivity cause the perturbation amplitude in equation (A9) to decay exponentially with time as
| (A11) |
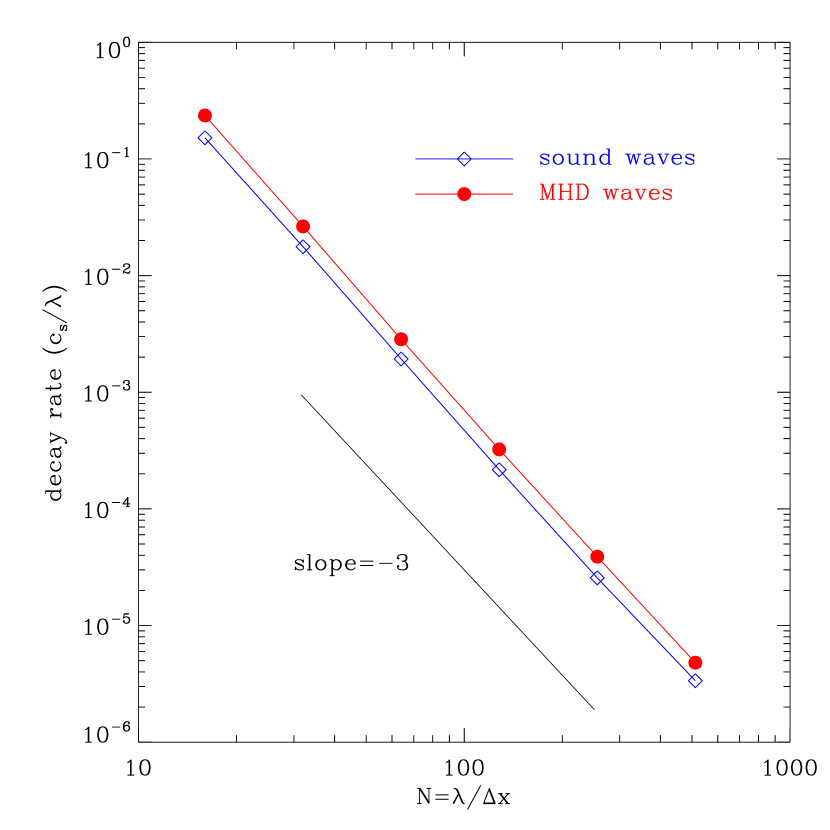
To evaluate and separately, we first consider pure sound waves with wavelength in an unmagnetized medium, and initialize in the Athena code the perturbations according to equation (A9) at . We fix the initial amplitude to , and monitor the temporal decay of the wave amplitude. The resulting decay rates for various runs with differing , the number of grid points per wavelength, are plotted in Figure 19 as open diamonds. The best fit to the numerical viscosity is found to be
| (A12) |
Note that is proportional to , completely analogous to the behavior of the numerical conductivity of the Athena code reported by Kim et al. (2008).
Next, we set up magnetosonic waves using equation (A9) at together with and . Figure 19 plots as filled circles the numerical damping rates of the magnetosonic waves due to both viscosity and magnetic diffusivity. After correcting for the viscous contribution using equation (A12), the residual damping rates are fitted by the numerical diffusivity as
| (A13) |
for . Note that and are of the same order. While is quite small, the related magnetic diffusion time can be comparable to the dynamical time (e.g., bar orbital period) if the field strength changes substantially across the grid spacing . For instance, for and typical for tearing modes of magnetic reconnection occurring in our simulations.
References
- Ann & Thakur (2005) Ann, H. B., & Thakur, P. 2005, ApJ, 620, 197
- Athanassoula (1992a) Athanassoula, E. 1992a, MNRAS, 259, 328
- Athanassoula (1992b) Athanassoula, E. 1992b, MNRAS, 259, 345
- Athanassoula (2000) Athanassoula, E. 2000, in Alloin D. et. al, ASP Conf. Series, V. 221, ed. D. Alloin, K. Olsen, & G. Galaz (San Francisco: ASP), 243
- Balbus & Hawley (1998) Balbus, S. A., & Hawley, J. F. 1998, Rev. Mod. Phy., 70, 1
- Beck (2009) Beck, R. 2009, Astrophys. Space Sci. Trans., 5, 43
- Beck & Hoernes (1996) Beck, R., & Hoernes, P. 1996, Nature, 379, 47
- Beck et al. (1996) Beck, R., Brandenburg, A., Moss, D., Shukurov, A., & Sokoloff, D. 1996, ARA&A, 34, 155
- Beck et al. (1999) Beck, R., Ehle, M., Shoutenkov, V., Shukurov, A., Sokoloff, D. 1999, Nature, 397, 324
- Beck et al. (2002) Beck, R., Shoutenkov, V., Ehle, M., et al. 2002, A&A, 391, 83
- Beck et al. (2005) Beck, R., Fletcher, A., Shukurov, A., Snodin, A., Sokoloff, D. D., Ehle, M., Moss, D., & Shoutenkov, V. 2005, A&A, 444, 739
- Buta (1986) Buta, R. 1986, ApJS, 61, 609
- Buta & Combes (1996) Buta, R., & Combes, F. 1996, Fund. Cosmic Phys., 17, 95
- Camenzind & Lesch (1994) Camenzind, M., & Lesch, H. 1994, A&A, 284, 411
- Combes (1994) Combes, F. 1994, in Mass-Transfer Induced Activity in Galaxies, ed. I. Shlosman (Cambridge: Cambridge Univ. Press), 170
- Comeròn et al. (2009) Comeròn, S., Martìnez-Valpuesta, I., Knapen, J. H., & Beckman, J. E. 2009, ApJ, 706, L256
- Contopoulos & Grosbøl (1980) Contopoulos, G., & Grosbøl, P. 1989, A&A Rev., 1, 261
- Englmaier & Gerhard (1997) Englmaier, P., & Gerhard, O. 1997, MNRAS, 287, 57
- Erwin & Sparke (1999) Erwin, P., & Sparke, L. S. 1999, in ASP Conf. Ser. 182, Galaxy Dynamics, ed. D. R. Merritt & J. A. Sellwood (San Francisco: ASP)
- Fan & Lou (1996) Fan, Z., & Lou, Y. Q. 1996, Nature, 383, 800
- Ferrers (1887) Ferrers, N. M. 1887, Q.J.Pure Appl. Math., 14, 1
- Fletcher et al. (2011) Fletcher, A., Beck, R., Shukurov, A., Berkhuijsen, E. M., & Horellou, C. 2011, MNRAS, 412, 2396
- Fraternali & Binney (2006) Fraternali F., Binney J. 2006, MNRAS, 366, 449
- Fraternali & Binney (2008) Fraternali F., Binney J., 2008, MNRAS, 386, 935
- Friedli et al. (1996) Friedli, D., Wozniak, H., Rieke, M., Martinet, L., & Bratschi, P. 1996, A&AS, 118, 461
- Friedli & Benz (1993) Friedli, D., & Benz, W. 1993, A&A, 268, 65
- Garcia-Burillo et al. (1998) Garcia-Burillo, S., Sempere, M. M., Combes, & Neri, R. 1998, A&A, 333, 864
- Gardiner & Stone (2005) Gardiner, T. A., & Stone, J. M. 2005, J. Comput. Phys., 205, 509
- Hsieh et al. (2011) Hsieh, P.-Y., Matsushita, S., Liu, G. Ho, P. T. P., Oi, N., & Wu, Y.-L. 2011, ApJ, 736, 129
- Heller & Shlosman (1994) Heller, C. H., & Shlosman, I. 1994, ApJ, 424, 84
- Knapen et al. (2000) Knapen, J. H., Shlosman, I., & Peletier, R. F. 2000, ApJ, 529, 93
- Knapen et al. (2002) Knapen, J. H., Pérez-Ramìrez, D., & Laine, S. 2002, MNRAS, 337, 808
- Kim et al. (2008) Kim, C.-G., Kim, W.-T., & Ostriker, E. C. 2008, ApJ, 681, 1148
- Kim & Ostriker (2001) Kim, W.-T., & Ostriker, E. C. 2001, ApJ, 559, 70
- Kim & Ostriker (2006) Kim, W.-T., & Ostriker, E. C. 2006, ApJ, 646, 213
- Kim et al. (2012) Kim, W.-T., Seo, W.-Y., Stone, J. M., Yoon, D., & Teuben, P. J. 2012, ApJ, 747, 60
- Kormendy & Kennicutt (2004) Kormendy, J., & Kennicutt, R. C. 2004, ARA&A, 42, 603
- Krause (1993) Krause, M. 1993, in IAU Symp. 157: The Cosmic Dynamo, eds. F. Krause, K. H. Rädler, & G. Rüdiger (Dordrecht:Kluwer), 305
- Koldoba et al. (2002) Koldoba, A. V., Romanova, M. M., Ustyugova, G. V., & Lovelace, R. V. E. 2002, ApJ, 576, L53
- Kulesza-Żydzik et al. (2009) Kulesza-Żydzik, B., Kulpa-Dybeł, K., Otmianowska-Mazur, K., Kowal, G., & Soida, M., 2009, A&A, 498, L21
- Kulesza-Żydzik et al. (2010) Kulesza-Żydzik, B., Kulpa-Dybeł, K., Otmianowska-Mazur, K., Soida, M., & Urbanik, M. 2010, A&A, 522, 61
- Kulpa-Dybeł et al. (2011) Kulpa-Dybeł, K., Otmianowska-Mazur, K., Kulesza-Żydzik, B., Hanasz, M., Kowal, G., Wóltański, D., & Kowalik, K. 2011, ApJ, 733, L18
- Lou & Fan (1998) Lou, Y. Q., & Fan, Z. 1998, ApJ, 493, 102
- Maciejewski (2004) Maciejewski, W. 2004, MNRAS, 354, 892
- Maciejewski & Sparke (2000) Maciejewski, W., & Sparke, L. S. 2000, MNRAS, 313, 745
- Maciejewski et al. (2002) Maciejewski, W., Teuben, P. J., Sparke, L. S., & Stone, J. M. 2002, MNRAS, 329, 502
- Maoz et al. (2001) Maoz, D., Barth, J., Ho, C., Sternberg, A., & Filippenko, V. 2001, AJ, 121, 3048
- Martini et al. (2003a) Martini, P., Regan, M. R., Mulchaey, J. S., & Pogge, R. W. 2003a, ApJS, 146, 353
- Martini et al. (2003b) Martini, P., Regan, M. R., Mulchaey, J. S., & Pogge, R. W. 2003b, ApJ, 589, 774
- Martinez-Valpuesta et al. (2006) Martinez-Valpuesta, I., Shlosman, I., & Heller, C. 2006, ApJ, 637, 214
- Mazzuca et al. (2008) Mazzuca, L. M., Knapen, J. H., Veilleux, S., & Regan, M. W. 2008, ApJ, 174, 337
- Mazzuca et al. (2011) Mazzuca, L. M., Swaters, R. A., Knapen, J. H., & Veilleux, S. 2011, ApJ, 739, 104
- Moss (1998) Moss, D. 1998, MNRAS, 297, 860
- Moss et al. (1998) Moss, D., Korpi, M., Rautiainen, P., & Salo, H. 1998, A&A, 329, 895
- Moss et al. (1999) Moss, D., Rautiainen, P., & Salo, H. 1999, MNRAS, 303, 125
- Moss et al. (2001) Moss, D., Shukurov, A., Sokoloff, D., Beck, R., & Fletcher, A. 2001, A&A, 380, 55
- Moss et al. (2007) Moss, D., Snodin, A., Englmaier, P. et al. 2007, A&A, 465, 157
- Otmianowska-Mazur et al. (1997) Otmianowska-Mazur, K., von Linden, S., Lesch, H., & Skupniewicz, G. 1997, A&A, 323, 56
- Otmianowska-Mazur et al. (2002) Otmianowska-Mazur, K., Elstner, D., Soida, M., & Urbanik, M. 2002, A&A, 384, 48
- Parker (1971) Parker, E. N. 1971, ApJ, 163, 255
- Patsis & Athanassoula (2000) Patsis, P. A., & Athanassoula, E. 2000, A&A, 358, 45
- Pease (1917) Pease, F. G. 1917, ApJ, 46, 24
- Piner et al. (1995) Piner, B. G., Stone, J. M., & Teuben, P. J. 1995, ApJ, 449, 508
- Priest (1982) Priest, E. R. 1982, Solar Magnetohydrodynamics (Dordrecht: Holland), p199
- Prieto et al. (2005) Prieto, M. A., Maciejewski, W., & Reunanen, J. 2005, AJ, 130, 1472
- Regan & Mulchaey (1999) Regan, M. W., & Mulchaey, J. S., 1999, AJ, 117, 2676
- Regan & Teuben (2003) Regan, M. W., & Teuben, P. J. 2003, ApJ, 582, 723
- Regan & Teuben (2004) Regan, M. W., & Teuben, P. J. 2004, ApJ, 600, 595
- Regan & Vogel (1995) Regan, M. W., & Vogel, S. N. 1995, ApJ, 452, L21
- Rohde et al. (1999) Rohde, R., Beck, R., & Elstner, D. 1999, A&A, 350, 423
- Sandage (1961) Sandage, A. 1961, The Hubble Atlas of Galaxies (Washington, DC: Carnegie Institution of Washington)
- Sanders & Huntley (1976) Sanders, R. H., & Huntley, J. M. 1976, ApJ, 209, 53
- Sanders & Prendergast (1974) Sanders, R. H., & Prendergast, K. H. 1974, ApJ, 188, 489
- Shaw et al. (1993) Shaw, M. A., Combes, F., Axon, D. J., & Wright, G. S. 1993, A&A, 273, 31
- Shaw et al. (1995) Shaw, M. A., Axon, D. J., Probst, R., & Gatley, I. 1995, MNRAS, 274, 369
- Shlosman et al. (1989) Shlosman, I., Frank, J., & Begelman, M. C. 1989, Nature, 338, 45
- Shlosman et al. (1990) Shlosman, I., Begelman, M. C., & Frank, J. 1990, Nature, 345, 679
- Shukurov (1998) Shukurov, A. 1998, MNRAS, 299, L21
- Shukurov (2005) Shukurov, A. 2005, in Cosmic Magnetic Fields, ed. R. Wielebinski, & R. Beck (Berlin: Springer), 129
- Stone & Gardiner (2009) Stone, J. M., & Gardiner, T. A. 2009, NewA, 14, 139
- Stone et al. (2008) Stone, J. M., Gardiner, T. A., Teuben, P. et al. 2008, ApJS, 178, 137
- Thakur et al. (2009) Thakur, P., Ann, H. B., & Jiang, I. 2009, ApJ, 693, 586
- van de Ven & Fathi (2010) van de Ven, G., & Fathi, K. 2010, ApJ, 723, 767
- Wada & Koda (2004) Wada, K., & Koda, J. 2004, MNRAS, 349, 270