Ionized nitrogen at high redshift
Abstract
We present secure [N ii]205μm detections in two mm-bright, strongly lensed objects at high redshift, APM 08279+5255 (=3.911) and MM 18423+5938 (=3.930), using the IRAM Plateau de Bure Interferometer. Due to its ionization energy [N ii]205μm is a good tracer of the ionized gas phase in the interstellar medium. The measured fluxes are ([N ii]205μm)= Jy km s-1 and Jy km s-1 respectively, yielding line luminosities of [N ii]205 L⊙ for APM 08279+5255 and [N ii]205 L⊙ for MM 18423+5938. Our high-resolution map of the [N ii]205μm and 1 mm continuum emission in MM 18423+5938 clearly resolves an Einstein ring in this source, and reveals a velocity gradient in the dynamics of the ionized gas. A comparison of these maps with high-resolution EVLA CO observations enables us to perform the first spatially-resolved study of the dust continuum-to-molecular gas surface brightness (, which can be interpreted as the star formation law) in a high-redshift object. We find a steep relation (), consistent with a starbursting environment. We measure a [N ii]205μm/FIR luminosity ratio in APM 08279+5255 and MM 18423+5938 of 9.0 and 5.8 , respectively. This is in agreement with the decrease of the [N ii]205μm/FIR ratio at high FIR luminosities observed in local galaxies.
Subject headings:
galaxies: ISM — galaxies: individual (MM 18423+5938) — quasars: individual (APM 08279+5255)1. Introduction
Forbidden atomic fine structure transitions are important cooling lines of the interstellar medium (ISM). They provide effective cooling in cold regions where allowed atomic transitions can not be excited, and thus are critical diagnostic tools to study the star-forming ISM. Perhaps the most important cooling line is the forbidden 2PP1/2 fine-structure line of ionized carbon ([C ii]) at 158 m, which alone accounts for 0.1 – 1 percent of the total continuum far-infrared (FIR) luminosity in local, star-forming galaxies (see, e.g., Malhotra et al., 2001). Other main cooling atomic lines are the oxygen [O i] (63 m and 145 m) and [O iii] (52 m and 88 m) lines, as well as the nitrogen [N ii] lines at 122 m and 205 m.
As the ionization potential of carbon is 11.3 eV (hydrogen: 13.6 eV), [C ii] is a tracer for both the neutral atomic and ionized medium, predominantly of photon-dominated regions. The ionization potentials for oxygen and nitrogen, on the other hand, are 13.6 eV and 14.5 eV, respectively, implying that their ions trace of the ionized medium. The [N ii]205μm transition is of particular interest as it has a critical density in the ionized medium that is very close to that of [C ii], thus potentially providing complementary information on the origin of the [C ii] emission (e.g., Oberst et al., 2006; Walter et al., 2009a).
In studies of star formation at high-, the need for diagnostics other than [C ii] is also motivated by two other reasons: 1) The relative intensities of [C ii] and [N ii]205μm is susceptible to N/C abundance variations (e.g., Matteucci & Padovani, 1993), thus acting as diagnostics of metal enrichment in the first galaxies. 2) The [C ii] line falls out of the 1.3mm window at , and will not be observable at up to 10.2 with ALMA, as no 2mm receiver (ALMA ‘band 5’) will be available for a large number of antennas. This limits [C ii] studies in the first galaxies observable at the beginning of cosmic reionization.
Whereas the [C ii] line has now been abundantly detected in the local universe (e.g. Stacey et al., 1991; Madden et al., 1997; Luhman et al., 1998; Malhotra et al., 2001; Beirão et al., 2010; Edge et al., 2010; Fischer et al., 2010; Ivison et al., 2010; Loenen et al., 2010), and is now (almost) routinely detected at high redshift (Maiolino et al., 2005, 2009; Iono et al., 2006; Walter et al., 2009b; Wagg et al., 2010; Stacey et al., 2010; Cox et al., 2011; De Breuck et al., 2011), measurements of the [N ii]205μm line are scarce. The [N ii]205μm line was first detected by FIRAS aboard COBE in the Milky Way (Wright et al., 1991), and later in the Galactic H ii regions G333.6–0.2 Colgan et al. (1993) and DR21 (White et al., 2010) and in the Carina Nebula (Oberst et al., 2006). The [N ii]205μm line has also been recently detected in some local galaxies, e.g., NGC 1097 (Beirão et al. 2010; see also Garciá-Carpio et al., 2011). On the other hand, little is known about nitrogen at high redshift. Multiple attempts were performed to detect this line at high redshift (4C41.17 and PC2047+0123: Ivison & Harris 1996, Cloverleaf: Benford 1999, APM 08279: Krips et al. 2007, J1148+5251: Walter et al. 2009b; SDP.81: Valtchanov et al. 2011). However, all these measurements, but the one on the = quasar J1148+5251, were too insensitive by about an order of magnitude to potentially detect the [N ii]205μm line. Very recently, Ferkinhoff et al. (2011) reported the first detection of the second line of ionized nitrogen, [N ii]122μm in two targets, SMMJ02399-0136 (=) and the Cloverleaf QSO (=). Bradford et al. (2011) published a tentative (1.5-) detection of [N ii]205μm in the lensed quasar APM 08279+5255 (=), and Combes et al. (2012) reported the detection of the [N ii]205μm line in a lensed submillimeter galaxy, HLSJ091828.6+514223, at .
Here we present secure detections of the [N ii]205μm fine-structure line in two high- sources, the lensed quasar APM 08279+5255 (=) and the sub-millimeter galaxy (SMG) MM 18423+5938 (=). These sources are strongly magnified by gravitational lensing (magnification factor =4–100 for APM 08279+5255 and 12–20 for MM 18423+5938; see Egami et al. 2000, Riechers et al. 2009, Lestrade et al. 2011), and represent two of the brightest molecular emitters at this redshift, with CO(6-5) peak flux densities of 7.3 mJy (Weiß et al., 2007) and 33 mJy (Lestrade et al., 2010), respectively. Observations were carried out at the IRAM Plateau de Bure Interferometer (PdBI), and are summarized in Sec. 2. Results are presented in Sec. 3.
Throughout the paper we will assume a standard cosmology with km s-1 Mpc-1, and .
2. Observations
In our observations we exploited the capabilities of the new ‘band 4’ receiver at PdBI. Covering the frequency range between 277 and 371 GHz (with a small gap due to atmospheric absorption at rougly 320–330 GHz), this band opens up the opportunity to search for the [N ii]205μm line in a wide redshift range ().
APM 08279+5255 was observed in compact array configuration with 5 antennas (6Cq-E10) on March 8th, 2011. Baselines ranged between 20 and 140 m. 3C273, 3C84 and MWC349 were used as amplitude calibrators. The quasar 0917+624 was observed every 30 min for phase calibration. The time on sources was 4.5 hours (5-antenna equivalent). MM 18423+5938 was observed in both compact and extended configurations (6Cq-E10 and 6Bq) between January 3rd and March 9th, 2011. Baselines ranged between 17 and 446 m. 3C273, 3C345, MWC349 and 3C84 were used as amplitude calibrators, while 1849+670 was observed as phase calibrator. The total time on source was 10 hours (6-antenna equivalent).
The tuning frequencies were 297.522 and 296.400 GHz respectively, based on the CO redshift of the sources (Weiß et al., 2007; Lestrade et al., 2010, 2011). The receiver worked in Lower-Side Band. System temperature ranged between 150 and 350 K. Data reduction and analysis was performed using the most recent version of the GILDAS package. Maps were extracted using natural weighting. This allows us to fully recover the flux of our sources, given that their spatial extent () is comparable with or smaller than the angular scale filtered in by the smallest baselines in our observations (). The resulting synthetized beams are for APM 08279+5255 and for MM 18423+5938. In order to take full advantage of the high spatial resolution observations of MM 18423+5938, we also extracted a pure continuum map of this source using uniform weighting. This high resolution map has a synthetic beam size of , at the price of filtering out a significant fraction (%) of the flux from the extended emission of the object. Therefore, in the remainder of the analysis, all the flux measurements will refer only to the map obtained with natural weighting. The 1- noise per 20 MHz-wide channel ( 20.2 km s-1) is 3.4 mJy for APM 08279+5255 and 2.4 mJy for MM 18423+5938, corresponding to a 1- sensitivity of mJy beam-1 and mJy beam-1 over the line width (see Sec. 3).
3. Results
3.1. [N ii]205μm and continuum emission
APM 08279+5255
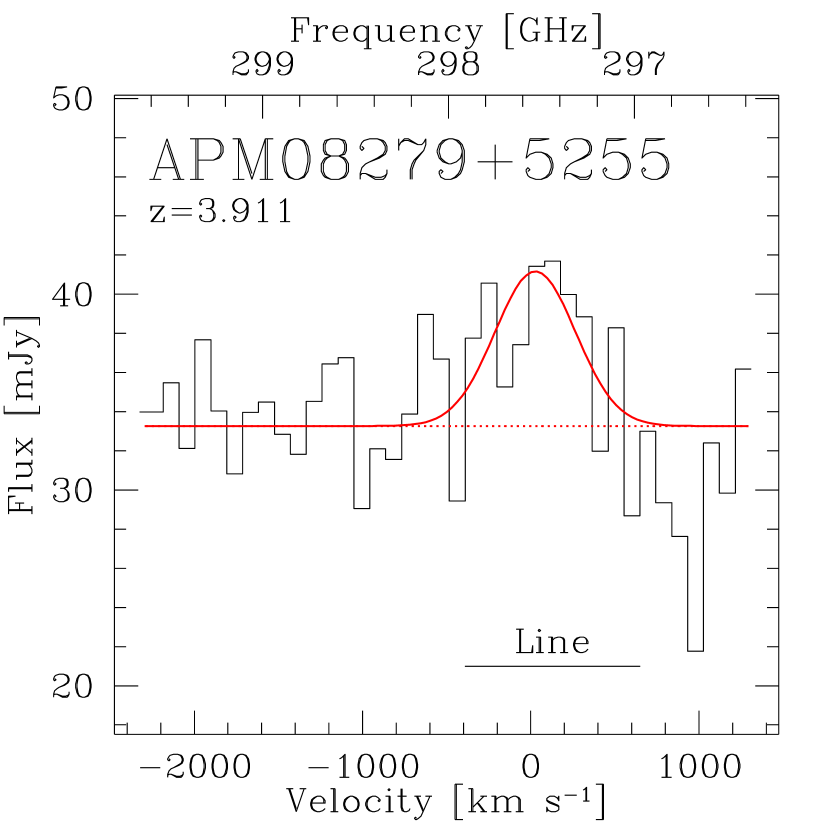
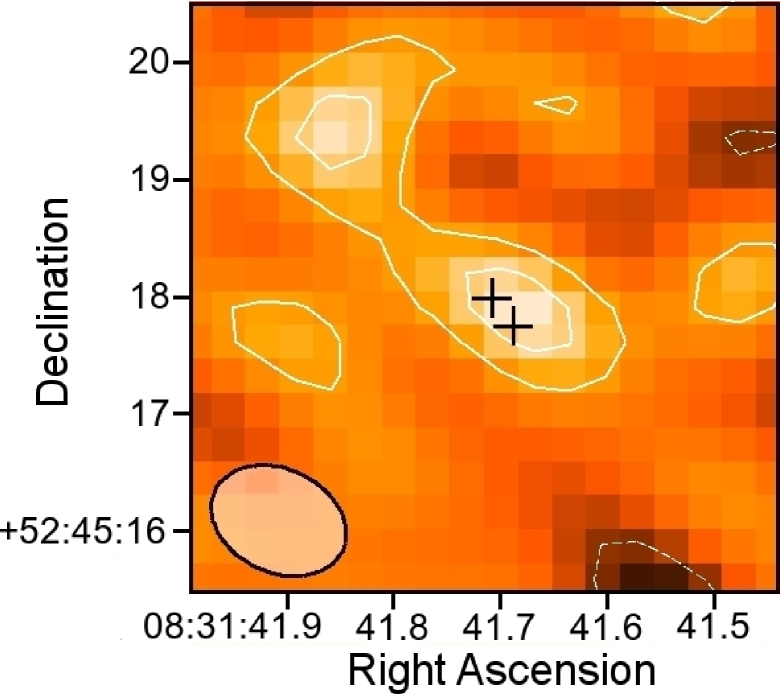
Figure 1 shows the observed spectrum and the (continuum-subtracted) line map of APM 08279+5255. The [N ii]205μm line is detected at modest significance. We fitted the spectrum with a flat continuum plus a gaussian profile for the [N ii]205μm emission. The fitted [N ii]205μm flux is ([N ii]205μm)= Jy km s-1, consistent with the tentative detection ( Jy km s-1) reported in Bradford et al. (2011). We measure a line width of km s-1, consistent with the weighted average of the line width values from CO transitions reported in Weiß et al. (2007). Line luminosities and are derived following Solomon et al. (1992), and reported in Table 1, together with all the relevant numbers and fitted parameters. We measure a continuum flux of mJy, in agreement with the extrapolation between the SCUBA and PdBI observations at 850 m and 1.4mm respectively (Weiß et al., 2007).
MM 18423+5938
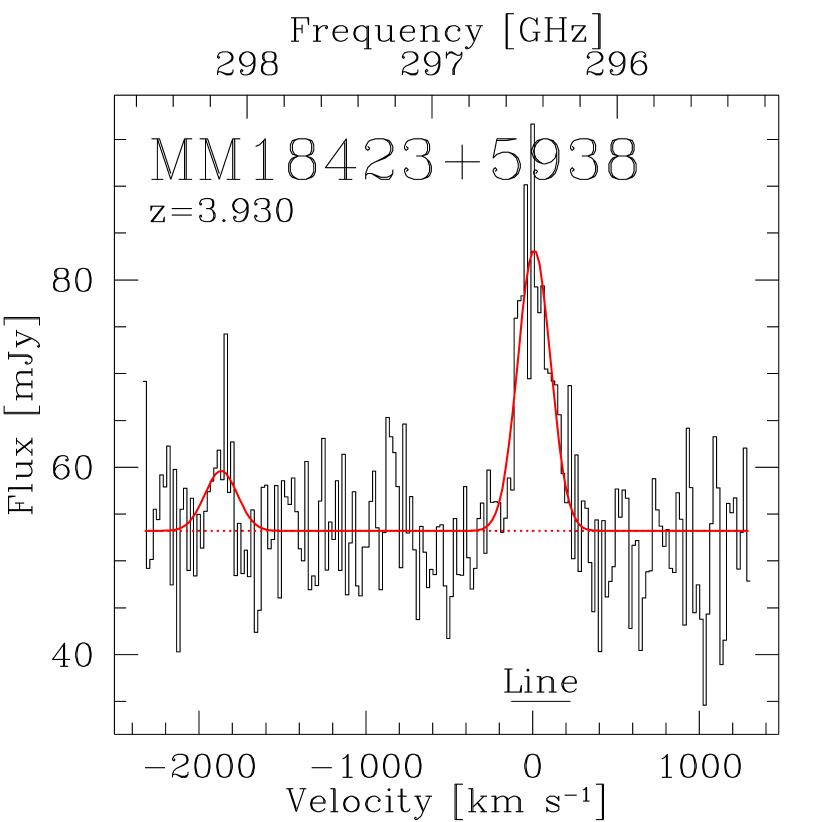
In Figure 2 we show the integrated spectrum of the [N ii]205μm emission in MM 18423+5938. The line is detected at very high significance. The gaussian fit gives an integrated [N ii]205μm flux of ([N ii]205μm)= Jy km s-1 and a line width of km s-1 (for a comparison, the CO(1-0) and CO(2-1) lines reported in Lestrade et al. 2011 have widths of and km s-1 respectively). Another line is tentatively detected at GHz, i.e., at rest frequency GHz, consistent with three different transitions of the Sulfur dioxide, SO2 (at 1470.225, 1470.327 and 1470.342 GHz respectively). Given the low S/N of this line (-), we fitted it with a Gaussian by imposing the same line width as observed for [N ii]205μm. We find a continuum flux (integrated over the spatial extension of the emission) of mJy, consistent with the 1.2 mm MAMBO flux reported in Lestrade et al. (2010), assuming a grey-body dust with opacity index =1.
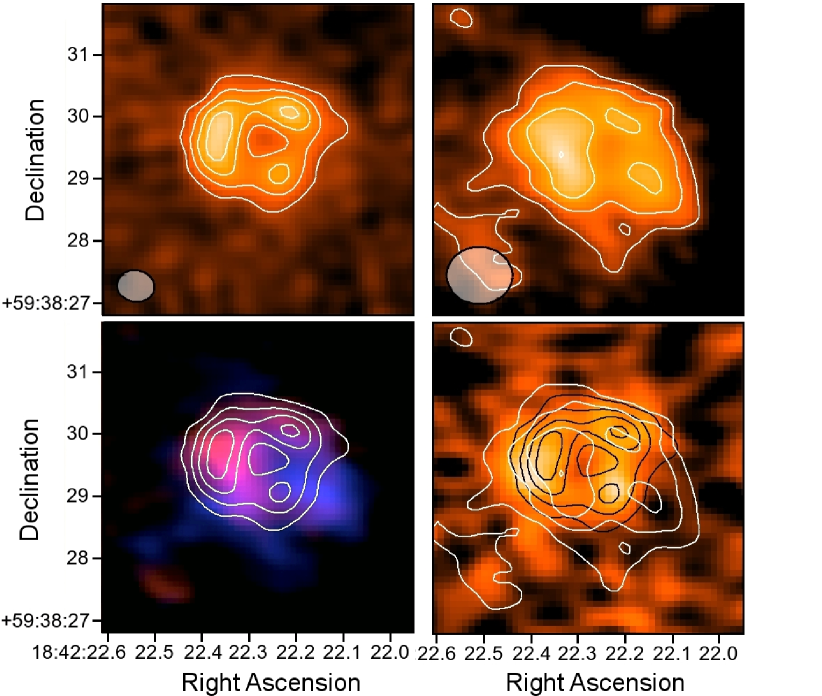
Our PdBI observations clearly resolved the 1mm continuum emission of MM 18423+5938. The Einstein ring reported in Lestrade et al. (2011) is clearly seen in the pure-continuum, high resolution map shown in Figure 3 (top-left panel). Also the [N ii]205μm emission appears clearly extended even in the lower resolution maps shown in the top-right panel of Figure 3. The [N ii]205μm line emission shows a clear velocity gradient from North-East (red-shifted) to South-West (blue-shifted). This is highlighted in Figure 3 (bottom-left panel) where we overplot the maps of the red and blue wings of the [N ii]205μm line. We measure peak-to-peak velocity differences of km s-1 and a velocity dispersion km s-1. The value indicates ordered kinematics for the ionized gas in the lensed source. A detailed model of the lens is required to reconstruct the intrinsic brightness of the source from these images and to properly constrain the dynamics of the system. This is beyond the scope of this paper.
3.2. [N ii]205μm and CO
Here we compare our [N ii]205μm observations with the available literature data on CO emission in the two targets. In particular, the [N ii]205μm to CO(6-5) luminosity ratio in our sources ([N ii]205μm/CO(6-5)= in APM 08279+5255 and in MM 18423+5938) is similar to the values reported by White et al. (2010) in the Galactic region DR21 ([N ii]205μm/CO(6-5)=), by Panuzzo et al. (2010) in M82 ([N ii]205μm/CO(6-5)=) and by van der Werf (2010) in Mrk231 ([N ii]205μm/CO(6-5)).
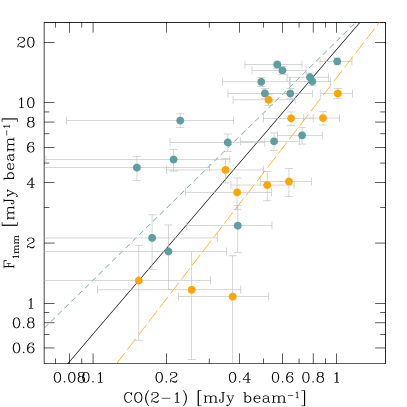
In Figure 3 (bottom-right panel) we compare our [N ii]205μm map of MM 18423+5938 with our map of the 1mm continuum emission and the CO(2-1) observations presented in Lestrade et al. (2011), which have similar S/N and spatial resolution as the [N ii]205μm data presented here. Since nitrogen emission is tracing the ionized gas, while the CO emission maps the molecular gas (which is the fuel of star formation) and the FIR continuum traces the distribution of dust heated by young stars, this comparison allows for a direct, spatially-resolved study of three important components of the ISM that are related to star formation. From the Figure, it is apparent that the emission from the three tracers shows different morphologies (e.g., most of [N ii]205μm and CO(2-1) emission arises in two blobs in the East and South-West parts of the Einstein ring, while a bright continuum emission is observed also in the Northern side of the ring).
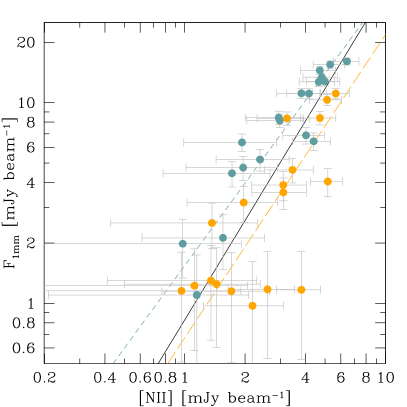
More quantitatively, in Figure 4 we perform a pixel-by-pixel comparison of the emission of the FIR continuum with respect to the [N ii]205μm and CO(2-1) lines111A continuum map obtained with natural weighting is used here, so that the beam size of the three maps (FIR continuum, [N ii]205μm and CO(2-1)) are similar.. In order to avoid over-sampling, we consistently rebinned all the maps into pixels, and considered only pixels with 1- flux in each axis. We find that the surface brightness of the continuum, , shows a steep correlation with the surface brightnesses of [N ii]205μm and CO(2-1), and : and . The latter relation is of particular interest, as can be used as a proxy for the star formation surface density, (Kennicutt, 1998), while traces the surface density of the molecular gas, , which is the fuel for star formation. The right-hand panel of Figure 4 represents therefore the first spatially-resolved study of the star formation law in a high- galaxy.
Locally, star formation surface density scales, to first order, linearly with the molecular gas surface density (, with ; see, e.g., Bigiel et al., 2008; Leroy et al., 2008; Schruba et al., 2011). The relation steepens if one considers high-density environments and molecule-rich galaxies (e.g., Kennicutt, 1998; Wong & Blitz, 2002; Daddi et al., 2010; Genzel et al., 2011). This appears to be the case of MM 18423+5938, where we measure a slope significantly larger than 1 (). The steep relation observed between and may indicate that, as SFR increases, the ionization state of nitrogen changes, with an increasing fraction of multiply ionized N in the regions of most intense star formation. Moreover, if we divide the Einstein ring of MM 18423+5938 in two parts, North and South, with a cut at declination +59:38:29.3 (roughly corresponding to the center of the ring), we find that each part of the ring follows different power-laws. The Northern part of the ring has a times brighter continuum for a given [N ii]205μm or CO(2-1) emission. The relation shows a marginally flatter slope (=1.2) in the Northern part than in the Southern part (=1.6), in agreement with the relatively higher molecular content in the Southern part of the ring.
| Quantity | Units | APM 08279+5255 | MM 18423+5938 | References |
|---|---|---|---|---|
| Redshift | 3.911 | 3.930 | 1,2 | |
| [Gpc] | 34.897 | 35.097 | ||
| 4–100 | 12–20 | 3,4,2 | ||
| [GHz] | 297.522 | 296.400 | 0 | |
| 1- RMS (20 MHz) | [mJy beam-1] | 3.4 | 2.4 | 0 |
| [N ii]205 | ||||
| ([N ii]205μm) | [Jy km s-1] | 0 | ||
| FWHM | [km s-1] | 0 | ||
| ([N ii]205μm) | [ L⊙] | 0 | ||
| ([N ii]205μm) | [ K km s-1 pc2] | 0 | ||
| ([N ii]205μm)/ | [] | 0 | ||
| (H ii) | [ M⊙] | 0 | ||
| (H ii)/(H2) | % | % | 0 | |
| Other lines | ||||
| ([C i]1-0) | [ L⊙] | 5,2 | ||
| ([C i]2-1) | [ L⊙] | 6,2 | ||
| (CO(1-0)) | [ L⊙] | 3,7 | ||
| (CO(2-1)) | [ L⊙] | 3,7 | ||
| (CO(3-2)) | [ L⊙] | — | 8 | |
| (CO(4-3)) | [ L⊙] | 1,2 | ||
| (CO(6-5)) | [ L⊙] | 1,2 | ||
| (CO(7-6)) | [ L⊙] | — | 2 | |
| (CO(9-8)) | [ L⊙] | — | 1 | |
| (CO(10-9)) | [ L⊙] | — | 1 | |
| (CO(11-10)) | [ L⊙] | — | 1 | |
| (CO(12-11)) | [ L⊙] | — | 9 | |
| (SO2) | [ L⊙] | — | 0 | |
| (H2) | [ M⊙] | 3,7 | ||
| Continuum | ||||
| (850µm) | [mJy] | – | 1 | |
| (1mm) | [mJy] | 0 | ||
| (1.3mm) | [mJy] | 1,2 | ||
| [ L⊙] | 1,2 | |||
3.3. Ionized and molecular gas masses
Following Ferkinhoff et al. (2011), we can compute the minimum mass of ionized hydrogen in the high-density, high-temperature limit, assuming that all nitrogen in the H ii regions is singly ionized:
| (1) |
where is the Einstein coefficient of the 3PP0 transition of nitrogen ( s-1); =3 is the statistical weight of the level; is the partition function, with being the energy difference between the fundamental and the th level, being the Boltzmann constant and being the gas temperature; is Planck’s constant, =1461.1318 GHz is the rest-frame frequency of the transition; is the mass of an hydrogen atom, and (N+) is the N+/H+ abundance ratio. In our working assumption, (N+) = (N) (Savage & Sembach, 1996). This gives (H II)= M⊙ and M⊙ for APM 08279+5255 and MM 18423+5938, respectively. It is interesting to compare these numbers with the molecular gas mass estimated from the CO(1-0) luminosity (Riechers et al., 2009; Lestrade et al., 2011): the minimum mass of the ionized gas is only a tiny fraction (0.8% and 2.9%, respectively) of the molecular reservoir in the two targets. Alternatively, the actual N+/H+ abundance ratio may be significantly lower than the adopted value. This is likely to happen if these systems are metal-poor (but this scenario is ruled out by the bright CO/FIR luminosity ratios observed in our targets), or if the ISM is enshrouded in a hard radiation field (i.e., nitrogen is multiply ionized). This is likely happening in APM 08279+5255, which hosts a quasar (while no obvious signature of nuclear activity is observed in MM 18423+5938). Indeed, Ferkinhoff et al. (2010) estimated that an ionized gas mass of M⊙ is present in APM 08279+5255, based on the [O iii]88μm line emission. These observations are complementary to ours, as N is likely to be multiply ionized in the regions were most of the [O iii] emission takes place.
3.4. [N ii]205μm contribution to ISM cooling
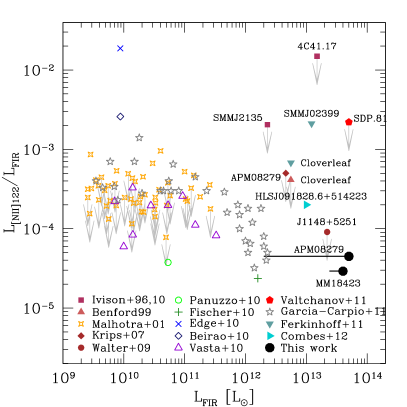
Finally, we evaluate the role of [N ii]205μm in the ISM cooling by comparing the [N ii]205μm luminosity to the one of the FIR continuum. The latter is taken from the Spectral Energy Distribution fits by Weiß et al. (2007) for APM 08279+5255 ( L⊙)222Here we consider the total FIR luminosity. However, Weiß et al. (2007) modeled the FIR emission in APM 08279+5255 with two components, ‘warm’ and ‘cold’. If the former is powered from the quasar instead of star formation, the FIR luminosity should be scaled to a 10% of the adopted value., and by Lestrade et al. (2010) for MM 18423+5938 ( L⊙). The observed [N ii]205μm/FIR luminosity ratio is and in the two sources. In Figure 5 we compare these values with the available measurements in the literature. Since the majority of data refer to the [N ii]122μm transition, we converted our estimates assuming a [N ii] 122-to-205 m luminosity ratio of 5 (see, e.g., Beirão et al., 2010). Our observations confirm and extend the decreasing trend of the [N ii]/FIR ratio as a function of the continuum luminosity, towards high-luminosities from local galaxies with [N ii]122μm/FIR3 (Malhotra et al., 2001; Panuzzo et al., 2010; Fischer et al., 2010; Edge et al., 2010; Beirão et al., 2010; Vasta et al., 2010; Garciá-Carpio et al., 2011) to FIR-luminous sources with [N ii]122μm/FIR3–5. Even in the extreme case of a 122-to-205 m ratio of 10, our data would populate a very different region of the plot with respect to the values found by Ferkinhoff et al. (2011), who reported high [N ii]122μm/FIR ratios () in two FIR-bright sources.
4. Conclusions
We present a study of the ionized ISM in two high- sources based on the forbidden ionized nitrogen emission line at 205 m. The FIR transitions of ionized nitrogen represents extremely powerful tools to study the properties of purely ionized gas in distant galaxies. A larger number of [N ii]205μm detections in distant galaxies is now mandatory in order to build a suitable sample for statistical analysis. This is now possible thanks to the technological upgrades in the field. In particular, the unparalleled sensitivities reached by ALMA will open new possibilities for the studies of high- objects.
Acknowledgments
We thank the anonimous referee for his/her expert comments that increased the quality of the manuscript. We thank B. Groves for useful discussions. This work is based on observations carried out with the IRAM Plateau de Bure Interferometer. IRAM is supported by INSU/CNRS (France), MPG (Germany) and IGN (Spain). RD acknowledges funding from Germany’s national research centre for aeronautics and space (DLR, project FKZ 50 OR 1104). DR acknowledges support from NASA through a Spitzer Space Telescope grant.
References
- Beirão et al. (2010) Beirão P., Armus L., Appleton P.N., Smith J.-D.T., Croxall K.V., Murphy E.J., Dale D.A., Helou G., et al., 2010, A&A, 518, L60
- Benford (1999) Benford D.J., 1999, PhD Thesis, Caltech
- Bigiel et al. (2008) Bigiel F., Leroy A., Walter F., Brinks E., de Blok W.J.G., Madore B., Thornley M.D., 2008, AJ, 136, 2846
- Bradford et al. (2011) Bradford C.M., Bolatto A.D., Maloney P.R., Aguirre J.E., Bock J.J., Glenn J., Kamenetzky J., Lupu R., Matsuhara H., Murphy E. J., et al. 2011, ApJ, 741, L37
- Brown et al. (1994) Brown J.M., Varberg T.D., Evenson K.M., & Cooksy A.L., 1994, ApJ Letters, 428, 37
- Colgan et al. (1993) Colgan S.W.J., Haas M.R., Erickson E.F., Rubin R.H., Simpson J.P., & Russell, R. W. 1993, ApJ, 413, 237
- Combes et al. (2012) Combes F., Rex M., Rawle T.D., Egami E., Boone F., Smail I., Richard J., Ivison R.J., et al., 2012, A&A, in press (arXiv:1201.2908)
- Cox et al. (2011) Cox P., Krips M., Neri R., Omont A., Güsten R., Menten K.M., Wyrowski F., Weiss A., et al., 2011, arXiv:1107.2924
- Daddi et al. (2010) Daddi E., Elbaz D., Walter F., Bournaud F., Salmi F., Carilli C., Dannerbauer H., Dickinson M., et al., 2010, ApJ, 714, L118
- De Breuck et al. (2011) De Breuck C., Maiolino R., Caselli P., Coppin K., Hailey-Dunsheath S., Nagao T., 2011, A&A, 530, L8
- Downes et al. (1999) Downes D., Neri R., Wiklind T., Wilner D.J., Shaver P.A., 1999, ApJ, 513, L1
- Edge et al. (2010) Edge A.C., Oonk J.B.R., Mittal R., Allen S.W., Baum S.A., Böhringer H., Bregman J.N., Bremer M.N., et al., A&A, 518, L46
- Egami et al. (2000) Egami E., Neugebauer G., Soifer B.T., Matthews K., Ressler M., Becklin E.E., Murphy T.W.Jr., Dale D.A., 2000, ApJ, 535, 561
- Ferkinhoff et al. (2010) Ferkinhoff C., Hailey-Dunsheath S., Nikola T., Parshley S.C., Stacey G.J., Benford D.J., Staguhn J.G., 2010, ApJ, 714, L147
- Ferkinhoff et al. (2011) Ferkinhoff C., Brisbin D., Nikola T., Parshley S.C., Stacey G.J., Phillips T.G., Falgarone E., Benford D.J., Staguhn J.G., Tucker C.E., 2011, ApJ, 740, L29
- Fischer et al. (2010) Fischer J., Sturm E., González-Alfonso E., Graciá-Carpio J., Hailey-Dunsheath S., Poglitsch A., Contursi A., Lutz D., et al., A&A, 518, L41
- Garciá-Carpio et al. (2011) Garciá-Carpio J., Sturm E., Hailey-Densheath S., Fischer J., Contursi A., Poglitsch A., Genzel R., González-Alfonso E., et al., 2011, ApJ, 728, L7
- Genzel et al. (2011) Genzel R., Tacconi L.J., Gracia-Carpio J., Sternberg A., Cooper M.C., Shapiro K., Bolatto A., Bouché N., et al., 2010, MNRAS, 407, 2091
- Iono et al. (2006) Iono D., Yun M.S., Elvis M., Peck A.B., Ho P.T.P., Wilner D.J., Hunter T.R., Matsushita S., Muller S., 2006, ApJ, 645, L97
- Ivison & Harrison (1996) Ivison R.J., Harrison A.P., 1996, A&A, 309, 416
- Ivison et al. (2010) Ivison R.J., Swinbank A.M., Swinyard B., Smail I., Pearson C.P., Rigopoulou D., Polehampton E., Baluteau J.-P., et al., 2010, A&A, 518, L35
- Kennicutt (1998) Kennicutt R.C., 1998, ApJ, 498, 541
- Krips et al. (2007) Krips M., Peck A.B., Sakamoto K., Petitpas G.B., Wilner D.J., Matsushita S., Iono D., 2007, ApJ, 671, L5
- Leroy et al. (2008) Leroy A.K., Walter F., Brinks E., Bigiel F., de Blok W.J.G., Madore B., Thornley M.D., 2008, AJ, 136, 2782
- Lestrade et al. (2010) Lestrade J.-F., Combes F., Salomé P., Omont A., Bertoldi F., André P., Schneider N., 2010, A&A, 522, L4
- Lestrade et al. (2011) Lestrade J.-F., Carilli C.L., Thanjavur K., Kneib J.-P., Riechers D.A., Bertoldi F., Walter F., Omont A., 2011, ApJ, 739, L30
- Loenen et al. (2010) Loenen A.F., van der Werf P.P., Güsten R., Meijerink R., Israel F.P., Requena-Torres M.A., García-Burillo S., Harris A.I.,et al., 2010, A&A, 521, L2
- Luhman et al. (1998) Luhman M.L., et al., 1998, ApJ Letters, 504, 11
- Madden et al. (1997) Madden S.C., Poglitsch A., Geis N., Stacey G.J., & Townes C.H., 1997, ApJ, 483, 200
- Maiolino et al. (2005) Maiolino R., Cox P., Caselli P., Beelen A., Bertoldi F., Carilli C.L., Kaufman M.J., Menten K.M., Nagao T., Omont A., et al., 2005, A&A, 440, L51
- Maiolino et al. (2009) Maiolino R., Caselli P., Nagao T., Walmsley M., De Breuck C., Meneghetti M., 2009, A&A, 500, L1
- Malhotra et al. (2001) Malhotra S., Kaufman M.J., Hollenbach D., Helou G., Rubin R.H., Brauher J., Dale D., Lu N.Y., et al., 2001 ApJ, 561, 766
- Matteucci & Padovani (1993) Matteucci F., Padovani P., 1993, ApJ, 419, 485
- Oberst et al. (2006) Oberst T.E., et al. 2006, ApJ Letters, 652, 125
- Osterbrock & Ferland (2006) Osterbrock D.E. & Ferland G.J., 2006, Astrophysics of gaseous nebulae and active galactic nuclei
- Panuzzo et al. (2010) Panuzzo P., Rangwala N., Rykala A., Isaak K.G., Glenn J., Wilson C.D., Auld R., Baes M., et al., 2010, A&A, 518, L37
- Petuchowski & Bennett (1993) Petuchowski S.J., & Bennett C.L., 1993, ApJ, 405, 591
- Riechers et al. (2009) Riechers D.A., Walter F., Carilli C.L., Lewis G.F., 2009, ApJ, 690, 463
- Savage & Sembach (1996) Savage B.D., & Sembach K.R., 1996, ARA&A, 34, 279
- Schruba et al. (2011) Schruba A., Leroy A.K., Walter F., Bigiel F., Brinks E., de Blok W.J.G., Dumas G., Kramer C., et al., 2011, AJ, 142, 37
- Solomon et al. (1992) Solomon P.M., Downes D., & Radford S.J.E., 1992, ApJ, 398, L29
- Stacey et al. (1991) Stacey G.J., Geis N., Genzel R., Lugten J.B., Poglitsch A., Sternberg A., & Townes C.H., 1991, ApJ, 373, 423
- Stacey et al. (2010) Stacey G.J., Hailey-Dunsheath S., Ferkinhoff C., Nikola T., Parshley S.C., Benford D.J., Staguhn J.G., Fiolet N., 2010, ApJ, 724, 957
- Stasinska (2007) Stasinska G., 2007, arXiv:0704.0348
- van der Werf (1999) van der Werf P.P., 1999, Highly Redshifted Radio Lines, 156, 91
- van der Werf (2010) van der Werf P.P., Isaak K.G., Meijerink R., Spaans M., Rykala A., Fulton T., Loenen A.F., Walter F., Weiß A., Armus L., et al., 2010, A&A, 518, L42
- Vasta et al. (2010) Vasta M., Barlow M.J., Viti S., Yates J.A., Bell T.A., 2010, MNRAS, 404, 1910
- Wagg et al. (2006) Wagg J., Wilner D.J., Neri R., Downes D., Wiklind T., 2006, ApJ, 651, 46
- Wagg et al. (2010) Wagg J., Carilli C.L., Wilner D.J., Cox P., De Breuck C., Menten K., Riechers D.A., Walter F., 2010, A&A, 519, L1
- Walter et al. (2009a) Walter F., Weiss A., Riechers D.A., Carilli C.L., Bertoldi F., Cox P., Menten K.M., 2009a, ApJ, 691, L1
- Walter et al. (2009b) Walter F., Riechers D., Cox P., Neri R., Carilli C., Bertoldi F., Weiss A., Maiolino R., 2009b, Nature, 457, 699
- Walter et al. (2011) Walter F., Weiss A., Downes D., Decarli R., Henkel C., 2011, ApJ, 730, 18
- Weiß et al. (2007) Weiß A., Downes D., Neri R., Walter F., Henkel C., Wilner D.J., Wagg J., Wiklind T., 2007, A&A, 467, 955
- White et al. (2010) White G.J., Abergel A., Spencer L., Schneider N., Naylor D.A., Anderson L.D., Joblin C., Ade P., André P., Arab H., et al., 2010, A&A, 518, L114
- Wong & Blitz (2002) Wong T., & Blitz L., 2002, ApJ, 569, 157
- Wright et al. (1991) Wright E.L., et al., 1991, ApJ, 381, 200