Mid-IR FORCAST/SOFIA Observations of M82
Abstract
We present size maps of M82 at 6.4 m, 6.6 m, 7.7 m, 31.5 m, and 37.1 m with a resolution of 4′′ that we have obtained with the mid-IR camera FORCAST on SOFIA. We find strong emission from the inner (1kpc) along the major axis, with the main peak west–southwest of the nucleus and a secondary peak east–northeast of the nucleus. The detailed morphology of the emission differs among the bands, which is likely due to different dust components dominating the continuum emission at short mid-IR wavelengths and long mid-IR wavelengths. We include Spitzer-IRS and Herschel/PACS 70 m data to fit spectral energy distribution templates at both emission peaks. The best fitting templates have extinctions of and toward the main and secondary emission peak and we estimated a color temperature of 68 K at both peaks from the 31 m and 37 m measurement. At the emission peaks the estimated dust masses are on the order of .
Subject headings:
galaxies: ISM — galaxies: starburst — galaxies: individual (M82) — Infrared: ISM1. Introduction
Over the last few yr a series of starbursts has been triggered in M82 (de Grijs 2001; Mayya et al. 2006) due to its interaction with M81 and NGC 3077 (e.g. Appleton et al. 1981; Yun et al. 1994; Sun et al. 2005; de Mello et al. 2008). The most recent starburst ( Myr, e.g. Rieke et al. 1980; Satyapal et al. 1997) has created a stellar cluster at the center of M82. A ring of ionized gas that is enveloped by a molecular gas ring surrounds this cluster, and the starburst is likely fueled by gas that is funneled toward this region by a 1 kpc (1′) stellar bar (Telesco et al. 1991; Achtermann & Lacy 1995; Wills et al. 2000; Greve et al. 2002). These gas rings, which appear between about and from the nucleus, could be gas swept up by a central expanding superbubble (Matsushita et al. 2000, 2005). High external gas pressure imposed on the molecular clouds probably drives the current starburst (Keto et al. 2005). This view is supported by the detection of warm molecular gas that is likely heated by dissipation of turbulence (Panuzzo et al. 2010).
The view to the center of M82 is obscured by patchy and high extinction (Satyapal et al. 1995; Förster Schreiber et al. 2001). The mid-infrared (mid-IR) wavelength regime, where the extinction is modest, is therefore used extensively to study the center of M82 (e.g. Rieke et al. 1980; Telesco et al. 1991; Förster Schreiber et al. 2001; Beirão et al. 2008). Individual star forming clouds that are located at the inner edge of the molecular gas ring or within the ionized gas ring have been observed in the mid-IR with large ground-based observatories that provide (sub-) arcsecond resolution (Lipscy & Plavchan 2004; Gandhi et al. 2011). Unfortunately, ground-based mid-IR observations are limited to a few telluric windows at m.
We have used the mid-IR camera FORCAST on SOFIA to study the central region of M82. FORCAST provides relatively high spatial resolution and also covers the entire 5-40 m wavelength range. Emission from hot, small grains dominates the continuum at short mid-IR wavelengths while emission from warm, large grains dominates at long mid-IR wavelengths. A total wavelength coverage is therefore important to determine the detailed contribution of each dust component to the continuum emission and to estimate the heating of the dust.
We adopt a distance of 3.5 Mpc for M82 (Dalcanton et al. 2009), so that corresponds to 17.5 pc.
2. Observation
We observed M82 in the 6.35 m (m), 6.61 m (m), 7.71 m (m), 31.5 m (m), and 37.1 m (m) passband filters using FORCAST (Adams et al. 2010; Herter et al. 2012b) on SOFIA (Young et al. 2012).
FORCAST is a dual-channel camera with a short-wavelength channel (m) and a long-wavelength channel (m), allowing for simultaneous observations at two specific wavelengths by selecting band-pass filters in filter wheels. A dichroic beam-splitter directs the same field of view to both the short- and long-wavelength cameras. To increase sensitivity, the beam-splitter can be either removed or replaced by a mirror during an observation. The effective field of view of the two 256 square arrays is . After distortion correction, the pixel size is .
We observed M82 on 2010 December 1 in the two long wavelength bands without dichroic at an altitude of about 43000 feet. We used the on-chip chop-nod observing mode with a chopper throw and nod-distance of and , respectively, and a chop frequency of 2 Hz. In this mode the source is alway on the detector array. For the 37 m and 31 m observations we took seven and five integrations, respectively, with an on-source time of 60 s per integration. The observations in the 37 m band were taken at a zenith angle of about .
On 2010 December 4, we obtained four integrations of M82 in the 6.6 m and 7.7 m bands and eight integrations in the 6.4 m band from an altitude of about 42000 feet. All bands were observed without beam-splitter, except for the 7.7 m band observations, which were observed simultaneously with the 31 m band. We observed again in the on-chip chop-nod mode, but with a chopper throw and nod-distance of and a chop frequency of 5 Hz. All bands were observed at a zenith angle of about .
Since M82 is bright in all bands, we spatially registered the individual chop/nod integrations using a two-dimensional Gaussian fit over the entire galaxy before co-adding the individual integrations. These pointing-corrections are about 3 pixels and improve the noise and the final maps. Due to the on-chip chop-nod observing mode the extent of the final images is about . Since pointing accuracy and drifts were on the order of several arcseconds, we determined the absolute position of the M82 observation by comparing the 7.7 m FORCAST map with the 8 m Spitzer/IRAC map from the Spitzer archive.
The flux densities in all bands were color-corrected. The standard stars Gem, UMi, and UMa were used for absolute flux density calibration and to estimate the beam size. Based on the uncertainty of flat fielding and the water vapor burden, as well as the variance of the flux density measurements, the uncertainty of the intrinsic flux density of the standard stars, and the fact that Gem and UMi are variable stars, we estimate a uncertainty of 20% for the absolute calibration (Herter et al. 2012a, b). Due to turbulent airflow across the telescope and pointing instabilities the observations are not diffraction limited. For the M82 observations, we estimate a beam size of about for all the bands.
The original maps of the 6.4 m, 6.6 m, and 7.7 m continuum had a lower signal-to-noise than the two long-wavelength maps and we therefore smoothed them with a 2 pixel FWHM Gaussian kernel. The final flux densities are presented in Table 1.
We include Herschel/PACS 70 m photometric data in our spectral energy distribution (SED) analysis below. Since processed and published PACS 70 m photometric data were unavailable, we used level 2.5 data product from the Herschel archive. The observations were carried out in scan-map mode at medium speed ( s-1) resulting in a smeared beam of about (PACS Observer Manual). We extracted background-subtracted flux densities within a aperture ( PACS pixels) at three positions (see Table 1 for positions). The flux densities are Jy (main peak), Jy (secondary peak), and Jy (ridge). Within a radius of , similar to the entire region observed with FORCAST, the 70 m flux density is Jy.
3. Results
3.1. Morphology
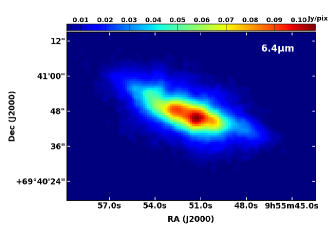
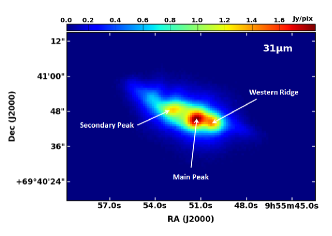
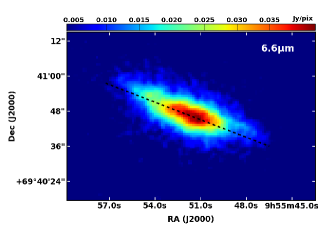
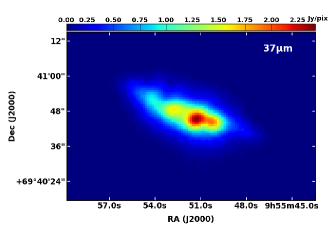
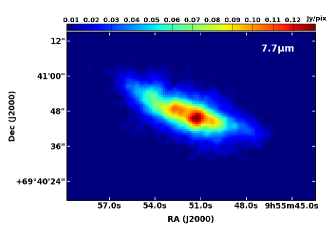
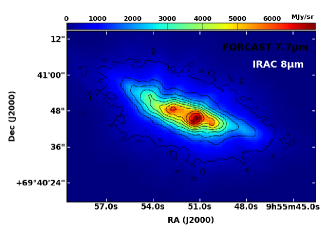
Figure 1 shows the distribution of the mid-IR emission in each of the observed bands. The 6.4 m, 6.6 m, and 7.7 m emission is slightly more extended than the 31 m and 37 m emission. Also, the contrast in the morphology is higher in the 31 m and 37 m emission than in the short-wavelength bands, with the peaks being more pronounced. The main peak of all mid-IR distributions is west–southwest from the dynamical center. Strong emission extends further to the west–southwest and “peaks” roughly from the center (“western ridge”). A secondary peak is visible east–northeast of the center (except at 6.6 m). In the 7.7 m band, the emission at the secondary peak appears as two separate components. The positions of the main and secondary peaks coincide roughly with the position of the ionized ring or the inner edge of the molecular ring.
The 7.7 m FORCAST map is in excellent agreement with the Spitzer/IRAC 8 m map (Figure 1). Also, the FORCAST 31 m map agrees very well with the 30 m map obtained by Telesco et al. (1991) using the NASA Infrared Telescope Facility (IRTF), and the flux densities at the main and secondary peaks agree within the calibration uncertainty.
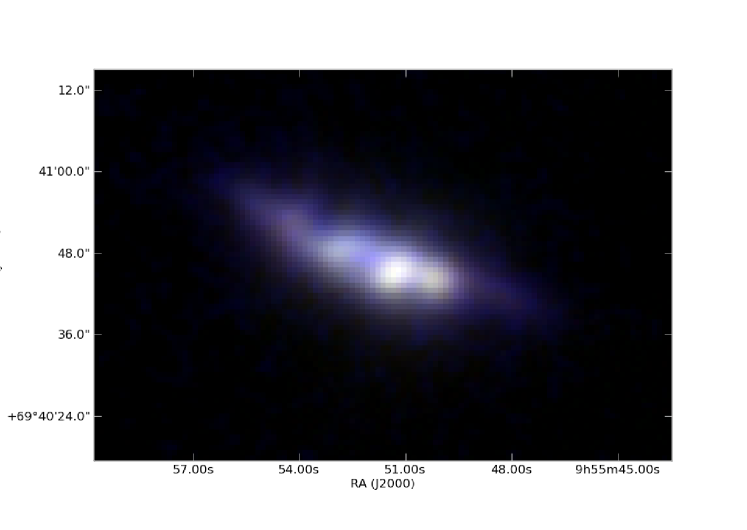
In Figure 2 we show a three-color image of M82, where we have combined the 6.6 m (blue), 31 m (green), and 37 m (red) bands. All colors are scaled linearly with flux density and start at the 3 level of the statistical background noise in each band. The image shows that the 6.6 m is more extended and that the secondary peak and western ridge are more pronounced in the two long-wavelength bands.
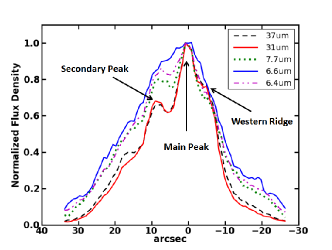
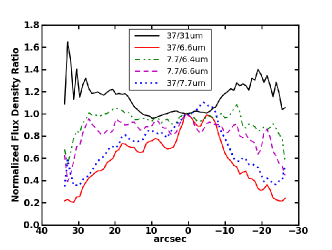
Figure 3 shows the emission profiles along a cut following the major axis of M82. The length and position of the cut is shown in Figure 1. The profiles are in steps of 1 pixel and the flux densities are summed over pixel strips perpendicular to the major axis and normalized to the emission peak. They emphasize that in the 31 m and 37 m bands the ratio between the main and secondary peak is much stronger than in the three short mid-IR bands. In fact, the 6.6 m continuum only shows a gradient in the flux density from the main peak toward the position of the secondary peak. The emission from the “western ridge” is very pronounced in the 31 m and 37 m bands, less in the 7.7 m and 6.4 m maps, and barely noticeable in the 6.6 m map. The 31 m and 37 m emission show a peak at this position that is stronger than the secondary peak.
Figure 3 also shows the flux density ratios along the major axis of M82. The profile of the 37m/6.6m and 37m/7.7m flux density ratios basically follows the profile of the 37 m flux density. In contrast, the flux density ratios of the 7.7m/6.6m and 7.7m/6.4m bands are fairly uniform along the major axis, with larger variations only at the edge of the profile, where the signal-to-noise becomes small. The profile of the 37m/31m flux density ratio differs from all others. It is basically flat within of the center of M82 and then increases on either side, while the flux density ratios of all other bands either decrease or stay constant with distance from the center. This indicates a higher color temperature of the large grains in the inner region than in the outer region. Also, the difference of the profiles between the three short mid-IR bands and two long mid-IR bands indicate that they trace different dust components with spatially distinct excitation conditions.
3.2. Mid-IR Spectral Energy Distribution
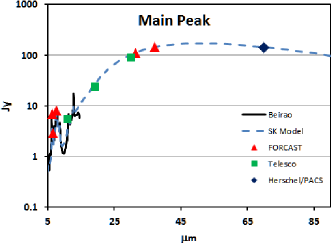
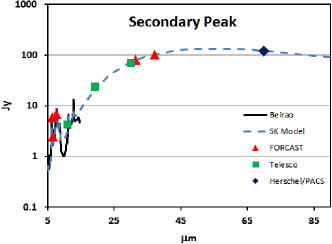
Siebenmorgen & Krügel (2007)111www.eso.org/~rsiebenm/sb_models/ have created template SEDs for starbursts as a function of the total luminosity (), optical extinction, contribution to the total luminosity by OB stars, and radius of the nuclear starburst, covering the wavelength range 0.03-2000 m. We use the FORCAST and PACS 70 m data points as well as low-resolution Spitzer-IRS spectra between 5.3 m to 12.8 m from region 2 and 3 of Beirão et al. (2008) to find the SED template that fits the data in the two mid-IR emission peaks within a ( pc) area, corresponding to FORCAST pixels. The lower size limit of the area is given by the Spitzer observation. Since this area is much smaller than the smallest nuclear radius in the SED template grid (350 pc), we constrained our search algorithm to that template series and allow it to fit an additional scaling factor. Figure 4 shows the data points and the best-fitting SED template at the main and secondary peaks. It includes three data points from Telesco et al. (1991), multiplied by a factor of two, which corresponds to the flux density ratio within a and aperture in a FORCAST band at the peaks. The flux densities at 70 m and 37 m at the main and secondary peaks are very similar and the 70 m flux density is thus crucial to constrain the SED fit.
For the main mid-IR emission peak, the best-fitting SED template has a total luminosity of , an OB luminosity fraction of 40%, an extinction of , and a hydrogen density of cm-3 in the hot spots. The template requires an additional scaling factor of 0.041, which is of the order of the ratio of observed to the template area, and lowers the total luminosity to . The best fitting model for the secondary emission peak has a total luminosity of , an OB luminosity fraction of 40%, an extinction of , a hydrogen density of cm-3, and requires an additional scaling factor of 0.11, which reduces the total luminosity to .
Due to limited resolution of the SED template parameters we estimate the derived extinction to be within a factor of two. Both values are lower than the extinction reported by Förster Schreiber et al. (2001) for the entire central region (). This discrepancy could be due to the patchy extinction in the central region (Satyapal et al. 1995; Lipscy & Plavchan 2004; Gandhi et al. 2011).
3.2.1 Extinction
The extinction laws between 3 and 10 m toward the center of M82 and the Galactic center (GC) are similar (Förster Schreiber et al. 2001), and for the GC it is best modeled with (Draine 2003). To estimate the extinction and emissivity at the FORCAST bands we therefore use the GC extinction law as modeled by Li & Draine (2001) and Weingartner & Draine (2001)222www.astro.princeton.edu/~draine/dust/dustmix.html with , a gas-to-dust mass ratio of 105, a dust grain mass per hydrogen atom of g/H, cm (with ), and an emissivity index of for the 31 m and 37 m bands. The mass absorption coefficient and albedo at 31.62 and 37.15 m are cm2g-1 and , and cm2g-1 and , respectively. Using the relation cm2g-1 (Li & Draine 2001) leads to and , resulting in and at the main emission peak, respectively. At the secondary emission peak the opacities are and .
3.2.2 Dust Mass
We use three different methods to estimate the dust masses at the main and secondary emission peaks within .
Applying the extinction laws from the previous section we estimate the gas mass using , where is the mean atomic mass per hydrogen, is the mass of atomic hydrogen, and is the total hydrogen column density. We obtain a total gas mass of at the main peak and at the secondary peak. Using a gas-to-dust ratio of 105 this gives dust masses of and at the main and secondary peak, respectively. Due to the uncertainty of the extinction, the dust masses can vary by a factor of two.
The dust mass can also be estimated by , where is the mass absorption coefficient, is the flux density, is the distance to M82, and is the Planck function at wavelength and temperature . Using the previously estimated opacities for 31 m and 37 m and a modified blackbody function we estimate a color temperature of K at both emission peaks. The resulting dust masses are and at the main and secondary peaks, respectively. The uncertainty of the masses is within a factor of four.
Sanders et al. (1991) estimate the dust mass using the relation , where is the dust temperature and is the far-IR luminosity in the range between 40 and 500 m. From the best fitting model SED we determine a at the main peak and at the secondary peak. Using the color temperatures derived above we obtain dust masses of and at the main and secondary peak. These dust masses are good to a factor of three.
High resolution CO measurements with a aperture suggest molecular hydrogen column densities of cm-2 at our main peak and cm-2 at our secondary peak (Weiß et al. 2001). So, the enclosed gas masses, including He and other heavy elements, are . Assuming a gas-to-dust ratio of 105 this yields dust masses between , in agreement with our calculations above.
4. Summary
We have presented the first results of mid-IR observations of M82 obtained with FORCAST on SOFIA. M82 was observed in the 6.4 m, 6.6 m, 7.7 m, 31.5 m, and 37.1 m bands. The observations cover a region. All bands show a strong peak located west–southwest of the kinematic center of M82. A secondary peak east–northeast of the nucleus is seen in the 6.4 m, 7.7 m, 31.5 m, and 37.1 m bands, but not in the 6.6 m continuum. The profiles of the flux density ratios over along the major axis indicates that the emission at the three short mid-IR bands is dominated by a different dust component than the emission at the two long mid-IR bands. We fitted SED templates to the FORCAST data combined with PACS 70 m and low-resolution Spitzer-IRS spectra and estimated extinctions of and toward the main and secondary peaks and a dust color temperature of 68 K in both peaks. The dust masses at the locations of the emission peaks are on the order .
References
- Achtermann & Lacy (1995) Achtermann, J. M., & Lacy, J. H. 1995, ApJ, 439, 163
- Adams et al. (2010) Adams, J. D., et al. 2010, in Society of Photo-Optical Instrumentation Engineers (SPIE) Conference Series, Vol. 7735, Society of Photo-Optical Instrumentation Engineers (SPIE) Conference Series
- Appleton et al. (1981) Appleton, P. N., Davies, R. D., & Stephenson, R. J. 1981, MNRAS, 195, 327
- Beirão et al. (2008) Beirão, P., et al. 2008, ApJ, 676, 304
- Dalcanton et al. (2009) Dalcanton, J. J., et al. 2009, ApJS, 183, 67
- de Grijs (2001) de Grijs, R. 2001, Astronomy and Geophysics, 42, 040000
- de Mello et al. (2008) de Mello, D. F., Smith, L. J., Sabbi, E., Gallagher, J. S., Mountain, M., & Harbeck, D. R. 2008, AJ, 135, 548
- Draine (2003) Draine, B. T. 2003, ARA&A, 41, 241
- Förster Schreiber et al. (2001) Förster Schreiber, N. M., Genzel, R., Lutz, D., Kunze, D., & Sternberg, A. 2001, ApJ, 552, 544
- Gandhi et al. (2011) Gandhi, P., Isobe, N., Birkinshaw, M., Worrall, D. M., Sakon, I., Iwasawa, K., & Bamba, A. 2011, PASJ, 63, 505
- Greve et al. (2002) Greve, A., Wills, K. A., Neininger, N., & Pedlar, A. 2002, A&A, 383, 56
- Herter et al. (2012a) Herter, T. L., Vacca, W. D., & D., A. J. 2012a, in prep.
- Herter et al. (2012b) Herter, T. L., et al. 2012b, ApJ, this volume
- Keto et al. (2005) Keto, E., Ho, L. C., & Lo, K.-Y. 2005, ApJ, 635, 1062
- Li & Draine (2001) Li, A., & Draine, B. T. 2001, ApJ, 554, 778
- Lipscy & Plavchan (2004) Lipscy, S. J., & Plavchan, P. 2004, ApJ, 603, 82
- Matsushita et al. (2005) Matsushita, S., Kawabe, R., Kohno, K., Matsumoto, H., Tsuru, T. G., & Vila-Vilaró, B. 2005, ApJ, 618, 712
- Matsushita et al. (2000) Matsushita, S., Kawabe, R., Matsumoto, H., Tsuru, T. G., Kohno, K., Morita, K.-I., Okumura, S. K., & Vila-Vilaró, B. 2000, ApJ, 545, L107
- Mayya et al. (2006) Mayya, Y. D., Bressan, A., Carrasco, L., & Hernandez-Martinez, L. 2006, ApJ, 649, 172
- Panuzzo et al. (2010) Panuzzo, P., et al. 2010, A&A, 518, L37+
- Rieke et al. (1980) Rieke, G. H., Lebofsky, M. J., Thompson, R. I., Low, F. J., & Tokunaga, A. T. 1980, ApJ, 238, 24
- Sanders et al. (1991) Sanders, D. B., Scoville, N. Z., & Soifer, B. T. 1991, ApJ, 370, 158
- Satyapal et al. (1997) Satyapal, S., Watson, D. M., Pipher, J. L., Forrest, W. J., Greenhouse, M. A., Smith, H. A., Fischer, J., & Woodward, C. E. 1997, ApJ, 483, 148
- Satyapal et al. (1995) Satyapal, S., et al. 1995, ApJ, 448, 611
- Siebenmorgen & Krügel (2007) Siebenmorgen, R., & Krügel, E. 2007, A&A, 461, 445
- Sun et al. (2005) Sun, W.-H., et al. 2005, ApJ, 630, L133
- Telesco et al. (1991) Telesco, C. M., Joy, M., Dietz, K., Decher, R., & Campins, H. 1991, ApJ, 369, 135
- Weingartner & Draine (2001) Weingartner, J. C., & Draine, B. T. 2001, ApJ, 548, 296
- Weiß et al. (2001) Weiß, A., Neininger, N., Hüttemeister, S., & Klein, U. 2001, A&A, 365, 571
- Wills et al. (2000) Wills, K. A., Das, M., Pedlar, A., Muxlow, T. W. B., & Robinson, T. G. 2000, MNRAS, 316, 33
- Young et al. (2012) Young, E. T., et al. 2012, ApJ, this volume
- Yun et al. (1994) Yun, M. S., Ho, P. T. P., & Lo, K. Y. 1994, Nature, 372, 530
| Band | a | b,c | b,d | b,e | f,c | f,d | (Total Map)g |
|---|---|---|---|---|---|---|---|
| (m) | (Jy pixel-1) | (Jy) | (Jy) | (Jy) | (Jy) | (Jy) | (Jy) |
| 6.4 | |||||||
| 6.6 | |||||||
| 7.7 | |||||||
| 31.5 | |||||||
| 37.1 |