New light on EuO thin films
Preparation, transport, magnetism and
spectroscopy of a ferromagnetic
semiconductor
P. G. Steeneken
Rijksuniversiteit Groningen
New light on EuO thin films
Preparation, transport, magnetism and spectroscopy of a ferromagnetic
semiconductor
Proefschrift
ter verkrijging van het doctoraat in de
Wiskunde en Natuurwetenschappen
aan de Rijksuniversiteit Groningen
op gezag van de
Rector Magnificus, dr. F. Zwarts,
in het openbaar te verdedigen op
vrijdag 11 oktober 2002
om 16.00 uur
door
Peter Gerard Steeneken
geboren
op 3 mei 1974
te Groningen
| Promotores: | Prof. dr. G. A. Sawatzky |
| Prof. dr. ir. L. H. Tjeng | |
| Beoordelingscommissie: | Prof. dr. M. C. Aronson |
| Prof. dr. R. Griessen | |
| Prof. dr. D. van der Marel |
ISBN: 90-367-1695-0
Voor mijn ouders
The colored surface on the front
cover represents a 3D graph of the logarithm of the resistivity
(from bottom to top) of a Eu-rich EuO film on ZrO2 (001) at
temperatures from 10-300 K (from front to back) and at magnetic
fields of 0-5 T (from left to right). It is the same data set as
in figures 7.6(a) and 7.7(a). The back side
cover depicts the magnetization of EuO as calculated from a mean
field model in the same temperature-field range, with the
magnetization increasing from top to bottom. The degree of
alignment of the spins above the surface is also proportional to
the magnetization. Moreover their transparency disappears in the
range where Eu-rich EuO becomes metallic. The color of the
surface indicates the simultaneous red-shift. The state of the
electrons is projected by several light sources. The similarity
between the surfaces on front and back suggests a universal
relation between resistivity and magnetization below the Curie
temperature (see also figure 7.7(a)).
![[Uncaptioned image]](/html/1203.6771/assets/x1.png)
The work described in this thesis was performed in the
Surface Science Group (part of the Materials Science Centre) at
the Solid State Physics Laboratory of the University of
Groningen, the Netherlands. The project was supported by the
Dutch Foundation for Fundamental Research on Matter (FOM) with
financial support from the Dutch Organization for the Advancement
of Pure Research
(NWO).
Electronic edition (2002), Arxiv.org reprint in (2012).
Chapter 1 Introduction
The extreme diversity in the properties of solids originates for a large part from the multiformity of the many-electron state. Most characteristics of condensed matter, like optical, magnetic and transport properties, find their source mainly in this electronic structure. For a deeper understanding of condensed matter, knowledge of the electronic state of the system is therefore essential.
In this thesis, we will investigate europium monoxide (EuO), a fascinating compound in which the dependence of macroscopic properties on electronic structure is especially manifest, as it experiences a phase transition at which a change in electronic structure is accompanied by tremendous changes in magnetic, optical and transport properties. Besides these spectacular effects, EuO can also be considered as a model compound in several respects, because it is a clear realization of the existence of the Heisenberg ferromagnet [1, 2], and is also considered as a model compound for ionic ferromagnetic semiconductors. Additionally, it is one of the simplest and clearest representatives of a much studied class of ferromagnets in which the transition to the ferromagnetic state at the Curie temperature is accompanied by a change from a semiconducting to metallic conductivity.
As an introduction to the results of this thesis research, we will review previous work on EuO, while focussing on subjects addressed in this thesis. For additional information we refer the reader to the many review articles that have been written on the properties of EuO [3, 4, 5, 6, 7, 8, 9, 10, 11, 12].
1.1 Introduction to the properties of EuO
1.1.1 Structure and growth
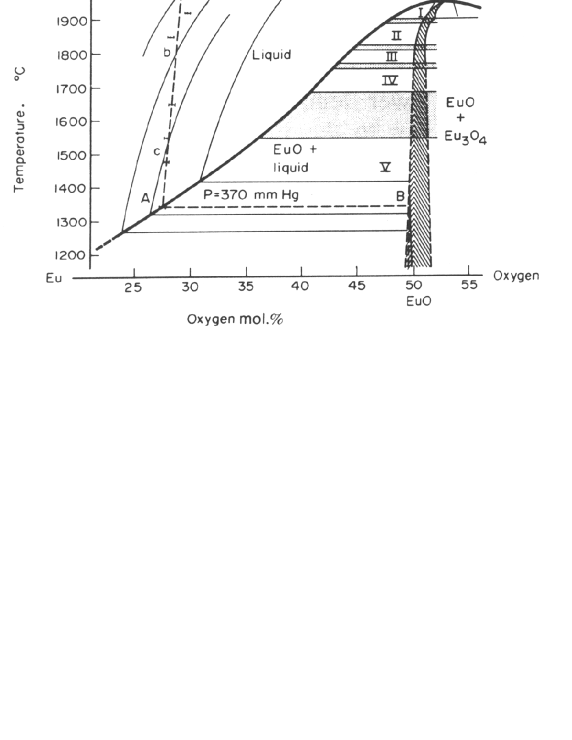
EuO has a rocksalt structure, with a room temperature lattice constant of 5.144 Å, which reduces to 5.127 Å below 10 K [13]. The density of Eu atoms in EuO is 44% higher than in Eu metal, and is only 3% lower than the concentration of Gd atoms in ferromagnetic Gd metal. Europium monoxide has an ionic Eu2+O2- character, such that the electronic configuration of europium is [Xe] and that of oxygen is . It was shown that homogeneous large single crystals can be grown [14, 15, 16] at temperatures of around 1800∘C. The phase diagram as obtained by Shafer et al. [15] is shown in figure 1.1. The stoichiometry of the resulting EuO crystals depends significantly on the growth temperature, as is indicated by the regions I to V in the phase diagram. Regions I and II correspond to oxygen rich samples, region III to stoichiometric EuO and regions IV and V correspond to Eu-rich samples. If the starting composition contains excess oxygen, part of the europium atoms will become Eu3+ ions, and Eu vacancies, Eu3O4 (see [17, 18, 19]) and Eu2O3 will form.
In many studies thin films of EuO have been grown [20, 21, 22, 23, 24, 25, 26, 27, 28, 29, 30]. It was shown that EuO films can be obtained by reactive evaporation of Eu metal in a low oxygen pressure while heating the substrate to C. When such polycrystalline films are grown on a glass substrate the grain size is 30 nm [25]. Thin films of EuO can also be obtained by partial oxidation of Eu metal films of less than 100 nm thickness. Such oxidized films contain a large excess of Eu atoms and have Eu metal inclusions, which can increase their Curie temperature significantly [25]. To prevent uncontrolled reactions of the very reactive Eu atoms with oxygen or water to Eu2O3 or Eu(OH)3, it is important to prepare and preserve the samples under (ultra) high vacuum conditions. Alternatively the films can be covered by a protective layer, although this can also affect their properties. The transport properties are especially sensitive to oxidation or heating above 350∘C as can be seen from figure 3.9. The ferromagnetism seems more robust, films of 20 nm which have been exposed to air for one week still show magnetic hysteresis. Although EuO thin films have often been grown, the growth mechanism is not well understood. We will address this issue in chapter 3.
1.1.2 Magnetism
Theories of Ferromagnetism
Our present understanding of ferromagnetism is still strongly influenced by the first conceptual models. The earliest attempt at a quantitative analysis of ferromagnetism was made by Weiss and is known as the mean (or molecular) field theory. Weiss proposed that the local magnetic moments in a ferromagnet are coupled by an effective macroscopic field along . In first order perturbation theory, the energy of an atom with local moment in such a field is . Therefore the free energy per ion is given by:
| (1.1) |
In combination with the thermodynamic relation for the magnetization and the assumption that the contribution of each moment to the effective field can be replaced by its mean contribution (), the magnetization versus temperature at any external field can be calculated self-consistently. It can be shown that the ferromagnetic Curie temperature, i.e. the temperature above which the spontaneous magnetization vanishes, is given by , where is the density of magnetic moments. Above the Curie temperature, the Curie-Weiss paramagnetic susceptibility is found: , with and .
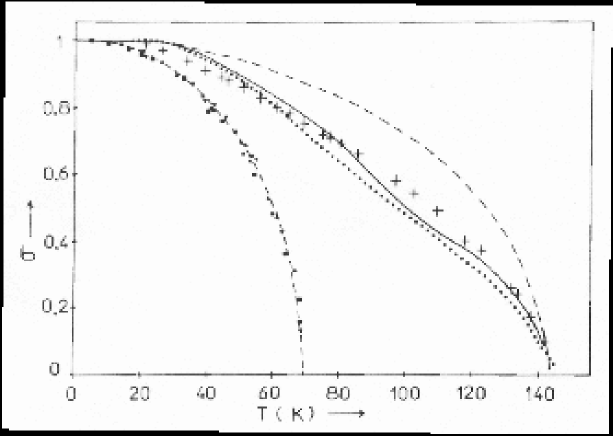
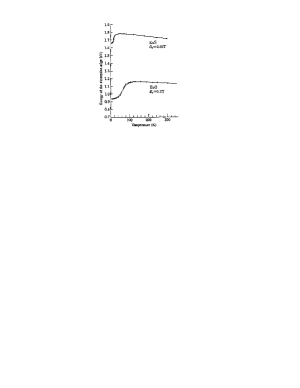
The mean field model is especially well-obeyed in compounds with widely separated ions with large, spin-only moments [32]. Moreover it works better at high coordination numbers. For the fcc Ising model, Tc predicted by the mean field model is less than 20% different from the exact solution [33, 34]. As all these conditions are favorable in stoichiometric EuO, the mean field model describes the temperature dependence of the magnetization very well, as can be seen in figure 1.2. However, even for EuO the mean field model is unsatisfactory in several respects. It cannot account for the difference between the ferromagnetic Curie temperature of 69.33 K [35] and the paramagnetic Curie temperature of 794 K [36]. Also the constant , as found from the paramagnetic susceptibility, is several percent larger than the mean field value. Moreover, the mean field model does not account exactly for the magnetization near the critical temperature [8].
The Weiss theory does not explain the origin of the effective field created by the magnetized spins. The first theoretical (and experimental) attempts to explain ferromagnetism by Ewing [37], considered each atom in the ferromagnet as a permanent magnet. The magnitude of the dipole-dipole interactions between the atoms is however much too small to account for the high Curie temperatures. As an example, the dipole-dipole interaction in iron is of the order of 0.1 K, which is certainly much too small to account for a Curie temperature of 1043 K [32].
Instead the mechanism which is usually responsible for ferromagnetism, and for many other magnetic ordering effects, is the mechanism of exchange. Exchange is a result of the combination of the Pauli principle and Coulomb repulsion between electrons. It can be understood by the following simple argument: as the Pauli principle forbids spin-parallel electrons to be in the same state, they will spatially separate, this spatial separation will reduce their Coulomb repulsion and thus lower their energy with respect to the spin-antiparallel configuration. On the other hand, the space accessible to the electrons will often reduce in the spin-parallel configuration and thus raise their kinetic energy. Therefore ferromagnetism will only occur when the reduction in Coulomb energy as a result of exchange will be larger than the kinetic energy increase.
It was shown by Heisenberg [1] that the effective field postulated by Weiss can be explained in terms of exchange interactions between electrons in neighboring atoms. This led to the much studied Heisenberg Hamiltonian:
| (1.2) |
where the brackets indicate that the sum has to be taken over nearest neighbors and the exchange energy is positive in the ferromagnetic Heisenberg model. From this model it can be shown [34] that the effective mean field parameter . The Heisenberg model describes the magnetic properties of EuO close to the Curie temperature better than mean field theory [8] and it can account for the spin-wave spectrum of EuO [38].
On the other hand, the Heisenberg model neglects the changes in kinetic energy as a result of exchange. Moreover, for the transition-metal ferromagnets the saturation magnetization is usually significantly lower than the prediction of the Heisenberg model of fully aligned local moments at T K. Stoner proposed a band model of ferromagnetism [39] which resolved these issues, and also reproduced the mean field results. Let us describe it briefly.
For a system to become ferromagnetic, it has to develop a spin-polarization (). In a band model the spin-dependent electron density can then be written as:
| (1.3) |
In the mean field approximation it can be shown that the exchange interaction is given by
| (1.4) |
Where is the difference between the repulsive Coulomb potential among spin-antiparallel and spin-parallel electron gases111By applying the mean field approximation to the Hubbard model, the same expression is obtained with equal to the Hubbard [32].. because the Pauli principle will maintain a larger spatial separation between spin-parallel electrons. On the other hand the average kinetic energy of the electrons will increase. For small magnetization the spin-up and spin-down chemical potentials will shift to , i.e. a spin-splitting proportional to the magnetization. is the density of states at the Fermi level. Therefore the total energy change as a result of the spin-polarization is given by:
| (1.5) |
This indicates that ferromagnetism will only occur when , which is called the Stoner criterion and illustrates the competition between kinetic and exchange interactions. The success of the Stoner model can be understood from the fact that it accounts for fractional magnetic moments and because it shows that ferromagnetism will more likely occur in narrow band materials, like the transition metals, as the bandwidth scales approximately as .
Although the Stoner model might be a good starting point for the description of the transition metals, strong correlation effects in the bands have to be considered. This is a topic of ongoing research222It seems that the conditions for ferromagnetism in the Hubbard model are rather strict. This is largely due to the fact that the Hubbard model in its simplest form does not consider Hund’s first rule [40, 32].. For electron systems the Stoner model is certainly inappropriate, as electrons are so highly localized that direct exchange interactions with electrons on neighboring atoms are negligible. Zener [41, 42] proposed that localized moments might instead be aligned via double exchange or via the exchange interactions with delocalized conduction electrons. This RKKY exchange coupling via conduction electrons, was shown to be of long-range, oscillatory nature [43, 44, 45] and is indeed often responsible for the magnetic ordering phenomena in rare-earth metals, like the ferromagnetism in Gd and Tb metal333Kondo interactions can however lead to fascinating complications, like the formation of a Kondo singlet phase [32, 46]..
Ferromagnetic insulators/semiconductors
In the case of an insulator these exchange mechanisms via free electrons of course do not work. Additionally, Kramers superexchange [47] generally leads to antiferromagnetic ordering. Therefore, only exchange via virtual excitations of valence band electrons to the conduction band, like that of Bloembergen and Rowland [48], can lead to a ferromagnetic interaction. It is thus not surprising that the existence of a ferromagnetic semiconductor or insulator was seriously doubted in the fifties [8]. This issue was resolved with the discovery of the ferromagnetic semiconductors CrBr3 [49] in 1960 and EuO one year later [50]. Soon afterwards the other magnetic ordering europium chalcenogides were found, ferromagnetic EuS, EuSe (ferro/ferri/antiferro-magnetic [51]) and antiferromagnetic EuTe.
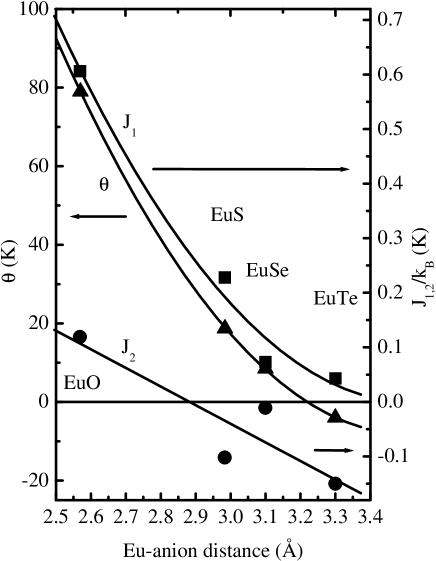
It was shown by neutron scattering experiments, that the Heisenberg model gives a good description of the spin-wave spectrum of EuO [38, 52]. The exchange integrals were accurately determined to be K and K for nearest and next-nearest neighbors444Note however that Tc predicted from the mean field Heisenberg model is only 42 K using these parameters.. Also the exchange parameters of the other Eu chalcenogides were determined and it was found that and depend similarly on the Eu-anion distance as is shown in figure 1.3. However, the question of the microscopic mechanism from which these exchange interactions originate, remains. Kasuya [53, 10] proposed the following competing exchange mechanisms in EuO:
-
1.
Nearest neighbor Eu-Eu interaction
-
•
A electron is excited to the band, experiences an exchange interaction with the spin on a nearest neighbor and returns to the initial state. This generally leads to ferromagnetic exchange.
-
•
-
2.
Next-nearest neighbor Eu-Eu interactions
-
•
The Kramers-Anderson superexchange. An electron is transferred via oxygen to an orbital on a neighboring atom. This exchange is antiferromagnetic and is very small, because the transfer integrals are small and the electron-electron repulsion is large (11 eV, see figure 1.8).
-
•
Superexchange via the interaction. Oxygen electrons are transferred to the orbitals of neighboring Eu atoms, there they affect the spins via the exchange interaction. The 180∘ Eu-chalcogenide-Eu bond angle leads to a substantial antiferromagnetic exchange (similar to Kramers-Anderson superexchange) and explains why is negative in EuS, EuSe and EuTe.
-
•
A mix of both above mentioned mechanisms. Via hybridization the and orbitals form bonding and antibonding molecular orbitals. An oxygen electron is excited from the bonding to the antibonding - molecular orbital, which has exchange interaction with both Eu spins, its place is taken by a Eu electron, after which the electron fills the hole555This mechanism is essentially equal to the virtual excitation of an O electron to the conduction band, where it contributes to the exchange, similar to the way in which free electrons induce RKKY exchange.. This could lead to a ferromagnetic exchange and would explain why is positive in EuO.
-
•
Kasuya estimated the magnitude of these interactions (they were also discussed in [54, 55]). These estimates should however be considered with care, as there is a large uncertainty in the initial parameters. Recently, first principle LDA+U calculations of the different exchange strengths by Elfimov [56] show promising agreement with experiments. Such calculations might finally solve the question why ferromagnetic semiconductors can exist.
Effect of doping
EuO can be electron-doped in several ways. Divalent Eu can be substituted by a trivalent Gd or other rare-earth ions like La, Dy, Tb, Ho or Lu [57, 58, 3], but doping with other atoms like Ag and Cu is also possible [59]. Gd doping has been most studied, as Gd also has a half-filled shell and was thus expected to leave the spin-system untouched, only supplying carriers to the solid666However, indications have been found [60, 8] that Gd ions have their spin anti-parallel to the Eu spins.. The system could also be doped by substituting oxygen with a single valent anion like Cl, although this method has not been applied often [10]. Another way to electron dope EuO, is to supply an excess of Eu atoms to the compound. As these excess Eu atoms are too large to be incorporated as interstitials, oxygen vacancy sites will form. In practice it turns out that it is very difficult to introduce a large concentration of oxygen vacancies in EuO1-x crystals, the vacancy concentration usually remains below 0.5%. Higher concentration can be reached in polycrystalline thin films that are grown by the oxidation of Eu metal, as shown by Massenet et al. [25]. Also the concentration of rare earth ions that can be incorporated in crystals is limited in some cases [61, 10].
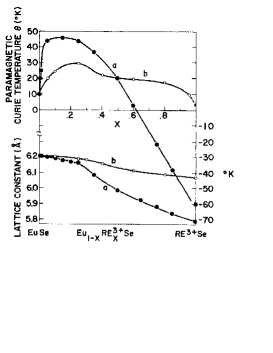
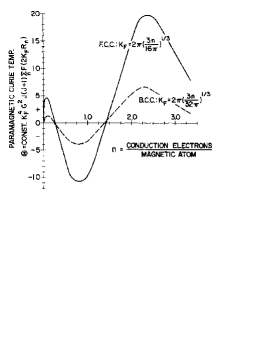
Although doping concentrations below 1% have an enormous effect on the transport properties of EuO, they do not seem to affect the Curie temperature much [62, 63, 10] as can be seen from figure 1.4(a). Higher doping concentrations have a large effect on Tc, and can even result in a Curie temperature as high as 148 K. On the other hand an increase in the free carrier concentration at room temperature of (as determined by optics [64]) is sufficient to lead to an increase in Tc of 10 K. This suggests that only the free carriers are responsible for increasing the ferromagnetic interactions with doping and seems to contradict models [4, 65] which ascribe the increase of the Curie temperature to high-spin bound magnetic polarons (BMP). It also suggests that for smaller doping concentrations the carriers are indeed bound, as will be discussed more extensively in chapter 7. The increased exchange via free electrons is probably similar to that expected from the RKKY interaction. The increased Curie temperature can be qualitatively understood from the following simple argument [66, 64]. If the conduction electrons align their spin with the moments, they will gain an exchange energy eV [67]. Therefore the total energy gain per Eu atom at a doping concentration % is K which corresponds reasonably well with the observed increase in Tc of 79 K [62]777One should be careful when applying this argument, as there are indications that the exchange splitting decreases with doping [64].. Increasing the doping level above 2% does not seem to increase Tc anymore [61]. A similar maximum Tc around 2% electron doping was found for Eu1-xGdxS (52 K [68, 10]) and for EuSe (45 K [57]). At higher doping concentrations the Curie temperature in EuS and EuSe decreases again888Similar behavior is expected in EuO, it seems however difficult to reach high enough doping concentrations [61]. and they eventually become antiferromagnetic as is shown in figure 1.4(b). The doping dependence of the Curie temperature could be a result of the oscillatory concentration dependence of the RKKY interaction between two spins separated by a distance , [32]. It was shown by de Gennes [69, 32] that the Curie temperatures of the rare earth metals can be well understood from this relation. As doping affects the Fermi momentum , Holtzberg et al. [57] thus related the doping dependence of Tc in the Eu chalconegides to changes in the RKKY interaction with increasing , as is shown in figure 1.4(c). Although qualitative agreement is obtained (note that Gd metal would correspond to ), effects of band-structure and the effect of a different orientation of the doped Gd spins, might modify these results. Moreover, the RKKY interaction is derived for the case when the exchange splitting is small compared to the Fermi energy, a condition which is not fulfilled at low doping concentrations. More sophisticated calculations were done by Mauger et al. [70, 31, 10] and recently by Santos and Nolting [71].
Photodoping and field doping
As the dependence of the Curie temperature on chemical doping in the Eu chalcogenides is very strong, it might also be possible to achieve an increase in Curie temperature by optical injection of carriers in the conduction band. In fact, we have attempted such experiments by focussing a high power halogen lamp on EuO thin films, while measuring their Kerr effect with a separate laser. The temperature of the films was kept just above the Curie temperature (TT K). However, the experiments were unsuccessful as no remanent magnetization was achieved. Earlier attempts to dope electrons in the conduction band with high power pulsed lasers on EuS, have shown that an increase in magnetization of can be induced by light (for a review see [72, 73]). We have also made several preliminary attempts to introduce charge carriers in EuO by applying a large electric field in a field effect transistor (FET) geometry. We grew this FET by first growing a Cr gate electrode ( 0.25 cm2) on an Al2O3 substrate. This was covered by sputtering nm of Al2O3. On the dielectric (above the gate electrode) we evaporated source and drain contacts of Cr. On top of this structure we grew our EuO film, as described in chapter 3. However, no significant effect of the field on transport or Kerr effect was observed for gate voltages up to 5 V, at higher voltages, breakdown of the dielectric layer occurred. Recently, field induced ferromagnetism has been observed in (In,Mn)As by Ohno et al. [74]. A difference in Tc of 1 K was observed as a result of a field-induced electron doping of . Even larger changes in the Curie temperature are expected in the Eu chalcenogides at comparable doping concentrations. Additionally, field induced doping would allow studies of the doping dependence of the metal insulator transition in a much more controlled way. Our investigations of the effect of photo-doping on the metal insulator transition, are described in section 7.3.3. Interestingly, we found (figure 7.9) that the metal insulator transition in EuO can even be induced by light.
1.1.3 Optical properties
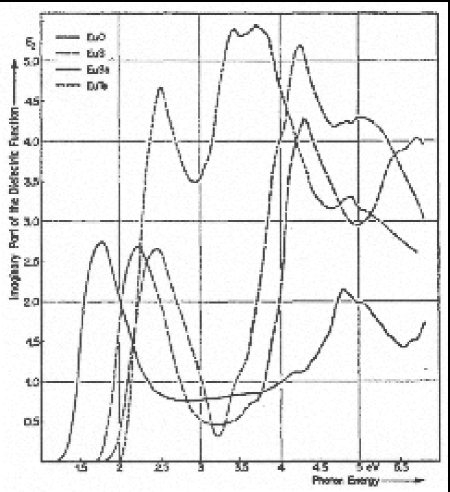
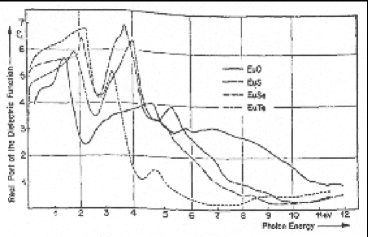
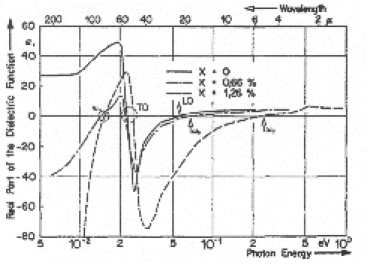
The optical properties of EuO have generated much interest, both because they probe the electronic structure, and because they change spectacularly upon lowering the temperature or applying a magnetic field. The optical spectrum consists mainly of transitions from the orbitals to the conduction band across the gap of 1.15 eV. Room temperature spectra of the dielectric function of the Eu chalcenogides are shown in figure 1.5.
|
|
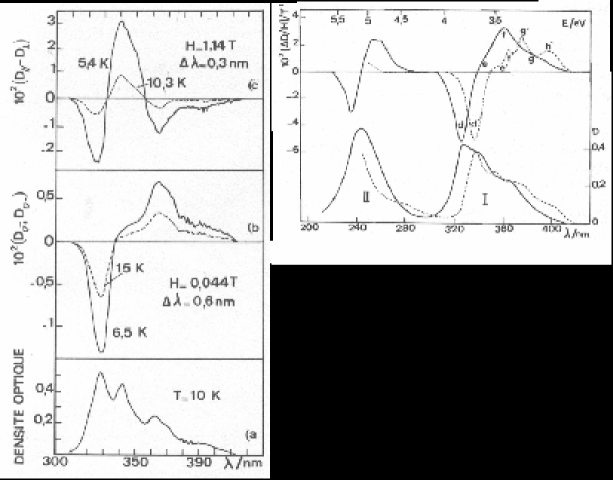
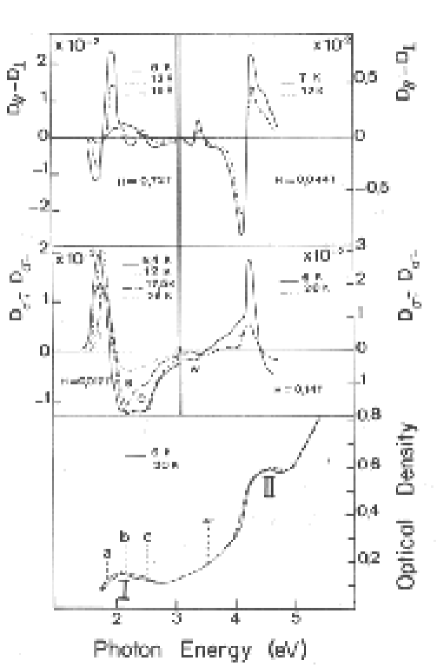
When the temperature is lowered, EuO becomes ferromagnetic and a large ( eV) shift of the optical absorption edge to lower energies is observed [76, 67, 64] as is shown in figure 1.6(a). This shift is a result of the direct exchange interaction between the polarized Eu spins and the conduction electrons, which pushes the spin-down band to higher energies and the spin-up band to lower energies, thus reducing the gap. We have observed this effect also as a splitting of the O edge x-ray absorption spectrum (XAS), as will be discussed in chapter 5.
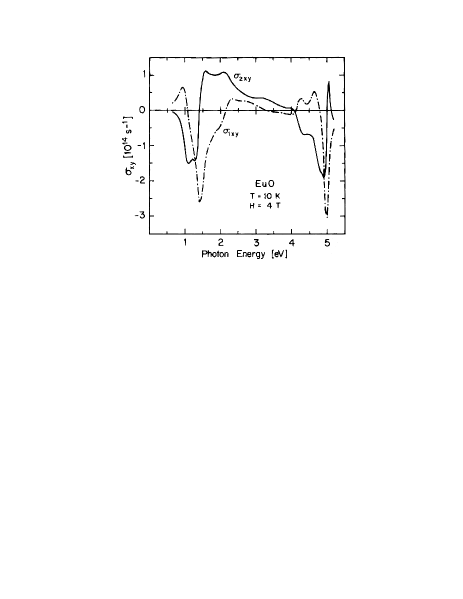
When optically exciting an electron from the shell to the conduction band, the remaining electrons are left in one of the final states. This effect is mainly responsible for the large magneto-optical effects (see figure 1.6(b)) observed in EuO, as we will discuss in chapter 2. These magneto-optical properties in EuO belong to the largest known, with a Faraday rotation of 7.5 deg/cm [78] and a bulk Kerr rotation of 7.1∘ [77], which can be strongly enhanced999The observation of a 90∘ Kerr rotation in CeSb has also been suggested to be a result of enhancements by (irreproducible) surface effects [79, 80, 81]. to 70∘ by growing films of EuO on Ag metal [82, 79]. The presence of multiplets strongly complicates the clarification of the electronic structure of the band by optics. Moreover, the electron-hole interaction seems to result in excitonic effects which affect the energies of the final states even more. As these effects are much weaker for the O shell than for the Eu shell, the O edge XAS is more easily interpreted in terms of a one electron picture and seems to give a clearer picture of the unoccupied density of states, as will be discussed in chapters 4 and 5.
1.1.4 Electronic structure
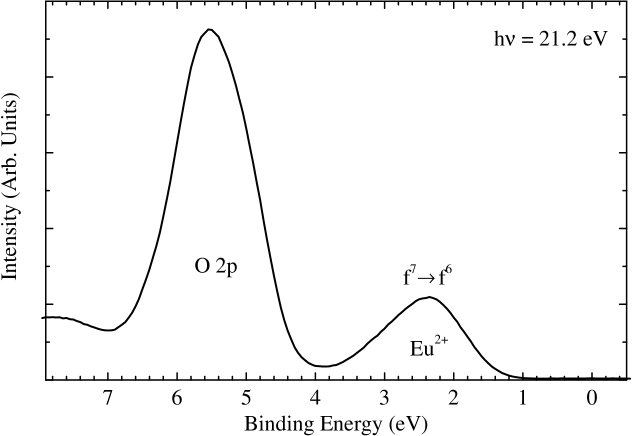
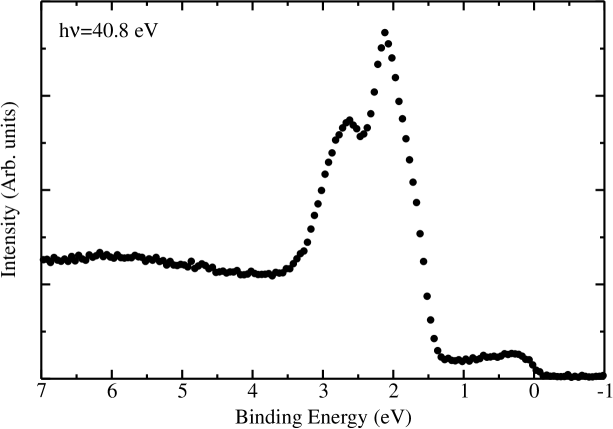
The energy levels of EuO which are important for the understanding of the low energy features, i.e. those which are near the chemical potential, are the O orbitals, the Eu orbitals, and the Eu conduction band. As the O2- and Eu2+ levels are (partially) occupied, they can be well studied by electron removal spectroscopy. Indeed these levels are clearly resolved by photoemission spectroscopy (UPS) of EuO as is shown in figures 1.7 and 3.2, and as was also observed in early works [83, 84, 85, 86].
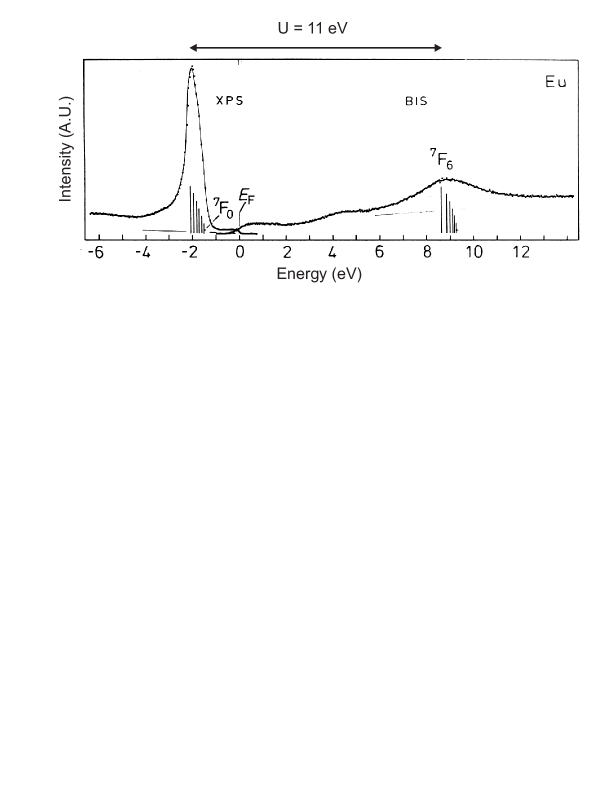
From Hund’s first rule we know that the ground state configuration of the Eu electrons will be high-spin . To remove an electron from the shell of a Eu2+ ion and add it to another ion will cost an energy Ueff = E+E E. The Coulomb interaction between electrons can be separated in a Coulomb repulsion term (which is the Slater parameter ) and a Hund’s rule exchange term . In a given configuration the repulsion between each pair of electrons gives an energy contribution , whereas for each pair of spin-parallel electrons the energy is reduced by as a result of exchange. Therefore, the energy of a certain configuration (neglecting the angular multiplet splittings) with () spin-up (spin-down) electrons is [88, 89]:
| (1.6) |
Thus, for Eu2+, U = . As eV and eV, 11.7 eV, which corresponds well [88] to the value of U 11 eV found by Lang et al. [87] in Eu metal by XPS and BIS measurements as is shown in figure 1.8. Moreover, this analysis indicates that it costs 5.4 eV to flip one spin in the ground state, showing that the high-spin configuration is very stable. Indeed, spin-resolved photoemission experiments show that the spin-polarization of the levels in EuO is nearly 100%, as is shown in figure 4.4 and was also studied by Sattler and Siegmann [90, 91]. Because the electrons are very localized, their hybridization with other orbitals is small. Thus, the transport properties are mainly determined by the conduction band, which is hybridized with the O band. Although the transfer integrals are quite small, the exchange interactions between these orbitals is still significant and leads to an exchange splitting of the conduction band.
The importance of exchange and spin-orbit coupling can be observed in the photoemission spectrum in figure 1.9, although the exchange and spin-orbit coupling parameters and of the delocalized orbitals are an order of magnitude smaller than those of the more localized orbital. Anyhow, as the exchange eV [76], the configuration of the spins can have a substantial influence on the transport properties and spin-polarization of the conduction band. This interplay between spins and the splitting and spin-polarization of the conduction band has theoretically extensively been studied [92, 93, 94, 10, 9, 12, 95, 96, 97, 98] and will experimentally be addressed in chapters 4 and 5.
1.1.5 Transport properties
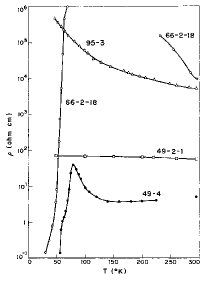
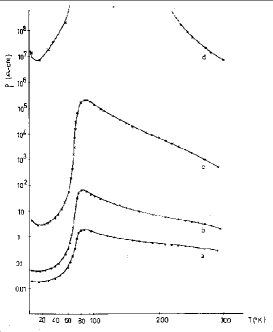
In figures 1.10(a-c,e), we show a selection of resistivity curves for different EuO1±x samples (many other samples have been studied in literature, see e.g. [99, 100, 101, 102]). For stoichiometric or oxygen rich crystals the temperature dependent conductivity shows a semiconductor-like behavior (curves 95-3 and 49-2-1 in figure 1.10(b) and curves I-8, II-1 and III-1 in figure 1.10(e)). Eu-rich EuO on the other hand shows an enormous reduction of its resistivity in the ferromagnetic state, which can exceed 12 orders of magnitude (figure 1.10(e)). However, besides these similarities there are a lot of differences between the resistivity curves of crystals grown under different conditions, like the magnitude and sharpness of the resistivity change near Tc, the activated or non-activated high-temperature resistivity, the resistivity cusp just above Tc, the resistivity hump around 50 K and the low temperature (T 20 K) resistivity upturn. For EuO films (see figure 1.10(c)) the resistivity is again markedly different from that of crystals, as the film resistivity decreases exponentially with temperature and unlike crystals, neither seems to show a temperature independent nor an activated high-temperature resistivity. Moreover, the pronounced resistivity cusp near Tc and the resistivity hump near 50 K which are observed in crystals are not observed in films, even not in epitaxial films, as will be discussed in chapters 3 and 7.
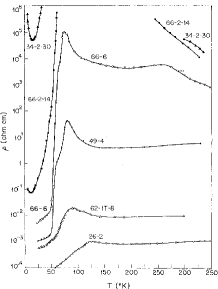 (a) of EuO1±x crystals, from [103].
|
 (b) of EuO1±x crystals, from [103].
|
 (c) of EuO1-x films, from [25].
|
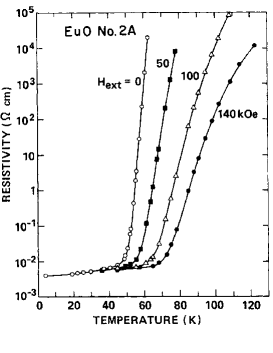 (d) Magnetoresistance of EuO crystal, from [99].
|
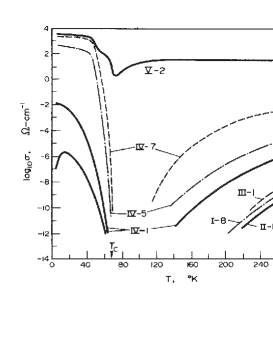 (e) of EuO1±x crystals, from [15].
|
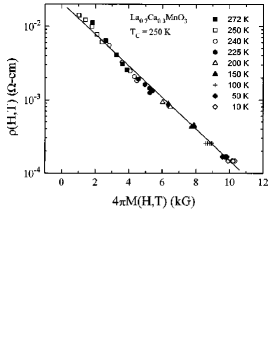 (f) in La0.7Ca0.3MnO3, from [104].
|
A second spectacular effect in Eu-rich EuO occurs upon the application of a magnetic field: the resistivity changes by more than six orders of magnitude when the sample temperature is close to Tc, as is shown in figures 1.10(d) and 7.6. In fact, there exists a considerable class of ferromagnetic materials with a large negative magnetoresistance around their Curie temperature, among which are the manganites [105], (Hg,Cd)Cr2Se4 [106], EuB6 [107] and the diluted ferromagnetic semiconductors like Ga1-xMnxAs [108]. A strong clue as to the origin of these magnetoresistive effects comes from the observation that the resistivity in some of these compounds only depends on the magnetization and does not explicitly depend on temperature and magnetic field (see figure 1.10(f) and figure 7.7), because this strongly suggests that the metal insulator transition is solely driven by a change in magnetization.
Although the origin of this metal insulator transition is still not unambiguously determined, several models have been proposed, all of which relate the transition to the delocalization of doped carriers below the Curie temperature. We will extensively review and discuss these models in chapter 7. From an experimental point of view however, much could be learned about the mechanism of the metal insulator by investigating the spectroscopic and microscopic structure of the vacancy sites in Eu-rich EuO. The only experimental signatures of their presence seem to be the peaks around 0.6 eV in the optical absorption which are difficult to interpret (see section 7.2.4). We have tried to observe the occupied vacancy electron levels by ultraviolet photoemission (UPS) on EuO thin films, however these measurements were not successful, both because the density of vacancy electrons is very small % and because of the presence of He-satellites in the binding energy range where the vacancy electrons were expected101010However, at high doping levels we detected a low intensity near the Fermi level with a shape similar to that of Eu-metal (figure 3.1).. Using a monochromatized light source in combination with an angle-resolved high-resolution analyzer would increase the chances of observing the vacancy electron states. On the other hand, the large advances in microscopic techniques in the last decades might alow the microscopic observation and spectrocopy of individual oxygen vacancy states in EuO. Moreover it would be interesting to investigate the presence of larger Eu metal clusters, as these might also strongly affect the transport properties.
1.1.6 Effect of pressure
In rare earth compounds containing Ce, Sm, Eu, Tm or Yb, the trivalent and divalent (tetravalent for Ce) configurations are separated by energies of less than 2 eV [88, 89]. In these compounds a change of valence can sometimes be accomplished by pressure (or temperature) [109]. A well known example of such a transition is the to phase transition in cerium. Jayaraman attributed a sudden decrease in the EuO lattice parameter around a pressure of 300 kbar to such a valence changing Eu Eu3+ transition, because the high pressure phase had a silvery luster, indicative of a metallic state. At an even higher pressure of 400 kbar he found a transition from NaCl to CsCl structure. Later measurements by Zimmer et al. did not find the discontinuity at 300 kbar. Instead a much more continuous change in lattice constant was observed which started around 130 kbar. Moreover, with increasing pressure, a large reduction of the optical gap was found [110, 111], which approached zero above 140 kbar. Although this change was interpreted as a Eu Eu3+ valence change [111], Mössbauer experiments [112] showed that the induced change resulted in a valence of only Eu2.07+ at high pressure. This induced concentration of free carriers of 7% is however more than sufficient to result in metallic behavior.
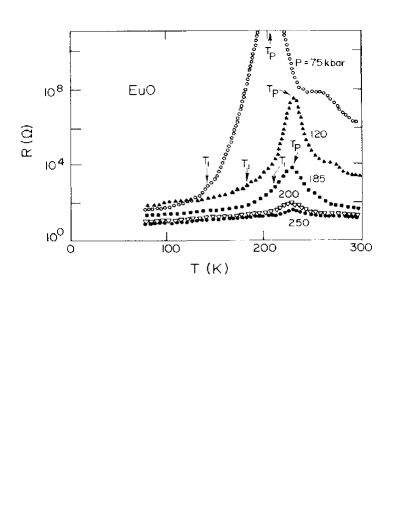
The related change in resistivity is at least as spectacular as that induced by a magnetic field, a pressure induced change in resistivity of more than 10 orders of magnitude is observed around 200 K (see figure 1.11(a) [113]). Pressure is expected to increase the exchange interactions, which explains the increase of the Curie temperature up to K at 200 kbar, as shown in figure 1.11(b) [112]. Increases in Tc, accompanied by a decreasing optical gap have also been obtained by chemical pressure, which was induced by substituting both Eu and O for trivalent cations and anions: Eu1-x(Gd,Nd)xO1-xNx [114]. We note here that it is an interesting perspective to try to induce an effective pressure in EuO, by growing epitaxial thin films of EuO substrates with a different lattice constant, like SrO ( Å) and CaO ( Å). Indeed, indications for modified Curie temperatures in epitaxial films on different substrates were found in EuO [29] and EuS [115].
1.2 Motivation and scope
Considering these captivating features of EuO and similar Eu chalcenogides EuS, EuSe and EuTe, it is not surprising that 18 years after the discovery111111The existence of EuO was first reported by Brauer [116] and Eick et al. [117]. of ferromagnetism in EuO [50] Wachter [8] wrote in 1979: ”It may very well be stated that there hardly exists a group of compounds so thoroughly investigated in every respect as the Eu chalcenogides.” Anno 2002, it might thus appear very difficult to improve the experimental and theoretical understanding of these compounds. However, spectroscopic techniques have developed enormously during the last 25 years as a result of improvements in synchrotron radiation sources, electron spectroscopy and ultra high vacuum technology. Yet, not many studies of EuO using these new methods have been done, mostly because the discovery of high-temperature superconductivity has shifted the attention of many solid state physicists towards the cuprates and the structurally similar manganite systems. Therefore, most of what is known about the electronic structure of EuO is still based on old optical studies and band-structure calculations.
-
•
In this thesis, we will use new spectroscopies to improve our knowledge of the electronic structure of EuO. In particular, we will use x-ray absorption (XAS) at the O edge to investigate the temperature dependent unoccupied density of states in EuO (chapter 5). To study the effect of ferromagnetism on the spin-polarization of the conduction band we develop a new spectroscopic technique: spin-resolved x-ray absorption spectroscopy121212Since our experiment on EuO, research projects have started to study the spin-polarization of the unoccupied states in CrO2 [118], Fe3O4, La1-xMnxO3 and Co doped TiO2, using this new technique. (chapter 4). Moreover, we try to improve the understanding of the relation between the spin and orbital polarization of the conduction band in a ferromagnet, by measuring the x-ray magnetic circular dichroism of EuO at the O edge (chapter 6).
From a technological perspective, the exponentially increasing data densities on magnetic recording media require large enhancements of the sensitivity of magnetic reading heads, which have led to a strong current interest in materials showing colossal magnetoresistance effects. Additionally, developments in magneto-optical recording have increased the demand for ferromagnets which show large magneto-optical effects as media for magneto-optical recording. Moreover, as decreasing circuit sizes push silicon technology towards its fundamental limits, scientists are seeking ways to exploit the properties of electrons in a more efficient way. This has led to large research efforts in the field of spintronics, which tries to make use of not just the charge but also the spin of the electrons. This might provide new logic, storage and sensor applications. Moreover, spintronics devices might show completely new phenomena, which are interesting from a more fundamental point of view. However, to make use of the electron spin, one needs ways to control and align it. In this respect, ferromagnetic semiconductors which have a highly spin-polarized conduction band are very interesting, as they combine the ability to spin-polarize electrons, with a good spin-injection efficiency [119, 120] into semiconductor devices131313Contrary to ferromagnetic metals, which usually have lower spin-polarization and a low injection efficiency to semiconductors [121].. EuO is very interesting, because it possesses these three technologically important features: CMR, large magneto-optical effects and a highly spin-polarized conduction band. While the rather low Curie temperature may make EuO unsuitable for common household applications, it is an extremely good model compound to develop new device concepts and to study the basic physics that determines the performance of devices. To manufacture such devices, the ability to grow high-quality epitaxial EuO thin films with a controlled stoichiometry is however essential.
-
•
We make use of the superior control of growth conditions granted by molecular beam epitaxy under ultra high vacuum (UHV) conditions [122] to grow such high quality EuO films. This new preparation route allows for the growth of EuO at lower substrate temperatures than the 1800∘C required for bulk single crystals. In particular, the 300-400∘C substrate temperatures needed, are very compatible with the manufacturing conditions for electronic devices. The effect of growth conditions on the structure and stoichiometry of the films will be studied in order to be able to control the stoichiometry and electron doping of the films without requiring an extremely accurate control of the ratio of beam fluxes (doping changes of % have very large effects on the transport properties). Moreover this investigation can provide insight in the growth kinetics that is responsible for the growth of EuO films (see chapter 3). The technological interest is not our only motivation to grow EuO films. EuO in thin film form is also essential for spin-polarized electron spectroscopies like spin-resolved photoemission and x-ray absorption, as the small sample volume guarantees a minimal influence of the magnetic moment of the sample on the electron-trajectories. Moreover, it might be that EuO thin films might show intrinsically different behavior than EuO in bulk form (see chapter 7). Additionally, in situ growth of thin films with controlled doping offers large flexibility to study doping dependent spectroscopic and macroscopic properties without exposing the samples to atmospheric conditions, and without requiring specialized high temperature crystal growth facilities and expertise.
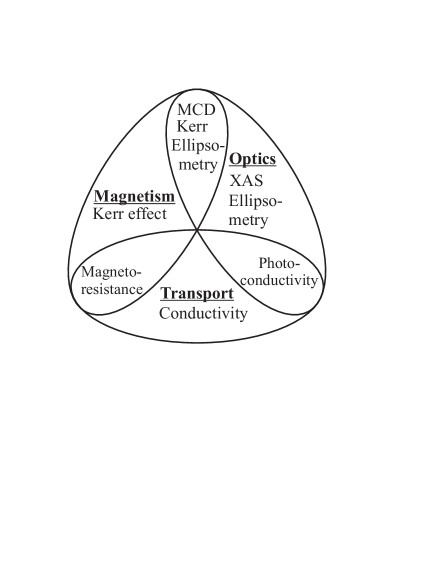
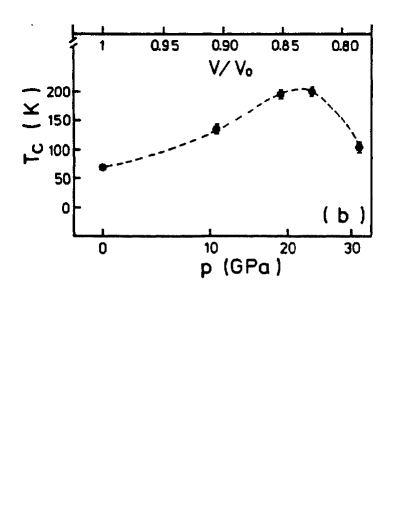
Figure 1.12: Summary of experimental methods used in this thesis to study magnetic, optical, transport and interrelated properties of EuO. -
•
Despite the fact that the magnetic, optical and transport properties of EuO have been investigated extensively for more than forty years, we will study these properties and the interrelated magneto-optical, magnetotransport and phototransport effects in EuO films, using various techniques as summarized141414Although ellipsometric measurements of EuO are mentioned in the figure, the results are not presented in this thesis, however we will briefly discuss them here: the optical spectrum of a nm EuO film on Cr metal has been studied using a Woollam VASE ellipsometer between 0.8 and 4 eV. After converting these ellipsometric results to a bulk dielectric function (taking the dielectric function of the Cr substrate into account), good agreement with the real and imaginary part of the dielectric constant as measured by Güntherodt [75] was found (see figure 1.5). Moreover, the low temperature shift of the absorption edge was reproduced. Additionally an exploratory study of the magneto-optical constants was performed by measuring the ellipsometric changes when the film was magnetized in-plane by a horseshoe magnet, in the plane of the light (longitudinal Kerr effect configuration). Software was developed to extract the off-diagonal components of the dielectric constant from the magnetization induced changes in the ellipsometric signal, fitting the curves using the Fresnel coefficients for a magneto-optical thin film [123]. Good agreement with the data by Wang et al. [77] was obtained (see figure 1.6(b)). These data are not presented in this thesis because both film quality (film had been exposed to air for one week) and magnetic field control were insufficiently reliable. in figure 1.12. The motivation for this study is twofold: the information that is obtained from these studies characterizes the film properties and thus tells us more about the effect of the growth conditions on the film properties. Secondly, there exist theoretical controversies in the models that describe these properties of EuO. This is the case for models that describe the optical and magneto-optical properties (discussed in chapter 2), but even more so for models of transport, magnetotransport and phototransport (discussed in chapter 7). The measurement of these properties in films of which we have determined the growth conditions and structural characteristics, in combination with the improved knowledge of their electronic structure from electron spectroscopy, can help us to come to a better understanding of the microscopic origins of these properties.
In chapter 8 we will discuss photoemission, resonant photoemission and XAS experiments which deal with the nature of the states near the chemical potential in the electron doped cuprate superconductor Nd2-xCexCuO4-δ. Although this subject lies outside the main line of this thesis, it will be presented, as it has been a substantial part of the research efforts. However, the performed research also included several interesting participations which are outside the scope of this thesis. These projects include: electron energy loss studies (EELS) of cuprate and manganate compounds which have led to a better understanding of EELS and photoemission spectroscopy [124, 125]. Workfunction measurements on the manganites [126]. Electron spectroscopic studies of (Bi,Pb)SrCoO compounds that clarified the electronic structure of the triangular CoO2 lattice [127]. Spin-resolved photoemission measurements on silver which allowed verification of theories on the Fano effect [128]. Spin-resolved circular polarized resonant photoemission experiments that studied the singlet character of the states near the chemical potential in several High-Tc cuprates [129, 130]. Besides some projects on EuO already mentioned in this chapter, there were also several other exploratory projects that have not been published, including XPS and temperature dependent XAS on YVO3 single crystals (large changes were observed around the phase transition at 77 K), and XPS measurements on superconducting MgB2 thin films.
1.3 Experimental
Details on the experimental methods used in this thesis work can be found in the respective chapters. As it is outside the scope of this thesis to give a complete review of all the experimental techniques used, we provide several references to books and reviews on these techniques here. For details on photoemission and photoelectron spectroscopy, see [131, 132, 133], x-ray absorption and x-ray magnetic circular dichroism [134], molecular beam epitaxy and ultra high vacuum technology [122, 135], optical properties of solids [136], magneto-optics [137] and for more details on the temperature dependent transport measurements see [138].
The thin EuO films studied in this thesis were grown in three different facilities. The study of their structure and the development of the growth recipe was done in a mini-MBE set-up (for drawings and details see [139]), which included effusion cells, a temperature controlled sample-manipulator, an annealing stage, gas inlets and a Staib RHEED gun. RHEED movies could be recorded during growth by a CCD camera. This chamber was attached to XPS and UPS spectrometer chambers which were separated by a preparation chamber with load-lock. The XPS spectrometer from Vacuum Generators/Surface Science had a monochromatized Al- x-ray source ( eV). Photoemitted electrons were collected by a hemispherical electron energy analyzer with a multichannel detector. The collection angle was 55∘ with respect to the surface normal of the samples. The overall resolution of the XPS was around 0.5 eV as determined by measuring the Fermi level of silver. The UPS measurements were performed with a differentially pumped Omicron helium discharge lamp and a VG Clam 2 electron analyzer with an acceptance angle of about and a resolution of about 0.1 eV. Moreover, in this chamber LEED measurements could be performed with an Omicron Spectaleed system.
Once the growth procedures were well developed, EuO films were also grown in the preparation chamber of a combined photoemission-conductivity facility which has been described in detail by Hesper [138]. Conductivity of the films could be monitored over a temperature range of 700 K, which allowed measurements of the film conductivity at low temperatures but also during growth. At high temperature, the holder on which the sample was mounted had to be thermally decoupled from the cryostat [138]. The film conductivity was measured using 4-point or 2-point contact configurations. The conductivity was measured at low frequencies ( 17 Hz) by Stanford Research Systems SR-830 digital lock-in amplifiers or by DC measurements with a Keithley 6512 electrometer. Both current and voltage controlled measurements were done. For the photoemission measurements in this set-up, He-I ( eV) and He-II ( eV) radiation was produced by an Omicron/Focus HIS-13 gas discharge lamp. Photoelectrons were detected by a 150 mm VSW hemispherical electron analyzer which, after optimization, reached resolutions of 7-8 meV.
The measurements presented in chapters 4, 6 and 8 were performed at beamline ID12B at the European Synchrotron Research Facility (ESRF) in Grenoble (this beamline has moved and is now named ID08). A detailed description of the synchrotron, undulators, monochromators and the spin-polarized electron detector [140] was given by Ghiringhelli [141]. EuO films were grown at the beamline using a growth procedure similar to that used in the set-ups in Groningen. XAS of EuO films was done at the ESRF in total electron yield mode, whereas XAS measurements of single crystals of EuO were done at the Dragon beamline at the Synchrotron Radiation Research Center (SRRC) in Taiwan in fluorescence yield mode.
Chapter 2 The magneto-optical spectrum of EuO
Until recently, most of what was known about the electronic structure of EuO was based on optical measurements and band structure calculations. The interpretation of the optical and magneto-optical spectra has appeared to be rather difficult and several contradictory explanations of these spectra have been given. Before we will discuss measurements of the electronic structure using new spectroscopic methods in the next chapters, we will discuss how we can understand the optical properties.
2.1 Spectrum of Eu2+ ion
From band structure calculations [142] and early photoemission studies [83, 84, 85, 86] it was found that the highest valence band orbitals of EuO are the Eu orbitals. Calculations [142, 56] also show that the conduction band is formed mainly by Eu . Therefore the lowest energy interband transitions in EuO are from the Eu orbitals to the Eu conduction band. Before we treat the optical spectrum of EuO let us first consider the energies of these transitions in a Eu2+ atom. Hund’s first rule tells us that the lowest energy state of the Eu atom will have a maximum spin of . As the exchange interactions between electrons are large, the ground state will thus have a very pure character, with (and thus ), and . The excited states have a Eu configuration. As transitions from an initial state to an final state are not allowed (parity has to change), and in Russel-Saunders coupling the final state has , and thus . In the presence of spin-orbit coupling, spin and orbital angular momentum mix and the final states and now also have some character, with the spin of the electron directed opposite to that of the electrons. As a result of the less favorable spin-configuration these 2 ’spin-flip’ final states will have a higher energy. Therefore we expect 5 different final state energies. In the excitation spectrum of free Eu2+ ions Sugar and Spector [143] found 6 strong peaks (intensity 100), one of which they attributed to a final state, two were assigned to a final state and three to the final state, corresponding to the optical selection rule . Two of the three final states are separated only by 132 cm-1 and therefore probably correspond to the same type of transition. The number of main peaks is thus nicely consistent with the 5 transitions expected from optical selection rules.
2.2 Europium atoms in crystals
When a europium atom is incorporated in a lattice its optical spectrum is strongly modified as a result of the crystal field. The effect of the crystal field on the electrons is however much smaller than that on the electrons. Therefore the electrons should be treated [32] by a weak crystal field with
exchange splittings spin-orbit coupling crystal fields.
And the electrons are subjected to a strong crystal field with
crystal field exchange splitting spin-orbit coupling.
Therefore the final state energy will be mainly determined by the crystal field splitting of the electron and by the total angular momentum of the 6 remaining electrons. Additionally the exchange interaction between the electron and the electron can change the final state energy. However as spin-flip transitions are only weakly allowed via spin-orbit coupling, these spin-flip final states will only slightly affect the absorption spectrum. From this evaluation we therefore expect the optical spectrum of Eu ions in a lattice to consist of 2 peaks corresponding to the and final states each of which is split into a septet corresponding to the states of the configurations. Such structures were convincingly found in the optical spectra of EuF2 and of Eu doped SrS and KBr by Freiser et al. [144, 67] as is shown in figure 2.1. It should be noted that EuF2 has a fluorite structure and as a result of the crystal field the orbitals have the lowest energy. The other compounds have a rocksalt structure with Eu as the lowest unoccupied states. The authors interpreted the data along the same lines as we described above. In a later work, Kasuya [7] arrived at similar conclusions, with the multiplet structure arising as a result of different . In the europium chalcenogides the sharp multiplet structures were generally not observed, instead a broad peak with a width of around 0.7 eV is usually found. Possibly the multiplets are smeared out in the chalcenogides as a result of band formation. It is however also possible that the optical spectra are blurred by surface oxidation of the reactive materials. In fact in situ reflectivity measurements by Güntherodt [75] on polished EuS crystals showed very similar multiplet structures in the imaginary part of the dielectric function indicating that the europium chalcenogides should be interpretated similarly to EuF2.
In the work by Kasuya the energy levels were labelled by values where was the orbital angular momentum of the electrons. This labelling was rather unfortunate as it was interpreted by Schoenes and coworkers [145, 146, 137, 8, 81] that the atomic optical selection rules for could be applied to Kasuya’s , with only the final states with being optically allowed. The application of the optical selection rules to is however incorrect as the orbital angular momentum of the electron is neglected in the process.
2.3 Transition probabilities
The magneto-optical spectra in EuO is mainly different from spectra of other compounds containing Eu2+ ions due to interactions of the excited electron with its surroundings. Such interactions can result in the formation of a Eu band and increase the exchange splitting in the ferromagnetic phase. However the main features that determine the magneto-optical spectrum in these compounds are still the multiplets in the final state. As the shell is rather insensitive to its surroundings, these effects will be similar for all compounds containing Eu2+ and their spectra should thus be explained along similar lines. Numerous studies [147, 148, 149, 150, 151, 152, 153, 154, 7, 145] have addressed the subject of the optical absorption spectrum of Eu2+. A very good agreement between calculated and measured spectra of Eu2+ impurities was found by Weakliem [147] who diagonalized the full 196 196 matrix of final states, including spin-orbit and Coulomb interactions. He found that a best fit with the experimental Eu2+:CaF2 data was obtained by taking the exchange integral G1=14 meV and a spin-orbit coupling of 31 meV. The smallness of these parameters suggests that the effects of exchange and spin-orbit coupling on the magneto-optical spectrum are weak. This motivated us to calculate the magneto-optical spectrum in a simpler approximation, neglecting these effects. Although the results are less generally valid, we present them here as they provide a simpler insight in the essentials that determine the magneto-optical spectrum.
2.3.1 Calculations
The calculation is performed assuming that the angular part of the and orbitals are still well approximated by hydrogenic wave functions. In the initial state the shell contains seven electrons with and (effects of crystal field splitting on the orbitals are neglected). After optical absorption, one of these electrons is excited to the band and is thus in an or orbital with . The optical dipole transition rate is given [155] by:
| (2.1) |
where is the polarization vector of the light. As the radial integrals are the same for all transitions, the transition rates only depend on the angular components and can be expressed as integrals of the spherical harmonics as follows:
| (2.2) |
The angular parts of the and final states are [156, 32]:
| (2.3) | |||||
We choose the quantization axis (-axis) parallel to the atom’s magnetization in the initial ground state, i.e. such that . Using equations (2.1), (2.2) and (2.3) we have calculated the transitions rates and for different polarization vectors with respect to the quantization axis. The integrals were analytically evaluated for linear polarized light parallel () and perpendicular () to the quantization axis, for left and right-circularly polarized light (, with ) and for an angular average over all light polarizations (). The results are shown in table 2.1.
3 45 0 0 90 30 45 0 0 90 30 0 2 60 30 0 120 50 0 30 0 0 10 1 1 3 96 6 0 34 39 0 6 72 26 2 0 36 0 36 36 24 0 108 0 0 36 3 -1 3 96 0 6 34 39 0 72 6 26 4 -2 60 30 120 0 50 0 30 0 0 10 5 -3 45 0 90 0 30 45 0 90 0 30 6
0 675 0 0 1350 450 675 0 0 1350 450 1 1725 525 0 3450 1325 675 525 0 1350 625 2 1788 2541 126 3450 2039 1494 525 126 2862 1171 3 2733 2541 1071 4395 2669 1494 3360 126 2862 2116 4 2838 5901 1071 4605 3859 2859 3360 2646 3072 3026 5 5988 7476 7371 4605 6484 2859 4935 2646 3072 3551 6 10713 7476 16821 4605 9634 7584 4935 12096 3072 6701

The -shell has in the initial state, one electron is removed and thus in the final state . In the initial state , removing one electron with orbital angular momentum thus leads to in the final state, therefore as indicated in table 2.1. As the 3 orbitals are essentially degenerate just like the 2 orbitals, the final state energy is mainly determined by the crystal field splitting and the total angular momentum of the remaining electrons. As there are state functions with , each of the final states with a specific is a superposition
| (2.4) |
Therefore the transition rate to a final state with a specific is
| (2.5) |
2.3.2 Comparison with Eu2+ impurities
Thus we find the transition probabilities to the different final states as tabulated in table 2.2. In figure 2.2 we show the resulting calculated spectra, making use of the experimentally obtained energy splittings [144] between the different multiplets and a crystal field splitting 10 of 2 eV. Gaussian broadened spectra are also shown. The absorption intensity distribution of the calculated multiplets is similar to that measured in EuF2 (figure 2.1). Large spectral changes occur when the polarization of the light is changed. In fact at the bottom of the absorption edge, the absorption of circularly polarized light is 100% helicity polarized, i.e. 1. The calculation shows how the transitions from the ground state can account for the very large magneto-optical effects in compounds containing Eu2+ ions, effects which are among the strongest known for any class of compounds [157, 151, 158, 159]. The obtained spectra are indeed similar to the more sophisticated calculations by Weakliem [147] and account very well for the observed magneto-optical spectra of Eu2+:CaF2 and Eu2+:KCl like in figure 2.3 [154, 147].
2.3.3 Comparison with europium chalcenogides
Although the model reproduces the multiplets in the spectra of EuF2 and of compounds containing Eu2+ impurities very well, the absorption spectra of the Eu chalcenogides are much broader. Possibly this is due to band formation. To model such band formation, we have convoluted the density of states as obtained by LDA+U of EuO (see [56] and figure 4.5), with the calculated multiplet structures. The resulting spectra have absorption peak energies of 3-4 eV and do not reproduce the measured absorption spectrum of EuO, which peaks around 2 eV. This indicates that excitonic effects pull spectral weight towards the band bottom as was suggested by Kasuya [4]. Recently an attempt was made to model the magneto-optical properties of EuO using an energy-band theory [160], which resulted in a too broad theoretical spectrum, possibly as a result of the same excitonic effects, which tend to reduce the effect of band formation on the broadening of the energy levels. This excitonic effect also explains why the ionic approximation, in which we calculated the magneto-optical spectrum of Eu2+, still provides a reasonable description of the measured magneto-optical spectrum in the chalcenogides [153, 145, 77, 137] as can be seen by comparing figures 2.4 and 2.2.
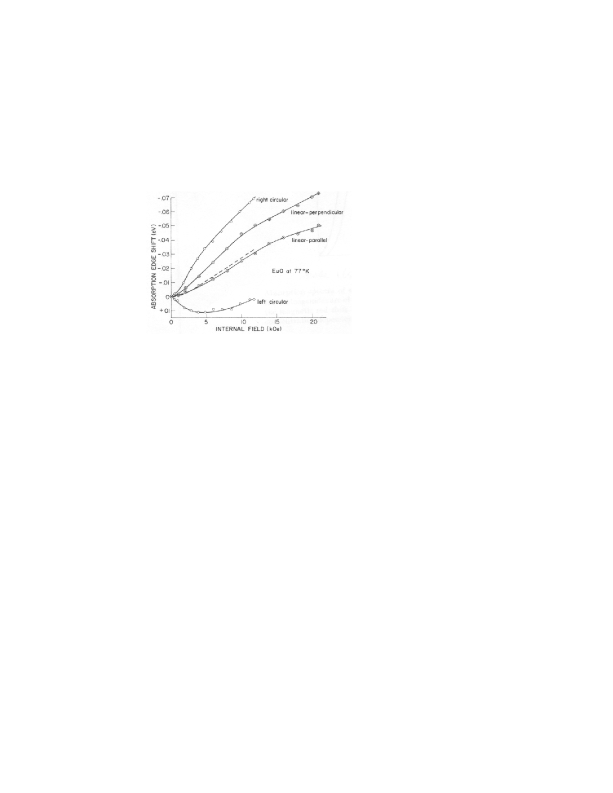
From the calculated spectra we can also understand why the shift of the absorption edge strongly depends on the polarization of the light when the sample is magnetized. In figure 2.5 we reproduce data by Freiser et al. taken at 77 K. Besides a shift of the absorption edge as a result of the exchange splitting of the conduction band with increasing magnetization, magnetic dichroism also results in a shift of the absorption edge. The effect of dichroism on the shift can be understood by comparing figures 2.2 and 2.5. When no internal magnetic field is present, the Eu spins will be randomly oriented and the optical spectrum will be similar to that of . Upon application of a field the Eu moments will align with the magnetization and the absorption edge will shift as a result of the exchange splitting, as will be discussed in more detail in chapter 5. Additionally a shift of the absorption edge is induced by dichroism. As the absorption spectrum in figure 2.2 for is the most similar to that for , the smallest dichroic contribution is expected for a light polarization vector . For a small shift of the bottom edge of the conduction band to higher energies is expected while for the dichroic shift of this edge to higher energies even exceeds the reduction due to exchange splitting. For right-circular polarized light () the shift of the absorption edge is increased by dichroism as observed.
The calculated spectra contradict the claim of Freiser et al. [67] that the spectra with the polarization vector parallel to the magnetization () are free of dichroism. This is an important observation as it means that to measure the temperature dependence of the absorption edge as a result of the exchange splitting, the configuration with the magnetic field parallel to the light polarization is not optimal as it might introduce a small reduction of the shift due to dichroic effects (Freiser et al. use a field H kOe). Instead measurements with zero total magnetization would be preferable, as would be measured at all temperatures.
2.4 Conclusions
We have analytically calculated the magneto-optical spectrum of transitions on Eu2+ ions using several simplifying approximations. The calculated spectra agree very well to the measured spectra of Eu2+ impurities in crystals and also agree well to more sophisticated calculations. Thus we have shown that the multiplet structures and large magneto-optical effects in these compounds are essentially a result of the polarization dependent transition rates to different final states when exciting a electron to the band. We argue that the magneto-optical effects in the Eu chalcenogides have the same origin. Moreover we showed that the polarization dependence of the shift of the absorption edge can be well understood from the calculated dichroic effects.
Chapter 3 Growth of EuO films with controlled properties
We report on the growth and properties of epitaxial and polycrystalline thin films of the ferromagnetic semiconductor EuO. The films were grown by MBE on several substrates. Their epitaxial structure was studied by RHEED and LEED. The composition of the films was checked by photoemission and the effect of growth conditions on the transport and magnetic properties were studied by in situ conductivity and Kerr-effect measurements. Based on our findings we propose a mechanism in which the growth is limited by the oxygen flux. This mechanism strongly facilitates the growth of stoichiometric EuO if the substrate temperature is high enough to reevaporate Eu atoms (C in vacuum). Moreover, we show that the doping in Eu-rich EuO films can be tuned by the growth temperature, thus allowing control over the magnitude of the metal-insulator transition.
3.1 Introduction
EuO is a ferromagnetic semiconductor with a Curie temperature of about 69 K, which was discovered in 1961 by Matthias et al. [50]. EuO has a rocksalt NaCl structure with a lattice parameter of 5.144 Å at room temperature. The transition to the ferromagnetic state is accompanied by a shift of the optical absorption edge [76, 67, 64] and in Eu-rich EuO a spectacular metal-insulator transition (MIT) and colossal magnetoresistance (CMR) occur [103, 99]. Moreover EuO shows very large magneto-optical effects. The last decades the interplay of magnetic, optical and transport properties has attracted much interest of both theorists and experimentalists, especially because EuO is a model compound for a whole class of compounds with similar properties. It was shown long ago that good single crystals of EuO can be grown at high temperatures around 1800∘C [15, 16]. We have obtained a recipe for the growth of high quality epitaxial EuO films at much lower temperatures. The ability to grow such films is especially important for device and multilayer research, because EuO could prove to be a very efficient spin polarized source for semiconductor spintronics research [161].
In this chapter we study the epitaxial growth of EuO on the (001) plane of 16 mol% Y2O3 stabilized cubic ZrO2 (YSZ) which has a lattice constant of 5.139 Å. This ensures an almost perfect lattice matching of the substrate with the EuO film, which is essential for the growth of ultrathin films without defects due to relaxation. We also study films grown on (001) MgO and () Al2O3. Besides the effect of the relative Eu and O fluxes, we examine the effect of the substrate temperature (Ts) on the growth. Thus we demonstrate that the growth of films with controlled stoichiometry is much facilitated by using a temperature regulated distillation effect. We show that the growth conditions have a very big influence on the transport properties, and in particular on the metal-insulator transition.
3.2 Experimental
EuO films were grown by molecular beam epitaxy (MBE) in two different UHV setups, one of which was dedicated to low-temperature conductivity, Kerr-effect and UPS measurements (base pressure below 510-11 mbar), the other was equipped with RHEED, LEED, XPS and UPS facilities (base pressure below 210-10 mbar). To grow the EuO films, high purity Eu metal (supplied by Ames Laboratory) was evaporated from an effusion cell which was kept at a constant temperature between 380∘C and 500∘C depending on the type and filling of the effusion cell. The Eu flux (JEu) was measured using a quartz crystal thickness monitor at the sample position. Simultaneously high purity oxygen gas was supplied through a leak valve which was located far from the sample, thus allowing accurate control of very low background pressures of oxygen. The flux of oxygen atoms at room temperature was approximated from the kinetic theory of gases [135, 122] to be J cm-2s-1, where is the partial pressure of oxygen in mbar as measured by an ionization pressure gauge which is located at similar distance from the oxygen inlet and cryopump as the sample. We estimated the film thicknesses by assuming a sticking factor of 1 for oxygen and stoichiometric EuO films, the correctness of this assumption will be discussed later. We estimate the error in the value of the europium and oxygen fluxes to be about 15%. Despite thorough vacuum outgassing, Eu evaporation caused the pressure in the chamber to increase to 3-5 mbar, which was confirmed by a residual gas mass-spectrometer to be a result of gas from the source material. According to the supplier the Eu metal indeed contained an estimated 300 ppm of H atoms. To check the effect of hydrogen contamination, we have grown thin films of Eu metal on clean polycrystalline Ta. As can be seen from figure 3.1 the UPS spectrum is similar to that in other photoemission studies of Eu metal [162, 163], suggesting that the hydrogen content of the films is small111If the hydrogen contamination is high, semiconducting EuH2 might be formed [164, 165, 162, 163]..
Reflection high-energy electron diffraction (RHEED) measurements were conducted during growth at a primary beam energy of 20 keV and an incident angle of 0.3∘-1.2∘ with respect to the surface. The primary beam was partially blocked by a small movable metal plate close to the RHEED screen to avoid obscuring of the RHEED features by the high intensity primary beam. Before growth, the substrates were annealed in an oxygen background pressure of mbar at temperatures of 650∘C for MgO and 820∘C for YSZ. The color of the YSZ substrates turned slightly brownish after this annealing procedure. The samples were resistively heated and their temperature was monitored by a thermocouple close to the sample position. XPS measurements were performed using monochromated Al radiation at an energy resolution of the electron analyzer of 0.5 eV.
Chromium metal contacts with a thickness of 100 nm were evaporated on the substrates to measure the conductivity of the EuO films. Sample resistances were determined by 2 and 4 point DC measurements or by a low-frequency lock-in technique. The sample temperature was monitored by a Pt film resistor at high and moderate temperatures and by a Si-diode at low temperatures. Kerr-effect measurements were performed using a 1.5 mW HeNe (h eV) laser. The in-plane polarized light was modulated by a chopper. Its angle of incidence was between 40∘ and 50∘. The outgoing beam was analyzed by a polarizer (=analyzer) which was rotated with respect to the incident polarization by an angle between 45∘ and 80∘ depending on the magnitude of the Kerr rotation. The transmitted signal was measured by a photodiode coupled to a lock-in amplifier. The birefringence of the cryostat windows was eliminated by a -plate which was placed in the optical path222To eliminate the birefringence of the windows, we placed polarizer and analyzer at 90∘ to have a minimal signal on the detector. Then a -plate was inserted and rotated to minimize the intensity on the detector to an even lower value. When the film is magnetized this results in a Kerr-rotation but also in a Kerr-ellipticity which are both proportional to the magnetization. In the described setup we cannot distinguish between these two effects, therefore we have assumed the ellipticity to be zero and calculated the ”Kerr rotation” in figures 3.10 and 3.11, which is thus actually a convolution of the Kerr rotation and ellipticity. At fixed temperature this ”Kerr rotation” is proportional to the magnetization, however when changing the temperature, the diagonal parts of the dielectric constant also change, which can result in a different Kerr rotation of the magneto-optical film at the same magnetization. This might explain the strange shape of the magnetization curve (a) in figure 3.10.. The sample was magnetized by an in situ liquid nitrogen cooled electromagnet. From the changes with magnetic field of the diode photocurrent, the optical Kerr-rotation was determined.
3.3 Results
3.3.1 Photoemission
The EuO films were grown on several substrates at different temperatures and fluxes of oxygen and europium, as is indicated in table 3.1. To show the effect of oxygen on the film stoichiometry we present in figure 3.2 the Al valence band XPS spectra of the different oxidation states of Eu that arise by varying the oxygen pressure.
# Substr. Ts (∘C) JO(cm-2s-1) JEu(cm-2s 1 MgO 400 2 MgO 300 3 YSZ 550 4 YSZ 300 5 YSZ 450 6 YSZ 450 7 YSZ 450 8 YSZ 350 9 YSZ 300 10 Al2O3 350 11 Al2O3 300 12 Al2O3 340
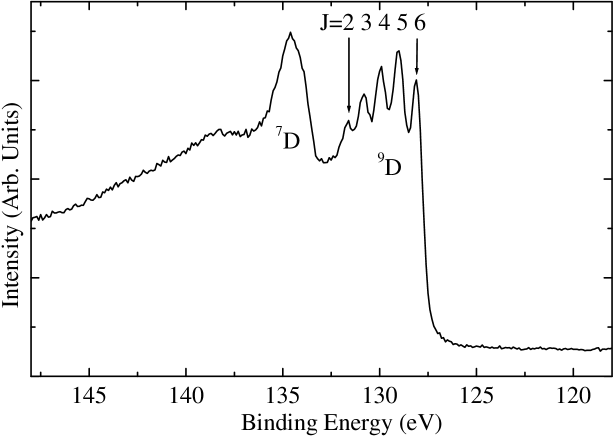
Photoemission is a very sensitive probe of the valency of Eu because the energies of the Eu2+ electron removal states are very different from those of the Eu states. As can be seen from figure 3.2(c), an excess of oxygen results in PES intensity between 6 and 12 eV which is due to the presence of Eu3+. Actually we verified that excessive oxidation of the films indeed results in the disappearance of the Eu2+ peak at 2 eV binding energy and only Eu3+ signal and O signal remains. Similarly the presence of Eu3+ can be sensitively probed by XPS of the Eu or shell, as the multiplet structure with a half filled shell is very different than for a configuration [166, 167, 168].
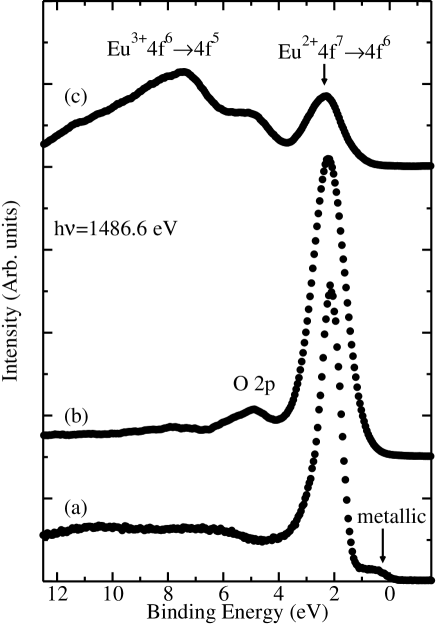
PES can also be used to monitor the presence of Eu metal, because free electrons will appear as PES intensity at the Fermi level like in figure 3.2(a). Figure 3.2(b) shows a typical photoemission spectrum of stoichiometric EuO, showing only spectral weight from Eu2+ and from the O levels. Interestingly, EuO films grown under the same conditions but at lower oxygen pressure show photoemission spectra which are very similar to the spectrum in figure 3.2(b). This suggests that the effect of oxygen pressure on the stoichiometry is very small as long as it stays below a critical limit. For films #1-9 the XPS valence band spectrum was taken to verify the absence of Eu3+ and the absence of high concentrations of free electrons. We only observed Eu3+ signatures in film #7.
3.3.2 Reevaporation of europium atoms
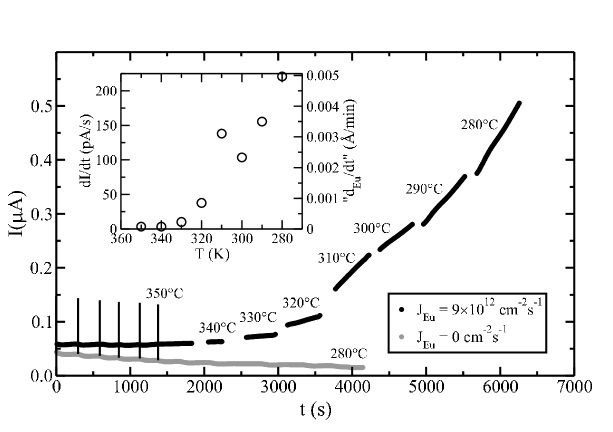
To obtain a better picture of the growth kinetics, and in particular the effect of substrate temperature on the accumulation of Eu metal on a EuO surface, we measured the current at constant voltage, through a EuO film of 10 nm while evaporating Eu metal on it (J cm-2s-1), but without supplying oxygen (). As shown in figure 3.3, the resistance of the film stays about constant while cooling it from 400∘C to 340∘C. However at temperatures of 340∘C and below the current through the film at constant temperature starts rising linearly with time. We ascribe this to the accumulation of excess Eu in the EuO surface layer region being formed. The inset of the figure shows the time derivative of the current for different film temperatures. This measurement indicates that at this Eu flux, Eu metal can only accumulate below 340∘C on the EuO surface. Moreover it indicates that the accumulation rate strongly depends on temperature. If we assume that the extra conduction is due to the presence of a uniform thin film of metallic Eu (cm [169]) on the surface, we find a growth rate of this film as given by the right axis of the graph in the inset. The actual growth rate is surely bigger, as the resistivity of metal films of less than a monolayer is strongly increased by surface scattering and non-uniformities. However, it is probable that no conducting Eu metal channel can be formed at these low coverages, and that the current increase is solely due to free carriers from the accumulated Eu metal which dope the underlaying EuO film.
3.3.3 RHEED and LEED
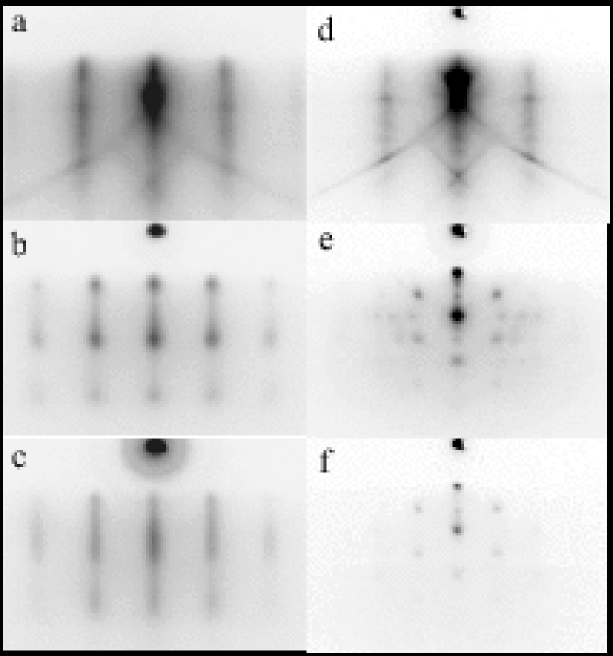
To obtain epitaxial films, we have grown EuO on the cleaved (001) surface of MgO and the chemically polished (001) surface of YSZ. We studied the surface structure of the EuO films during growth with RHEED. Figure 3.4 shows RHEED patterns during growth on MgO substrates. The RHEED pattern during growth of films grown at 400∘C is similar to that reported by Iwata et al. [29]. After starting the growth of film #1 the MgO streaks quickly disappear and a square pattern of spots appears in figure 3.4(b), with the distance between the spots a factor of 1.240.05 smaller than the distance between the MgO streaks. This is consistent with a quick relaxation to the bulk lattice constant of EuO, as the ratio of lattice constants =1.22. Moreover it shows that the [100] directions of substrate and film are aligned. Diffraction patterns are spot-like, indicative of island growth. After considerable time, the patterns become more streaky, demonstrating a flattening of the surface. At lower substrate temperatures we observed a different growth mode, as is demonstrated in the right column of figure 3.4 for film #2, which was grown at TC. Quickly after growth started, a hexagonal-like pattern emerged of which the spots sharpened first and then gradually faded away. The films grown at lower temperatures have a much rougher surface, resulting in transmission electron diffraction (TED) patterns. The origin of this hexagonal pattern is unclear to us, however it seems to resemble the transmission electron diffraction pattern expected for an incident electron beam perpendicular to the (111) plane.
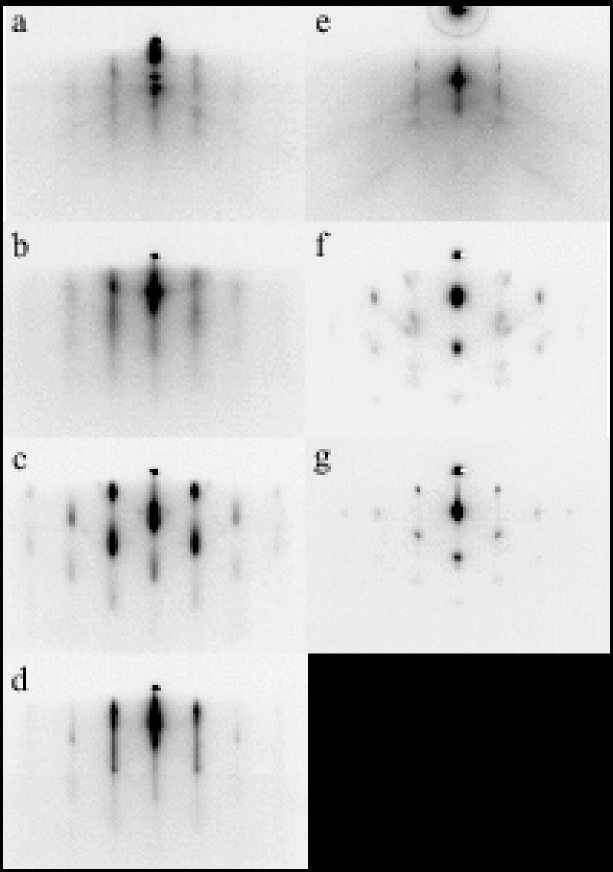
RHEED of YSZ was performed with the primary beam along the [110] axis. The left panel of figure 3.5 shows RHEED during growth at a substrate temperature of 550∘C. After the start of growth the RHEED streaks of the substrate stayed streaky and at the same position, indicating a homogeneous layer by layer growth of EuO(001) on the YSZ(001) surface. After several monolayers spots of TED features appeared, suggesting island growth. The rectangular arranged spots seem to correspond to TED along the [110] direction of an fcc crystal, indicating that islands still grow epitaxially and homogeneously with the substrate. Gradually the RHEED streaks return and sharpen up to a pattern consistent with a flat EuO(001) surface. At lower temperatures the RHEED was different as shown in the right panel of figure 3.5. Soon after growth transmission spots appeared due to roughening of the surface, with an unclear arrangement of spots. After 1000 s the spots rearranged, leaving the hexagonal-like RHEED pattern, similar to that observed on MgO, even though the incident beam direction with respect to the substrate was different in this case.
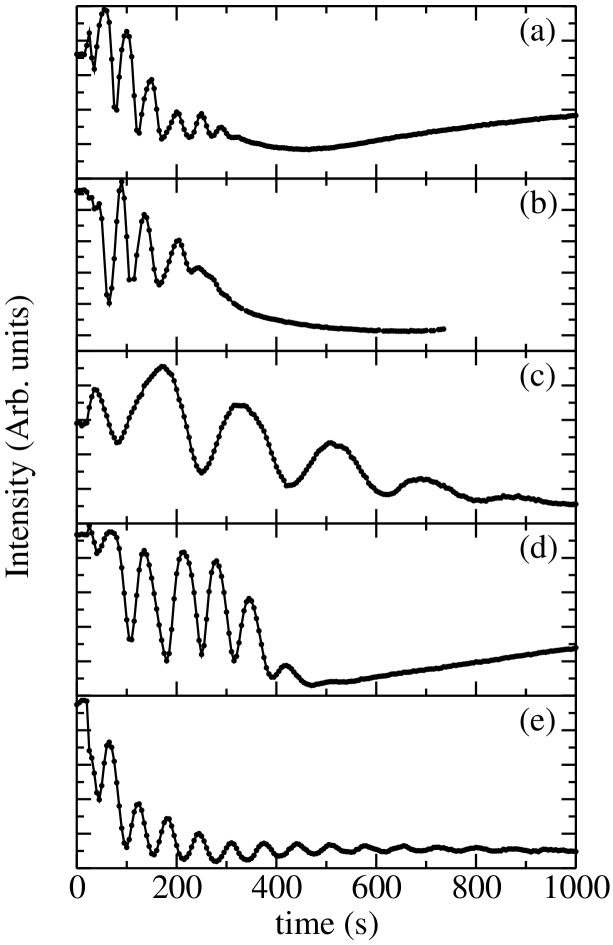
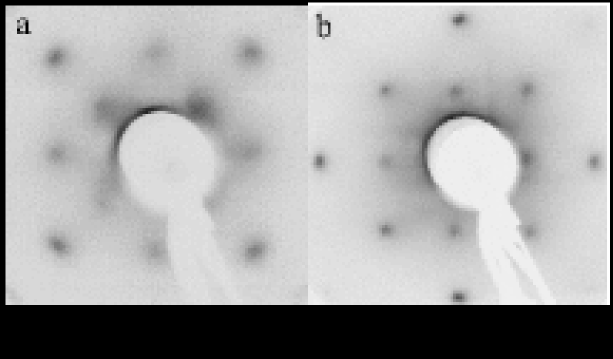
During growth, the intensity of the specularly reflected RHEED beam was recorded. For the films grown on YSZ, clear oscillations in the intensity were observed during the initial stage of growth as is shown in figure 3.6. Every oscillation corresponds to the formation of an atomic monolayer of EuO and therefore the oscillations are a measure of the growth rate [170]. The observed oscillation period was not completely constant and had the tendency to increase during growth, this is indicated by the error bars in the caption of the figure. Films were grown at 300∘C, 350∘C, 450∘C and 550∘C. Figures 3.6(a) and 3.6(b) show the intensity oscillations of films #3 and #4. During the intensity oscillations a streaky RHEED pattern was observed, like in figure 3.5(b). This pattern gradually changed to that of figure 3.5(c) or 3.5(f). The change was accompanied by a disappearance of the specularly reflected beam due to surface roughness and thus quenched the oscillations. In general, films grown above 400∘C showed about 6-8 oscillations before the specularly reflected beam disappeared, while films grown below 400∘C only showed 3-4 oscillations. To prevent the formation of Eu3+, the film growth was always started by first opening the Eu effusion cell, followed 15 s later by the admission of oxygen gas to the chamber, this might explain the slightly irregular behavior during the first seconds of growth. We used the RHEED oscillation period (Tosc) to investigate the effect of the partial oxygen pressure on the growth rate. In figures 3.6(c-e) we show the oscillations for oxygen background pressures of respectively 1 mbar, 2 mbar and 4 mbar, with Tosc in the caption. The growth rate is more than doubled by increasing the oxygen flux from 1 to 2 mbar indicative of an oxygen limited growth. When doubling the oxygen pressure again, there is only a small increase in the growth rate (figure 3.6(e)), but as many as 14 oscillations were observed, with streaky RHEED patterns, suggesting a less rough surface. However when investigating this film with XPS, a clear signature of Eu3+ was observed in addition to the Eu2+ feature like in figure 3.2(c), indicating that an excess flux of oxygen had led to the formation of Eu2O3. In this case the growth rate was probably limited by the Eu flux, thus explaining why the growth rate did not increase much upon increasing the oxygen flux. These observations indicate that the presence of RHEED oscillations and streaky patterns are not a reliable indication for a good stoichiometry. For the films grown on MgO no RHEED oscillations could be detected, which is probably a result of large defect densities and island growth during the initial stages of growth which are necessarily present to relax from the MgO to the EuO lattice constant.
The surface structure of the films was also studied by LEED as is shown in figure 3.7. Both the films grown on MgO(001) and on YSZ(001) show clear and stable 11 LEED patterns. The surface lattice constant of the EuO films as determined by comparing substrate and film LEED patterns, is within error bars equal to that of bulk EuO. Similar LEED patterns have been recorded on cleaved bulk EuO crystals [171, 172]. Interestingly, despite the surface roughness and the unclear hexagonal-like pattern observed in the RHEED of sample #4, a sharp 11 LEED pattern was still observed, indicative of epitaxial growth of the film on the substrate. In fact, samples grown at lower temperatures generally showed sharper LEED, and were less susceptible to charging effects. This may be related to the fact that charging problems are less likely to occur for these low temperature films, as they tend to be much less insulating.
3.3.4 Transport and magnetic properties
To study the effect of the growth conditions on the transport properties, we have measured the resistivity of films grown at different temperatures as is shown in figure 3.8.
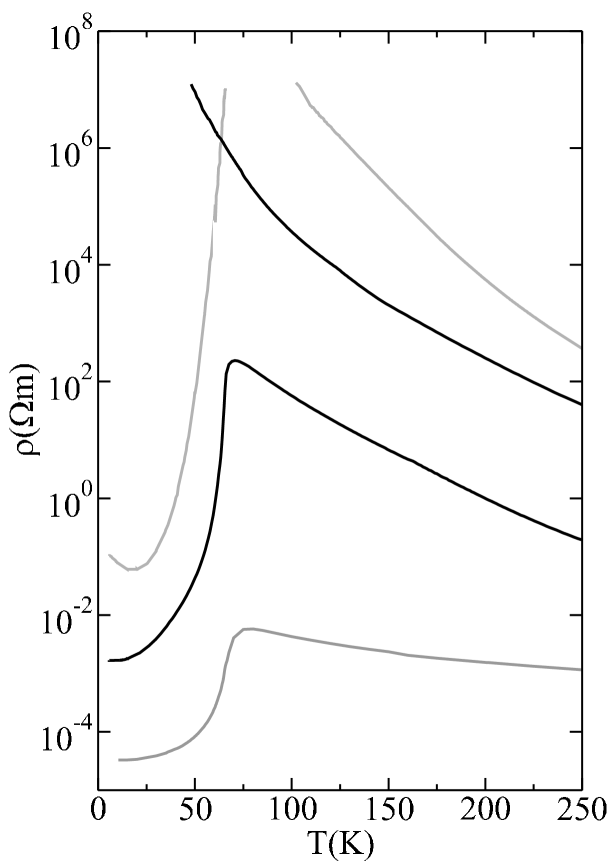
A huge effect of the growth temperature on the transport properties is observed, as the films grown at 350∘C have a much higher resistivity than those grown at 300∘C. Films #8 and #9 were grown on YSZ(100) under conditions which were known to result in epitaxial growth, whereas films #10 and #11 were grown on Al2O3(), which was known to result in polycrystalline films (circular patterns were observed in RHEED). The epitaxial films had a much higher resistivity than the polycrystalline films grown at the same temperature. Film #8 did not show a metal-insulator transition (this was also the case for films grown at 400∘C on Al2O3) indicative of (nearly) stoichiometric EuO [103]. The low temperature resistivity and the magnitude of the metal-insulator transition depend strongly on the substrate temperature during growth and on the fact if the film is epitaxial or not. The resistivity of the films was also strongly modified by heating them in situ to temperatures C, at which evaporation of excess Eu could occur.
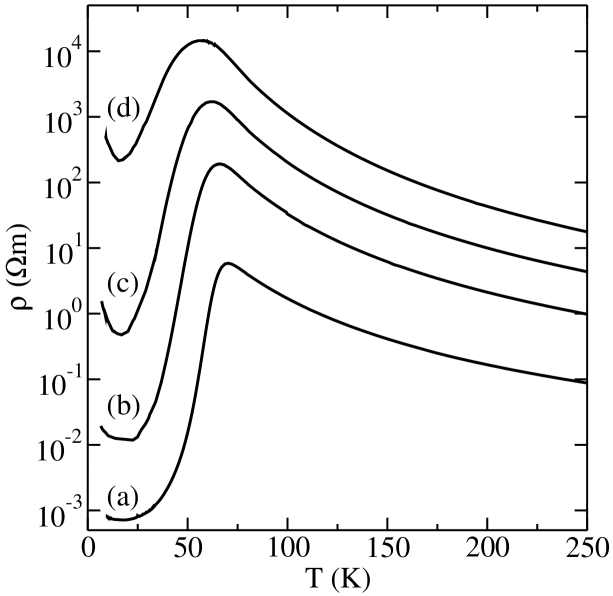
In figure 3.9 we show how the resistivity of a film increases by heating it successively for 30 minutes at high temperatures from 350-370∘C under UHV conditions. A possible explanation for the increased resistivity could be the evaporation of excess Eu atoms from the film, thus resulting in a lowering of the free electron concentration. However, the removal of Eu atoms could also increase the disorder and the number of defects in the film. Therefore, in addition to a decreased carrier concentration a larger defect scattering would be expected in the heated films, which might explain why such annealed films have a higher low-temperature resistivity than films that were grown with an intrinsically small carrier concentration. This effect also explains why we noticed that the transport properties of the films could depend on the cooling rate (faster cooling generally led to lower resistance), as the reevaporation of Eu atoms still continues after growth is stopped (i.e. when Eu and O fluxes are set to zero). Another remarkable and not well-understood effect is the shift of the peak resistivity in figure 3.9 to lower temperatures upon heating at higher temperatures. Maybe this lowering is a result of a reduced Curie temperature, although we did not check this.
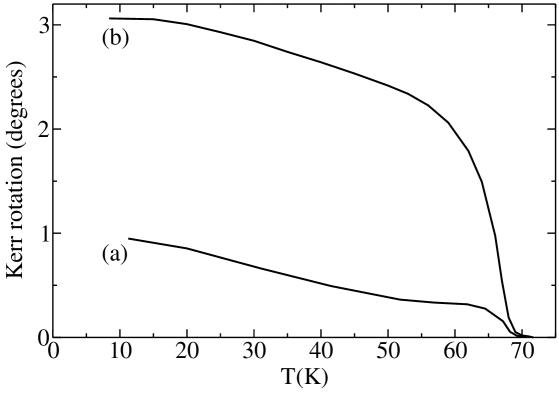
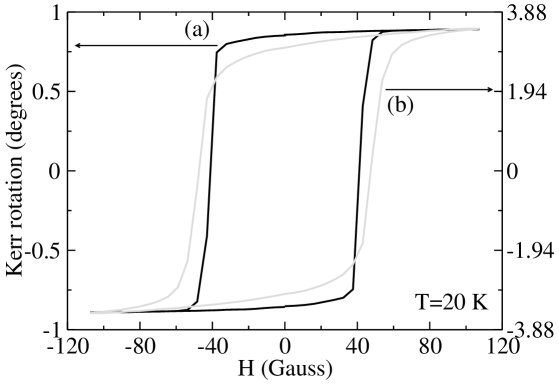
In figure 3.10 we show in situ measurements of the remanent Kerr rotation of films grown on YSZ and Cr metal. The films show a Curie temperature of 69 K, similar to that observed in bulk samples. Figure 3.11 shows a hysteresis curve for both an epitaxial film on YSZ and a polycrystalline film on Cr. The epitaxial film shows a more rectangular curve. The less rectangular hysteresis of the polycrystalline films might be understood from a random distribution of magnetic anisotropies of the polycrystalline domains, like in the Stoner-Wohlfarth model [173].
3.4 Discussion
From photoemission measurements on EuO films grown under different conditions we verified that there is a large range of growth parameters which result in EuO films without large fractions of Eu3+ or Eu metal. To obtain such films, the main conditions are:
-
1.
J to avoid the formation of Eu3+.
-
2.
TC to ensure reevaporation of excess Eu atoms.
Based on these observations we propose the following growth mechanism for EuO. Due to their high reactivity, the oxygen atoms have a sticking ratio of close to 1 when they encounter a europium atom which is not yet fully oxidized. Therefore when J it is very likely that Eu2O3 will be formed. If on the other hand J, excess Eu atoms will be present and a mixture of EuO and Eu metal will form. When the substrate temperature is high enough, the vapor pressure of Eu metal will be large and Eu metal atoms will be reevaporated, unless they react with oxygen (as is strongly supported by figure 3.3). Therefore these two conditions guarantee close to stoichiometric EuO films without requiring accurate tuning of the fluxes. The behavior of Eu on an EuO surface is similar to that of Ga atoms on a GaAs surface [174], although a difference exists in the fact that Ga can at maximum bind 1 As atom, whereas Eu can also bind 1.5 O atoms.
The proposed mechanism seems to operate by oxygen limited growth at 1, thus the number of Eu atoms that stick to the film is equal to the number of oxygen atoms and the growth rate is determined by the oxygen flux. This is supported by the RHEED intensity oscillations of samples #5 and #6 in figure 3.6(c) and (d). The oscillation period strongly increases upon doubling the oxygen pressure. It is interesting to compare the growth rates as deduced from the RHEED oscillations with those expected when assuming a sticking fraction of oxygen of 1. The period to grow a monolayer of EuO is then given by [cm-2s-1] s. Thus we find T s and T s in quite good agreement with the measured periods of respectively 1839 s and 704 s. The results from Iwata et al. [29] can be understood, if we assume an oxygen limited growth mechanism. From their data we deduce that when they use a flux J (cm-2s-1) they measure a growth rate of the EuO film of Å/s. However to have enough oxygen atoms for the reported growth rate of EuO, an oxygen flux of at least JO = 2.7 (cm-2s-1) is required. Therefore it is not unlikely that their actual oxygen flux was 2.4 times higher than the measured flux. The sticking probability of Eu atoms in their figure 6 would then approach 1 close to JO/JEu = 1, and the rate of sticking Eu atoms at low oxygen fluxes would be approximately equal to JO, consistent with a mechanism of oxygen limited growth. Moreover they also found that increasing the oxygen flux further resulted in the formation of Eu2O3 and a europium limited growth, similar to what we observed for film #7.
We found that films grown below 350∘C with generally had rougher surfaces (right panels of figures 3.4 and 3.5) and lower resistances (figure 3.8) than films grown at higher temperatures. Moreover films grown at these low temperatures show metal-insulator transitions around their Curie temperatures, which are known only to be present in Eu-rich EuO [103]. A clue as to the origin of these effects can be found in figure 3.3 from which it can be concluded that the surface accumulation of Eu metal on the EuO surface starts below 350∘C. These superfluous Eu atoms will be built into the lattice of EuO, and as they are probably too large to be incorporated as interstitial atoms, this will likely result in the formation of oxygen vacancies. A reduced growth temperature would lead to a larger accumulation of excess Eu atoms, increasing the likeliness of the formation of oxygen vacancies and thus forming a film with a higher doping concentration. It might be that the accumulated Eu metal atoms at the surface play a role in the increased surface roughness, and contribute to the electron doping of the EuO film being formed.
For the growth of epitaxial films, YSZ seems to be the best substrate due to its excellent lattice matching with EuO. Despite a large lattice mismatch, EuO films on MgO also grow crystalline and align their crystal axes to those of the substrate, however defects in the first monolayers due to relaxation of the film are unavoidable and monitoring the growth rate by RHEED oscillations seems impossible. To obtain films with a large metal-insulator transition epitaxial growth is not necessary, in fact polycrystalline films grown on Al2O3 keep their metal-insulator up to higher growth temperatures than epitaxial films. We did not manage to obtain metal-insulator transitions which spanned more than 6 orders of magnitude in the epitaxial films, while for the polycrystalline films we could obtain conductivity changes of 10 orders or magnitude or more. These differences between epitaxial and polycrystalline films are probably due to the fact that oxygen vacancies, which provide charge carriers, are more easily incorporated at grain boundaries or defects in the polycrystalline film, than in the crystalline epitaxial films. In fact for the epitaxial films it might even be the case that no oxygen vacancies are incorporated in the film, but all doping is provided by a thin Eu metal layer that floats on the EuO surface. We suggest this possibility, as we observed that the conductivity of Eu-rich films during growth (polycrystalline and epitaxial), usually did not increase linear with time, but was constant in time. This time independent resistance showed a strong dependence on oxygen pressure. It might be that a surface population of Eu atoms with density exists on the EuO surface during growth (a similar effect is observed in GaAs [174]) and the resistivity of the film only depends on the number of electrons donated by this surface population. The density of free Eu atoms on the surface should follow:
| (3.1) |
where is the temperature dependent surface lifetime333The average time a free Eu atom stays on the surface before it is reevaporated. of a Eu atom and where we assume that all oxygen atoms that reach the surface react with a Eu atom (i.e. oxygen limited growth). At steady state:
| (3.2) |
We propose two ways in which the effect of temperature on the doping concentration of the resulting films might be understood. Possibly, the probability to incorporate an oxygen vacancy in the film increases with . Decreasing the temperature will increase and thus increase the number of vacancies. Alternatively it might be that no vacancies are formed, but if is large and the film is cooled quickly after growth, a thin layer of Eu metal may persist on the surface and provide free carriers.
For all the measured films, the Curie temperature is similar to that of stoichiometric bulk samples. We have not observed significant increases of the Curie temperature above 69 K as was reported for Gd doped crystals [62], oxidized Eu metal films [25] and EuO films [29] on SrTiO3. Possibly the high doping concentrations that are required to increase Tc cannot be reached in crystalline films, just like in Eu-rich bulk crystals [10].
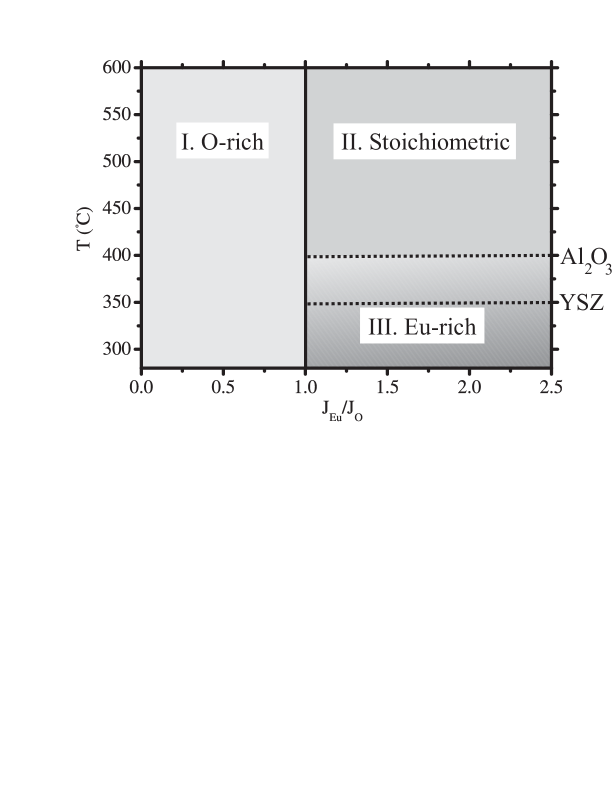
Based on our observations from photoemission, transport and RHEED, the types of resulting EuO1±x films at different growth conditions can be divided in three groups, as is sketched in figure 3.12. Let us summarize their properties. Films in region I, which are grown with show traces of Eu3+ in XPS (fig. 3.2(c)) in the studied temperature range. RHEED oscillations suggest that the growth of such films is limited by the Eu flux (fig. 3.6(e)), although the RHEED patterns are similar to those of films in region II. The films show a semiconductor-like resistivity. These signs are indicative of oxygen rich films. Region II represents films grown at temperatures greater than or equal to approximately 400∘C and with . No signs of Eu3+ are observed in these films by XPS (fig. 3.2(b)), showing that they are not oxygen rich. RHEED oscillations indicate that their growth was oxygen limited (fig. 3.6(c,d)) and sharp RHEED patterns are observed (fig. 3.5(a-d)). As the films still show a semiconducting temperature dependent resistivity without a metal-insulator transition and no spectral weight is detected near their Fermi level, they are not Eu-rich and are thus very close to stoichiometric. For films in region III, which are grown at lower substrate temperatures, (below C for polycrystalline films and below C for epitaxial films (dotted lines)), a metal-insulator transition is observed near the Curie temperature. Such films show less RHEED oscillations as the streaks in the RHEED pattern turn into spots after monolayers. A hexagonal RHEED pattern emerges which is not well understood. Spectral weight near the Fermi level is not well visible in XPS, but is can be observed by He-I UPS, which is more sensitive for the delocalized and electrons than XPS. These signs are indicative of Eu-rich films. The magnitude of the metal-insulator transition decreases upon decreasing the growth temperature, indicative of increased doping. This is shown by the color darkening in region III. As is indicated by equation (3.2) the doping concentration might also depend on the difference . We have not systematically studied this effect. In fact, the diagram in figure 3.12 has mainly been investigated for Eu fluxes of cm-2/s and might look different at higher or lower fluxes.
3.5 Conclusions
We have grown EuO films under varying conditions. We found a large range of growth parameters which resulted in stoichiometric films. The main conditions to obtain such films are a higher europium than oxygen flux and a high enough substrate temperature during growth. The films grow epitaxially on both YSZ and MgO substrates, with sharp RHEED and LEED patterns, structurally consistent with those of bulk EuO. Oscillations of the specularly reflected RHEED electron beam during the initial stages of growth on YSZ, indicate a layer by layer homogeneous growth, with a growth rate which is controlled by the oxygen pressure. On the basis of these observations we propose a mechanism of oxygen limited growth for the growth of stoichiometric EuO, where reevaporation of Eu avoids the formation of Eu-rich material. This mechanism facilitates the growth of stoichiometric EuO enormously, as it does not require accurate tuning of the europium and oxygen fluxes. It also simplifies the growth of slightly Eu-rich films, which are especially interesting for the colossal metal-insulator transition and high spin-polarization of the charge carriers in the ferromagnetic state [175]. We found that such films can be made by reducing the growth temperatures to a range at which slight amounts of Eu metal can accumulate at the surface, which might increase the probability of the incorporation of oxygen vacancies in the films. The transport properties of such films can thus easily be tuned by varying the growth temperatures or alternatively by heating the films after growth. Such accurate tuning of transport properties might prove essential for the application of ferromagnetic semiconductors as spin-injectors or spin-filters in semiconducting spintronics devices.
Chapter 4 Exchange splitting and charge carrier spin-polarization in EuO111P. G. Steeneken, L. H. Tjeng, I. Elfimov, G. A. Sawatzky, G. Ghiringhelli, N. B. Brookes and D.-J. Huang, Phys. Rev. Lett. 88, 047201 (2002).
High quality thin films of the ferromagnetic semiconductor EuO have been prepared and were studied using a new form of spin-resolved spectroscopy. We observed large changes in the electronic structure across the Curie and metal-insulator transition temperature. We found that these are caused by the exchange splitting of the conduction band in the ferromagnetic state, which is as large as 0.6 eV. We also present strong evidence that the bottom of the conduction band consists mainly of majority spins. This implies that doped charge carriers in EuO are practically fully spin polarized.
4.1 Introduction
EuO is a semiconductor with a band gap of about 1.2 eV and is one of the very rare ferromagnetic oxides [11, 10]. Its Curie temperature () is around 69 K and the crystal structure is rocksalt (fcc) with a lattice constant of 5.144 Å. Eu-rich EuO becomes metallic below and the metal-insulator transition (MIT) is spectacular: the resistivity drops by as much as 8 orders of magnitude [103, 99, 176]. Moreover, an applied magnetic field shifts the MIT temperature considerably, resulting in a colossal magnetoresistance (CMR) with changes in resistivity of up to 6 orders of magnitude [99, 176]. This CMR behavior in EuO is in fact more extreme than in the now much investigated La1-xSrxMnO3 materials [177, 178]. Much what is known about the basic electronic structure of EuO dates back to about 30 years ago and is based mainly on optical measurements [76, 67, 64] and band structure calculations [142]. With the properties being so spectacular, it is surprising that very little has been done so far to determine the electronic structure of EuO using more modern and direct methods like electron spectroscopies.
Here we introduce spin-resolved x-ray absorption spectroscopy, a new type of spin-resolved electron spectroscopy technique to study directly the conduction band of EuO where most of the effects related to the MIT and CMR are expected to show up. Spin-resolved measurements of the conduction band could previously only be obtained by spin-polarized inverse photoemission spectroscopy. Spin-resolved x-ray absorption spectroscopy is an alternative technique which is especially well suited to study ferromagnetic oxides, a currently interesting broad class of materials. Using this technique we observed large changes in the conduction band across and we were able to show experimentally that these are caused by an exchange splitting of the conduction band below . Moreover, we found that this splitting is as large as 0.6 eV and show that the states close to the bottom of the conduction band are almost fully spin-polarized, which is very interesting for basic research in the field of spintronics.
4.2 Experimental
The experiments were performed using the helical undulator [179] based beamline ID12B [180] at the European Synchrotron Radiation Facility (ESRF) in Grenoble. Photoemission and Auger spectra were recorded using a 140 mm mean radius hemispherical analyzer coupled to a mini-Mott 25 kV spin polarimeter [140]. The spin detector had an efficiency (Sherman function) of 17%, and the energy resolution of the electron analyzer was 0.7 eV. The photon energy resolution was set at 0.2 eV. The measurements were carried out at normal emission with respect to the sample surface and at an angle of incidence of the x-rays of 60∘. The sample was magnetized remanently in-plane using a pulsed magnetic coil, the magnetization direction was alternated to eliminate the effect of instrumental asymmetries [181]. The pressure of the spectrometer chamber was better than 1x10⁻¹⁰ mbar.
EuO samples with a film thickness of 200 Å were grown in situ by evaporating Eu metal from a Knudsen cell at a rate of 3 Å per minute in an oxygen atmosphere of 1x10⁻⁸ mbar on top of a Cr covered, chemically polished Al2O3 substrate kept at 280∘C. In a separate experiment in the Groningen laboratory, we have verified that this recipe provides us with high quality polycrystalline EuO films. Valence band and core level x-ray photoemission spectroscopy (XPS) show no detectable presence of Eu3+ ions, and ultra-violet photoemission experiments reveal that there is no detectable density of states at the Fermi level, demonstrating that we have indeed obtained nearly stoichiometric semiconducting EuO without detectable traces of Eu2O3, Eu3O4, or Eu metal. The left panel of figure 4.1 displays the magneto-optical Kerr-rotation as a function of temperature on our films using a He-Ne laser ( = 1.96 eV) and shows that these films have indeed the correct Tc of 69 K. The right panel of figure 4.1 depicts the resistivity of the films as a function of temperature, and it demonstrates clearly the presence of a metal-insulator transition at Tc. The very large change in resistivity, namely 5 orders in magnitude, indicates that the carrier concentration due to oxygen defects, i.e. the off-stoichiometry, is of the order of 0.3% or less [99].
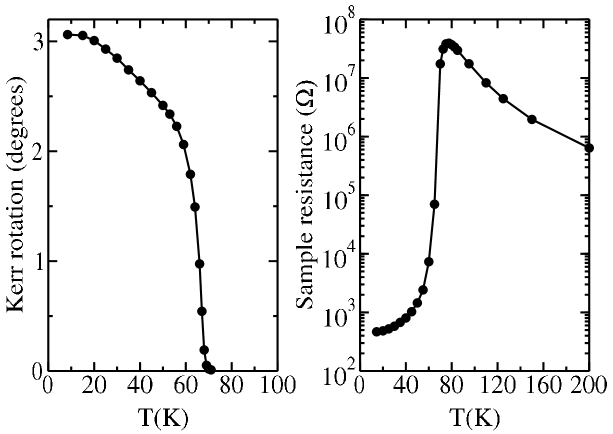
4.3 Results and Discussion
To study the conduction band of EuO, we use O edge x-ray absorption spectroscopy (XAS). This technique probes the O character of the conduction band, which is present because of the covalent mixing between the O and Eu - orbitals. Figure 4.2 displays the O XAS spectra, recorded by collecting the total electron yield (sample current) as a function of photon energy. Large changes over a wide energy range can be clearly seen between the spectra taken above and below Tc. The low temperature spectrum contains more structures and is generally also broader. We note that the spectra also show a very small feature at 529.7 eV photon energy, with a spectral weight of not more than 0.1% relative to the entire spectrum. Since the intensity of this feature is extremely sensitive to additional treatments of the sample surface it is probably related to surface states [98] or imperfections at the surface.
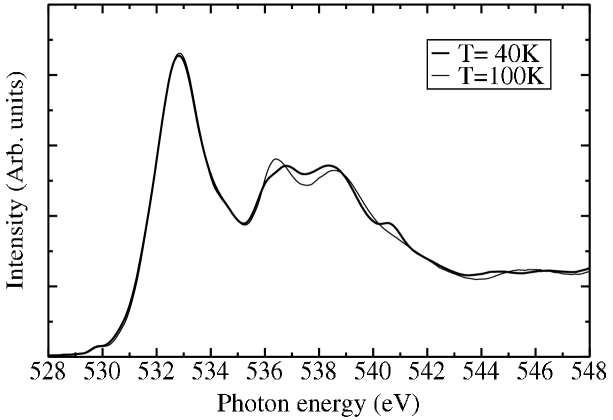
It is evident that the spectral changes across Tc cannot be explained by a phonon mechanism, since the changes involve more than a simple broadening, and above all, since the spectrum becomes broader upon temperature lowering. Because there are also no changes in the crystal structure across Tc, we attribute the spectral changes to the appearance of a spin-splitting in the Eu like conduction band below Tc. To prove this, we have to determine the spin-polarized unoccupied density of states. To this end, we measured the O XAS spectrum no longer in the total electron yield mode, but in a partial electron yield mode in which we monitor the O Auger peaks that emerge at a constant kinetic energy from the XAS process. By measuring the spin-polarization of this Auger signal while scanning the photon energy across the O edge, we can obtain the spin-resolved O XAS spectrum.
The underlying concept of this new type of experiment is illustrated in figure 4.3. This figure shows the O core level, the occupied O valence band and the unoccupied Eu - conduction band. Quotation marks indicate that due to covalent mixing the conduction band also has some O character and the valence band some Eu - character. This mixing allows an x-ray to excite an O electron to the conduction band, leaving a spin-polarized core hole if the conduction band is spin-polarized (middle panel of figure 4.3). The subsequent Auger decay of the XAS state leads to O() like final states [182], and the outgoing Auger electron will now also be spin-polarized (right panel of figure 4.3). Unique to a Auger decay is that the entire two-hole final states are of pure singlet ( and ) symmetry since the triplet transitions are forbidden by Auger selection rules [183, 184]. This implies that the O Auger electrons will have a degree of spin-polarization which is equal to that of the conduction band, but which has an opposite sign due to the singlet character of the Auger transition. Thus, the measurement of the spin of the O Auger electrons across the O edge will reflect the spin-polarization of the unoccupied conduction band states. We note that spin-resolved XAS is different from a magnetic circular dichroism (MCD) experiment. In the latter the helicity of the circularly-polarized light is varied and the dichroic signal contains a more convoluted information about the spin and the orbital moments of the unoccupied states [185]. We also note that the availability of EuO in thin film form is crucial for the measurement of spin-polarized electron spectroscopies because the remanent magnetic field created by the very small amount of material involved is negligibly small, and thus a perturbation of the trajectories of the emitted electrons can be avoided.

As an illustration, we show in figure 4.4 a small selection of the photoelectron spectra which we have taken from the EuO valence band and the O Auger as a function of photon energy at T=20 K. The left panel displays the unpolarized spectra while the right panel gives the difference spectra between the spin-up and spin-down channels (the spin-up direction is parallel to the magnetization direction). We can clearly distinguish the narrow Eu photoemission (PES) peak in the valence band spectrum [83, 90, 91], and observe that its spin-polarization is about 50%, indicating that the remanent magnetization of the EuO films at this temperature is only half of the saturation magnetization. This remanence is confirmed by analyzing the magnetic circular dichroism measurements at the Eu () photoabsorption edges and is comparable to magnetization measurements on EuO films [29].
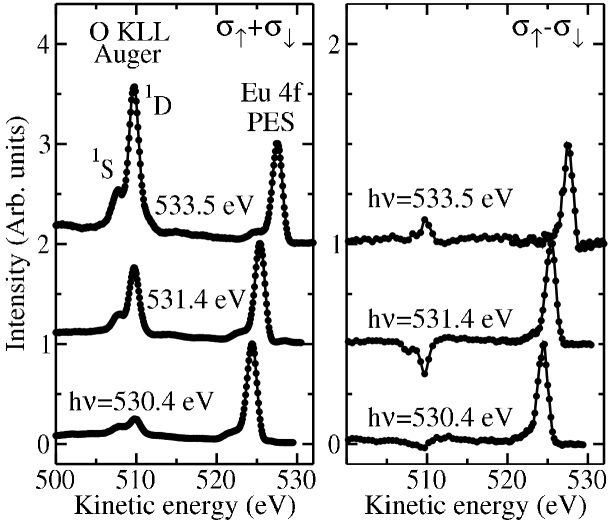
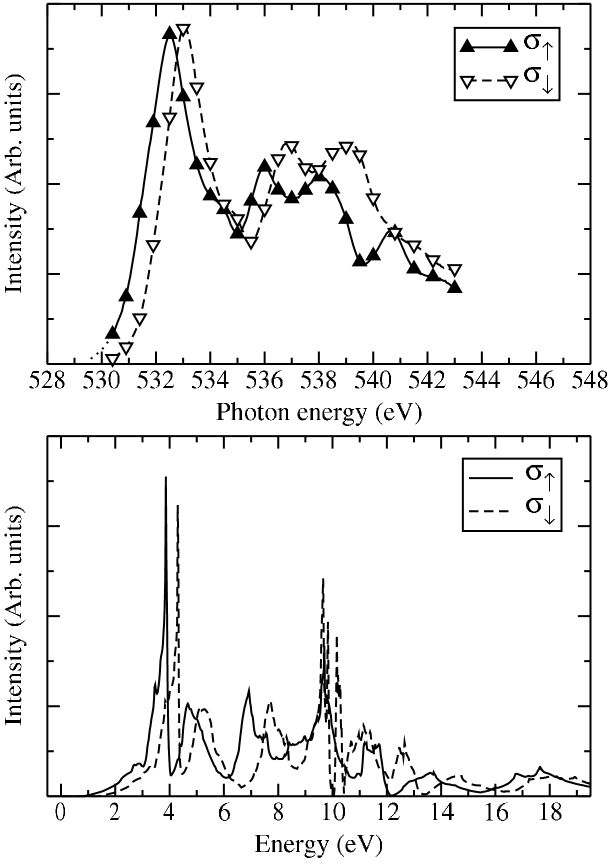
It is interesting to see the strong photon energy dependence of the magnitude and spin-difference of the O Auger. By measuring these spin-resolved O Auger spectra across the entire O edge region with closely spaced photon energy intervals, we can construct an accurate spin-resolved O XAS spectrum of EuO. The results are shown in the top panel of figure 4.5. Here a normalization for full sample magnetization has been made using the measured spin-polarization of the Eu . We observe an almost rigid splitting between the spin-up and spin-down peaks near the bottom of the conduction band, which is as large as 0.6 eV. Extrapolation of the data strongly suggests a very high spin-polarization at the bottom of the band. It is also interesting to note that the spin polarized features at 536.0 eV and 536.8 eV correspond with features in the low temperature XAS scan of figure 4.2 and that above Tc these peaks seem to merge into one feature at 536.4 eV, indicating that the changes in the density of states below Tc can indeed largely be attributed to a spin-splitting, which is a shift of the spin-up band to lower energy and the spin-down band to higher energy. However at higher energies the spin-behavior seems to be less simple: the spin-up feature at 540.7 eV, for example, does not seem to have a spin-down counterpart, possibly due to the near presence of the electron addition peak in the conduction band. To strengthen our understanding of the experimental findings, we have also carried out band structure calculations in the local spin density approximation including the on site Hubbard U (LSDA+U) [186] for EuO in the ferromagnetic state. The bottom panel of figure 4.5 displays the results for the spin-resolved unoccupied O partial density of states. The agreement between this mean-field theory and the experiment is remarkable: the approximate position and spin-splitting of most peaks is well reproduced, including the more intricate features that arise at about 10 eV above the Fermi level which are associated with the unoccupied 4 states. Recently we have become aware of calculations that obtain results similar to ours [97, 187]. When comparing XAS with band structure calculations it should be noted that the interaction between the core hole and the conduction band electron can in principle lead to exitonic effects in the XAS spectra. However these effects generally lead to sharp white lines which we do not observe here. Moreover because the core hole is on the oxygen atom while the conduction band consists of Eu orbitals, the interaction with an O 1 core hole is so small as compared to the 5 band width that its effect will be negligible. This conclusion is also based on a vast amount of data on the O edge XAS of transition metal oxides.
These experimental results clearly demonstrate that the large changes observed in the conduction band structure below Tc in figure 4.2 are caused by a spin-splitting. We attribute this splitting to the direct exchange interaction between the localized moments and the delocalized - conduction band states. We note that these measurements suggest that the red shift of the optical absorption edge is also due to this spin-splitting rather than to a broadening of the conduction band. These results support the following picture for the metal-insulator transition in Eu-rich EuO [103]. Above , defect or impurity states have their energy levels located slightly below the bottom of the conduction band, and the material behaves like a semiconductor: the resistivity decreases with increasing temperatures as a result of a thermal activation of the electrons from the defect states into the conduction band. Below , the conduction band splits due to the exchange interactions, and the defect states now fall into the conduction band. The electrons of these defects can then propagate in the spin-polarized bottom of the conduction band without needing any activation energy, and the system behaves like a metal. As we estimate the depolarization of the conduction band due to spin-orbit coupling ( = 0.067 eV) to be small (less than 5%), we expect the doped charge carriers in ferromagnetic EuO to be almost fully spin polarized, an observation that is very interesting for fundamental research projects in the field of spintronics.
4.4 Conclusions
To conclude, our experiments have revealed large changes in the conduction band states of EuO if the temperature is varied across . Using new spin-resolved measurements we have shown that these changes are caused by a splitting between the spin-up and spin-down unoccupied density of states. This exchange splitting is appreciable, about 0.6 eV. From this we conclude that electron doped EuO in the ferromagnetic state will have charge carriers with an almost 100% spin-polarization.
Chapter 5 Temperature-dependent exchange splitting in EuO
The temperature dependence of the x-ray absorption spectrum near the O edge in single crystals of the ferromagnetic semiconductor EuO is studied. Clear signatures of an exchange splitting proportional to the long range magnetic order are observed in the XAS spectra. This temperature dependence is very different from that of the optical absorption edge, which was generally believed to be a measure of the exchange splitting. The present results contradict this and lead to the conclusion that the temperature dependent exchange splitting of conduction band electrons in EuO is similar to that in Gd metal despite the different origin of the magnetic interactions in these materials.
5.1 Introduction
Since their discovery [49, 50] around 1960, the properties of ferromagnetic semiconductors have continuously fascinated scientists. The magnetic order in this class of compounds is induced by indirect and superexchange interactions [53] and is thus of a different origin than the itinerant electron ferromagnetism of the elemental ferromagnets. The transition to the magnetically ordered state is accompanied by large changes in transport and magneto-optical properties, which include colossal mageneto-resistance and a giant Kerr-effect. Moreover, a giant red-shift in the optical absorption edge is observed upon entering the ferromagnetic state of EuO [76]. This shift appeared to be a universal feature of ferromagnetic semiconductors [67, 64, 188, 189] and has been attributed to a splitting of the conduction band as a result of the exchange interactions between localized magnetic moments and conduction electrons. Remarkably this temperature dependent red-shift does not follow the long range order and part of the shift is even realized above the Curie temperature (see figure 1.6(a)). This part of the shift in the paramagnetic state has generally been ascribed to a splitting or lowering of the conduction band due to interactions between conduction band electrons and spin-fluctuations in the paramagnetic state [92, 93, 94, 10, 9, 12].
More recent developments in photo-electron spectroscopy techniques have allowed direct observation of the exchange splitting, a characteristic parameter in most models for ferromagnetism. During the last decades this has resulted in intensive efforts to measure the temperature dependence of this splitting in the elemental ferromagnets. These studies have shown that the temperature dependence of the Gd bands is well described by an exchange splitting which follows the long range magnetization [190, 191, 192, 193]. However more locally sensitive spectroscopies show that short range order induces a local exchange splitting which can persist even above Tc [194, 195]. For the elemental transition metal ferromagnets with their narrower bands the situation seems to be even more complicated, with an exchange splitting which persists in the paramagnetic state for some bands and collapses at Tc for others [196].
Although the ferromagnetic exchange interactions in stoichiometric EuO are not mediated by itinerant electrons like in Gd metal, but by virtual excitations of valence electrons [53, 10], similarities are still expected as in both materials the magnetic interactions which split the conduction band are mainly generated by the ferromagnetic alignment of the spins. However the strong differences between the temperature dependence of the red-shift in EuO and that of the exchange splitting in Gd metal seem to suggest otherwise.
To clarify this issue we present temperature dependent O x-ray absorption spectroscopy (XAS) data on single crystals of EuO. We show strong evidence that the exchange splitting of the Eu conduction band does follow the long range magnetic order. In contrast to optical absorption measurements we do not find evidence for a splitting above the Curie temperature. We discuss these results and point out important differences between the interpretation of data obtained with optical and x-ray photon energies.
5.2 Experimental
Stoichiometric single crystals of EuO were grown by a solution sintering process [16]. Measurements were performed using the Dragon beamline at the Synchrotron Radiation Research Center (SRRC) in Taiwan. The crystals were cleaved in situ after which x-ray absorption spectra were recorded in fluorescence yield mode. The resolution of the x-rays was 0.2 eV.
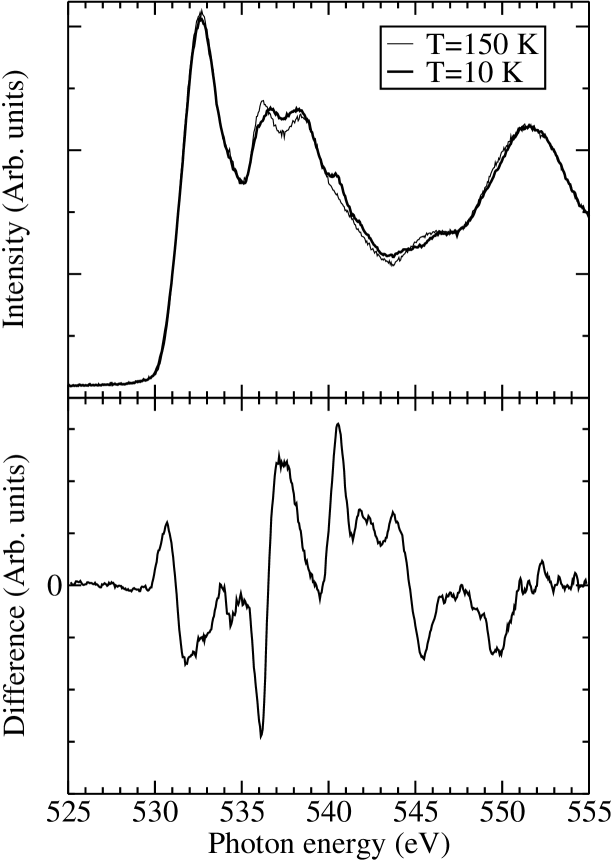
In the upper panel of figure 5.1 we show O XAS spectra taken above and below the Curie temperature (T K). This technique probes the O character of the conduction band, which is present as a result of covalent mixing between the O and Eu orbitals. The spectra are very similar to those observed on thin EuO films in total electron yield mode (compare with figure 4.2). However in fluorescence yield on single crystals the feature at 529.5 eV related to surface defects is absent, due to the lower surface sensitivity of this technique and possibly due to a higher stoichiometry of the single crystals. Clear changes are observed upon lowering the temperature. To highlight these changes, the difference spectrum is plotted in the lower panel of figure 5.1. Interestingly the maxima in the high temperature spectrum generally seem to coincide with the minima of the difference spectrum, indicative of a splitting or broadening of spectral weight. The feature at 536.2 eV which transforms into two peaks at low temperature strongly suggests that it concerns a splitting. The splitting may also be present in the main peak at 532.7 eV, but it is less obvious here due to the larger intrinsic width of this peak. Spin-resolved XAS measurements [175] indeed confirmed that these changes in the XAS spectrum are strongly related to a spin splitting of the spin-up and spin-down density of states due to the exchange interaction. On the other hand the peaks which appear in the ferromagnetic state between 540.0 and 543.0 eV do not follow this behavior and are probably related to changes in the unoccupied Eu density of states. Qualitative agreement was found between the x-ray absorption spectrum and the density of states as obtained by LSDA+U calculations (see figure 4.5). These calculations also showed that the exchange splitting depends on momentum and energy. To extract quantitative data on this splitting the bottom of the band is therefore preferable, as its density of states is not a sum of contributions from different energies or parts of the Brillouin zone.
5.3 Discussion
In the simplest mean field picture the exchange splitting can be described as follows. If is the unoccupied density of states of the conduction band in the absence of exchange interactions, the exchange interaction will lower the spin-up levels by an energy , while the spin-down states will be raised by the same amount. The total unoccupied density of states will thus become:
| (5.1) |
Therefore, in a one electron picture one expects the absorption spectrum to have a shape similar to if the electron is excited to the conduction band from a sharp energy level. As the valence band becomes spin-polarized in ferromagnetic state, optical spin-flip transitions are much less probable than spin-conserving transitions and the transition probabilities to the spin-up and spin-down bands are changing when the sample is magnetized111The reduction in the optical absorption peak energy in the ferromagnetic state (see figure 2.1), which is not expected from equation (5.1), might be related to this effect.. Also, excitonic effects can play an important role, as the excited electron can increase the exchange coupling between Eu atoms in the vicinity of the hole. This might lead to an increased local magnetization and exchange splitting inside the exciton and thus modify the position of the absorption edge. These considerations show that although the shift of the absorption edge strongly suggests the presence of exchange splitting it is not a very reliable measure of the size or temperature dependence of this splitting.
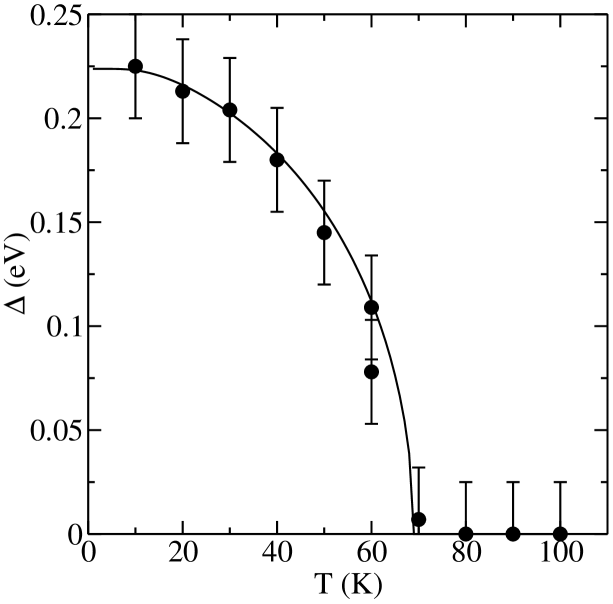
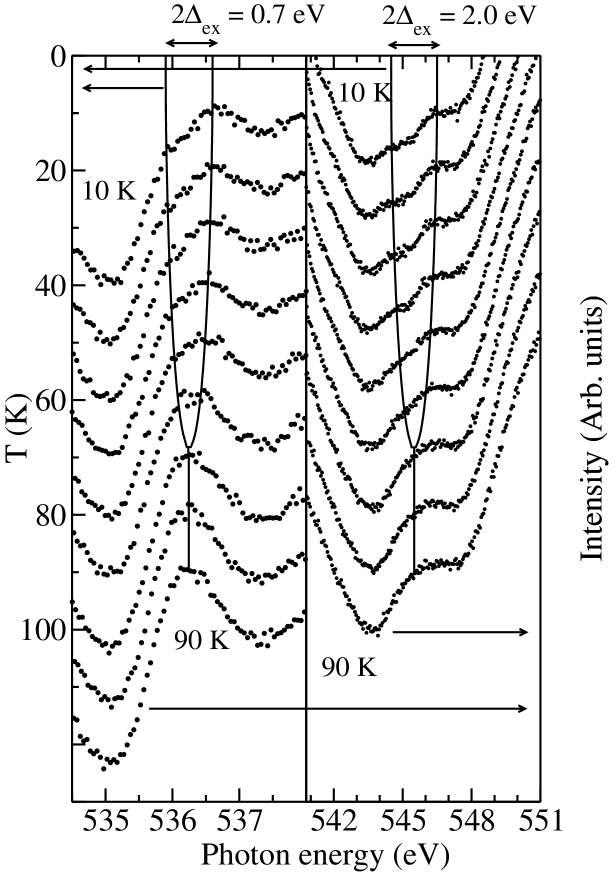
The interpretation of the O x-ray absorption spectrum is easier because it involves excitations from a dispersionless and spinless core-level. Therefore we expect that the XAS data should approximately follow equation (5.1). To obtain a quantitative estimate of the exchange splitting from the XAS data it is thus not sufficient to measure the edge shift as the measured shift will depend on the shape . A least squares fit of the various low temperature spectra was made in the photon energy region 529.0-534.7 eV using according to equation (5.1), with as the only fitting parameter and assumed equal to the XAS spectrum222A smoothed curve of the 150 K spectrum, which was obtained by fitting it with multiple Gaussians, was used for to eliminate smoothing effects when applying equation (5.1) to a discrete data set which contains statistical noise. at 150 K. Excellent fits were obtained in this energy region. To verify if a temperature independent center of gravity indeed resulted in the best fit we also fitted the spectra (in the same energy region) allowing an arbitrary energy shift in addition to the arbitrary splitting . For all spectra, best fits were obtained for shifts eV, very near to the shift of the center of gravity as expected. In figure 5.2 we show the fitted versus temperature. A maximum splitting of eV is found, which is somewhat smaller than the exchange splitting of eV found in the spin-polarized XAS measurements [175]. This smaller value might be due to statistical errors as a result of the fact that it is very difficult to resolve a splitting of two peaks which is smaller than their linewidth. However, the smaller value of the might also very well be a result of differences between the mean field assumption of above Tc and the actual random spin-orientation of local moments in the paramagnetic state, which can broaden the high-temperature peak with respect to the spin-polarized peak width in the ferromagnetic state (compare figures 5.1 and 4.5). In the same figure a solid curve is plotted with the shape of the spontaneous magnetization of a ferromagnet with T69 K as was obtained from solving the mean/molecular field model. The magnetization in EuO is known to follow such a mean field model to a very high accuracy (see figure 1.2 [31]). The exchange splitting as determined from the XAS data very nearly follows the calculated magnetization curve. Additional information on the exchange splitting in EuO was found by examining the temperature dependence of the split features at 536.2 eV and 545.5 eV, which are shown in figure 5.3. In the same figure solid lines split proportional to the mean field magnetization of a ferromagnet are shown. There is clear qualitative agreement between the observed peak position and that expected from a mean field model with an exchange splitting proportional to the long range order. A maximum splitting of eV is observed in the peak at 536.2 eV, corresponding well to an energy separation of the spin-polarized peaks of about 0.8 eV. The peak at 545.5 eV seems to show a maximum splitting of eV, which is remarkable as it is considerably larger than the splitting predicted by LSDA+U calculations. As we have not studied this structure with spin-polarized XAS it is unclear if these large changes are due to the separation of two spin-polarized bands, or if they are related to more intricate changes in the spectral weight as a result of the ferromagnetic ordering. The XAS data above suggest that the exchange splitting in the EuO conduction band follows the long range magnetic order, with a collapse into a single band at Tc. This is in remarkable contrast to the behavior of the optical absorption edge, which does not follow the long range magnetic order [67, 64], and already starts shifting in the paramagnetic state. This shift has been subject of many theoretical studies [10, 12, 93, 92, 94, 9]. Most effort focused on calculations of the changes in the quasiparticle energy due to dressing of conduction electrons by spin-fluctuations in the paramagnetic state of the ferromagnet. The shift of the optical absorption edge in the paramagnetic state could however have a different origin as the Coulomb attraction of the hole might localize the excited electron in an -like orbital with radius . Kasuya [7] suggested that the bottom of the absorption edge is formed by such a magnetic exciton. This suggestion was supported by the exponential shape of the absorption edge [67]. The radius of this exciton might very well be of the order of the lattice constant. In this case the exchange splitting of the electron will not depend on the long range order, but on the short range order within its radius. In fact it was shown that the shift of the absorption edge follows the nearest neighbor spin-correlation function , for and at nearest neighbor sites, quite closely [67, 64], thus suggesting that the excited electron is more sensitive to the short-range order than to the long-range order. Indications for a similar magnetic short-range ( 20 Å) order above Tc were found in Gd metal [194, 195].
Unlike the local optically excited exciton, excitonic effects are expected to be much smaller in O XAS with the final state hole on an oxygen atom. Although on-site excitations from a core-hole can lead to large excitonic effects, the conduction band of EuO consists mainly of Eu orbitals and the excited electron will therefore be effectively separated from the oxygen atom and thus have a much smaller Coulomb attraction to the core hole. The absence of a sharp exciton white line in the XAS spectra supports this conclusion.
5.4 Conclusions
In summary, we have investigated the conduction band of EuO by XAS. We did not find evidence for an onset of the splitting above Tc due to spin-fluctuations [10, 12, 93, 92, 94, 9]. This led us to suggest that the red-shift in the optical absorption is related to excitonic effects, as a result of which the absorption edge will follow the local order instead of the splitting experienced by conduction band electrons. In contrast to the temperature dependence of the absorption edge we found strong evidence that the temperature dependent exchange splitting in EuO follows the long-range order, similar to the exchange splitting in Gd metal.
Chapter 6 Strong O edge MCD in EuO
We have studied the magnetic circular dichroism (MCD) in the O edge x-ray absorption spectrum of EuO. We observed a remarkably large MCD signal on this ”non-magnetic” atom. As there is no spin-orbit splitting in the -shell, the MCD is a result of the spin-orbit coupling of the spin-polarized conduction band. In this chapter we consider several mechanisms that can account for this large O MCD signal and investigate its relation to the spin-polarization of the conduction band.
6.1 Introduction
Magneto-optical effects have been known to exist for a long time [197]. However, in the last decades a surge in the interest for materials with large magneto-optical properties has occurred. This surge was driven by technological interest for magneto-optical recording media, and by large developments in synchrotron technology, allowing the study of magnetic materials with x-ray magnetic circular dichroism (XMCD) measurements [198, 199] following predictions by Erskine and Stern [200] and Thole et al. [201]. This technique is extremely useful as it yields element-specific information on the magnetization state of atoms in a compound. It especially gives large signals when transitions are made between orbitals on the same atom for which at least one orbital involved has a large spin-orbit coupling. As the XMCD signals are generally largest for transitions from spin-orbit split core levels to partially filled or orbitals, most research has focussed on transition metal and rare earth metal compounds. Measurements on the Fe edge have shown that transitions from an -orbital result in a much smaller MCD signal that is related to the spin-polarization of the conduction band [198, 202]. Moreover, it was found that such measurements are also sensitive to the magnetic moment of neighboring atoms [203]. XMCD measurements at the oxygen edge of La1-xSrxMnO3 and at the sulfur edge of EuS have shown that strong MCD signals can also be detected at edges of ”non-magnetic” atoms [204, 205].
Here we present MCD measurements near the O edge of EuO. A relatively large MCD signal is found on this ”non-magnetic” atom, of similar magnitude as the MCD at the iron edge. We propose three possible effects that could account for this MCD: the combination of spin-orbit and exchange interactions on the atomic final states, a Fano-like effect, and the splitting of orbital moments in the O orbital as a result of the hybridization with the exchange and spin-orbit split Eu orbitals. We find that the first two effects will result in an MCD which is approximately proportional to the spin-polarization of the conduction band, whereas the third effect results in a more convoluted relation between momentum, spin and orbital moments. The measured MCD spectrum is compared to calculations.
Polycrystalline EuO films with a thickness of 200 Å were grown in situ as described in chapter 4. X-ray absorption spectra where recorded in total electron yield mode with a photon resolution of 0.2 eV. A photon beam with a circular polarization of 92% reached the sample at an angle of incidence 60∘ with respect to the surface normal. The sample was remanently magnetized by a pulsed magnetic coil. The magnetization direction was in the film plane and in the plane of the light’s Poynting vector. Both the magnetization direction and the circular polarization of the light were alternated to measure the absorption coefficient for photon helicities parallel () and antiparallel () to the magnetization.
In general spin-orbit interactions are very weak for the outer electrons of light atoms as their strength scales approximately as , where is the atomic number and the principal quantum number. Although the conduction band of EuO has a strong spin-polarization which is almost 100% near the bottom of the band [175], the spin-orbit coupling effects in the O band are small. As the O orbitals hybridize strongly with the Eu orbitals, interaction with the heavy Eu nuclei might provide an increased spin-orbit coupling on oxygen, clarifying the size of the MCD. To our knowledge the spin-orbit splitting of states on a light atom due to relativistic interactions with neighboring atoms has not been theoretically investigated. Although spin-orbit coupling effects can be incorporated in relativistic LDA calculations [206, 207], such calculations have not yet been performed for the O edge of EuO or similar materials. Let us therefore continue to discuss several mechanisms that could be responsible for the relatively large MCD at the edge of EuO.
6.2 Atomic O final state with and
Let us first consider the simple case of an atomic -electron which experiences an exchange interaction with neighboring spins and an effective spin-orbit interaction . If we treat the exchange interactions in the mean field approximation, the Hamiltonian is given by:
| (6.1) |
As only commutes with , only the total angular momentum is conserved. The spin-orbit coupling splits both exchange split levels into 3 levels. The normalized wavefunctions for the ’spin-up’ levels in terms of -orbitals are given by:
| (6.2) | |||||
| , |
Where . The energy of is and that of is . For this gives a level splitting of which is probably too small to be resolved in our XMCD measurements. From Fermi’s Golden Rule we obtain that the total -’spin-up’ transition rates for circularly polarized light with are . For small we thus expect that the normalized MCD signal . For the ’spin-down’ levels the MCD signal is of equal magnitude but of reversed sign, resulting in a zero integrated MCD signal. The transition rates and energy levels for this simple model are schematically drawn in figure 6.1.

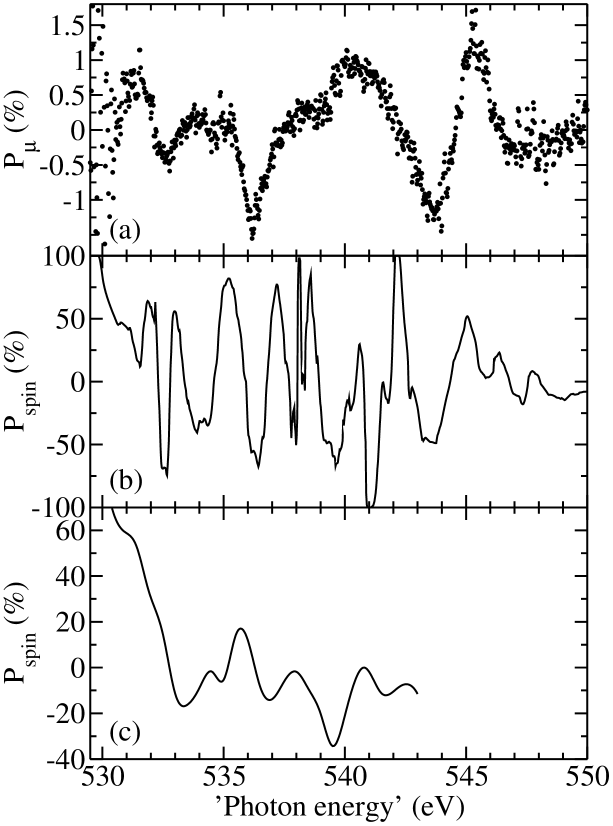
In EuO the empty oxygen orbitals form a band which has an energy dependent spin-polarization [175] as a result of the exchange interactions with the spin-polarized electrons via hybridization with the orbitals. Let us assume that the effect of the spin-orbit coupling on the levels is well described by the atomic situation above. As the MCD signal is positive for ’spin-up’ levels and negative for ’spin-down’ levels, the intensity of the normalized atomic MCD signal obtained above should be multiplied by the spin-polarization of the density of states . Thus we expect .
To compare this simple model to our measurements we show in figure 6.2(a) the normalized MCD spectrum on the O edge of EuO. The spectrum is corrected for the circular polarization of the light and for the angle between the magnetization and the incident light beam. A remarkably large and structured MCD signal is observed which is even larger than that at the edge in iron metal [198]. For comparison we show the spin-polarization of the O partial density of states as calculated by LDA+U and as measured by spin-polarized XAS [175] in figures 6.2(b) and (c). The top of the valence band in the calculated spectra has been aligned at a photon energy of 528.5 eV. The peak energies and signs of the MCD agree quite nicely with the calculated and measured spin-polarizations. Only in the region around 540 eV the MCD sign is clearly opposite to that of the spin-polarization. This is possibly related to the fact that the XAS effects in this energy region are complicated by the empty Eu orbitals. The ratio at the peak positions varies between approximately 0.008 and 0.025. Using eV and we find that the effective spin-orbit coupling of the empty states meV which seems too large to be accounted for by the atomic meV [208]. Moreover we note that although the peak positions and signs qualitatively follow , the quantitative agreement is rather poor, showing that the model is too simple to fully capture the relativistic effects. Therefore let us explore alternative mechanisms.
6.3 Description in terms of Fano effect
An approach adopted by Schütz et al. [198, 202], to explain the edge MCD on iron is to use a two step model in which one first obtains the effective spin-polarization of the excited electron by considering the transition from the -orbital of an atom to spherically symmetric continuum states with and 3/2. As was shown by Fano [209], the spin-orbit coupling affects the radial part of the continuum wave functions and thus yields different transition rates to the and 3/2 continuum states. Additionally, an electron which has its spin parallel to the photon’s angular momentum, will end up in a final state, whereas an electron of opposite spin can both have a or excited state. The combination of these effects will lead to a spin-polarization of the continuum electrons parallel to the angular momentum of the light111The Fano effect from orbitals with or on magnetic atoms is more involved [210, 211] and has recently been used to explain our circularly polarized spin-resolved photoemission measurements on Cu and Ag metal [128].. In the second step the transition rate of these polarized continuum electrons to a spin-polarized conduction band state will depend on their spin and thus on the circular polarization of the light. Therefore the resulting MCD spectrum will approximately follow the spin-polarization of the conduction band. It is difficult to estimate if the magnitude of the MCD caused by the Fano effect is sufficient to explain the observed MCD. However, it cannot be excluded that the mixing of the orbital and spin moments and as a result of spin-orbit coupling and exchange splitting, which was described in the previous section, gives an at least as important contribution to the MCD signal.
6.4 Hybridization via Eu
From Cowan [208] (pp. 238 and 588) we find that the atomic spin orbit coupling parameter for the oxygen orbitals 43 meV whereas 67 meV for the Eu orbitals [212]. However, as the oxygen holes only exist as a result of hybridization with the Eu orbitals, they have a strong character. Instead of using an atomic spin-orbit parameter , like in section 6.2, we consider the possibility that the MCD is dominated by in this section. To estimate these effects, we have performed a Linear Combination of Atomic Orbitals (LCAO) calculation [213], including exchange splitting and spin-orbit coupling. Eu , Eu and O orbitals were taken into account. The orbitals are very localized, and it is thus reasonable to neglect their effect. Only nearest neighbor Eu-Eu and Eu-O integrals were considered.

ss pp dd dd dd sp pd pd Dq 5.25 4.31 0.2 0.4 0.2 0.2 0.39
First we obtained the two-center integrals by fitting the LCAO band structure without exchange and spin-orbit coupling to an LDA () calculation by Elfimov, which included also the Eu and and the O and orbitals. The resulting fit is shown in figure 6.3. In the fit the integrals sd, pp and dd were kept zero and the ratios pd/pd and dd/dd were kept at respectively and as given by Harrison [214]. The crystal field splitting 10Dq was fitted at 3.9 eV, which is somewhat larger than the value of 3.1 eV found from optical measurements of EuO by Güntherodt [75]. The values of the fit parameters are tabulated in table 6.1. To get a reasonable dispersion of the orbitals near the -point (G), we had to increase the value of dd integral between the orbitals. Possibly this is due to the deformation of the orbitals by the oxygen charge which pushes the orbitals away from the Eu-O axis resulting in a larger Eu-Eu overlap. Pen [215] similarly found that the bands could not be fitted well by a LCAO model in LiVO2.
The spin-orbit coupling Hamiltonian which is required to include the relativistic effects can also be written as:
| (6.3) |
By transforming the d-orbitals to eigenstates of and we find the following spin orbit and exchange Hamiltonian in terms of the basis used for the LCAO calculation:
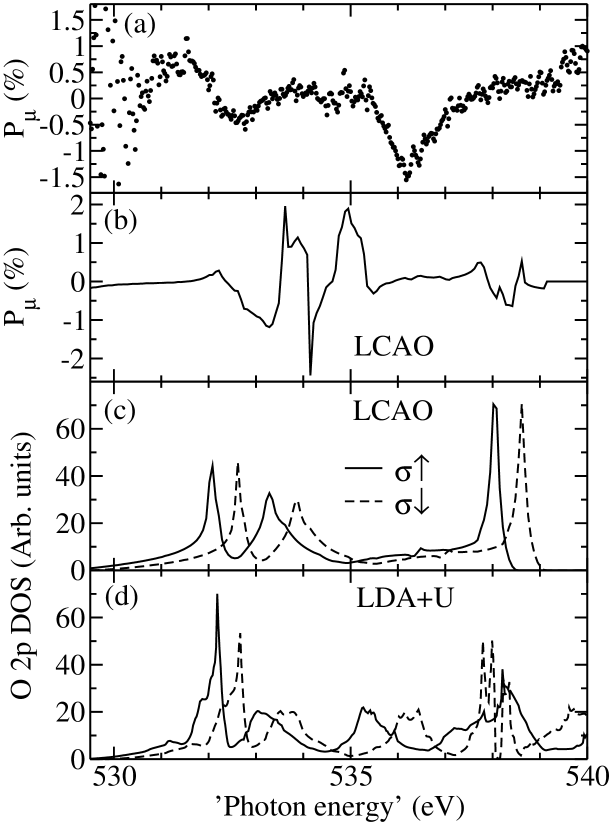
When this Hamiltonian is added to the LCAO program, the spin-up and spin-down oxygen states are mixed via the O-Eu hybridization and the spin-orbit coupling of the Eu . This will induce an effective spin-orbit coupling on the oxygen atoms and will therefore lead to a edge oxygen MCD even though the atomic spin-orbit coupling on oxygen is still assumed to be zero. By projecting the LCAO eigenvectors on the localized atomic wavefunctions we obtain the partial oxygen density of states for . The energy dependent oxygen MCD can thus be obtained by summing the following expression over the Brillouin zone:
| (6.4) |
Thus we calculated the normalized MCD using =15 meV and = 0.3 eV. The results are shown in figure 6.4. Although there is some qualitative correspondence between the measured and calculated energy dependent MCD in figures 6.4(a) and (b), it is not very convincing. The calculated O density of states from LCAO in figure 6.4(c) follows the LDA+U calculation in figure 6.4(d) quite well up to 535 eV, however the correspondence above this energy is worse and the calculated MCD above 535 eV should therefore not be relied on. Although the agreement between calculated and measured MCD is weak, we can draw the following conclusions from this calculation:
- •
-
•
A small spin-orbit coupling constant of only 15 meV in combination with strong hybridization and exchange splitting can induce a large effective spin-orbit coupling and edge MCD on neighboring atoms.
The LCAO calculations in this section do not take into account the momentum dependence of the exchange splitting and spin-orbit coupling. This might explain why the agreement between the measured and calculated spectra is not optimal. More sophisticated LMTO methods including relativistic effects [206, 207] could probably improve this.
6.5 Conclusions
In addition to the Fano effect, which is the result of a modification of the radial wavefunction by the spin-orbit coupling and was previously held responsible for the edge MCD in iron [198, 202], we have shown two alternative mechanisms which might lead to edge MCD. In the first mechanism the combination of exchange interactions and spin-orbit coupling leads to a mixing of spin-states, which can result in a MCD of . A more intricate effect is the induction of MCD by spin-orbit coupling on a neighbor atom, which can lead to an appreciable MCD effect with an energy dependence which does not follow the spin-polarization of the conduction band. These different mechanisms were compared to the remarkably high MCD signal observed at the O edge of EuO. The MCD spectrum seemed to follow the spin-polarization to a reasonable extent. However, the oxygen is probably too small to fully account for the observed MCD intensity. Therefore a significant contribution as a result of hybridization with Eu might also be present. For a complete understanding of MCD at edges of magnetic compounds all three effects should generally be considered.
Chapter 7 Transport properties of EuO thin films
We present magnetoresistance and photoconductivity measurements on thin films of Eu-rich EuO. The data are compared to a model in which changes in the free carrier concentration are due to overlap and thermal excitations between vacancy levels and the Eu conduction band. We show that the exchange splitting of the conduction band can account for the large increase in the free carrier concentration and corresponding insulator-metal transition that is observed upon entering the ferromagnetic state. Interestingly we find that the magnetoresistance shows a universal scaling with magnetization in excellent agreement with the model. Similar behavior in La0.7Ca0.3MnO3 and EuB6 seems to indicate that such scaling is an intrinsic property of colossal magnetoresistance (CMR) materials. Moreover a metal-insulator transition is observed in the photoconductivity of EuO. It is argued that this transition in the photoconductivity can be understood by electron-hole separation of excitonic electron-hole pairs in the ferromagnetic state.
7.1 Introduction
Soon after the discovery of ferromagnetism in the europium chalcenogides [50], it was found that these compounds exhibited spectacular transport properties with huge metal-insulator transitions (MIT) and colossal magnetoresistance (CMR) effects around the Curie temperature [216, 217, 218]. The explanation of these effects is of much interest as there appears to be a large class of ferromagnetic materials with similar transport properties among which are the manganites [105], (Hg,Cd)Cr2Se4 [106], EuB6 [107] and diluted ferromagnetic semiconductors like Ga1-xMnxAs [108]. The europium chalcenogides are model compounds for the study of colossal magnetoresistance behavior, as their structure is very simple and because there is a considerable doping range in which their magnetic properties do not depend strongly on doping. Besides this, they show the largest CMR effects of all these compounds. Despite these favorable conditions the transport properties of the doped Eu chalcenogides have been very difficult to understand and a large number of mechanisms has been proposed to explain these effects.
Early studies [219, 3] have attributed the resistivity anomaly near Tc to scattering due to spin-fluctuations. Magnetic scattering was predicted to result in a maximum resistivity near the Curie temperature [220, 221, 94] which was indeed observed in several rare-earth metals at their magnetic ordering temperature [222, 169, 223]. Optical absorption measurements on EuO indicated that the scattering rate indeed changes by about 1 order of magnitude across the Curie temperature [103]. Hall effect measurements [99] show a similar change in the mobility, although interpretations are complicated by the anomalous Hall effect. These results indicate that a reduction of the electron mobility due to magnetic scattering indeed provides a considerable contribution to the metal-insulator transition in EuO. However the scattering rate is not expected to depend strongly on doping concentration and is thus not expected to be much larger in EuO than in Gd metal. Therefore, it seems unlikely that magnetic scattering is responsible for the size of the metal-insulator transition which can span as many as 13 orders of magnitude [100] (see figure 1.10(e)).
The metal-insulator transition is not observed in stoichiometric EuO but only in Eu-rich EuO, in which oxygen vacancies provide electron doping [103, 15]. This strong doping dependence of the MIT soon resulted in a general acceptance of the notion that the metal-insulator transition is mainly due to the delocalization of trapped electrons at oxygen vacancies as a result of changes in the magnetic structure. This notion was supported by the strong increase in the free carrier density in the ferromagnetic state found by optical [103], Hall effect [99] and Seebeck effect [224] measurements. Several mechanisms have been proposed to explain this delocalization. Some authors have attributed it to the exchange splitting of the conduction band edge (which was observed in optics [76, 67] and x-ray absorption [175]) with respect to a fixed vacancy level in the gap [225, 103, 226]. They argued that when the conduction band crosses the vacancy level, the vacancy electrons will delocalize in the conduction band. As the oxygen vacancies can bind two electrons, this model is usually called the He-model.
Most authors have related the metal-insulator transition to the properties of bound magnetic polarons (BMP) [4, 227, 228, 65, 229, 230, 231, 232, 10, 233]. A BMP consist of an oxygen vacancy or doped impurity ion which binds electrons by its Coulomb potential. These electrons will increase the ferromagnetic coupling of the surrounding Eu moments via indirect exchange. The resulting increased local magnetization will enhance the binding energy of the electron to the vacancy site. The metal-insulator transition was attributed to the occurrence of a Mott [229, 230, 233] or Anderson [4, 231, 10] transition of the randomly distributed bound magnetic polarons upon magnetic ordering.
As the attempts to quantitatively compare these models to transport experiments have been rather limited [103, 226, 232], it is still unresolved which of the proposed mechanisms describes the properties of doped Eu chalcogenides most accurately. In this paper we will consider the BMP and He-model models, and investigate the effects of doping on these models. We will try to make a quantitative estimate of the resistivity and compare it to resistance and magnetoresistance measurements on Eu-rich EuO films. We discuss similarities with other CMR compounds. Finally the photoconductivity of the films is discussed.
7.2 Theory
7.2.1 The vacancy levels: BMP and He-model
As Eu atoms are too large to be incorporated in the lattice as interstitials, it is generally believed that Eu-rich EuO contains oxygen vacancies. Because the characteristics of the metal-insulator transition depend strongly on the concentration of oxygen vacancies, it is very likely that it originates from the delocalization of electrons captured by the positive effective charge at the vacancy sites. Infrared, Hall and Seebeck measurements [103, 99, 224] indeed indicated a large increase in the carrier density in the metallic state. Before considering the delocalization of electrons from the vacancy sites in the ferromagnetic phase, it is important to know in what electronic state they are in the paramagnetic phase. Oliver et al. [103] proposed that the two vacancy electrons form a singlet which derives its binding energy mainly from the Coulomb attraction ( eV) of the vacancy. Mauger [232, 234] proposed a completely different approach, in which the vacancy electrons are mainly bound by the local magnetization which is induced as a result of their exchange interactions ( 0.3 eV) with the surrounding Eu moments. The electrons are thus bound in a BMP up to temperatures which can exceed room temperature. The Coulomb attraction in this model is assumed to be very small ( meV). Moreover the spin-polarization inside the polaron is assumed to remain 100%, a point that is certainly questionable [235]. Although not much experimental evidence exists for polarons which are stable up to room temperature, the polaron could theoretically be stable as long as the contribution of the exchange interaction ( eV) to the free energy exceeds that of the magnetic entropy of the Eu local moments in the polaron. For a polaron consisting of an octahedron of 6 Eu moments neighboring an oxygen vacancy the magnetic contribution to the free energy can be estimated as
| (7.1) |
Therefore in the paramagnetic state, in the absence of a magnetic field, the effective stabilization energy of a polaron is approximately given by:
| (7.2) |
Where and are the exchange splitting in the polaron and the long-range exchange splitting. Thus in this simple approximation the polaron will remain magnetized up to a temperature of T K.
Several experimental efforts have been made to distinguish between the BMP and He-model. As was argued by Torrance et al. [65], the fact that the Curie temperature of doped EuO can be higher than that of undoped EuO seems to favor a BMP model. Because if the vacancy electrons are in a triplet configuration, their energy is lowered by the polarization of the cluster of surrounding Eu2+ spins. The formation of such ferromagnetic clusters would result in an increased Curie temperature. On the contrary, if the electrons at the vacancy site are in a singlet state, like in the He-model, the ferromagnetic arrangement of the surrounding moments is not favored by their presence.
Instead one can however also argue that the increased Curie temperature in EuO is solely caused by increased exchange via delocalized electrons. In fact, the Curie temperature is only significantly higher in samples which have a relatively high conductivity and thus a large concentration of free electrons. Thus the He-model can not be excluded by Torrance’s argument.
In essence, electron spin or paramagnetic resonance (ESR or EPR) measurements are sensitive for the difference between a diamagnetic or paramagnetic configuration of the vacancy electrons. However the high density of paramagnetic Eu local moments and the large exchange interaction between the doped electrons and these moments, precludes the observation of resonances related to the vacancy or conduction electrons [236, 25]. Instead only an EPR of the Eu2+ ions is observed and the effect of doping is to change the -factor (only 1 or 2% [102]) and line width (almost 50% [25]) of the resonance as a result of an increased exchange coupling. Such exchange narrowing effects [237, 238] were indeed observed [25, 224, 236], and do not allow to distinguish between BMP or He-model.
7.2.2 Effect of magnetization
Oliver et al. first realized [225] the influence of the exchange splitting of the conduction band edge on the transport properties of EuO. First a model was proposed in which the vacancy level was fixed, later [103] it was correctly realized that the electrons in the vacancy level could also be exchange split by a certain energy. Recently, LDA+U calculations [56] of EuO containing oxygen vacancies have confirmed that the impurity level associated with an oxygen vacancy in EuO is indeed exchange split. The total exchange splitting of the vacancy level was found to be comparable to that of the conduction band edge in these calculations. Temperature dependent XAS measurements have suggested (see chapter 5) that the conduction band exchange splitting follows the long-range order and starts at the Curie temperature Tc. The onset of the vacancy level exchange splitting might occur at a higher temperature Tp, as the ferromagnetic coupling around the vacancy is enhanced by the indirect exchange via the vacancy electrons, thus forming a bound magnetic polaron. Mauger suggested that this effect is so large that Tp is larger than room temperature and the reduction of the electron binding energy in the ferromagnetic state is mainly due to the reduced difference between the polaron and long-range exchange splitting and , like in equation (7.2).

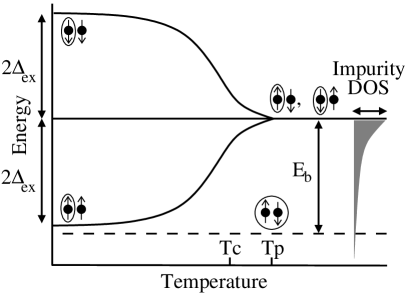
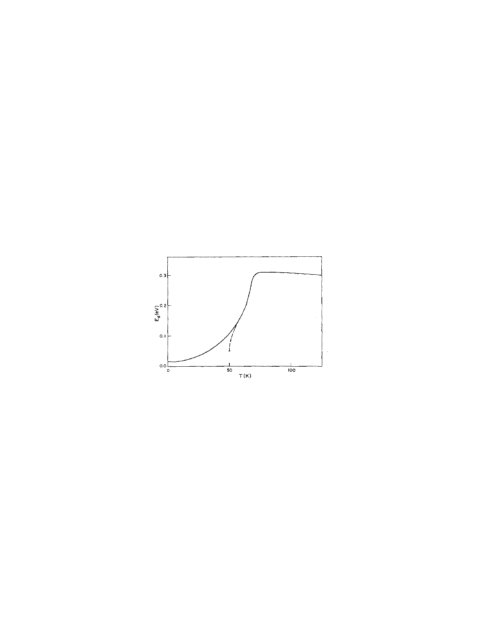
In figure 7.1(a) the temperature dependence of the one electron energy levels in the He-model is schematically depicted. Shown are the conduction band edge and the impurity level, both of which are exchange split . When the magnetization increases, the spin-down vacancy level approaches the spin-up conduction band edge and the binding energy of the spin-down vacancy electron decreases111The magnetization direction is parallel to the spin-up spins.. This exchange splitting of the vacancy results in an approach rate which is twice as high as in the model for which the vacancy level is fixed [225]. In figure 7.1(b) we show the variation of the total energy levels for configurations with two electrons in the vacancy level (dashed line) and with one electron ionized in the conduction band (solid lines). Coulomb interactions between the two electrons in the vacancy are neglected. Clearly, the ionization energy of the vacancy singlet strongly reduces upon magnetization. In figure 7.1(c) the polaron binding energy as calculated by Mauger is shown which follows approximately equation (7.2) with proportional to the magnetization.
Despite the different assumptions of the models of Oliver and Mauger, reasonable agreement with experimental transport measurements was obtained by both [103, 226, 232]. This is largely due to the fact that the resulting temperature dependent binding energy of the electrons is similar as can be seen by comparing figures 7.1(b) and 7.1(c). It should be noted that the He-model can only lead to a metal-insulator transition if both the spin-up and the spin-down band contain an electron. This is only the case if the impurity potential is large enough to bind two electrons222The He-model can thus not account for the metal-insulator transition in Gd3+ or photo-doped materials if the exchange splitting at the impurity site is equal to the long range splitting. If the exchange splitting at the impurity site is smaller than the long range splitting, the He-model might however still be valid as the binding energy of the vacancy electrons would still be reduced upon magnetization (see [103])., moreover these electrons have to be in a singlet state, which will only be the case if the ground-state is non-degenerate. In fact, if the vacancy ground state is indeed non-degenerate, the BMP model of Mauger, with a low Coulomb potential at the vacancy site, cannot account for the metal-insulator transition, as the formation of the BMP will then result in one exchange-bound electron, but will repel the electron with opposite spin, thus leading to a delocalization of half of the donor electrons when the BMP is formed, which can be K according to equation (7.2). If the ground state, on the other hand, is degenerate, both electrons will occupy a spin-up state, as this will reduce their exchange energy with the electrons and with each other.
7.2.3 Lowest energy levels of an oxygen vacancy
Thus to check wether the He-model or the BMP model is most applicable to the metal-insulator transition in Eu-rich EuO, one should know what are the lowest energy levels in an oxygen vacancy as this will determine whether the two electrons in the vacancy level are in a singlet or triplet state. In this section we will try to estimate the lowest energy levels by a cluster calculation of the oxygen vacancy states. For this purpose, we assumed that the wave function of the vacancy electron is well described by a superposition of -orbitals on the octahedron of six neighboring Eu atoms at sites ,,. The LCAO Hamiltonian [213] of this cluster was then constructed from the nearest neighbor two-center integrals between the orbitals333See Harrison [214] figure 19-4 for a diagram of the dd, dd and dd two-center integrals, and [214] table 20-1 or [213] table I for their relation to the interatomic energy matrix elements., including the Hamiltonian of the D4h crystal field444The Oh symmetry is broken by the missing oxygen atom.. Next to the oxygen vacancy, the crystal field for the -orbitals on the Eu atom at is given by:
| (7.3) | |||||
It can be shown by a derivation similar to that given in [156] and using equations for from [208], that in the case of a missing point charge: and , where is the Eu-O distance, the Bohr radius and is the effective charge of the Eu2+. Using the ionization energy of the electron of lutetium we estimated and assumed hydrogenic wavefunctions.
The 30 Hamiltonian was diagonalized, with 555As suggested by Harrison [214].. Two different ground states were found for and :
| (7.4) | |||||
Here, the basis functions are designated by the type of -wavefunction and the site at which they are located, e.g. is an orbital at the Eu atom next to the vacancy in the direction. When both the dd and dd two-center integrals are non-zero the wavefunctions mix, however the lowest energy states still have mainly and character with the same degeneracy as before. Therefore we will keep designating them by and . The condition that determines which is the lowest state is still very well approximated by . As Harrison [214] gives this strongly indicates that the lowest energy level is non-degenerate as the calculation shows that a degenerate ground state only exists for . If we calculate the ground state energies with respect to the center of the band including crystal field and using the parameters of table 6.1 and equation (7.3), we find a splitting between degenerate and non-degenerate ground states of 0.37 eV with eV and eV. Increasing reduces the splitting, e.g. setting eV, we find eV and eV, if we instead set the splitting increases, eV and eV. In this treatment, we have not taken into account that the orbitals will be deformed by the attractive potential of the vacancy. This might significantly increase the two-center integrals and therefore the splitting between the lowest energy states. If we take the normal crystal field and for example double the two center-integrals to eV and eV, we find a splitting of 0.68 eV with eV and eV.
This analysis indicates that the ground state of the oxygen vacancy is probably a singlet and that the energy splitting with the first excited state seems to be larger than , and is possibly even larger than , thus supporting the He-model. Moreover, the lowest energy conduction band states at the point in the EuO band structure have strong Eu character (see figure 6.3), which will could also stabilize a singlet state. Recent LDA+U calculations [242] of CaO with oxygen vacancies have found that the lowest energy vacancy orbital had a non-degenerate -like character which was 0.7 eV below the first degenerate state, presenting additional support for the singlet picture. However, up to now we have neglected the Coulomb and Hund’s rule exchange interactions between the two electrons in the vacancy, which would favor the triplet state. These electron-electron interactions might thus also result in a triplet ground state, although an exact solution of this problem is difficult. Therefore, as long as no more accurate experimental or theoretical estimates for the singlet-triplet splitting are found, the issue of the lowest energy ground state in the oxygen vacancy will remain unsolved.
In the rest of this section we choose to discuss the metal-insulator transition in EuO along the lines of the He-model. We want to emphasize that this choice is not based on our conviction that this is the correct model, as in our opinion there is still too much uncertainty as to the origin of the metal-insulator transition to make such a decision. However, Mauger [232] has shown that reasonable agreement with experiment can be obtained from the BMP model. We will take a different starting point and also come to close agreement with experiment. We note that, our derivation would be similarly applicable to the case of the BMP, as the temperature dependent binding energy of the vacancy electrons is almost the same for both models (compare figures 7.1(b) and 7.1(c)). The analysis could therefore be more generally applicable to any model in which the binding energy of vacancies varies (approximately) proportional to the magnetization, although the numerical estimates will be different.
7.2.4 The binding energy of vacancy levels
The high temperature conductivity of Eu-rich EuO shows an activated behavior with eV [65]. If the vacancy electrons have a binding energy of with respect to the bottom () of a parabolic conduction band with a density of states [34] , the density of conduction band electrons is obtained from the equilibrium rate equation:
| (7.5) |
Here is the transition probability, the effective electron mass, the density of vacancy states (number of vacancies is as each vacancy can contain two electrons) and the density of electrons occupying the vacancy states. In a EuO crystal which only contains oxygen vacancies and no other impurities or imperfections, charge neutrality imposes that the total density of electrons . If only a small fraction of vacancy electrons is thermally excited to the conduction band () we find, similar to an intrinsic semiconductor [34], that , with , i.e. this corresponds to an effective activation energy of Eb/2. The situation changes when a compensating density of acceptor levels is present in the crystal for example as Eu3+ ions. In that case electrons will be bound to these sites and . If we find from equation (7.5) , i.e. an activation energy of .
As Eu-rich EuO samples show an activated behavior of 0.3 eV many authors have assumed that the binding energy of the electrons at the vacancy sites is about 0.3 eV in the paramagnetic phase [228, 226, 103, 65, 100, 63]. The derivation above shows that an activated behavior of 0.3 eV might instead very well correspond to = 0.6 eV. In the presence of increasing concentrations of acceptor sites a transition should occur towards an activation energy of 0.6 eV. Such behavior was indeed observed [65] in oxygen rich EuO samples which possibly still contain oxygen vacancies. In fact a range of activation energies from 0.6 to 0.3 eV was found in doping ranges between oxygen-rich and europium-rich samples [15, 63].
Experimental signs related to the electronic state of the vacancy electrons also come from the infrared absorption spectrum of EuO. Shafer et al. first observed two peaks at 0.58 eV and 0.66 eV in the optical absorption of Eu-rich EuO [15]. It was found that the intensity and energy of these peaks is almost temperature independent [243]. The peaks have been attributed to spin-flip transitions of electrons in magnetic polarons between exchange split states [244, 245, 246, 247]. As the peaks are still present at room temperature this would implicate that the vacancy exchange splitting at room temperature is still similar to that that in the ferromagnetic state. Moreover such spin-flip transitions are only very weakly allowed as spin-orbit interactions are probably quite small. Helten et al. on the other hand held transitions from the valence band to the vacancy states responsible for the peaks [243]. However in the slightly Eu-rich EuO samples which show the peaks, the vacancy states are almost fully occupied except for a small fraction of thermally excited electrons. The number of empty states to excite valence band electrons to is thus very small. In our view the possibility (which seems not to have been considered by other authors) that the peaks correspond to transitions from the vacancy states to the conduction band cannot be excluded. This would suggest that the vacancy electron binding energy is eV. It should be noted that, to our knowledge, the infrared absorption peaks have not been observed in Gd doped EuO. Gd doping of EuO seems to result in a Drude-like low frequency optical spectrum (see figure 1.5).
If the peaks in the IR-absorption spectrum of Eu-rich EuO are spin-flip excitations in the BMP, the fact that they remain visible up to room temperature would support the model of Mauger, as it shows that the exchange splitting inside the polaron persists at high temperatures. However if the excitations are spin-conserving transitions from the vacancy/polaron level to the conduction band like we propose, they would show that the vacancy electrons are bound at eV. Moreover this would show that the exchange splitting in the conduction band and in the BMP have approximately the same temperature dependence.
Although the determination of the vacancy electron binding energy remains ambiguous, both the activated behavior and the peaks in the infrared spectrum seem to indicate a vacancy binding energy of around 0.6 eV, which we will thus take as a numerical estimate for the determination of the vacancy electron density of states in the next section.
7.2.5 Effect of doping
To our knowledge, the only serious attempt to quantitatively model the effect of doping on the temperature dependent resistivity of EuO was by Mauger [232]. In that BMP model the doping dependence of the transport properties is mainly introduced by the configurational entropy associated with the various repartitions of the bound magnetic polarons over the vacancy sites. Therefore, in that model, the shape of the resistivity curve is mainly determined by the ratio of acceptors to donors . However, it might very well be that the activation energy to go from one configuration to the other is so high (i.e. low probability of polaron hopping) that the system is essentially in one configuration, instead of being in thermodynamic equilibrium for the relevant time scales. The reduction of the free energy as a result of configurational entropy might thus be overestimated.
In the present chapter we will therefore not consider such thermodynamic effects. Instead we will treat the doping dependent reduction in ionization energy as a result of interactions between vacancies that are in each others vicinity along the lines of Mott [231]. It is well known that the electron binding energy in color centers can strongly be modified by neighbors (formation of M-centers or R-centers) [34]. Although the spatial distribution of oxygen vacancies in Eu-rich EuO has not been studied experimentally, we assume that they are randomly distributed. If two of such vacancies are in each others vicinity, the binding energy of their electrons will be changed. To model this effect we treat each of the oxygen vacancies as a Helium atom with two electrons in a -like orbital. As two He atoms do not form a bond their energy does barely depend on their separation distance except for very small separations [248]. The energy of an ionized He molecule will depend much more strongly on the separation distance as it will form a bond with two electrons in a bonding orbital and only 1 in an anti-bonding orbital. Therefore the binding energy of an electron in the He molecule varies as a function of separation distance : . Here is the first ionization energy of a vacancy electron in a single vacancy as a result of the effective screened core charge . The energy decrease of a bonding electron will approximately cancel the energy increase of an anti-bonding electron when the atoms approach each other. Therefore , the well known [155] energy of the ionized hydrogen molecule with one electron in a bonding orbital. Thus we find:
| (7.6) |
Approximately, eV = 0.6 eV and thus we find for the orbital radius with and the Bohr radius . Using equation (7.2.5) we can approximate the binding energy distribution for vacancies randomly situated in the crystal. We did this by generating a large number of random ensembles with periodic boundary conditions and calculating the binding energy for each vacancy, assuming that changes in the binding energy due to neighbors were additive. The random distributions were generated with the constraints that distances between vacancies should be at least the nearest neighbor separation and not more than two neighbor vacancies should be contained within the second nearest neighbor spacing. The calculation was also performed for random vacancies generated on an fcc lattice with the lattice constant of EuO, resulting in essentially the same results. The results of the calculation are displayed in figure 7.2 for a range of concentrations. At small concentrations most vacancies do not have a neighbor at a distance for which equation (7.2.5) differs significantly from . Therefore the density of states is strongly peaked around 0.6 eV, the binding energy for a single vacancy. However upon increasing the vacancy concentration, the average nearest neighbor distance decreases and as a result, the average binding energy also decreases. For concentrations above 0.3% most vacancies have a binding energy significantly smaller than . Increasing the concentration above 0.6% leads to a significant fraction of vacancies which have a binding energy less than 0 eV. One of the electrons from such a vacancy will delocalize into the conduction band666We neglected the effect of this delocalization on the binding energy distribution of the remaining vacancy electrons.. These electrons will contribute to the conduction and if their density is much larger than that of thermally excited electrons, the temperature dependent resistivity will be non-activated as is indeed observed at comparable doping concentrations in Eu-rich EuO.
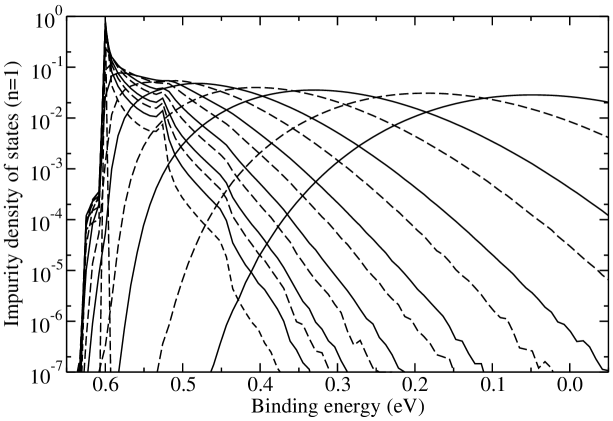
7.2.6 Shift of conduction band edge
To properly model the effect of the vacancy binding energy distribution on the transport properties we need to extend equation (7.5) to a distribution of impurity states with densities of state and electron occupation density . From equation (7.5) we now obtain:
| (7.7) |
For impurity states of positive and negative spin ( corresponds to spin-up in figure 7.1(a)) . Thermal excitations to both spin conduction bands are taken into account. As indicated by figure 7.1(b) the ionization energy of the vacancy levels of spin with respect to the opposite spin conduction band varies with magnetization as with eV (using eV). The equation of charge neutrality now becomes:
| (7.8) |
Where the upper limit of the last sum is for and for . Using (7.7),(7.8) and the calculated impurity density of states from figure 7.2, we can now numerically solve for the density of conduction electrons. The dependence of the magnetization on temperature and field is obtained from a mean field model for a ferromagnet with and K. The magnetization of EuO is known to follow such a mean field model to a very high accuracy [31]. The resistivity is then found to be with . The scattering time in EuO was found [103] to be of the order of s, using the free electron mass we find a mobility cm2V-1s-1 that was used in the calculation (similar values were found from Hall effect measurements [99, 15]).
7.2.7 Resistivity curves
Thus we have calculated the temperature dependence of the resistivity for a range of doping concentrations at magnetic field T. The results with % are displayed in figure 7.3. At low doping concentrations the high temperature resistivity shows an activated behavior with eV as discussed in section 7.2.1. Upon increasing the doping, the importance of thermal excitations from energy levels with a reduced binding energy due to hybridization increases. Therefore the effective activation energy decreases with doping. Above a doping level of about 0.4%, the number of electrons which have zero binding energy due to hybridization becomes substantial. As decays exponentially with the main contribution to the thermally excited conduction electrons will come from a region below the zero binding energy level and . As the exponential decay of the high temperature resistivity with temperature in figure 7.3 reflects the exponential increase of the tails of the impurity density of states with binding energy in figure 7.2.
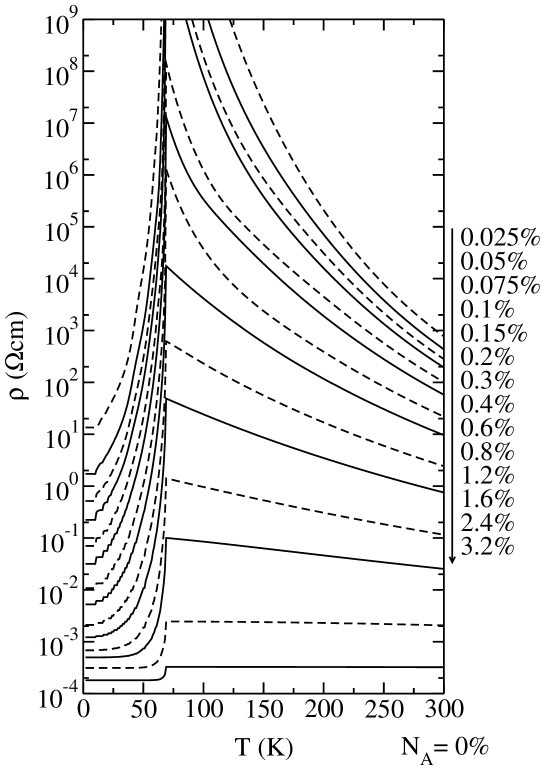
Below the Curie temperature the calculated resistivity is dominated by the shift of the conduction band and vacancy levels due to exchange. At low concentrations the energy overlap between the conduction band and the impurity DOS is essentially zero in the paramagnetic phase. A decrease of the energy splitting between vacancy and conduction band will therefore initially result in an increase of the number of thermally excited carriers by a factor . If becomes larger, substantial overlap between spin-down impurity and spin-up conduction band will occur and an even larger contribution to the conduction will be made by vacancy electrons which have their binding energy reduced below zero. For higher doping concentrations this second contribution will be dominant over the whole magnetization range. As , . Interestingly, the conductivity is therefore fully determined by the magnetization and does not depend explicitly on temperature anymore. The application of a magnetic field that increases the magnetization thus has the same effect on the resistivity as increasing the magnetization by a reduction of the temperature as we have indeed observed experimentally (see section 7.3.2).
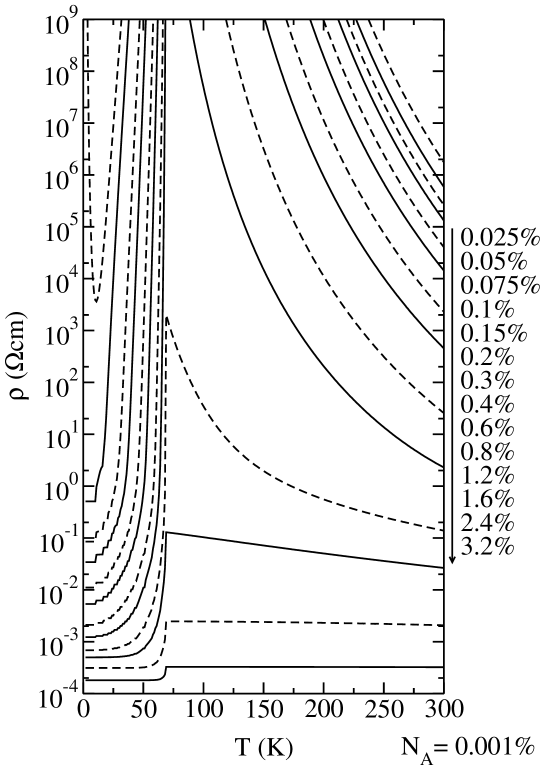
The introduction of a small concentration of acceptor sites to the model has a large effect on the obtained conductivity as is shown in figure 7.4 for . The high temperature resistivity at low electron densities now shows an activated temperature dependence with activation energy eV for reasons discussed in section 7.2.1. For small densities all vacancy electrons which have a reduced binding energy due to hybridization will be captured by the acceptor sites. However for higher doping concentrations the number of such electrons will exceed the number of acceptor sites and gradually fill the impurity DOS up to the zero binding energy level for increasing concentrations. This results in an activation energy which decreases from 0.6 eV and reaches 0 eV at about %. Above this concentration the effect of the acceptor impurities is negligible. Now, it takes a higher magnetization to reduce the binding energy of the highest occupied impurity levels to zero as the lowest binding energy states have been depleted by the acceptor sites . Therefore, especially for low vacancy concentrations, the temperature range in which thermal excitations dominate the resistivity is larger than for . For concentrations of less than 0.075% the density of vacancies with a binding energy which is reduced by more than 0.08 eV () due to hybridization is smaller than the number of acceptor sites. Therefore an effective gap will persist even at saturation magnetization like in figure 7.1(b). As the low temperature magnetization does not vary much, the low temperature resistance shows an activated behavior across this gap. For the 0.025% and 0.05% vacancy concentration the number of electrons excited across this gap is so small that the low temperature resistivity is outside the range of the graph. For the 0.075% sample an activated behavior is observed with a resistivity minimum around 12 K. Similar low temperature activated behavior has often been observed in slightly europium rich EuO samples. It was studied by Oliver et al. [103] who found an activation energy 18.3 meV. In our model the low temperature activation energy can have any value between 0 and 80 meV depending on the density of vacancy states and acceptors . The upper limit being determined by .
7.3 Experiment
Thin films of EuO with thicknesses of 20-30 nm were grown by evaporating Eu metal in a low background pressure of oxygen. Both polycrystalline films grown on (1) Al2O3 and epitaxial films grown on the (001) plane of 16 mol% Y2O3 stabilized cubic ZrO2 (YSZ) were studied. A detailed account of the growth has been given in chapter 3. The film resistivity was determined by 2 and 4 point DC measurements or by a low-frequency lock-in technique, using Cr contacts. For the photoconductivity measurements the EuO film area ( mm2) between the contacts was illuminated by a 1.5 mW He-Ne laser. The intensity of the laser was varied by inserting neutral density filters in the light path. All resistivity and photoconductivity measurements were performed without removing the films from the UHV chamber with a base pressure below 5 mbar. Conductivity measurements were performed in the dark, to exclude photoconductivity effects. For the magnetoresistance measurements the films were protected by a MgO cap layer of nm, which slightly increased their resistivity. The films were transported in air to a Quantum Design PPMS in which magnetoresistance measurements were performed with the magnetic field parallel to the film plane and perpendicular to the current direction. The in-plane field has the advantage of eliminating effects of demagnetizing fields as the demagnetization factor in the plane of the film is zero [249].
7.3.1 Resistivity
Many studies of the resistivity of Eu-rich EuO have shown a metal-insulator transition (see figure 1.10), with a resistivity peak that is usually located several degrees above the Curie temperature. Upon increasing the doping concentration a decrease of the magnitude of this transition is observed, accompanied by a change of the high temperature resistivity from an activated behavior with between 0.3 and 0.6 eV to a non-activated behavior. At low doping concentrations the low temperature resistivity also often shows an activated behavior. Besides these similarities between the different studies there are however a number of differences. Extensive resistivity measurements on single crystals [15, 103, 63, 99, 250, 102] show a large spread in both the detailed shape as in the absolute value of the resistivity. Besides the concentration of vacancies, the temperature dependence of the resistivity also seems to depend on the detailed growth procedure [15] including the way the crystal is cooled to room temperature. This might be explained by the fact that the resistivity curve does not just depend on the density of vacancies, but also on their spatial distribution. This spatial distribution could very well be affected by the way the crystal is grown. Moreover the growth procedure might affect the density of acceptor sites.
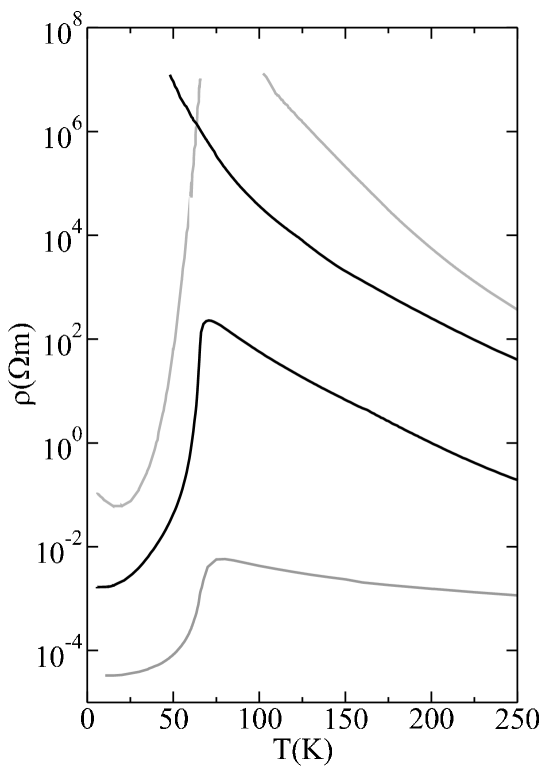
The number of transport studies of EuO thin films [24, 25, 28, 30] is much smaller than that on bulk samples. In figure 7.5 we show the resistivity curves of both epitaxial and polycrystalline films. The resistivity curves most resemble those of Massenet et al. [25] (see figure 1.10(c)). Under the same growth conditions the epitaxial films generally show a higher resistivity than the polycrystalline films. The reason for this might be that it is less probable to incorporate vacancies in a crystalline lattice whereas they are naturally created at the grain boundaries in polycrystalline films. However, the resistance curve of the epitaxial films is qualitatively not very different of those of polycrystalline films. Raising the growth temperature seems to reduce the number of oxygen vacancies in the films, eventually leading to a disappearance of the metal-insulator transition. The resistivity curves of films show several important differences from those of bulk crystals. Bulk crystals usually show a peak in the resistivity around the Curie temperature even in the rather strongly electron doped crystals which show a non-activated high temperature behavior. We have never observed such a peak in our films, and as far as we know it has never been observed in other resistivity measurements on thin films. The second difference concerns the decrease of the resistivity below Tc. For bulk crystals this slope often seems to consist of 2 transitions at 70 K and 50 K, between which shows a minimum (see figure 1.10(a)). Oliver et al. [103] attributed the high temperature transition partly to a change in mobility related to scattering by magnetic fluctuations, whereas the second transition is fully due to an increase in the free carrier concentration. For thin films such a minimum has never been observed, with decreasing monotonically from close to Tc to the resistivity minimum. These differences between bulk and film samples might be caused by the fact that the growth procedure of thin films is very different from that of single crystals as thin films can be grown at low temperatures (C) whereas bulk crystals are grown at temperatures around 1800∘C. Therefore the oxygen vacancies might be much more mobile during the growth of bulk samples. This could result in differences in the spatial distribution of the vacancies. Possibly the vacancies are ordered or even phase separated with small clusters of Eu metal in the EuO lattice of the bulk samples. On the other hand the vacancies in the thin films are probably more or less randomly frozen in. This could result in a different impurity DOS and thus a different temperature dependent resistivity. Therefore it would be very interesting to study the vacancy distribution using microscopic techniques. Thin films might also have a higher intrinsic scattering rate than bulk crystals due to surface scattering. Therefore the effect of scattering by magnetic fluctuations might be relatively less important.
There is a good agreement between the calculated resistivity curves in figure 7.3 and the measured curves in figure 7.5. The high temperature resistivity of the films does not follow an activated behavior but decays exponentially with temperature, as is expected when substantial overlap exists between the tail of the impurity density of states with the conduction band. Also the shape of the resistivity curves below the Curie temperature is similar to the calculated curves. The cut-off around Tc of the measured resistivity curves is less sharp than that in the calculated curves. Moreover the maximum in the measured curves is often located several degrees above the Curie temperature. These differences are possibly due to the formation of bound magnetic polarons below Tp.
7.3.2 Magnetoresistance
In figure 7.6(a) we show the magnetoresistance of an epitaxial EuO film. Around the Curie temperature a field of 5 T strongly reduces the resistivity by a factor of more than 104. In figure 7.6(b) we show the calculated magnetoresistance for a vacancy concentration of 0.5%. In the calculation the magnetic field increases the magnetization and thus reduces the vacancy binding energy . Except for a factor of 10 in the absolute value, which might be related to an intrinsically lower mobility in films due to surface effects, the calculated resistivity corresponds very well to the measured magnetoresistance at all fields.
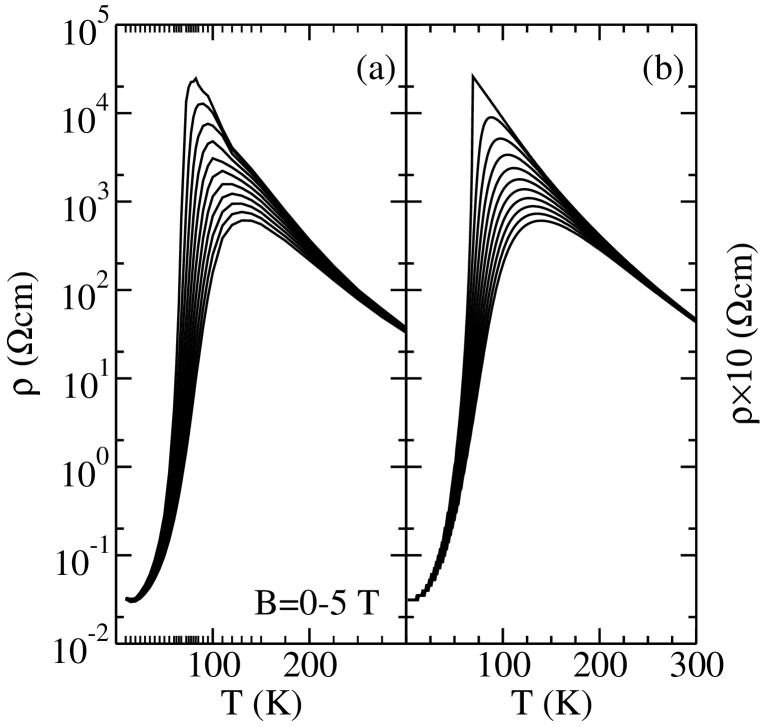
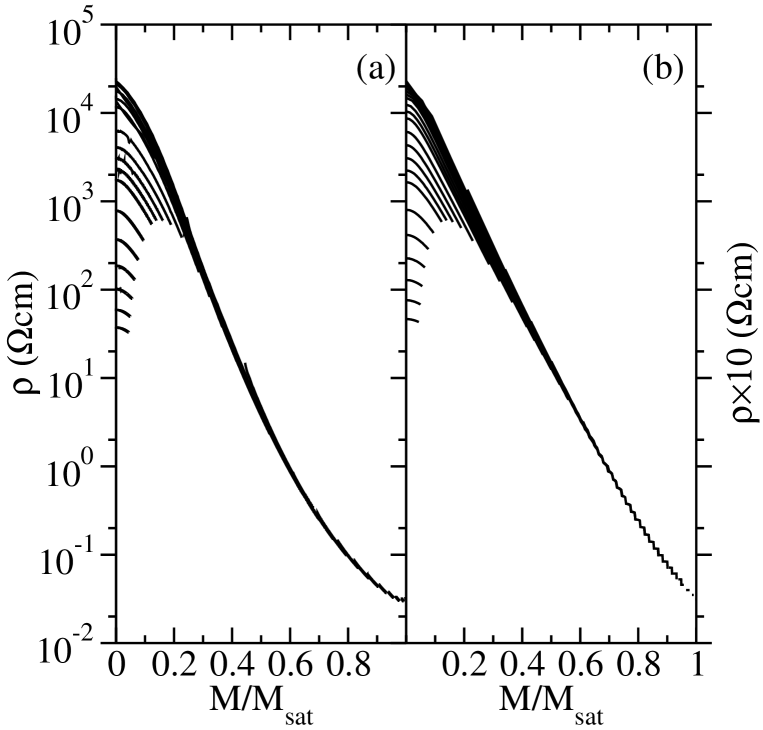
In figure 7.7(a) we show the same data as in figure 7.6(a), for scans for T at 34 different temperatures from 10-300 K. However, this time we plotted the resistivity versus the normalized magnetization as was calculated from the experimental and using a mean field model with T K. Remarkably, the figure shows that all the resistivity data below 100 K seem to superimpose on a universal curve. This strongly suggests that the resistance of Eu-rich EuO does not explicitly depend on temperature and magnetic field, but is fully determined by the magnetization. Interestingly this observation imposes strict limits on models for the conductivity and magnetoresistance in EuO. Above 100 K the data leave the universal curve, thus indicating that the contribution of thermally activated electrons to the conduction has become non-negligible. In figure 7.7(b) we show the calculated resistivity with , which shows that these results are excellently reproduced by a decrease of the impurity electron binding energy proportional to the magnetization as discussed in section 7.2.6. As argued in this section dd and the universal curve that is found therefore directly reflects the integrated impurity density of states. In fact as the measured conductivity is approximately proportional to this indicates that , with eV and . Therefore the experimental data are consistent with the calculated exponentially decaying tails of the vacancy density of states. Hundley et al. [104] have found a similar behavior in La0.7Ca0.3MnO3 films. They explain this behavior by a polaron hopping conductivity with a hopping transfer integral proportional to the magnetization . A weak point in this assignment is that the conductivity should still depend explicitly on temperature through the factor in the exponent, an effect that would strongly deviate the data from , especially at low temperatures777For similar reasons it is difficult to reconcile a polaron hopping model with the observed behavior in EuO.. The success of the model of an exchange split conduction band (a red shift of the absorption was also found in the manganites [189]) that moves through an occupied (impurity) density of states suggests that it should also be considered as an origin for the metal-insulator transition in the manganites, as was also argued by Nagaev [12]. The same remark might be made about the metal-insulator transition in EuB6, as it was recently found from optical measurements that the number of effective charge carriers in this compound also shows a universal scaling with magnetization. Broderick et al. [251] found that , i.e. , a behavior that seems difficult to reconcile with polaron models. This behavior is however consistent with a model in which the shift of the impurity binding energy is proportional to the magnetization, if the (impurity) DOS is approximately constant. In that case our model gives dd. Recently it was argued that EuB6 intrinsically is a semiconductor and that structural defects seem to play an important role [252]. This suggests that the transport properties of EuB6 might be dominated by doping from B6 vacancies in a way similar to Eu-rich EuO. The large spread in resistivity and carrier concentration for different crystals [253] might be the result of different vacancy densities. Anyhow, even disregarding the origin for the shape of the occupied density of states in Eu-rich EuO, EuB6 and La0.7Ca0.3MnO3, scaling laws for magnetoresistance or , seem to be obeyed by all these compounds. This universal behavior seems to be naturally explained as a crossing of occupied states and conduction bands as a result of an exchange splitting proportional to .
7.3.3 Photoconductivity
The photoconductivity of EuO is very remarkable. In figure 7.8 we show the photoconductivity888 is just the conductivity of the film when it is illuminated by a laser of intensity . of a thin EuO film on an Al2O3 substrate for different laser intensities . A striking effect is that the magnitude of the metal-insulator transition is only slightly reduced by the illumination with light. A related interesting effect that we observed in films without a normal metal-insulator transition was a light induced metal-insulator transition (shown in figure 7.9). A similar effect has been observed in EuO single crystals [101, 254], although these authors did not show that the metal-insulator transition was absent in the dark. Our data shows for the first time that d/d in stoichiometric EuO films stays negative in the dark whereas it becomes positive (i.e. metallic) below Tc when it is illuminated by a laser.
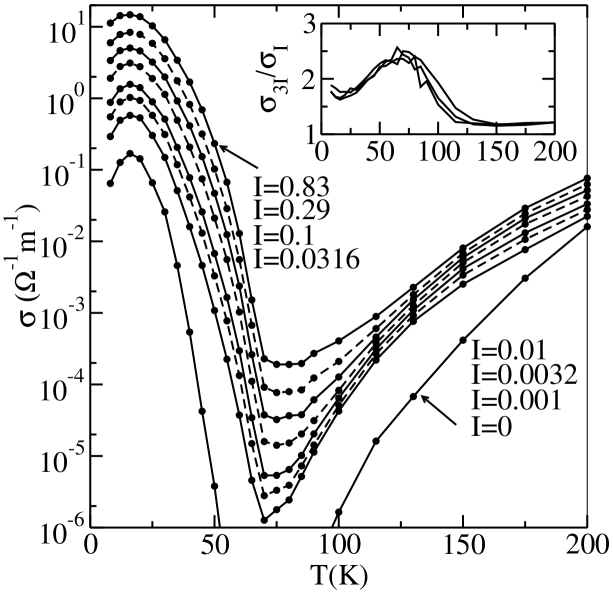
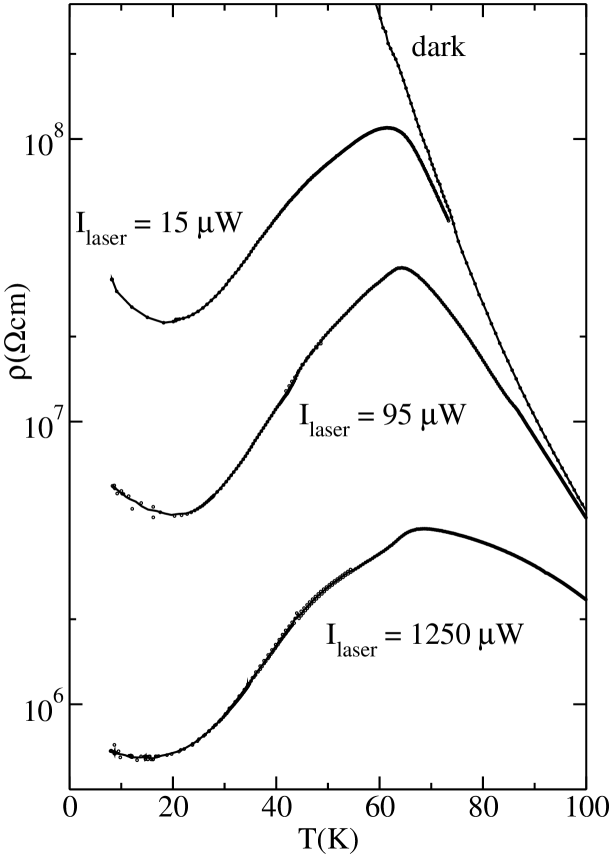
Previous studies [255, 256, 257, 101] have described the photoconductivity using the formula , where is the lifetime of photoexcited carriers. This formula is based on the assumptions that the density of photoexcited carriers is proportional to the light intensity: and the conductivity is proportional to the number of photoexcited carriers: . The authors assumed that is temperature independent. Therefore they have interpreted the photoconductivity curves as evidence that the metal-insulator transition in EuO is completely due to changes in the mobility , in contrast with Hall, Seebeck and optical measurements that assign it to changes in the carrier density [103, 99, 102]. It is however important to note that the mobility of light induced carriers can be very different from that of free carriers as the excited carriers probably form excitons. Such excitons could show similar behavior as chemically doped electrons, with electron hole separation only occurring in the ferromagnetic phase. The large increase in photoconductivity in the ferromagnetic state could thus also be understood as a change in the number of free photoelectrons. This would also explain the occurrence of the photoinduced metal-insulator transition (figure 7.9). The photoconductivity measurements therefore do not prove that the metal-insulator transition is caused by a mobility change.
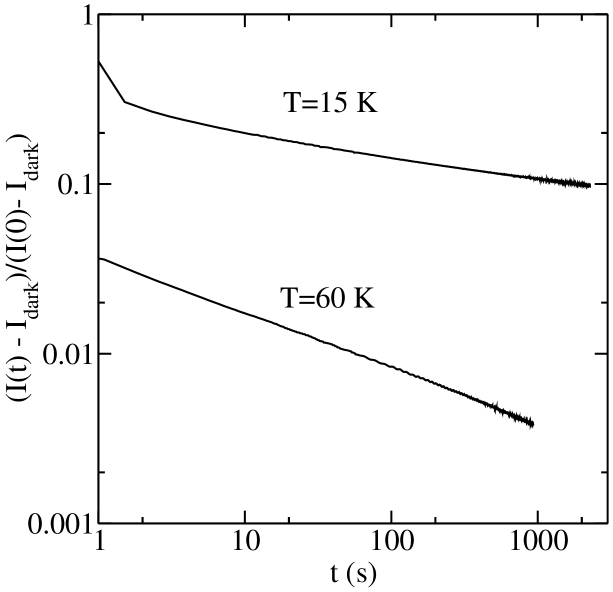
We have studied the slow transient decay of the photoconductivity after the illumination of the sample was stopped as is shown in figure 7.10. Near the Curie temperature the conductivity quickly ( s) returns to within 1% of its dark value after removing the light, after which a slow conductivity decay sets in. However at 15 K we found that the photocurrent in our films decays even more slowly. Even s after blocking the laser the (photo)conductivity was still at 10% of the photoconductivity at full illumination. Possibly these extremely long decay times are caused by electrons that are excited to the minority-spin conduction band. The lifetime of such photoelectrons will be much increased in the ferromagnetic state as they can not recombine with Eu holes which all have opposite spin at saturation magnetization. Another cause for the slow decay rates might be the thermal excitation of electrons which are trapped in deep impurity levels. These long relaxation times had not been observed in previous studies of the transient photoconductivity in which only short decay times ( s) were examined [101, 257].
The relaxation rate seems to depend on the illumination . To show this we have plotted , and in the inset of figure 7.8. For all these curves , and therefore . The three curves in the inset show very similar behavior indicating that , i.e. . is related to the mechanism that is responsible for the recombination of the photocarriers. At low temperatures indicating recombination between photocarriers and valence band holes, higher values of often indicate that levels in the gap (traps) play an important role in the recombination dynamics [258]. The dependence of the relaxation rate on and the large values of at low temperatures complicate the interpretation of the temperature dependent photoconductivity.
7.4 Conclusions
We have compared the He-model [103] and the BMP model [232] for the metal-insulator transition in EuO. We argued that the difference between these models is the diamagnetic or paramagnetic configuration of the two electrons in the oxygen vacancy. This configuration strongly depends on the degeneracy of the lowest energy levels in the vacancy. We performed a simple cluster calculation which seems to indicate that the diamagnetic configuration is more stable. The similarity between the temperature dependent binding energy in the polaron and He-model as indicated by figures 7.1(b) and 7.1(c) shows why both models are capable of obtaining a good agreement with experimental resistance curves. Instead of modelling the effect of doping as a change in configurational entropy at the vacancy sites [232], we calculated the reduction in binding energy as a result of the formation of bonding and anti-bonding orbitals between vacancy sites at small distances from each other. Thus we calculated the transport properties as a function of temperature, magnetic field and doping concentration.
Despite the fact that the model neglects several potentially important effects, like the effects of scattering by magnetic fluctuations and the possibility of polaron hopping/band formation, we found good agreement between the temperature dependent resistivity of epitaxial and polycrystalline EuO thin films and the calculated resistivity. In particular the model accounts well for the observed exponential decay of the high temperature resistivity . We have measured the magnetoresistance of an epitaxial EuO film and have shown that it can be scaled on a universal curve which gives approximately below 100 K. The proposed model excellently reproduces this behavior, whereas polaron hopping models do not seem to be consistent with it as they should show a temperature activated dependence. Interestingly similar scaling relations with magnetization were observed in La0.7Ca0.3MnO3 and EuB6, suggesting that similar mechanisms could be responsible for CMR effects in these compounds. We measured the photoconductivity of EuO films and also found a metal-insulator transition in the photoconductivity. We argued that this metal-insulator transition is not necessarily due to a mobility change, but might also be due to a transition in the number of delocalized photocarriers, similar to that of chemically doped carriers.
Chapter 8 Crossing the gap from - to -type doping: nature of the states near the chemical potential in La2-xSrxCuO4 and Nd2-xCexCuO4-δ
We report on an x-ray absorption and resonant photoemission study on single crystal La2-xSrxCuO4 and Nd2-xCexCuO4-δ high cuprates. Using an internal energy reference, we find from the photoemission data that the chemical potential of La2-xSrxCuO4 lies near the top of the La2CuO4 valence band and of Nd2-xCexCuO4-δ near the bottom of the Nd2CuO4 conduction band. The x-ray absorption data establish clearly that the introduction of Ce in Nd2CuO4 results in electrons being doped into the CuO2 planes. We infer that the states closest to the chemical potential have a Cu singlet origin in Nd2-xCexCuO4-δ and singlet in La2-xSrxCuO4.
8.1 Introduction
One of the long standing puzzles in the field of high superconductivity concerns the nature of the charge carriers in doped high cuprates [178]. Several photoemission studies [259, 260, 261] have revealed very little difference in the valence band spectra of the Nd2-xCexCuO4-δ system as compared to the La2-xSrxCuO4. In particular, the position of the chemical potential in the two different systems seem to be quite similar and is located in the middle of the gap of the parent compounds, while one would expect that the chemical potential should shift from the top of the valence band to the bottom of the conduction band by changing from -type to -type doping. From this unexpected behavior it was concluded that both hole and electron doping result in new states that fill the band gap. Several explanations have been proposed for this mid gap pinning of the chemical potential [259, 262, 263, 264], with perhaps the scenario involving the occurence of phase separation to be currently the most discussed [262, 265, 264]. In addition, for Nd2-xCexCuO4-δ it becomes even an issue whether it can be regarded as a really electron doped system [266, 267, 268], since transport measurements on optimally doped Nd2-xCexCuO4-δ have revealed a positive Hall coefficient [269, 270]. This has led to propositions that the charge carriers relevant for the superconductivity in Nd2-xCexCuO4-δ are hole like.
In this paper we present a comparative x-ray absorption (XAS) and resonant photoemission (RESPES) study on Nd2-xCexCuO4-δ and La2-xSrxCuO4 single crystals. To ensure that the spectra collected are representative for the bulk material, we rely on the bulk sensitivity of the x-ray absorption technique as well as of valence band photoemission measurements using high photon energies [271]. In addition, we use an internal energy reference within the CuO2 planes as proposed earlier [262], in order to ensure a reliable measurement of the position of the chemical potential relative to the valence band. We find unambiguously that the chemical potential of La2-xSrxCuO4 lies near the top of the La2CuO4 valence band and of Nd2-xCexCuO4-δ lies near the bottom of the Nd2CuO4 conduction band, and that the introduction of Ce results in electrons being doped into the CuO2 planes. Resonance data suggest that the charge carriers in Nd2-xCexCuO4-δ are different in nature than in La2-xSrxCuO4, in the sense that they are singlets of Cu character rather than of , where denotes an oxygen ligand hole. In addition we find that the presence of Nd states and a different O to Cu charge transfer energy cause Nd2-xCexCuO4-δ to have an apparently similar chemical potential position as La2-xSrxCuO4 if the leading edge of the main valence band structure is used as reference.
8.2 Experimental
Single crystals of Nd2CuO4, Nd1.85Ce0.15CuO4-δ, La2CuO4, and La1.85Sr0.15CuO4 were grown by the travelling solvent floating zone method [272, 273, 274]. The onset of the superconducting transition in the La1.85Sr0.15CuO4 sample was found to be 35 K from ac-susceptibility measurements. The Nd1.85Ce0.15CuO4-δ crystals show a critical temperature of 21 K after reducing them in flowing N2 gas at 900∘C for 30 hours. XAS and RESPES experiments were performed at the ID12B beamline of the European Synchrotron Research Facility (ESRF). The overall energy resolution was set to 0.3 eV for the XAS and 0.5 eV for the RESPES. The samples were both cleaved and measured at 20 K in a chamber with a base pressure below 510-11 mbar. Core level x-ray photoemission (XPS) measurements were carried out in Groningen using a Surface Science Instruments system equipped with a monochromatized Al- source. The XPS energy resolution is 0.5 eV, and the samples were cleaved and measured at room temperature in a chamber with a base pressure below 110-10 mbar.
8.3 Is Nd1.85Ce0.15CuO4-δ electron doped?
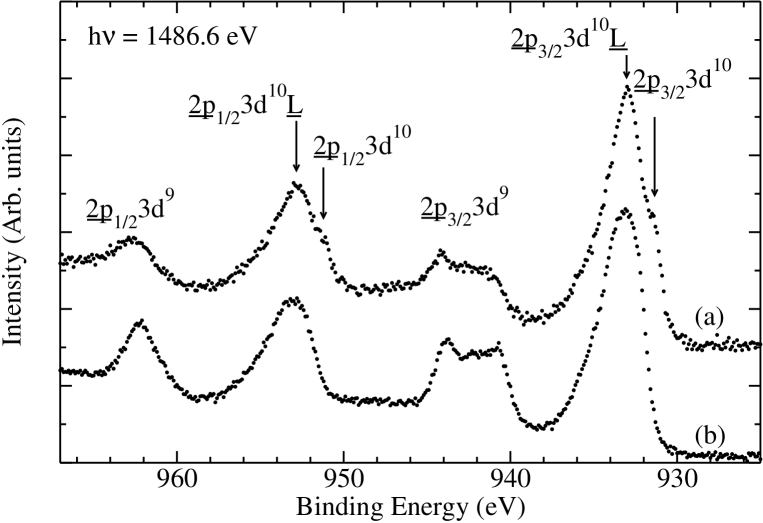
Figure 8.1 shows the Cu core level XPS of Nd2CuO4 and Nd1.85Ce0.15CuO4-δ where we have used the standard labelling for the structures [275, 261, 276, 277]. We clearly observe that the ’satellites’ decrease in intensity with Ce doping, and that also new structures start to appear on the low binding energy side of the ’main lines’, where the underline denotes a hole. These new structures have been assigned as . These spectra imply that doping Nd2CuO4 with Ce results in a decrease of the Cu2+ content with the and configurations, and simultaneously in an increase of the Cu1+ with the configuration. In other words, Ce doping indeed introduces electrons into the CuO2 planes in Nd2-xCexCuO4-δ.
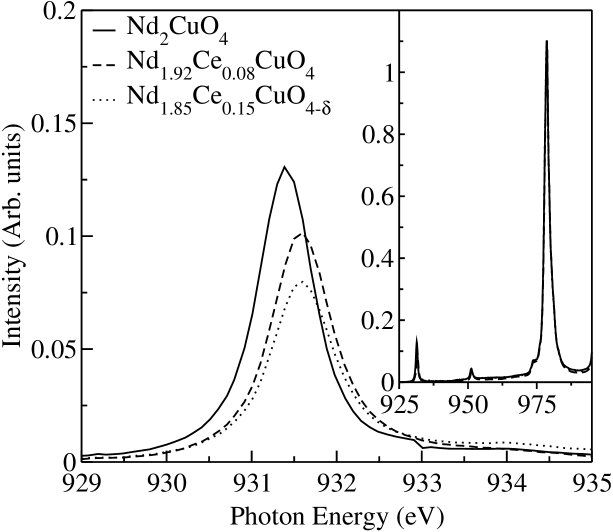
Figure 8.2 depicts the Cu XAS spectrum of Nd2CuO4 and Nd1.85Ce0.15CuO4-δ normalized to the Nd absorption line as shown in the inset. The Cu white line is given by the transition . One can clearly see that the Cu white line intensity has decreased appreciably when Ce is introduced into the system, consistent with the results from earlier electron energy loss studies on polycrystalline samples [278, 279]. This indicates again directly that the Cu2+ content in the CuO2 plane is reduced, i.e. Ce doping indeed means electron doping.
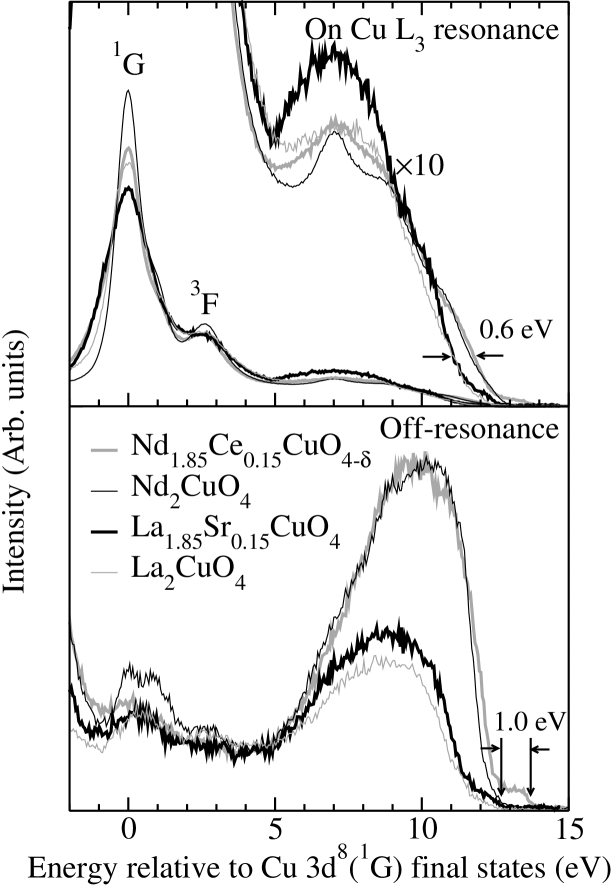
8.4 Position of the chemical potential
Having established that Nd2-xCexCuO4-δ is an electron doped material, we now will shift our focus to the issue of the position of the chemical potential in Nd2-xCexCuO4-δ relative to that in the La2-xSrxCuO4 as well as their parent materials. Figure 8.3 shows the on- and off-resonant photoemission spectra of Nd1.85Ce0.15CuO4-δ, Nd2CuO4 La2CuO4 and La1.85Sr0.15CuO4. The on-resonant spectra are taken with the photon energy tuned at the Cu XAS white line, and the off-resonant spectra with a photon energy which is eV lower. It has been demonstrated earlier [280, 281, 282] that the Cu resonant photoemission spectrum of Cu2+ oxides is dominated by the auto-ionization process of the type , thereby enhancing the spectral weight of the final states considerably. Indeed, the spectra depicted in the top panel contain the characteristic and structures of a [283, 284].
We now will use the peak to set the energy scale for all the photoemission spectra [262], since this will give us an energy zero that refers directly to the electronic structure of the CuO2 plane, which is at the heart of the current discussion. Such an internal energy reference is much more reliable than using the leading edge of the main peak of the off-resonant valence band spectrum [259, 260], since in comparing the Nd2-xCexCuO4-δ with the La2-xSrxCuO4 system one can suffer from differences due to the presence of different chemical species and charge transfer energies, as we will show later. It is also better to use the internal energy reference rather than the Fermi level of the spectrometer [263], since the chemical potential of the undoped Nd2CuO4 and La2CuO4 is not well defined and in fact will even be pinned by impurities or defects of unknown nature and quantities.
With the peak position set to zero, we can clearly observe in the lower panel of figure 8.3, that the first ionization state of Nd1.85Ce0.15CuO4-δ is about 1.0 eV further away than that of the undoped Nd2CuO4. Recalling that the onset of the optical gap in Nd2CuO4 is approximately 1.0 eV (with the first peak in the optical spectrum at 1.5 eV) [285, 286, 287], one can immediately conclude that the chemical potential of the Ce doped system lies near the bottom of the conduction band of the undoped Nd2CuO4. Contrary to earlier claims [259, 260], we find that the chemical potential for the doped material is not pinned in the middle of the gap of the undoped material. A similar conclusion can also be reached from recent doping dependent angle-resolved photoemission experiments [288], although there one needs to assume that one can align the spectrum of the undoped Nd2CuO4 with respect to those of the Nd2-xCexCuO4-δ by using the leading edge of the valence band for small doping levels.
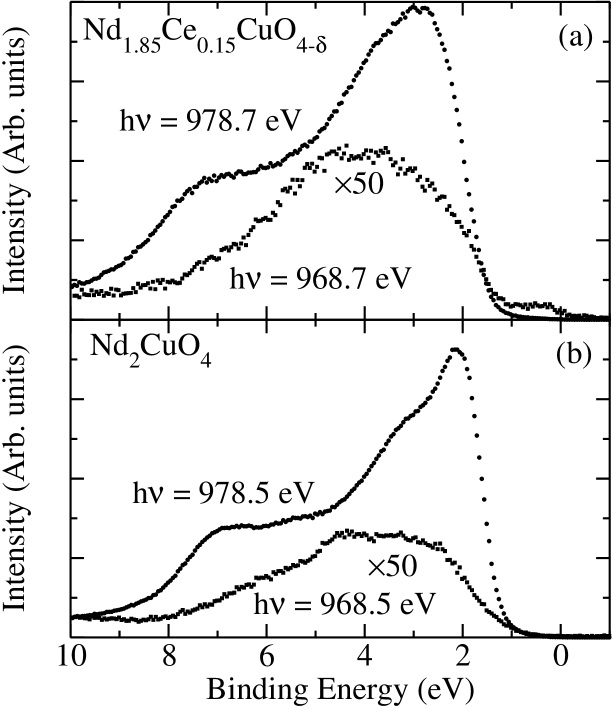
In comparing La2-xSrxCuO4 with La2CuO4 using the internal reference, we can also clearly see from the lower panel of figure 8.3, that the chemical potential in La1.85Sr0.15CuO4 resides in the vicinity of the top of the valence band of La2CuO4, contrary to earlier reports in which the chemical potential was concluded to be pinned in the middle of the insulator gap [260, 263]. We suspect that this discrepancy is caused by the different method for the energy referencing, which can lead to hidden energy shifts, as we have explained above.
The lower panel of figure 8.3 also shows that the valence band spectrum of Nd2CuO4 is very different in intensity and also in energy position as compared to the spectrum of La2CuO4. We can identify two reasons for this. The first is that in the Nd2-xCexCuO4-δ system the presence of Nd contributes significantly to the valence band spectrum, while this is not the case for La in La2-xSrxCuO4. From photo-ionization cross-section tables [289], one can estimate that the Nd is responsible for more than 50% of the signal in Nd2-xCexCuO4-δ at the photon energies used, while in La2-xSrxCuO4 the spectrum is dominated by the Cu spectral weight. It is also important to realize that the Nd signal is present over the entire valence band energy range. This is demonstrated by figure 8.4, where we plot the resonant photoemission spectrum of the Nd2CuO4 and Nd1.85Ce0.15CuO4-δ valence bands, with the photon energy tuned on the Nd absorption edge. A double peak structure is clearly visible, of which the higher-binding energy feature can be assigned to screening by charge transfer from the O orbitals (4f3L final states) and the lower-binding energy peak which resonates most strongly is due to pure Nd hole states (4f2 final states) [260, 290]. Similar resonances were found at the Nd [291, 292] and Nd absorption edge [293, 259, 260, 294]. From these data we can clearly see that the Nd component continues all the way up to the top of the valence band in Nd2CuO4. It is not inconceivable that the top of the valence band in the undoped Nd2CuO4 consists of Nd states and not of Cu . It is interesting to note that this could provide a possible explanation why it is difficult to dope holes into the CuO2 planes in cuprates with the -structure, as these holes would be doped into the Nd-O planes.
Another cause for differences in the valence band spectrum of Nd2CuO4 as compared to La2CuO4 is laid out in the upper panel of figure 8.3. A blow-up of the Cu on-resonant photoemission spectra shows that the leading edge of the valence band in Nd2CuO4 and also Nd1.85Ce0.15CuO4-δ is higher in energy by about 0.6 eV as compared to that of La2CuO4. This number agrees very well with the fact that the optical gap in Nd2CuO4 is about 0.5 eV smaller than in La2CuO4(which has its first peak in the optical spectrum at 2.0 eV) [286, 295]. One could infer that this 0.6 eV difference reflects the difference in the effective O - Cu charge transfer energy, since this parameter determines to a large extent the magnitude of the band gap of the insulating correlated insulator. On hindsight, it is perhaps not surprising to find such differences in view of the fact that Nd2CuO4 and La2CuO4 have different crystal structures and O-Cu bond lengths, resulting in differences in Madelung potentials and O - Cu hopping integrals. In fact, there is no compelling reason to believe that a comparative study of the development of the chemical potential in Nd2-xCexCuO4-δ can be carried out using La2-xSrxCuO4 as a reference.
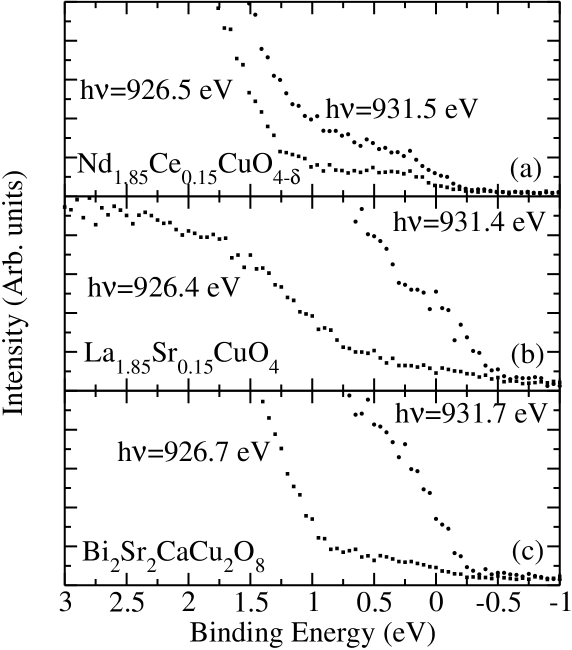
8.5 Character of the states near the Fermi level
Finally, we will study the character of the states closest to the Fermi level (EF) in the electron doped Nd2-xCexCuO4-δ system. Figure 8.5 shows the on- and off-resonant photoemission spectrum of Nd1.85Ce0.15CuO4-δ in the vicinity of the top of the valence band and the near EF region. As expected, the on-resonant intensity is enhanced as compared to the off-resonant one. However, the enhancement is substantially smaller than that for the hole doped cuprates, as one can clearly see from figure 8.5, which also includes the on- and off-resonant data for La1.85Sr0.15CuO4 and Bi2Sr2CaCu2O8. Since at the resonance the Cu spectral weight is being measured, the enhancements for the near EF states basically indicate the amount of character that is mixed into these states. For the undoped cuprates, cluster calculations have shown that the top of the valence band consists of Zhang-Rice singlets having mainly a character, and also about 8% admixture due to the direct hybridization between these two local configurations [296, 297, 298]. Subsequent RESPES studies [280, 299] have confirmed this picture. Also RESPES experiments on the hole doped cuprates have shown that the top of the valence band as well as the near EF intensity are of Zhang-Rice singlet nature [282]. The much smaller resonant enhancement factor for the near EF intensity in the Nd1.85Ce0.15CuO4-δ implies a much smaller admixture of the states, indicating that these near EF states do not have a direct hybridization with the . We therefore conclude that these states are not of local character, and we infer that they are in fact doublet final states that can be reached by the photoemission process starting from a singlet initial state. In this framework, the doublet has to hybridize first with the on a neighboring cluster, before it can acquire the character of the neighboring cluster on which the resonance process takes place. These data therefore support the scenario that the charge carriers in Nd2-xCexCuO4-δ are electrons of singlet like nature.
8.6 Conclusions
To conclude, we have measured that the CuO2 planes in the Nd2-xCexCuO4-δ high Tc cuprates are electron doped. Using a reliable internal energy reference we have established that the chemical potential in La2-xSrxCuO4 and Nd2-xCexCuO4-δ is not pinned in the middle of the gap of the insulating parent compounds. Instead, it is located in the vicinity of the top of the valence band for La2-xSrxCuO4, and near the bottom of the conduction band for Nd2-xCexCuO4-δ. One might say that it crosses the gap upon going from - to -type doping. Important is to note that the existence of phase separation [262, 263, 264, 265] in the doped materials could involve the pinning of the chemical potential inside the gap, but that our results indicate that this pinning could not bring the chemical potential very far away from the band edges, with perhaps a value of 0.3 eV as an upper limit judging from our experimental resolution and uncertainties in determining the onset of the optical gap. Resonance data suggest that the charge carriers in Nd2-xCexCuO4-δ are electrons of Cu character, while in La2-xSrxCuO4 and Bi2Sr2CaCu2O8 they are like holes. As far as symmetry is concerned, the charge carriers in both the electron and hole doped cuprates are singlet in nature.
Samenvatting
Een vaste stof bestaat uit atomen, die elk uit een kern met elektronen zijn opgebouwd. De vaste stof kan ontstaan doordat de elektronen als een soort lijm werken tussen de kernen. De kernen zitten daardoor vast in een kristalrooster. De elektronen zitten echter minder vast en kunnen relatief makkelijk door licht of door een elektrisch of magnetisch veld bewogen worden111Met bewegen bedoel ik zowel veranderingen in positie als veranderingen in de toestand van het elektron. Het moet hier worden opgemerkt dat het ook heel weinig energie kost om de magnetische en trillingstoestanden van de kernen te veranderen, dit is echter alleen meetbaar met zeer gevoelige technieken., waardoor ze in belangrijke mate de optische, elektrische en magnetische eigenschappen van een materiaal bepalen. Zo wordt de kleur van een materiaal grotendeels veroorzaakt door de interactie van licht met elektronen, is de elektrische geleiding gekoppeld aan de mobiliteit en concentratie van elektronen en worden de magnetische eigenschappen bepaald door de verdeling van spin-op en spin-neer elektronen in het materiaal222Spin is een eigenschap van een elektron die twee waarden kan aannemen: op en neer. Een spin-op elektron genereert een klein magneetveld omhoog en een spin-neer elektron eenzelfde veld omlaag. en hun draaisnelheid om de kernen. Daarom kunnen de eigenschappen van een materiaal vaak pas begrepen worden door de gezamenlijke toestand van de elektronen te onderzoeken.
In dit proefschrift zijn de eigenschappen van europium monoxide (EuO) bestudeerd. EuO is opgebouwd uit evenveel zuurstof als europium333Europium is het element met atoomnummer 63. atomen die om en om (NaCl structuur) een kubisch kristalrooster vormen. Voordat we de eigenschappen van EuO konden bestuderen was het echter essentieel om kwalitatief hoogwaardige EuO kristallen te kunnen groeien. Bovendien moesten we in staat zijn om deze kristallen in dunne lagen lagen (variërend van 1 nm tot 1 m dikte) te kunnen maken om er spin-afhankelijke metingen aan te kunnen doen. Dit was echter niet de enige reden waarom dunne lagen onze voorkeur hadden. Dunne lagen van EuO hebben als voordeel dat ze bij veel lagere temperaturen (300-400∘C) gegroeid kunnen worden dan dikke kristallen (1800∘C). Bovendien zijn zulke lagen zeer geschikt voor technologisch onderzoek. Op dunne magnetische lagen kunnen magnetische gegevens namelijk met hoge dichtheid worden opgeslagen. Ook zijn er ideeën om materialen als EuO te gebruiken in het veld van de spintronica. In dit nieuwe onderzoeksgebied worden elektrische componenten ontwikkeld (zoals transistors) die niet alleen gebruik maken van de lading, maar ook van de spin van de elektronen. Om deze componenten klein genoeg te maken om op chips te passen is het van groot belang dat dunne lagen gegroeid kunnen worden. Bovendien zijn de lage groeitemperaturen van EuO lagen goed te combineren met bestaande fabricage processen.
Om de dunne lagen te groeien, verdampten we europium metaal op een substraat, waarbij we zuurstof toelieten444De groei van EuO lagen wordt gedetailleerd beschreven in hoofdstuk 3. Hierdoor konden de europium en zuurstof atomen reageren op het oppervlak van het substraat. We verwachten dat voor de groei van EuO een heel nauwkeurige dosering van Eu en O atomen nodig was om precies evenveel europium atomen als zuurstof atomen met elkaar te laten reageren. Bij het onderzoek naar de optimale groei-omstandigheden deden we echter een nuttige ontdekking. Het bleek dat boven 350∘C de europium atomen alleen op het oppervlak bleven plakken als ze reageerden met zuurstof. Wanneer ze niet reageerden verdampten ze namelijk weer. Dit effect maakte het een stuk makkelijker om de goede verhouding van zuurstof en europium te krijgen aangezien er nooit een overschot aan europium atomen kon ontstaan als de temperatuur van het substraat boven de 350∘C bleef, omdat het overschot dan verdampte. Door nu met opzet een overschot van europium atomen aan te bieden, konden we ook voorkomen dat er een overschot aan zuurstof in de laag ontstond. Zo konden we kwalitatief hoogwaardige kristallagen groeien met een nauwkeurige 1:1 Eu:O verhouding. Een ander resultaat was dat lagen met net iets meer europium dan zuurstof atomen (Eu:O = 1.005:1) ook gemakkelijk verkregen konden worden door de temperatuur van het substraat onder de 350∘ te brengen. Zulke lagen met iets teveel europium atomen zijn belangwekkend, omdat hun elektrische geleiding met een factor van meer dan een miljard kan veranderen wanneer ze magnetisch worden.
Ofschoon EuO een relatief onbekend materiaal is, zijn de eigenschappen van EuO in veel opzichten zeer interessant. Ten eerste wordt het ferromagnetisch555Magnetisch op dezelfde manier als ijzer: ferrum. onder een temperatuur van 69 K (C). Dit ferromagnetisme wordt veroorzaakt doordat de spins van de elektronen steeds meer in dezelfde richting666Spins die in deze richting wijzen zullen we verder spin-op noemen, elektronen met een tegengestelde spin noemen we spin-neer. gaan wijzen, waardoor EuO beneden deze temperatuur meer spin-op dan spin-neer elektronen bevat. Aangezien elk elektron een magneetveld veroorzaakt, zal dit verschil tussen de spin-op en spin-neer elektronen dus een magneetveld tot gevolg hebben.
Op het eerste gezicht lijkt dit misschien niet bijzonder, toch is ferromagnetisme een zeldzame eigenschap. Dit heeft te maken met de toestanden waarin elektronen zich bevinden. Een elektron kan zich in veel verschillende toestanden in een vaste stof bevinden. Het heeft echter de voorkeur voor toestanden met lage energie. Alle elektronen zouden dus bij voorkeur in de laagste energietoestand blijven, ware het niet dat er een fundamentele restrictie bestaat die verbiedt dat één toestand meer dan één elektron van dezelfde spin-soort bevat. In totaal biedt elke toestand dus maximaal plaats aan twee elektronen. Deze restrictie wordt het Pauli principe genoemd. Een vaste stof bevat enorm veel (/gram) elektronen. Aangezien de toestanden met lage energie gevuld raken, zullen de elektronen gedwongen worden om de hogere toestanden op te vullen tot een bepaalde energie. Dit is vergelijkbaar met een zee die tot op een zeker (energie)niveau gevuld is met water. Elk water-molecuul heeft de laagste energie op de bodem van de zee, maar kan deze niet bereiken doordat zich daar al andere water-moleculen bevinden. De ’zee’ van elektronen wordt ook wel de Fermi-zee genoemd en het energieniveau op het oppervlak van de zee de Fermi-energie. Een belangrijk verschil tussen een echte zee en de Fermi-zee is dat de Fermi-zee eigenlijk uit twee zeeën bestaat: één voor spin-op en één voor spin-neer elektronen. Omdat een elektron uit de spin-op zee in de spin-neer zee kan stromen, door zijn spin om te keren, zullen de oppervlakken van beide zeeën bij dezelfde energie liggen.
Nu heeft het elektron behalve zijn spin ook een negatieve lading. Deze lading zorgt ervoor dat elektronen elkaar afstoten en dus de laagste energie hebben als ze zich zo ver mogelijk uit elkaar bevinden. Omdat elektronen met ongelijke spin zich volgens het Pauli principe in dezelfde ruimtelijke toestand kunnen bevinden, zullen ze zich over het algemeen dichter bij elkaar bevinden. Dit resulteert erin dat elektronen zoveel mogelijk gelijke spin aannemen, aangezien ze zich hierdoor verder uit elkaar bevinden en dus een lagere energie hebben, omdat ze elkaar minder afstoten. Dit mechanisme wordt exchange genoemd. Een materiaal krijgt echter alleen meer spin-op dan spin-neer elektronen als de energiewinst door exchange groter is dan het energie-verlies door het verhogen van het Fermi-oppervlak van de spin-op Fermi-zee ten opzichte van de spin-neer Fermi-zee777In dit geval resulteert exchange erin dat de spin-op Fermi-zee effectief dieper is. Een waarschuwing is hier op zijn plaats. Eigenlijk is de energie van één elektron niet meer goed bepaald als het zich in een systeem met veel elektronen bevindt, aangezien zijn energie kan afhangen van de toestand van de andere elektronen (zoals in het geval van exchange). Daarom is de Fermi-zee waarin de energie van elk elektron bepaald wordt door zijn diepte een conceptuele benadering. Deze benadering wordt in dit geval ter simplificatie toegepast, maar dit is niet voor alle vaste stoffen een goede benadering..
Vaak is het effect van exchange klein, doordat elektronen met een energie in de buurt van het Fermi-oppervlak zich meestal al ver uit elkaar bevinden. Daarom bevatten de meeste materialen evenveel spin-op als spin-neer elektronen. In EuO is echter iets bijzonders aan de hand: de elektronen met een energie dichtbij het Fermi-oppervlak bevinden zich in een zogenaamde schil die in de buurt van de sterk positief geladen atoomkern van europium ligt. Deze atoomkern trekt de negatief geladen elektronen sterk naar zich toe. Dit heeft als bij-effect dat deze -elektronen ook sterk naar elkaar toegetrokken worden en daardoor een veel groter effect van exchange ondervinden. Deze exchange is zo groot dat alle elektronen die zich bij dezelfde atoomkern bevinden dezelfde spin krijgen. Dit is echter nog niet genoeg voor ferromagnetisme, aangezien de spins van de elektronen bij verschillende atoomkernen nog verschillend kunnen zijn. Doordat de -elektronen op verschillende europium atomen echter ook een (in dit geval indirecte) exchange wisselwerking met elkaar hebben, krijgen alle elektronen dezelfde spin en is EuO ferromagnetisch888Het feit dat deze indirecte wisselwerking voor ferromagnetisme zorgt, is eigenlijk een van de meest bijzondere eigenschappen van EuO en wordt nog steeds niet precies begrepen..
Deze indirecte exchange wisselwerking tussen de spins van -elektronen van verschillende europium atomen is echter een factor kleiner dan de exchange tussen -elektronen op hetzelfde atoom. Bij temperaturen boven de Curie temperatuur van 69 K, is de indirecte wisselwerking dan ook niet meer sterk genoeg om te zorgen dat de spins van verschillende atomen in dezelfde richting wijzen, omdat de energie lager is als de spins van verschillende atomen willekeurig in alle richtingen kunnen bewegen. Dit is te vergelijken met het smelten van een vaste stof, waarbij de ordening van het kristalrooster verdwijnt om de bewegingsvrijheid van de atomen te vergroten. Boven de Curie temperatuur ’smelt’ het spin-rooster waardoor het ferromagnetisme verdwijnt.
Er is nog een belangrijk verschil tussen een normale zee en een Fermi-zee. Ofschoon er in een normale zee over het algemeen op elke diepte water te vinden is, zijn de diepten van de Fermi-zee veel grilliger. Op sommige diepten zijn veel elektronen te vinden, terwijl er op veel andere diepten geen toestanden voor de elektronen zijn. De Fermi-zee bestaat dus eigenlijk uit vele, met elkaar verbonden, grotten op verschillende diepten, die ieder toestanden bevatten. Deze grillige structuur geeft de energieverdeling weer van de vele mogelijke banen die een elektron door het rooster999Net als voor elektronen geldt ook voor licht dat het zich niet met alle energieën (=kleuren) door een rooster kan voortplanten. Een voorbeeld hiervan zijn de kleuren die door het rooster van lijnen op een compact disc worden gereflecteerd. van atoomkernen en andere elektronen kan volgen. De energie van een elektronenbaan wordt bepaald door de lading van het elektron, die ervoor zorgt dat het wordt aangetrokken door de kernen, maar ook door zijn bewegingsenergie, die juist verhoogd wordt door in de buurt van één kern te blijven.
Als dit grottenstelsel waaruit de Fermi-zee bestaat gevuld is met alle elektronen in de vaste stof kan het Fermi-oppervlak ergens halverwege een grot liggen. Het kan echter ook zo zijn dat de toestanden in één grot volledig gevuld zijn, maar dat de grot die daar direct boven ligt, geen enkel elektron bevat. Deze twee situaties zijn essentieel verschillend, omdat ze heel andere elektrische geleidingseigenschappen tot resultaat hebben. Elektrische geleiding kan namelijk alleen optreden als er golven over het oppervlak van de Fermi-zee kunnen lopen. Als het Fermi-oppervlak ergens halverwege een grot ligt kunnen er golven lopen en gedraagt het materiaal zich als een metaal. Als de grot volledig vol is zijn golven echter onmogelijk en is het materiaal elektrisch isolerend. Toch kan er een (kleine) elektrische geleiding optreden als de geheel gevulde grot slechts weinig onder de daarboven gelegen lege grot ligt. Bij hoge temperaturen kunnen elektronen uit de lager gelegen grot namelijk opspatten naar de hogere grot en door over de bodem van deze grot te golven geleiden ze toch elektrische stroom. Materialen met deze eigenschap worden halfgeleiders genoemd omdat ze alleen bij hoge temperaturen elektriciteit geleiden.
Dit brengt ons bij de tweede interessante eigenschap van EuO: EuO is een halfgeleider. Op zich is dit niets bijzonders, er bestaan vele halfgeleiders, maar een ferromagnetische halfgeleider is zeer zeldzaam. Het is zelfs zo dat het bestaan van materialen die zowel ferromagnetisch als halfgeleidend zijn sterk betwijfeld werd voor de ontdekking van EuO in het begin van de zestiger jaren. De excentriciteit van zulke materialen kan begrepen worden als we de voorwaarden beter bekijken. Ten eerste moet het materiaal meer spin-op dan spin-neer elektronen bevatten en ten tweede moeten alle grotten vol of leeg zijn omdat het anders een geleider is. Deze combinatie van factoren kan alleen voorkomen als er meer spin-op grotten volledig gevuld zijn dan spin-neer grotten. Daarom moet de exchange zo groot zijn dat het verschil in diepte tussen een spin-op en neer grot groter is dan de afstand tussen de bodem en het plafond van deze grot. Natuurkundigen noemen het grottenstelsel van een vaste stof de toestandsdichtheid en een grot wordt een band genoemd. We zullen daarom verder deze termen gebruiken.
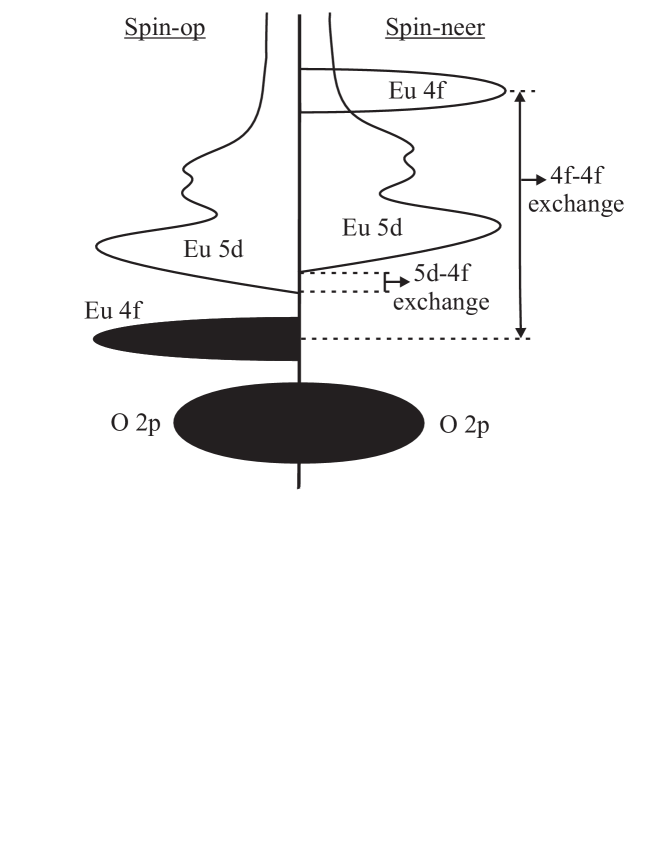
Een belangrijk resultaat van het onderzoek dat in hoofdstuk 4 van dit proefschrift beschreven wordt, is dat het ons gelukt is om de toestandsdichtheid van EuO te meten voor zowel spin-op als spin-neer elektronen. Om de gevulde banden van EuO te meten hebben we gebruik gemaakt van de fotoëmissie techniek. Bij deze techniek wordt het materiaal beschenen met fotonen (lichtdeeltjes) van een precies bekende energie. De energie van de fotonen kan gebruikt worden om een elektron uit het materiaal te schieten. Door nu de energie van het elektron buiten het materiaal te meten, kunnen we bepalen hoeveel energie verloren is gegaan bij het verwijderen van het elektron uit zijn band, waardoor we weten hoe diep de band ligt waarin het elektron zich bevond. Door bovendien de spin van het elektron te meten kunnen we de bezette toestandsdichtheid bepalen van zowel de spin-op als spin-neer elektronen.
Het is veel lastiger om de onbezette toestandsdichtheid voor verschillende spins te meten, omdat een onbezette toestand alleen gemeten kan worden door hem eerst te bezetten met een elektron. Bovendien moeten de energie en spin van zo’n sonde-elektron nauwkeurig bepaald zijn. Om dit te doen hebben we een nieuwe spectroscopische techniek ontwikkeld: spin afhankelijke röntgen absorptie spectroscopie. Deze techniek werkt als volgt: we gebruiken weer een röntgen-foton met een bekende energie, die een sonde-elektron vanuit een diepe band101010Er bestaat ook een andere techniek om de onbezette toestanden te meten: inverse fotoëmissie. Deze techniek maakt gebruik van een sonde-elektron dat van buiten op het materiaal wordt geschoten. Beide technieken hebben hun voor- en nadelen. omhoog schiet naar één van de onbezette banden (welke onbezette band bereikt wordt, kan geregeld worden met de energie van het foton). Er blijft nu een gat over dat zich in het spin-op of spin-neer kanaal van de diepe band bevindt afhankelijk van de spin van het sonde-elektron. Om te bepalen wat de spin van de onbezette band is, moeten we de spin van het sonde-elektron meten. Hiervoor maken we gebruik van een proces waarbij een elektron naar beneden valt om het achtergelaten gat in de diepe band te vullen. Dit gat kan namelijk alleen opgevuld worden als het elektron dezelfde spin heeft als het gat. De energie die dit elektron hierbij wint, gebruikt het om een ander elektron met de omgekeerde spin uit het materiaal te lanceren,111111Dit kan vergeleken worden met een acrobaat die op een wip-wap springt en zo een andere acrobaat die op zijn kop staat lanceert. waarna we de spin van dit gelanceerde elektron detecteren. De spin van het elektron dat uit het materiaal komt, is dus omgekeerd aan dat van het gat dat achtergelaten was en daarom ook omgekeerd aan de spin van de onbezette band waarnaar het sonde-elektron was geschoten (zie figuur 4.3 voor een schema van deze techniek). Door nu bij veel verschillende foton energieën de spin van deze elektronen die uit het materiaal komen te meten, kunnen we de spin-afhankelijke toestandsdichtheid van de onbezette banden bepalen.
Een schematische weergave van de aldus bepaalde spin-afhankelijke toestandsdichtheid in EuO van zowel de bezette als onbezette banden is gegeven in figuur 9.1. De banden zijn gemerkt met Eu of O om aan te geven of de elektronen in de band zich vooral in de buurt van de europium of de zuurstof atoomkernen bevinden. Bovendien is er een index (, of ), die aangeeft in wat voor soort banen de elektronen in de band om de atoomkern bewegen. Onze metingen laten zien dat het ferromagnetisme in EuO inderdaad samengaat met een groter aantal spin-op dan spin-neer elektronen in de band. Bovendien is het duidelijk dat EuO een halfgeleider is, aangezien de scheidslijn tussen bezette en onbezette toestanden (het Fermi-oppervlak) zich niet in een band bevindt, maar tussen de geheel gevulde spin-op en de lege Eu banden ligt. Het grote verschil in energie tussen de spin-op en spin-neer band is grotendeels een gevolg van de grote exchange wisselwerking tussen deze elektronen. Een opmerkelijk resultaat is echter dat we ook een energieverschuiving tussen de onbezette spin-op en spin-neer banden waarnemen. We schrijven deze verschuiving toe aan de exchange wisselwerking tussen de band en de elektronen in de band. Ofschoon de elektronen andere banen beschrijven die een stuk verder van de Eu kernen liggen dan de banen van de elektronen, komen ze toch nog behoorlijk dicht bij de elektronen. Daarom is er ook een exchange effect tussen de en elektronen, alhoewel dit ongeveer een faktor 10 kleiner is dan dat tussen de elektronen onderling. De exchange tussen en elektronen is grotendeels verantwoordelijk voor de interessante optische en elektrische eigenschappen van EuO en de studie van de kenmerken, oorzaken en gevolgen van deze exchange loopt dan ook als een rode draad door dit proefschrift.
De optische eigenschappen van EuO zijn interessant omdat de kleur van EuO aanzienlijk verandert als het ferromagnetisch wordt. Deze kleurverandering is geïnter-preteerd als een gevolg van de exchange. Om een beter beeld van de veranderingen in de exchange te krijgen hebben we de toestandsdichtheid bij veel temperaturen gemeten met röntgen absorptie spectroscopie. We vonden aanwijzingen dat de energieverschuiving tussen de spin-op en spin-neer band niet zozeer een resultaat is van de exchange tussen een -elektron met elektronen op hetzelfde atoom (zoals bij de exchange), maar dat de exchange voor zo’n 75% het gevolg is van de wisselwerking tussen een -elektron en de elektronen op een groot aantal verschillende Eu atomen. Dit komt doordat een elektron niet sterk gebonden wordt aan één atoom, maar vrij is om zich door het EuO rooster te verplaatsen. Daardoor komt het in de buurt van veel verschillende Eu atomen en heeft dus ook een exchange bijdrage van de elektronen van al deze atomen. De consequentie hiervan is, dat als de spins van de afzonderlijke atomen zich in willekeurige richtingen gaan bewegen, boven de Curie temperatuur, de gemiddelde bijdrage aan de exchange van het elektron naar nul gaat. Daarom is de energieverschuiving als gevolg van de exchange, evenredig met de magnetisatie van EuO121212De magnetisatie geeft aan hoe groot het verschil is tussen het aantal spin-op en spin-neer -elektronen. Bij een ferromagnetisch materiaal is de magnetisatie 100% (dat wil zeggen: alle -elektronen zijn spin-op) bij temperaturen ver onder de Curie temperatuur en is de magnetisatie nul boven de Curie temperatuur. De magnetisatie kan echter vergroot worden door het materiaal in een magneetveld te plaatsen..
De kleurverandering van EuO bij de Curie temperatuur is een gevolg van de temperatuurafhankelijkheid van de exchange, omdat de kleur sterk bepaald wordt door de absorptie van een foton door een elektron, dat de energie van het foton gebruikt om in een hogere band te komen. De laagste energie waarbij dit proces kan plaatsvinden is gelijk aan het energieverschil tussen het plafond van de band en de bodem van de band. De verschuiving van de band als gevolg van exchange verkleint dit energieverschil en resulteert dus in een kleurverandering131313De grote effecten van een extern magneetveld en de licht-polarisatie op de kleur van EuO worden in hoofdstuk 2 gemodelleerd en uitgerekend..
Misschien wel het meest spectaculaire effect treedt op in de geleidingseigenschappen van EuO. Als EuO iets meer europium dan zuurstof atomen bevat (Eu-rijk EuO), ontstaat er een klein aantal, volledig gevulde toestanden, die zich vlak onder de band bevindt. Deze toestanden ontstaan doordat elk zuurstof atoom normaliter twee elektronen van een europium atoom naar zich toe trekt. Als er echter meer europium dan zuurstof atomen zijn, blijven er een aantal elektronen op europium over, die niet naar het zuurstof gaan. De toestanden die door deze elektronen gevormd worden zijn volledig gevuld, waardoor Eu-rijk EuO boven de Curie temperatuur nog steeds een halfgeleider is. Als de Eu band echter gaat verschuiven als gevolg van exchange, kruist hij deze extra toestanden, waardoor de elektronen uit deze toestanden vrijkomen. De toestanden smelten namelijk samen met de band en er ontstaat een veel grotere band, waarin zich alleen het kleine aantal elektronen bevindt dat eerst in de extra toestanden zat. De grotere band is nu dus slechts voor een klein deel gevuld waardoor er golven kunnen stromen. Daarom gaat Eu-rijk EuO zich als een geleider gedragen beneden de Curie temperatuur. Zo’n overgang waarbij een materiaal verandert van halfgeleider naar geleider, wordt wel een halfgeleider-metaal of isolator-metaal overgang genoemd. Deze overgang is bijzonder spectaculair bij EuO, omdat de weerstand met een faktor van meer dan een biljoen kan veranderen. In hoofdstuk 7 presenteren we metingen van deze metaal-isolator overgang in EuO lagen, die een goede overeenkomst vertonen met een model op basis van de bovenstaande beschrijving. Bovendien laten we in dit hoofdstuk metingen zien die aantonen dat een gelijksoortige isolator-metaal overgang geïnduceerd kan worden in EuO, dat evenveel Eu als O atomen bevat, als dit beschenen wordt door een lichtbundel. Ook hebben we de geleidingseigenschappen van Eu-rijk EuO bij verschillende aangelegde magneetvelden bestudeerd. Zeer opmerkelijk was de ontdekking dat de elektrische geleiding alleen afhangt van de magnetisatie, onafhankelijk van het feit of deze geïnduceerd is door het materiaal af te koelen of door het aanleggen van een magneetveld. Deze universele afhankelijkheid van de elektrische geleiding van alleen de magnetisatie is een sterke aanwijzing dat de geleidingseigenschappen van EuO voornamelijk veroorzaakt worden door de geïnduceerde exchange interactie, zoals in het berekende model.
Het onderzoek in dit proefschrift heeft geleid tot een beter begrip van de spin- en temperatuurafhankelijke toestandsdichtheid van de ferromagnetische halfgeleider EuO en de relatie hiervan met de optische, elektrische, opto-elektrische en magneto-elektrische eigenschappen. Daarbij hebben we het groeimechanisme voor EuO dunne lagen ontwikkeld en verklaard en is een nieuwe spectroscopische techniek ontwikkeld. Het onderzoek roept echter ook nieuwe vragen over EuO op (zie met name hoofdstuk 1 en 7). Bovendien zou het zeer interessant zijn om te onderzoeken of de mechanismen die de eigenschappen van EuO bepalen, ook verantwoordelijk zijn voor vergelijkbare fenomenen in andere materialen. Ik hoop daarom dat dit proefschrift niet alleen een bijdrage aan het begrip van EuO heeft geleverd, maar ook een steun en impuls zal zijn voor toekomstig fundamenteel en toegepast onderzoek met EuO en gelijksoortige materialen.
References
- Heisenberg [1928] W. Heisenberg, Z. Phys. 49, 619 (1928).
- van Vleck [1938] J. H. van Vleck, J. Chem. Phys. 6, 105 (1938).
- Methfessel and Mattis [1968] S. Methfessel and D. C. Mattis, in Encyclopedia of Physics, edited by S. Flügge and H. P. J. Wijn (1968), vol. 18/1, p. 389.
- Kasuya and Yanase [1968] T. Kasuya and A. Yanase, Rev. Mod. Phys. 40, 684 (1968).
- Haas [1970] C. Haas, CRC Critical Reviews on Solid State Sciences 1, 47 (1970).
- Wachter [1972] P. Wachter, CRC Critical Reviews on Solid State Sciences 3, 189 (1972).
- Kasuya [1972] T. Kasuya, CRC Critical Reviews on Solid State Sciences 3, 131 (1972).
- Wachter [1979] P. Wachter, in Handbook on the Physics and Chemistry of Rare Earths, edited by K. A. Gschneider, Jr. and L. Eyring (1979), chap. 19, p. 507.
- Nolting [1979] W. Nolting, Phys. Stat. Sol. (b) 96, 11 (1979).
- Mauger and Godart [1986] A. Mauger and C. Godart, Phys. Rep. 141, 51 (1986).
- Tsuda et al. [1991] N. Tsuda, K. Nasu, A. Yanase, and K. Siratori, Electronic Conduction in Oxides (Springer Verlag, Berlin, 1991), vol. 94 of Springer Series in Solid-State Sciences, chap. 4.9, pp. 229–244.
- Nagaev [2001] E. L. Nagaev, Phys. Rep. 346, 387 (2001).
- Levy [1969] F. Levy, Physik Kondens. Materie 10, 71 (1969).
- Guerci and Shafer [1966] C. F. Guerci and M. W. Shafer, J. Appl. Phys. 37, 1406 (1966).
- Shafer et al. [1972] M. W. Shafer, J. B. Torrance, and T. Penney, J. Phys. Chem. Solids 33, 2251 (1972).
- Fischer et al. [1993] K. J. Fischer, U. Köbler, B. Stroka, K. Bickmann, and H. Wenzl, J. Crystal Growth 128, 846 (1993).
- Holmes and Schieber [1966] L. Holmes and M. Schieber, J. Appl. Phys. 37, 968 (1966).
- Holmes and Schieber [1968] L. Holmes and M. Schieber, Phys. Rev. 167, 449 (1968).
- Batlogg et al. [1975] B. Batlogg, E. Kaldis, A. Schlegel, and P. Wachter, Phys. Rev. B 12, 3940 (1975).
- Ahn and Suits [1967] K. Y. Ahn and J. C. Suits, IEEE Transactions on Magnetics MAG-3, 453 (1967).
- Ahn and McGuire [1968] K. Y. Ahn and T. R. McGuire, J. Appl. Phys. 39, 5061 (1968).
- Ahn and Shafer [1970] K. Y. Ahn and M. W. Shafer, J. Appl. Phys. 41, 1260 (1970).
- Lee and Suits [1970] K. Lee and J. C. Suits, J. Appl. Phys. 41, 954 (1970).
- Paparoditis et al. [1971] C. Paparoditis, R. Suryanarayanan, C. Llinares, E. Monteil, and G. Bordure, Sol. State Commun. 9, 1871 (1971).
- Massenet et al. [1974] O. Massenet, Y. Capiomont, and N. Van Dang, J. Appl. Phys. 45, 3593 (1974).
- Lubecka and Wegrzyn [1987] M. Lubecka and A. Wegrzyn, Vacuum 37, 111 (1987).
- Guanghua and Batalla [1996] Y. Guanghua and E. Batalla, J. Mat. Res. 11, 2470 (1996).
- Konno et al. [1998] T. J. Konno, K. Wakoh, K. Sumiyama, and K. Suzuki, Jpn. J. Appl. Phys. 37, L787 (1998).
- Iwata et al. [2000a] N. Iwata, G. Pindoria, T. Morishita, and K. Kohn, J. Phys. Soc. Jpn. 69, 230 (2000a).
- Iwata et al. [2000b] N. Iwata, T. Morishita, and K. Kohn, J. Phys. Soc. Jpn. 69, 1745 (2000b).
- Mauger et al. [1978] A. Mauger, C. Godart, M. Escorne, J. C. Achard, and J. P. Desfours, J. Phys. (Paris) 39, 1125 (1978).
- Fazekas [1999] P. Fazekas, Lecture notes on electron correlation and magnetism (World Scientific Publishing, Singapore, 1999).
- Fisher [1967] M. E. Fisher, Repts. Prog. Phys. 30, 615 (1967).
- Ashcroft and Mermin [1976] N. W. Ashcroft and N. D. Mermin, Solid State Physics (1976).
- Kornblit et al. [1973] A. Kornblit, G. Ahlers, and E. Buehler, Phys. Lett. A 43, 531 (1973).
- Köbler and Fischer [1975] U. Köbler and K. J. Fischer, Z. Phys. B 20, 391 (1975).
- Bozorth [1951] R. M. Bozorth, Ferromagnetism (Princeton, 1951).
- Dietrich et al. [1975] O. W. Dietrich, A. J. Henderson Jr., and H. Meyer, Phys. Rev. B 12, 2844 (1975).
- Stoner [1938] E. C. Stoner, Proc. Roy. Soc. Lond. A 165, 372 (1938).
- Held and Vollhardt [1998] K. Held and D. Vollhardt, Eur. Phys. J. B 5, 473 (1998).
- Zener [1951a] C. Zener, Phys. Rev. 81, 440 (1951a).
- Zener [1951b] C. Zener, Phys. Rev. 82, 403 (1951b).
- Ruderman and Kittel [1954] M. A. Ruderman and C. Kittel, Phys. Rev. 96, 99 (1954).
- Kasuya [1956] T. Kasuya, Progr. Theor. Phys. 16, 45 (1956).
- Yosida [1957] K. Yosida, Phys. Rev. 106, 893 (1957).
- Jensen and Mackintosh [1991] J. Jensen and A. R. Mackintosh, Rare Earth Magnetism (Clarendon Press, Oxford, 1991).
- Kramers [1934] H. A. Kramers, Physica 1, 182 (1934).
- Bloembergen and Rowland [1955] N. Bloembergen and T. J. Rowland, Phys. Rev. 97, 1679 (1955).
- Tsubokawa [1960] I. Tsubokawa, J. Phys. Soc. Japan 15, 1664 (1960).
- Matthias et al. [1961] B. T. Matthias, R. M. Bozorth, and J. H. van Vleck, Phys. Rev. Lett. 7, 160 (1961).
- Griessen et al. [1971] R. Griessen, M. Landolt, and H. R. Ott, Solid State Commun. 9, 2219 (1971).
- Passel et al. [1976] L. Passel, O. W. Dietrich, and J. Als-Nielsen, Phys. Rev. B 14, 4897 (1976).
- Kasuya [1970] T. Kasuya, IBM J. Res. Develop. 14, 214 (1970).
- Kocharyan and Khomskii [1975] A. N. Kocharyan and D. I. Khomskii, Sov. Phys. Solid State 17, 290 (1975).
- Khomskii and Sawatzky [1997] D. I. Khomskii and G. A. Sawatzky, Solid State Commun. 102, 87 (1997).
- [56] I. Elfimov et al., to be published.
- Holtzberg et al. [1964] F. Holtzberg, T. R. McGuire, S. Methfessel, and J. C. Suits, Phys. Rev. Lett. 13, 18 (1964).
- Holtzberg et al. [1966] F. Holtzberg, T. R. McGuire, and S. Methfessel, J. Appl. Phys. 37, 976 (1966).
- Lee and Suits [1971] K. Lee and J. C. Suits, Phys. Lett. A 34, 141 (1971).
- Bayer and Zinn [1971] E. Bayer and W. Zinn, Z. Angew. Phys. 32, 83 (1971).
- Shafer and McGuire [1968] M. W. Shafer and T. R. McGuire, J. Appl. Phys. 39, 588 (1968).
- Mauger et al. [1980] A. Mauger, M. Escorne, C. Godart, J. Desfours, and J. Achard, J. de Phys. C5 41, 263 (1980).
- Godart et al. [1980] C. Godart, A. Mauger, J. Desfours, and J. Achard, J. Phys. (Paris) 41, C5 (1980).
- Schoenes and Wachter [1974] J. Schoenes and P. Wachter, Phys. Rev. B 9, 3097 (1974).
- Torrance et al. [1972a] J. B. Torrance, M. W. Shafer, and T. R. McGuire, Phys. Rev. Lett. 29, 1168 (1972a).
- [66] D. I. Khomskii, private communications.
- Freiser et al. [1968a] M. J. Freiser, F. Holtzberg, S. Methfessel, G. D. Petit, M. W. Shafer, and J. C. Suits, Helv. Phys. Acta 41, 832 (1968a).
- McGuire and Holtzberg [1973] T. R. McGuire and F. Holtzberg, A. I. P. Conf. Proc. 10, 855 (1973).
- de Gennes [1958] P. G. de Gennes, Comptes Rendus 247, 1836 (1958).
- Mauger [1977] A. Mauger, Phys. Stat. Sol. (b) 84, 761 (1977).
- Santos and Nolting [2002] C. Santos and W. Nolting, Phys. Rev. B 65, 144419 (2002).
- Kovalenko and Nagaev [1986] V. F. Kovalenko and E. L. Nagaev, Sov. Phys. Usp. 29, 297 (1986).
- Nagaev [1988] E. L. Nagaev, Phys. Stat. Sol. (b) 145, 11 (1988).
- Ohno et al. [2000] H. Ohno, D. Chiba, F. Matsukura, T. Omiya, E. Abe, T. Dietl, Y. Ohno, and K. Ohtani, Nature 408, 944 (2000).
- Güntherodt [1974] G. Güntherodt, Phys. Cond. Matter 18, 37 (1974).
- Busch et al. [1964] G. Busch, P. Junod, and P. Wachter, Phys. Lett. 12, 11 (1964).
- Wang et al. [1986] H. Wang, J. Schoenes, and E. Kaldis, Helv. Phys. Acta 59, 102 (1986).
- Tu et al. [1972] K. N. Tu, K. Y. Ahn, and J. C. Suits, IEEE Trans. Mag. MAG-8, 651 (1972).
- Uspenskii and Harmon [2000] Y. A. Uspenskii and B. N. Harmon, Phys. Rev. B 61, R10571 (2000).
- Salghetti-Drioli et al. [1999] F. Salghetti-Drioli, K. Mattenberger, P. Wachter, and L. Degiorgi, Solid State Commun. 109, 687 (1999).
- Salghetti-Drioli [1999] F. Salghetti-Drioli, Ph.D. thesis (1999), eTH Zurich, http://e-collection.ethbib.ethz.ch/show?type=diss&nr=13393.
- Suits and Lee [1971] J. C. Suits and K. Lee, J. Appl. Phys. 42, 3258 (1971).
- Eastman et al. [1969] D. E. Eastman, F. Holtzberg, and S. Methfessel, Phys. Rev. Lett. 23, 226 (1969).
- Busch et al. [1969] G. Busch, P. Cotti, and P. Munz, Sol. State Commun. 7, 795 (1969).
- Eastman and Kuznietz [1971] D. E. Eastman and M. Kuznietz, J. Appl. Phys. 42, 1396 (1971).
- Cotti and Munz [1972] P. Cotti and P. Munz, Helv. Phys. Acta 45, 19 (1972).
- Lang et al. [1981] J. K. Lang, Y. Baer, and P. A. Cox, J. Phys. F 11, 121 (1981).
- van der Marel [1985] D. van der Marel, Ph.D. thesis (1985), university of Groningen.
- van der Marel and Sawatzky [1988] D. van der Marel and G. A. Sawatzky, Phys. Rev. B 37, 10674 (1988).
- Sattler and Siegmann [1972] K. Sattler and H. C. Siegmann, Phys. Rev. Lett. 29, 1565 (1972).
- Sattler and Siegmann [1975] K. Sattler and H. C. Siegmann, Z. Phys. B 20, 289 (1975).
- Rys et al. [1967] F. Rys, J. S. Helman, and W. Baltensperger, Phys. Kondens. Mater. 6, 105 (1967).
- Alexander et al. [1976] S. Alexander, J. S. Helman, and I. Balberg, Phys. Rev. B 13, 304 (1976).
- Haas [1968] C. Haas, Phys. Rev. 168, 531 (1968).
- Schiller et al. [2001a] R. Schiller, W. Muller, and W. Nolting, Phys. Rev. B 64, 134409 (2001a).
- Schiller et al. [2001b] R. Schiller, O. Myrasov, A. J. Freeman, and W. Nolting, J. Magn. Magn. Mat. 226-230, 388 (2001b).
- Schiller and Nolting [2001a] R. Schiller and W. Nolting, Sol. State Commun. 118, 173 (2001a).
- Schiller and Nolting [2001b] R. Schiller and W. Nolting, Phys. Rev. Lett. 86, 3847 (2001b).
- Shapira et al. [1973a] Y. Shapira, S. Foner, and T. Reed, Phys. Rev. B 8, 2299 (1973a).
- Penney et al. [1972] T. Penney, M. W. Shafer, and J. B. Torrance, Phys. Rev. B 5, 3669 (1972).
- Llinares et al. [1975] C. Llinares, L. Gouskov, C. Duchemin, and G. Bordure, J. Phys. Chem. Solids 36, 567 (1975).
- Samokhvalov et al. [1974] A. A. Samokhvalov, A. Y. Afanas’ev, B. A. Gizhevskii, N. N. Loshkareva, and M. Simonova, Sov. Phys. Solid State 16, 365 (1974).
- Oliver et al. [1972] M. R. Oliver, J. O. Dimmock, A. L. McWhorter, and T. B. Reed, Phys. Rev. B 5, 1078 (1972).
- Hundley et al. [1995] M. F. Hundley, M. Hawley, R. H. Heffner, Q. X. Jia, J. J. Neumeier, J. Tesmer, J. D. Thompson, and X. D. Wu, Appl. Phys. Lett. 67, 860 (1995).
- van Santen and Jonker [1950] J. H. van Santen and G. H. Jonker, Physica 16, 599 (1950).
- Lehmann [1967] H. W. Lehmann, Phys. Rev. 163, 488 (1967).
- Guy et al. [1980] C. N. Guy, S. von Molnar, J. Etourneau, and Z. Fisk, Sol. State Commun. 33, 1055 (1980).
- Matsukura et al. [1998] F. Matsukura, H. Ohno, A. Shen, and Y. Sugawara, Phys. Rev. B 57, R2037 (1998).
- Jayaraman [1979] A. Jayaraman, in Handbook on the Physics and Chemistry of Rare Earths, edited by K. A. Gschneider, Jr. and L. Eyring (1979), chap. 20, p. 575.
- Wachter [1969] P. Wachter, Solid State Commun. 7, 693 (1969).
- Zimmer et al. [1984] H. G. Zimmer, K. Takemura, K. Syassen, and K. Fisher, Phys. Rev. B 29, 2350 (1984).
- Abd-Elmeguid and Taylor [1990] M. M. Abd-Elmeguid and R. D. Taylor, Phys. Rev. B 42, 1048 (1990).
- DiMarzio et al. [1987] D. DiMarzio, M. Croft, N. Sakai, and M. W. Shafer, Phys. Rev. B 35, 8891 (1987).
- Etourneau et al. [1980] J. Etourneau, B. Chevalier, P. Hagenmuller, and R. Georges, J. de Physique C5 41, 357 (1980).
- Stachow-Wojcik et al. [1999] A. Stachow-Wojcik, T. Story, W. Dobrowolski, A. Arciszewska, R. R. Galazka, M. W. Kreijveld, C. H. W. Swüste, H. J. M. Swagten, W. J. M. de Jonge, A. Twardowski, et al., Phys. Rev. B 60, 15220 (1999).
- Brauer [1953] G. Brauer, Angew. Chem. 65, 261 (1953).
- Eick et al. [1956] H. A. Eick, N. C. Baenziger, and L. Eyring, J. Am. Chem. Soc. 78, 5147 (1956).
- [118] D. J. Huang, J. Chen, C. F. Chang, W. P. Wu, S. C. Chung, A. Tanaka, G. Y. Guo, H. J. Lin, S. G. Shyu, C. C. Wu, et al., submitted for publication.
- Fiederling et al. [1999] R. Fiederling, M. Keim, G. Reuscher, W. Ossau, G. Schmidt, A. Waag, and L. W. Molenkamp, Nature (London) 402, 787 (1999).
- Ohno et al. [1999] Y. Ohno, D. K. Young, B. Beschoten, F. Matsukara, H. Ohno, and D. D. Awschalom, Nature (London) 402, 790 (1999).
- Filip et al. [2000] A. T. Filip, B. H. Hoving, F. J. Jedema, B. J. van Wees, B. Dutta, and S. Borghs, Phys. Rev. B 62, 9996 (2000).
- Herman and Sitter [1996] M. A. Herman and H. Sitter, Molecular Beam Epitaxy, vol. 7 of Springer Series in Materials Science (Springer-Verlag, New York, 1996), 2nd ed.
- Yang and Scheinfein [1993] Z. J. Yang and M. R. Scheinfein, J. Appl. Phys. 74, 6810 (1993).
- Schulte et al. [2001a] K. Schulte, M. A. James, P. G. Steeneken, G. A. Sawatzky, R. Suryanarayanan, G. Dhalenne, and A. Revcolevschi, Phys. Rev. B 63, 165429 (2001a).
- Schulte [2002] K. H. G. Schulte, Ph.D. thesis (2002), university of Groningen, http://www.ub.rug.nl/eldoc/dis/science/k.h.g.schulte.
- Schulte et al. [2001b] K. Schulte, M. A. James, L. H. Tjeng, P. G. Steeneken, G. A. Sawatzky, R. Suryanarayanan, G. Dhalenne, and A. Revcolevschi, Phys. Rev. B 64, 134428 (2001b).
- Mizokawa et al. [2001] T. Mizokawa, L. H. Tjeng, P. G. Steeneken, N. B. Brookes, I. Tsukada, T. Yamamoto, and K. Uchinokura, Phys. Rev. B 64, 115104 (2001).
- Minár et al. [2001] J. Minár, H. Ebert, L. H. Tjeng, P. Steeneken, G. Ghiringhelli, O. Tjernberg, and N. B. Brookes, Appl. Phys. A 73, 663 (2001).
- [129] O. Tjernberg, L. H. Tjeng, P. G. Steeneken, G. Ghiringhelli, A. A. Nugroho, A. A. Menovsky, and N. B. Brookes, submitted for publication.
- Ghiringhelli et al. [2002] G. Ghiringhelli, N. B. Brookes, L. H. Tjeng, T. Mizokawa, O. Tjernberg, P. G. Steeneken, and A. A. Menovsky, Physica B 312-313, 34 (2002).
- Hüfner [1995] S. Hüfner, Photoelectron Spectroscopy (Springer-Verlag, Berlin, 1995).
- Sawatzky [a] G. A. Sawatzky, lecture notes on photoemission.
- Sawatzky [b] G. A. Sawatzky, lecture notes on Auger Spectroscopy, http://vsf1.phys.rug.nl/~surphys/lectures/auger.pdf.
- de Groot [2001] F. M. F. de Groot, Chem. Rev. 101, 1779 (2001).
- Lüth [1993] H. Lüth, Surfaces and Interfaces of Solids (Springer, Berlin, 1993), 2nd ed.
- Wooten [1972] F. Wooten, Optical Properties of Solids (Academic Press, New York, 1972).
- Reim and Schoenes [1990] W. Reim and J. Schoenes, in Ferromagnetic Materials, edited by K. H. J. Buschow and E. P. Wohlfarth (1990), vol. 5, chap. 2, p. 133.
- Hesper [2000] R. Hesper, Ph.D. thesis (2000), university of Groningen, http://www.ub.rug.nl/eldoc/dis/science/r.hesper.
- Altieri [1999] S. Altieri, Ph.D. thesis (1999), university of Groningen.
- Ghiringhelli et al. [1999] G. Ghiringhelli, K. Larsson, and N. B. Brookes, Rev. Sci. Instrum. 70, 4225 (1999).
- Ghiringhelli [2002] G. Ghiringhelli, Ph.D. thesis (2002), université Joseph Fourier - Grenoble I, http://www.dissertation.de/PDF/gg532.pdf.
- Cho [1970] S. J. Cho, Phys. Rev. B 1, 4589 (1970).
- Sugar and Spector [1974] J. Sugar and N. Spector, J. Opt. Soc. Am. 64, 1484 (1974).
- Freiser et al. [1968b] M. J. Freiser, S. Methfessel, and F. Holtzberg, J. Appl. Phys. 39, 900 (1968b).
- Schoenes [1975] J. Schoenes, Z. Physik B 20, 345 (1975).
- Schoenes and Reim [1985] J. Schoenes and W. Reim, J. Less-Common Metals 112, 19 (1985).
- Weakliem [1972] H. A. Weakliem, Phys. Rev. B 6, 2743 (1972).
- Weakliem et al. [1970] H. A. Weakliem, C. H. Anderson, and E. S. Sabisky, Phys. Rev. B 2, 4354 (1970).
- Dimmock et al. [1970] J. O. Dimmock, J. Hanus, and J. Feinleib, J. Appl. Phys. 41, 1088 (1970).
- Shen [1964a] Y. R. Shen, Phys. Rev. 133, A511 (1964a).
- Shen and Bloembergen [1964] Y. R. Shen and N. Bloembergen, Phys. Rev. 133, A515 (1964).
- Shen [1964b] Y. R. Shen, Phys. Rev. 134, A661 (1964b).
- Ferre et al. [1972] J. Ferre, B. Briat, C. Paparoditis, S. Pokrzywnicki, and R. Suryanarayanan, Sol. State Commun. 11, 1173 (1972).
- Ferré [1972] J. Ferré, J. Phys. (Paris) 35, 781 (1972).
- Gasiorowicz [1974] S. Gasiorowicz, Quantum Physics (John Wiley & Sons, New York, 1974).
- Sugano et al. [1970] S. Sugano, Y. Tanabe, and H. Kamimura, Multiplets of transition-metal ions in crystals (Academic Press, New York and London, 1970).
- Shafer et al. [1963] M. W. Shafer, T. R. McGuire, and J. C. Suits, Phys. Rev. Lett. 11, 251 (1963).
- Suits et al. [1966] J. C. Suits, B. E. Argyle, and M. J. Freiser, J. Appl. Phys. 37, 1391 (1966).
- Greiner and Fan [1966] J. H. Greiner and G. J. Fan, Appl. Phys. Lett. 9, 27 (1966).
- Oppeneer and Antonov [1996] P. M. Oppeneer and V. N. Antonov, in Spin-Orbit Influenced Spectroscopies of Magnetic Materials (Springer Lecture Notes in Physics), edited by H. Ebert and G. Schütz (1996), pp. 29–47.
- Hao et al. [1990] X. Hao, J. Moodera, and R. Meservey, Phys. Rev. B 42, 8235 (1990).
- Olson et al. [1995] C. G. Olson, X. Wu, Z.-L. Chen, and D. W. Lynch, Phys. Rev. Lett. 74, 992 (1995).
- Wahl et al. [1999] R. Wahl, W. Schneider, S. L. Molodtsov, S. Dänzenbacher, C. Laubschatz, M. Richter, and E. Weschke, Phys. Rev. Lett. 82, 670 (1999).
- Bischof et al. [1983] R. Bischof, E. Kaldis, and P. Wachter, J. Magn. Magn. Mat. 31-34, 255 (1983).
- Gasgnier et al. [1974] M. Gasgnier, J. Ghys, G. Schiffmacher, C. Henry la Banchetais, P. E. Caro, C. Boulesteix, C. Loier, and B. Pardo, J. Less-Common Met. 34, 131 (1974).
- Ogasawara et al. [1994] H. Ogasawara, A. Kotani, and B. T. Thole, Phys. Rev. B 50, 12332 (1994).
- Orchard and Thornton [1978] A. F. Orchard and G. Thornton, J. Electron Spectrosc. Relat. Phenom. 13, 27 (1978).
- Kowalczyk et al. [1974] S. P. Kowalczyk, N. Edelstein, F. R. McFeely, L. Ley, and D. A. Shirley, Chem. Phys. Lett. 29, 491 (1974).
- Curry et al. [1960] M. A. Curry, S. Legvold, and F. H. Spedding, Phys. Rev. 117, 953 (1960).
- Neave and Joyce [1983] J. H. Neave and B. A. Joyce, Appl. Phys. Lett. 31, 1 (1983).
- Bas et al. [1974] E. B. Bas, U. Bänninger, and H. Mülethaler, Jpn. J. Appl. Phys. Suppl. 2, 671 (1974).
- Grazhulis et al. [1988] V. A. Grazhulis, A. M. Ionov, and V. F. Kuleshov, Appl. Surf. Sci. 33/34, 81 (1988).
- Stoner and Wohlfarth [1948] E. C. Stoner and E. P. Wohlfarth, Phil. Trans. Roy. Soc. A 240, 599 (1948).
- Arthur [1968] J. R. Arthur, J. Appl. Phys. 39, 4032 (1968).
- Steeneken et al. [2002] P. G. Steeneken, L. H. Tjeng, I. Elfimov, G. A. Sawatzky, G. Ghiringhelli, N. B. Brookes, and D. J. Huang, Phys. Rev. Lett. 88, 047201 (2002).
- Shapira et al. [1973b] Y. Shapira, S. Foner, and T. Reed, Phys. Rev. B 8, 2316 (1973b).
- Ramirez [1997] A. P. Ramirez, J. Phys.: Conden. Matter 9, 8171 (1997).
- Imada et al. [1998] M. Imada, A. Fujimori, and Y. Tokura, Rev. Mod. Phys. 70, 1039 (1998).
- Elleaume [1994] P. Elleaume, J. Synchrotron Radiat. 1, 19 (1994).
- Goulon et al. [1995] J. Goulon et al., Physica B 208, 199 (1995).
- Getzlaff et al. [1998] M. Getzlaff et al., Rev. Sci. Intrum. 69, 3913 (1998), equation (15).
- Tjeng et al. [1989] L. H. Tjeng et al., in Strong Correlation and Superconductivity, edited by H. Fukuyama, S. Maekawa, and A. P. Malozemoff (Springer Verlag, Berlin, 1989), vol. 89 of Springer Series in Solid-State Sciences, p. 33.
- Sawatzky [c] G. A. Sawatzky, lecture notes on Auger Spectroscopy, http://vsf1.phys.rug.nl/~surphys/lectures/auger.pdf.
- Fuggle [1981] J. C. Fuggle, in Electron Spectroscopy: Theory, Techniques and Applications, edited by C. R. Brundle and A. D. Baker (Academic Press, Londen and New York, 1981), vol. 4, p. 85.
- [185] A. Tanaka, private communication.
- Anisimov et al. [1991] V. I. Anisimov, J. Zaanen, and O. K. Andersen, Phys. Rev. B 44, 943 (1991).
- Schiller [2000] R. Schiller, Ph.D. thesis, Humboldt-Universität zu Berlin (2000), http://dochost.rz.hu-berlin.de/dissertationen/schiller-roland-2000-11-01/PDF/Schiller.pdf.
- Arai et al. [1973] T. Arai, M. Wakaki, S. Onari, K. Kudo, T. Satoh, and T. Tsushima, J. Phys. Soc. Japan 34, 68 (1973).
- Demin et al. [1999] R. V. Demin, L. Koroleva, and A. M. Balbashov, JETP Lett. 70, 314 (1999).
- Kim et al. [1992] B. Kim, A. B. Andrews, J. L. Erskine, K. J. Kim, and B. N. Harmon, Phys. Rev. Lett. 68, 1931 (1992).
- Li et al. [1995] D. Li, J. Pearson, S. D. Bader, D. N. McIlroy, C. Waldfried, and P. A. Dowben, Phys. Rev. B 51, 13895 (1995).
- Weschke et al. [1996] E. Weschke, C. Schüssler-Langeheine, R. Meier, A. V. Fedorov, K. Starke, F. Hübinger, and G. Kaindl, Phys. Rev. Lett. 77, 3415 (1996).
- Donath et al. [1996] M. Donath, B. Gubanka, and F. Passek, Phys. Rev. Lett. 77, 5138 (1996).
- Bode et al. [1999] M. Bode, M. Getzlaff, A. Kubetzka, R. Pascal, O. Pietzsch, and R. Wiesendanger, Phys. Rev. Lett. 83, 3017 (1999).
- Tober et al. [1998] E. D. Tober, F. J. Palomares, R. X. Ynzunza, R. Denecke, J. Morais, Z. Wang, G. Bino, J. Liesegang, Z. Hussain, and C. S. Fadley, Phys. Rev. Lett. 81, 2360 (1998).
- Kirschner et al. [1984] J. Kirschner, M. Glöbl, V. Dose, and H. Scheidt, Phys. Rev. Lett. 53, 612 (1984).
- Hulme [1932] H. R. Hulme, Proc. R. Soc. London A 135, 237 (1932).
- Schütz et al. [1987] G. Schütz, W. Wagner, W. Wilhelm, P. Kienle, R. Zeller, R. Frahm, and G. Materlik, Phys. Rev. Lett. 58, 737 (1987).
- Goedkoop [1989] J. Goedkoop, Ph.D. thesis (1989), university of Nijmegen.
- Erskine and Stern [1975] J. L. Erskine and E. A. Stern, Phys. Rev. B 12, 5016 (1975).
- Thole et al. [1985] B. T. Thole, G. van der Laan, and G. A. Sawatzky, Phys. Rev. Lett. 55, 2086 (1985).
- Stähler et al. [1993] S. Stähler, G. Schütz, and H. Ebert, Phys. Rev. B 47, 818 (1993).
- Chaboy et al. [1996] J. Chaboy, H. Maruyama, L. M. García, J. Bartolomé, K. Kobayashi, N. Kawamura, A. Marcelli, and L. Bozukov, Phys. Rev. B 54, R15637 (1996).
- Pellegrin et al. [1997] E. Pellegrin, L. H. Tjeng, F. M. F. de Groot, R. Hesper, G. A. Sawatzky, Y. Moritomo, and Y. Tokura, J. El. Spectr. Rel. Phen. 86, 115 (1997).
- Rogalev et al. [1999] A. Rogalev, J. Goulon, and C. Brouder, J. Phys: Condens. Matter 11, 1115 (1999).
- Anderson [1975] O. K. Anderson, Phys. Rev. B 12, 3060 (1975).
- Kuneš et al. [2001] J. Kuneš, P. M. Oppeneer, H.-C. Mertins, F.Schäfers, A. Gaupp, W. Gudat, and P. Novák, Phys. Rev. B 64, 174417 (2001).
- Cowan [1981] R. D. Cowan, The theory of atomic structure and spectra (University of California Press, Berkeley and Los Angeles, 1981).
- Fano [1969] U. Fano, Phys. Rev. 178, 131 (1969).
- Thole and van der Laan [1991] B. T. Thole and G. van der Laan, Phys. Rev. B 44, 12424 (1991).
- Ebert and Schwitalla [1997] H. Ebert and J. Schwitalla, Phys. Rev. B 55, 3100 (1997).
- [212] F. M. F. de Groot, private communications.
- Slater and Koster [1954] J. C. Slater and G. F. Koster, Phys. Rev. 94, 1498 (1954).
- Harrison [1980] W. A. Harrison, Electronic structure and the properties of solids (W. H. Freeman and Company, San Fransisco, 1980).
- Pen [1997] H. F. Pen, Ph.D. thesis (1997), university of Groningen, http://www.ub.rug.nl/eldoc/dis/science/h.f.pen.
- Suits [1963] J. Suits, Bull. Am. Phys. Soc. 8, 381 (1963).
- Heikes and Chen [1964] R. R. Heikes and C. W. Chen, Physics 1, 159 (1964).
- von Molnar and Methfessel [1967] S. von Molnar and S. Methfessel, J. Appl. Phys. 38, 959 (1967).
- von Molnar and Shafer [1970] S. von Molnar and M. W. Shafer, J. Appl. Phys. 41, 1093 (1970).
- de Gennes and Friedel [1958] P. G. de Gennes and J. Friedel, J. Phys. Chem. Solids 4, 71 (1958).
- Fisher and Langer [1968] M. E. Fisher and J. S. Langer, Phys. Rev. Lett. 20, 665 (1968).
- Legvold et al. [1953] S. Legvold, F. H. Spedding, F. Barson, and J. F. Elliott, Rev. Mod. Phys. 25, 129 (1953).
- Colvin et al. [1960] R. V. Colvin, S. Legvold, and F. H. Spedding, Phys. Rev. 120, 741 (1960).
- Samokhvalov et al. [1988] A. A. Samokhvalov, N. A. Viglin, B. A. Gizhevskii, T. I. Arbuzova, and N. M. Chebotaev, Phys. Stat. Sol. (b) 148, 361 (1988).
- Oliver et al. [1970] M. R. Oliver, J. A. Kafalas, J. O. Dimmock, and T. B. Reed, Phys. Rev. Lett. 24, 1064 (1970).
- Laks and da Silva [1976] B. Laks and C. E. T. G. da Silva, Phys. Rev. Lett. 36, 1204 (1976).
- von Molnar and Kasuya [1970] S. von Molnar and T. Kasuya, in Proceedings of the Tenth International Conference on the Physics of Semiconductors (1970), p. 233.
- Petrich et al. [1971] G. Petrich, S. von Molnár, and T. Penney, Phys. Rev. Lett. 26, 885 (1971).
- Leroux-Hugon [1972] P. Leroux-Hugon, Phys. Rev. Lett. 29, 939 (1972).
- Kübler and Vigren [1975] J. Kübler and D. T. Vigren, Phys. Rev. B 11, 4440 (1975).
- Mott and Davis [1979] N. F. Mott and E. A. Davis, Electronic Processes in Non-Crystalline Materials (Clarendon Press, Oxford, 1979).
- Mauger [1983] A. Mauger, Phys. Rev. B 27, 2308 (1983).
- Nagaev [1999] E. L. Nagaev, Phys. Lett. A 257, 88 (1999).
- Mauger [1986] A. Mauger, Phys. Rev. B 33, 7307 (1986).
- Dietl et al. [1986] T. Dietl, J. Spalek, and L. Świerkowski, Phys. Rev. B 33, 7303 (1986).
- Auslender and Viglin [1986] M. I. Auslender and N. A. Viglin, Sov. Phys. JETP 65, 66 (1986).
- van Vleck [1948] J. H. van Vleck, Phys. Rev. 74, 1168 (1948).
- Anderson and Weiss [1953] P. W. Anderson and P. R. Weiss, Rev. Mod. Phys. 25, 269 (1953).
- Nyhus et al. [1997] P. Nyhus, S. Yoon, M. Kauffman, S. L. Cooper, Z. Fisk, and J. Sarrao, Phys. Rev. B 56, 2717 (1997).
- Snow et al. [2001] C. S. Snow, S. L. Cooper, D. P. Young, and Z. Fisk, Phys. Rev. B 64, 174412 (2001).
- Rho et al. [2002] H. Rho, C. S. Snow, Z. Fisk, A. Comment, and J.-P. Ansermet, Phys. Rev. Lett. 88, 127401 (2002).
- Elfimov et al. [2002] I. S. Elfimov, S. Yunoki, and G. A. Sawatzky (2002), cond-mat/0205530.
- Helten et al. [1977] M. Helten, P. Grünberg, and W. Zinn, Physica 89B, 63 (1977).
- Torrance et al. [1972b] J. B. Torrance, M. W. Shafer, and T. R. McGuire, Bull. Amer. Phys. Soc. 17, 315 (1972b).
- Lascaray et al. [1976] J. P. Lascaray, J. P. Desfours, and M. Averous, Sol. St. Commun. 19, 677 (1976).
- Escorne et al. [1979] M. Escorne, A. Mauger, C. Godart, and J. C. Achard, J. Phys. (Paris) 40, 315 (1979).
- Coutinho-Filho [1984] M. D. Coutinho-Filho, Phys. Rev. B 30, 7115 (1984).
- Beck [1968] D. E. Beck, Mol. Phys. 14, 311 (1968).
- Osborn [1945] J. A. Osborn, Phys. Rev. 67, 351 (1945).
- Llinares et al. [1974] C. Llinares, J. P. Desfours, J. P. Nadai, C. Godart, A. Percheron, and J. C. Achard, Phys. Stat. Sol. (a) 25, 185 (1974).
- Broderick et al. [2002] S. Broderick, B. Ruzicka, L. Degiorgi, H. R. Ott, J. L. Sarrao, and Z. Fisk, Phys. Rev. B 65, 121102 (2002).
- Werheit et al. [2000] H. Werheit, T. Au, R. Schmechel, Y. B. Paderno, and E. S. Konovalova, J. Sol. State Chem. 154, 87 (2000).
- Aronson et al. [1999] M. C. Aronson, J. L. Sarrao, Z. Fisk, M. Whitton, and B. L. Brandt, Phys. Rev. B 59, 4720 (1999).
- Desfours et al. [1976] J. Desfours, J. P. Nadai, M. Averous, and G. Godart, Sol. State Comm. 20, 691 (1976).
- Bachmann and Wachter [1968a] R. Bachmann and P. Wachter, Phys. Lett. 26A, 478 (1968a).
- Bachmann and Wachter [1968b] R. Bachmann and P. Wachter, Sol. State Comm. 6, 711 (1968b).
- Penney and Kasuya [1971] T. Penney and T. Kasuya, J. Appl. Phys. 42, 1403 (1971).
- Bube [1992] R. H. Bube, Photoelectronic properties of semiconductors (Cambridge University Press, Cambridge, 1992).
- Allen et al. [1990] J. W. Allen et al., Phys. Rev. Lett. 64, 595 (1990).
- Namatame et al. [1990] H. Namatame et al., Phys. Rev. B 41, 7205 (1990).
- Suzuki et al. [1990] T. Suzuki et al., Phys. Rev. B 42, 4263 (1990).
- Anderson et al. [1993] R. O. Anderson et al., Phys. Rev. Lett. 70, 3163 (1993).
- Harima et al. [2001] N. Harima et al., Phys. Rev. B 64, 220507(R) (2001).
- Damascelli et al. [2001] A. Damascelli, D. H. Lu, and Z.-X. Shen, J. Electron Spectrosc. Relat. Phenom. 117-118, 165 (2001).
- Emery and Kivelson [1992] V. J. Emery and S. A. Kivelson, J. Phys. Chem. Solids 53, 1499 (1992).
- Jansen and Block [1999] L. Jansen and R. Block, Physica A 271, 169 (1999).
- Blackstead and Dow [1998] H. A. Blackstead and J. D. Dow, Solid State Commun. 107, 323 (1998).
- Hirsch and Marsiglio [1989] J. E. Hirsch and F. Marsiglio, Physica C 162-164, 591 (1989).
- Wang et al. [1991] Z. Z. Wang et al., Phys. Rev. B 43, 3020 (1991).
- Jiang et al. [1994] W. Jiang et al., Phys. Rev. Lett. 73, 1291 (1994).
- Sekiyama et al. [2000] A. Sekiyama et al., Nature 403, 396 (2000).
- Duijn et al. [1994] V. H. M. Duijn et al., Physica C 235-240, 559 (1994).
- Nugroho et al. [1999] A. A. Nugroho et al., Phys. Rev. B 60, 15379 (1999).
- Li et al. [1994] T. W. Li et al., J. Cryst. Growth 135, 481 (1994).
- Ishii et al. [1989] H. Ishii et al., Jpn. J. Appl. Phys. 28, L 1952 (1989).
- Cummins and Egdell [1993] T. R. Cummins and R. G. Egdell, Phys. Rev. B 48, 6556 (1993).
- Yamamoto et al. [1997] H. Yamamoto, M. Naito, and H. Sato, Phys. Rev. B 56, 2852 (1997).
- Alexander et al. [1991] M. Alexander et al., Phys. Rev. B 43, 333 (1991).
- Nücker et al. [1989] N. Nücker et al., Z. Phys. B 75, 421 (1989).
- Tjeng et al. [1991] L. H. Tjeng et al., Phys. Rev. Lett. 67, 501 (1991).
- Tjeng et al. [1992] L. H. Tjeng, C. T. Chen, and S.-W. Cheong, Phys. Rev. B 45, 8205 (1992).
- Brookes et al. [2001] N. B. Brookes et al., Phys. Rev. Lett. 87, 237003 (2001).
- Antonides et al. [1977] E. Antonides, E. C. Janse, and G. A. Sawatzky, Phys. Rev. B 15, 1669 (1977).
- Haak et al. [1978] H. W. Haak, G. A. Sawatzky, and T. D. Thomas, Phys. Rev. Lett. 41, 1825 (1978).
- Cooper et al. [1990] S. L. Cooper et al., Phys. Rev. B 42, 10785 (1990).
- Uchida et al. [1989] S. Uchida, H. Takagi, and Y. Tokura, Physica C 162-164, 1677 (1989).
- Arima et al. [1991] T. Arima et al., Phys. Rev. B 44, 917 (1991).
- [288] N. P. Armitage et al., cond-mat/0201119.
- Yeh and Lindau [1985] J. J. Yeh and I. Lindau, Atomic Data and Nuclear Data Tables 32, 1 (1985).
- Fujimori et al. [1988] A. Fujimori et al., Phys. Rev. B 38, 7789 (1988).
- Klauda et al. [1993] M. Klauda et al., Phys. Rev. B 48, 1217 (1993).
- Klauda et al. [1994] M. Klauda et al., J. Supercond. 7, 485 (1994).
- Grassmann et al. [1989] A. Grassmann et al., Europhys. Lett. 9, 827 (1989).
- Weaver et al. [1988] J. H. Weaver et al., Phys. Rev. B 38, 4668 (1988).
- Uchida et al. [1991] S. Uchida et al., Phys. Rev. B 43, 7942 (1991).
- Zhang and Rice [1988] F. C. Zhang and T. M. Rice, Phys. Rev. B 37, 3759 (1988).
- Eskes and Sawatzky [1991] H. Eskes and G. A. Sawatzky, Phys. Rev. B 44, 9656 (1991).
- Eskes et al. [1990] H. Eskes, L. H. Tjeng, and G. A. Sawatzky, Phys. Rev. B 41, 288 (1990).
- Tjeng et al. [1997] L. H. Tjeng et al., Phys. Rev. Lett. 78, 1126 (1997).
Publications
-
•
T. Mizokawa, L. H. Tjeng, P. G. Steeneken, N. B. Brookes, I. Tsukada, T. Yamamoto and K. Uchinokura.
Photoemission and x-ray-absorption study of misfit-layered (Bi,Pb)-Sr-Co-O compounds: Electronic structure of a hole-doped Co-O triangular lattice
Phys. Rev. B 64, 115104 (2001) -
•
K. Schulte, M. A. James, P. G. Steeneken, G. A. Sawatzky, R. Suryanarayanan, G. Dhalenne and A. Revcolevschi.
Weight of zero-loss electrons and sum rules in extrinsic processes that can influence photoemission spectra
Phys. Rev. B 63, 165429 (2001) -
•
K. Schulte, M. A. James, L. H. Tjeng, P. G. Steeneken, G. A. Sawatzky, R. Suryanarayanan, G. Dhalenne and A. Revcolevschi.
Work function changes in the double layered manganite La1.2Sr1.8Mn2O7
Phys. Rev. B 64, 134428 (2001) -
•
J. Minár, H. Ebert, L. H. Tjeng, P. Steeneken, G. Ghiringhelli, O. Tjernberg and N. B. Brookes.
Theoretical description of the Fano-effect in the angle-integrated valence-band photoemission of paramagnetic solids
Appl. Phys. A 73, 663 (2001) -
•
P. G. Steeneken, L. H. Tjeng, I. Elfimov, G. A. Sawatzky, G. Ghiringhelli, N. B. Brookes and D. -J. Huang.
Exchange splitting and charge carrier spin-polarization in EuO
Phys. Rev. Lett. 88, 047201 (2002)
http://xxx.lanl.gov/abs/cond-mat/0105527 -
•
P. G. Steeneken.
Oral presentation on Talksplanet website
http://www.talksplanet.com/topics/phys0108001 -
•
G. Ghiringhelli, N. B. Brookes, L. H. Tjeng, T. Mizokawa, O. Tjernberg, P. G. Steeneken and A. A. Menovsky.
Probing the singlet character of the two-hole states in cuprate superconductors
Physica B 312-313, 34 (2002) -
•
O. Tjernberg, L. H. Tjeng, P. G. Steeneken, G. Ghiringhelli, A. A. Nugroho, A. A. Menovsky and N. B. Brookes.
Existence and stability of the Zhang-Rice singlet in Nd2-xCexCuO4-δ
Submitted to Phys. Rev. Lett. -
•
P. G. Steeneken, L. H. Tjeng, M. V. Tiba, R. Bhatia, W. Eerenstein, T. Hibma and G. A. Sawatzky.
Growth of EuO films with controlled properties
Chapter 3 of this thesis, in preparation. -
•
P. G. Steeneken, L. H. Tjeng, G. A. Sawatzky, A. Tanaka, O. Tjernberg, G. Ghiringhelli, N. B. Brookes, A. A. Nugroho and A. A. Menovsky.
Nature of the states near the chemical potential in Nd2-xCexCuO4-δ
Chapter 8 of this thesis, in preparation. - •
Acknowledgements
Ofschoon artikel 1 van het promotiereglement het proefschrift betitelt als een proeve van bekwaamheid tot het zelfstandig beoefenen van de wetenschap, lijkt mij bekwaamheid in het beoefenen van de wetenschap in samenwerkingsverband minstens zo belangrijk. Bij het schrijven van dit proefschrift ben ik dan ook niet onafhankelijk geweest van de samenwerking, steun en hulp van vele anderen, die ik in dit hoofdstuk hiervoor hartelijk wil bedanken.
Allereerst wil ik mijn beide promotores George Sawatzky en Hao Tjeng bedanken. Beste George, toen ik begon in jouw groep met als opdracht om overgangsmetaaloxiden met behulp van elektronenspectroscopie te bestuderen, had ik nooit kunnen vermoeden waar dit toe zou leiden. Jouw idee om te proberen een spin polarizator van EuO te maken was de aanzet tot de studie van dit interessante materiaal. Een polarizator heb ik er niet van kunnen maken, toch heeft dit idee een geweldige ’spin-off’ gehad in de vorm van dit proefschrift. Jouw intuïtie voor fascinerende onderzoeksonderwerpen, gecombineerd met je enorme inzicht, kennis en ervaring hebben mij heel erg geholpen en veel geleerd. Bedankt voor alle aanmoediging, discussies en ideeën.
Hao, jouw begeleiding heeft niet alleen mijn onderzoek, maar ook mijn manier van onderzoeken enorm verbeterd. Jouw idee van de experimenteel fysicus als all-rounder die een experiment van de bouw van de opstelling en de sample-groei tot de theoretische analyse van de metingen beheerst, heeft grote indruk op mij gemaakt. Ik heb ook veel geleerd van jouw zorgvuldige werkwijze, waarbij het experiment niet zozeer bepaald wordt door de beschikbare apparatuur, maar waarbij de apparatuur aangepast wordt om de gewenste meting te kunnen doen. Hierdoor ben ik namelijk met een groot aantal experimentele technieken in aanraking gekomen. Hoogtepunt in onze samenwerking vond ik de verscheidene metingen bij het synchrotron in Grenoble. Niet alleen zijn de belangrijkste metingen voor dit proefschrift daar gedaan, ook veel van de concepten voor de interpretatie van deze metingen zijn tijdens onze nachtelijke discussies bij de beamline ontstaan. Bovendien heeft ook jouw brede kennis en inzicht van spectroscopie en vaste stof fysica een zeer belangrijke bijdrage aan het tot stand komen van dit proefschrift geleverd. Bedankt voor dit alles en voor je onuitputtelijke enthousiasme voor de fysica, het was en is een grote stimulans voor me.
Een groot deel van de transport en fotoemissie studies aan EuO zijn gedaan in de mooie opstelling die Ronald Hesper tijdens zijn promotieonderzoek geconstrueerd heeft. Ronald, bedankt voor al je hulp bij mijn onderzoek. Jouw kunde wat betreft elektronica, chemie en computers, gecombineerd met je zorgvuldigheid, precisie en indrukwekkende hulpvaardigheid, maken je een grote aanwinst voor elk laboratorium. Verder heb ik ook je gezelschap en onze vele interessante discussies in de mensa zeer gewaardeerd.
Arend, ik heb veel geprofiteerd van jouw technische ervaring en de vele opstellingen die je ontwikkeld hebt, bedankt! Karina, ik heb onze gesprekken en de samenwerking tijdens mijn eerste jaar bij de EELS metingen aan Bi 2212 op prijs gesteld. Alex, thanks for coping with an experimentalist as a roommate and for our fascinating conversations about science and life. Ilya, your calculations and our discussions on EuO were a great support and stimulant for this work, I hope you will continue your EuO research. Dear Oana, thanks for the happiness you brought to the lab. Salvatore, your pioneering work with the mini-MBE setup has been a great support for the growth of the EuO films. Takashi, it was a privilege to benefit from your large scientific experience during the EELS measurements and the work on the cobaltates. Veronica and Rakesh, thanks for your contributions to the EuO project. Christian, I appreciate your help with the ellipsometry measurements very much, thanks. Wilma, bedankt voor je hulp bij de groei en magnetoweerstandsmetingen van de EuO lagen. Bedankt Harry, dat je vervangende groepsleider bent geweest het laatste jaar.
Thanks to the people at beamline ID12B (now ID08) of the ESRF, and especially to Nick, Giacomo, Oscar and Kenneth. Without your nice beamline with spin-detector, many of the measurements in this thesis could not have been done. Also your comments on the EuO and Nd2-xCexCuO4-δ work were very useful.
The high quality samples of the cuprates which were studied in chapter 8, were provided by Agung Nugroho and A. A. Menovsky. Thanks Agung, for the many discussions of the work and for your company at the conference in Trieste. K. J. Fischer kindly provided us with the nice EuO crystals that were studied in chapter 5.
De hulp bij verschillende experimentele facetten heb ik zeer op prijs gesteld. Bedankt Ferry, Frans, Cor, Arjen, Luc, Minte, Siemon, Bernard, Henk (2) en Jacob. Ook de kunststukjes die door de mechanische en electronische werkplaats werden afgeleverd waren voor dit werk van belang. In het bijzonder wil ik Jan Kappenburg en Leo Huisman hiervoor bedanken.
Interpretations and results in this work have benefitted much from discussions with and comments from many people. In particular I want to thank the reading committee Meigan Aronson, Ronald Griessen and Dick van der Marel for their careful reading and comments on the manuscript. Useful discussions with Daniil Khomskii, Tjip Hibma, Frank de Groot, Arata Tanaka, D.-J. Huang, Paul van Loosdrecht, Thom Palstra, Bart van Wees, Maurits Haverkort, Peter Armitage, Zhi-Xun Shen, Atsushi Fujimori and Jim Allen are also gratefully acknowledged.
I would also like to thank all the other friendly and helpful people who make the Groningen physics department such a good and interesting place to be. My (former) group members Ruth, Sjoerd, Andri, Mark, Peter, Yutaka, Sarker, Michel, Mirwais, Hans, Anna-Maria, Anita, Renate en Brigitta. The people from the optical solid state physics group, made me feel like I was still a member of their group. Thanks Hajo, Patricio, Alexey, Katarzyna, Artem, Johan, Andrea, Markus, Jeroen, Herpertap, Christine and Sagar. Thanks to the people from the physics of nanodevices and physical chemistry groups: Friso, Jochem, Diana D., Andrei, Michele, Hubert, Mayke, Jorden, Michail, Sjoerd, Szilly, Diana R., Frans, Bas, Christine and Gaby. Verder wil ik de mensen van didactiek en opleiding bedanken voor de prettige samenwerking en Whee Ky voor zijn aanstekelijke enthousiasme.
Mijn dank gaat ook uit naar al mijn familie en vrienden, die een belangrijke bijdrage aan dit proefschrift hebben geleverd door hun interesse en aanmoediging. Bedankt Marleen, Arjen, Michiel, Janneke, oma, Eugen, Ika, Caroline, Floris (ook voor je hulp als paranimf) en alle anderen!
In het bijzonder wil ik mijn ouders bedanken voor hun onvoorwaardelijke vertrouwen, steun, en advies. Zonder jullie stimulatie al die jaren was dit proefschrift er niet gekomen.
Lieve Nicole, ik besef dat mijn nachtelijke metingen, weekenden dat ik doorwerkte en de vele momenten dat ik afwezig was, omdat ik aan mijn onderzoek dacht, niet altijd gemakkelijk voor jou geweest zijn. Ontzettend bedankt voor je begrip de laatste 4.5 jaar en voor al je liefde, steun, vrolijkheid, hulp en optimisme!