On the Bursty Evolution of Online Social Networks
Abstract
The high level of dynamics in today’s online social networks (OSNs) creates new challenges for their infrastructures and providers. In particular, dynamics involving edge creation has direct implications on strategies for resource allocation, data partitioning and replication. Understanding network dynamics in the context of physical time is a critical first step towards a predictive approach towards infrastructure management in OSNs. Despite increasing efforts to study social network dynamics, current analyses mainly focus on change over time of static metrics computed on snapshots of social graphs. The limited prior work models network dynamics with respect to a logical clock. In this paper, we present results of analyzing a large timestamped dataset describing the initial growth and evolution of Renren, the leading social network in China. We analyze and model the burstiness of link creation process, using the second derivative, i.e. the acceleration of the degree. This allows us to detect bursts, and to characterize the social activity of a OSN user as one of four phases: acceleration at the beginning of an activity burst, where link creation rate is increasing; deceleration when burst is ending and link creation process is slowing; cruising, when node activity is in a steady state, and complete inactivity.
Keywords:
online social networks, network dynamics1 Introduction
The rapid growth of online social networks (OSNs) has created numerous technical challenges for the providers that supply the hardware and software infrastructure behind these web services. As one example, the creation of social links between users dramatically change demands on social network infrastructures in terms of access, storage and computation. Depending on the specific configuration of backend servers, for example, changes in the social graph can affect how data is partitioned across clusters, or how much replication is necessary to sustain low query response times.
However, very little is known about how social network dynamics correspond to actual clock time. The large majority of prior work on OSN analysis has focused on analyzing, mining, and modeling static topologies or static snapshots of dynamic processes. Only recently have researchers begun to study dynamic processes in social networks, most often by analyzing how classical graph metrics such as degree, connected components, and shortest paths change over time. This has led to models of underlying processes such as densification and shrinking diameters [1]. These models describe how graphs change and how edges are created with respect to a logical clock, i.e. a homogeneous sequence of events.
But how do these events match up to events in real time? Can we better understand how edge creation events relate to each other, and can the occurrence of such events be predicted with respect to a physical clock? This work is an initial effort to answer some of these questions, but analyzing one specific temporal property of burstiness in edge creation. Our work is motivated in part by models of human dynamics adopted in a wide range of disciplines, from economics to communications. Recent studies [2, 3] have shown that human dynamics are best described by periods of rapidly occurring events interleaved with long periods of inactivity. Thus we ask the question: Is link creation in online social networks a bursty process?
In this paper, we provide an initial answer to this question, by analyzing an anonymized temporal trace of edge creation events over a period of a year in a large OSN. The trace describes events in Renren [4], the largest social network in China with more than 220 million users. Our analysis shows that edge creation is a highly inhomogeneous and bursty process. We then ask two followup questions: a) Given an high level bursty structure, does an inner substructure exist, and how can it be characterized; and b) How can we detect both the whole burst and its internal phases?
Understanding the internal structure of edge creation bursts can shed light on the underlying user process, e.g. is the user gradually enlarging her circle of friends or has she discovered a new cluster of her offline friends. Known techniques for the analysis and the detection of burst events (gamma-ray, text mining, stock market) focus on locating a burst when it occurs, but they do not consider events inside the detected temporal window. Thus we propose a new methodology able to detect bursts, their internal structure and the transitions between the different phases a node experiences. We perform a second order analysis on the link creation process by computing, for each node, the acceleration of the degree time function to characterize the burst structure.
Finally, we apply our acceleration metric and the detection of bursty phases on Renren. We find that all nodes exhibit similar patterns over time, characterized by an intense burst of activity following their joining the network. The initial burst is followed by weaker bursts over time, each composed of an acceleration phase, followed by a longer period of slowly vanishing deceleration.
The discovery of highly bursty patterns paves the way for new generative models that not only capture graph dynamics in terms of phases of node activity, but also describes such events with respect to physical time. In addition, burst analysis can reveal further insights into the formation and liveness of individual users, communities, and provide a basic metric of useful in characterizing and comparing different traces of network dynamics.
2 Related Work
Time evolving OSN Snapshots. While static features of OSNs are well studied, works on dynamics of online social networks are still ongoing. Among all Leskovec et al. in [1] detected two important properties on dynamic OSN data: graph densification, i.e. the average degree increases, and shrinking diameter. Several different social graphs has been studied in order to capture the growth of components and communities. Palla et al. [5] investigated the time dependence of overlapping communities and Berlingherio et al. [6] detected clusters of temporal snapshots of a network, interpreted as eras of evolution. Authors in [7, 8, 9] studied the dynamics of disconnected components. Finally Backstrom et al. [10] investigated the structural features which influence people in joining communities and their growth process. Alternatively, the per node dynamics was studied in [11] where the authors captured the evolution of key network parameters, and evaluate the extent to which the edge destination selection process subscribes to preferential attachment. As concerns acceleration, in [12] the authors considered an overall network size growth as a global property and they modeled this global acceleration for the purpose of predicting the next network stage.
Interdisciplinary Study of Human Dynamics. In [13], Barabasi observed that the timing of human activity is inhomogeneous and bursty, disputing the previous hypothesis that human activities are randomly distributed in time. The inhomogeneity idea was extended in [2] and validated on few networks such as an Hungarian news portal, e-mails, library activities in an University and a trade transactions. Similarly, [14] analyzes the activity burstiness of blogs using entropy plots, and show non-uniformity and self-similarity of the number of posts time sequences. Furthermore, [15] and [16] observe that temporal patterns are inhomogeneous or bursty even in mobile phone calls and in citation dynamics. Finally, [3] developed a burst detection algorithm and observed that the appearance of a topic in a stream of documents, such as e-mails or research papers, has a bursty behavior. As far as we know, burstiness has never been investigated in OSN.
3 Timestamped Renren Dataset
A major obstacle to studying OSN dynamics is the difficulty of obtaining detailed data traces. Our study uses an anonymized dataset that contains the timestamped creation of all users and edges in the Renren social network [4]. Renren is the largest and oldest OSN in China, with functionality similar to Facebook, and has currently over 220 million users. Our anonymized trace describes the evolution of each nodes as a sequence of timestamped edge creation events. The first edge created in the Renren network dates back to November 2005. We track the complete evolution of the oldest 60000 nodes in Renren, for a total of 8 million edges created over a period of one year from November 2005 to December 2006.
4 bursty nature of link creation
Bursty behavior has been observed in various contexts such as WWW traffic patterns [17], emails exchanges, and in general human behavior [2]. But they have not been studied in the context of online social networks. In this section, we study the link creation process as the growth of the neighborhood of each single node, and show that the linking activity of online social networks users is characterized by temporal bursty patterns.
To prove the burstiness of link creation, we consider for each user the event time series where an event is represented by the creation of an edge incident to the considered node. On each time series, we apply the technique proposed in Vasquez et. al. [2] and extended by McGlohon et. al. [14], both based on the inter-event time distribution between consecutive events for a single individual. If the edge creation process is a Poisson-like process, i.e. homogeneous, then the inter-event time distribution should be an exponential distribution. On the other hand, a bursty arrival process is characterized by a power-law distribution where many short time intervals, each corresponding to intensive activities forming a burst, are separated by relatively fewer but longer periods of low or zero activity.
Results. In order to distinguish if the process is homogeneous or bursty, we fit the inter-event time data per node in our Renren dataset using MLE (Maximum Likelihood Estimator), and select the model with the minimum AIC (Akaike Information Criterion). As a representative of the power law distribution family, we choose the Pareto with exponential cutoff , and use the exponential distribution to describe the inter-event time Poisson process. Finally, to avoid the impact of outliers, we remove from consideration users who have too few events, i.e. nodes with final degree less than 15 (median degree).
Our results show that minimum AIC is achieved by the Pareto distribution with exponential cutoff, meaning almost all users in our dataset manifest a bursty behavior in link creation. In addition, the Kolmogorov-Smirnov (K-S test) validates the selected hypothesis for almost all users ( of the population). These measurements offer direct evidence that at the level of a single individual, there is a heavy-tailed activity pattern.
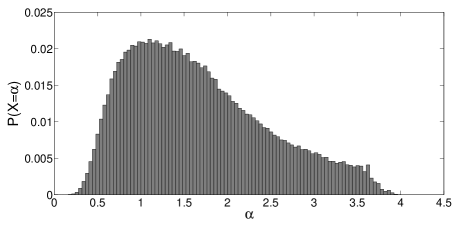
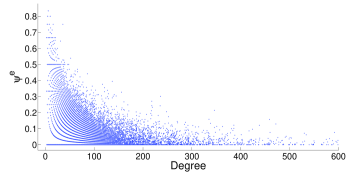
Having shown that individuals add links in a temporal bursty manner, we analyze the similarity of the bursty process across users, by computing the distribution of the scale parameter determined separately for each user. As shown in Figure 1, values are scattered around a peak at 1, with an heavy tail in the right side. This partially corroborates the results found in [2], which showed a single group of users with very similar behavior described by the Gaussian distribution of centered at 1. However, the heavy tail suggests that users in online social networks cannot be easily grouped in a single category, but have quite different behaviors in adding links.
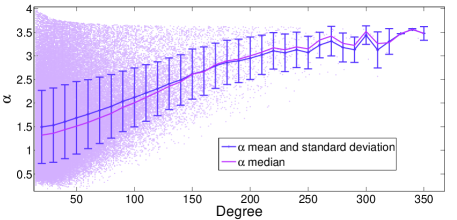
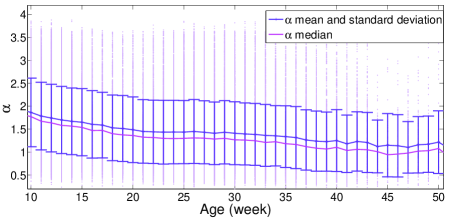
To understand the reasons behind the observed heavy tail, we take into account two factors: the degree and the age of a node, i.e. how long the node has been in the network (in weeks). In Figure 2, we show the relationship between the scaling parameter and the two variables we consider. Between and the degree, we observe that the mean value increases with degree as shown in Figure 2. This fact suggests that nodes with higher degree contribute more to the right tail. This means that, although all the nodes manifest the same bursty behavior, nodes with higher degree have more closely spaced bursts. With regards to age, shown in Figure 2 shows that age does not influence the right tail, since the mean value is close to the mean of the distribution, and remains quite constant for different age values. The small decrease is due to the fact that older nodes have a greater chance to undergo long periods of inactivity.
In summary, we showed in this section that users follow a bursty process in creating links, where bursts occur more frequently in nodes with high final degree.
5 Degree Acceleration
Bursty phenomena have been studied in different areas of human activities, such as clicks or queries in search engines [18]. However, these previous investigations focused on bursts resulting from aggregate actions, such as group of users that manifest a common interest at a certain time. These burst detection algorithms are not suitable to investigate per-node time sequences of link creation, or substructures inside bursts.
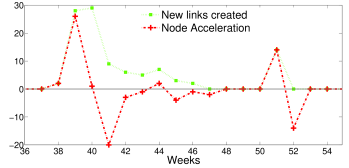
In this section, we propose a new methodology that identifies different phases that make up the bursty nature of the link creation process, and detects when bursts occur. We also identify the role played by each phase during the bursty process. From a high level, we observe that the alternation of activity/inactivity phases determines the burstiness of the event trace. In addition, bursts of activity have a typical internal structure, composed by a rapidly increasing slope and a gradually decreasing phase possibly interleaved by a plateau. An example is shown in Figure 3.
Degree Acceleration. Inspired by studies in physics and neuroscience on highly dynamic systems [19], we investigate the phases in bursty processes and detect bursts by measuring significant increments and decrements of new links formed per node. A burst begins when link formation activity rapidly increases, and ends following a decreasing phase. By leveraging the concept of acceleration, it is possible to easily identify and quantify significant changes in link creation activity. Let be the degree of node at time , i.e. the total number of links incident to node at time , and let be the time granularity that interleaves each measures. We can then compute degree acceleration as:
| (1) |
By computing degree acceleration, we can observe the initial start of bursts () and a burst’s decaying phase (). An example is shown in Figure 3. Note that acceleration captures two types of steady state conditions: a period of consistently high activity representing the plateau inside an activity burst (after an initial acceleration phase), and a steady state of low activity outside of activity bursts.
Defining Phases. While exploring the burstiness of the link creation process, we found that the growth of each node is characterized by transition phases in which users significantly change their link formation behavior. This led us to identify four different phases that describe the patterns involved in the nodes’ growth processes. The different phases can be described by defining a time-dependent state variable for each node in the system. More specifically, the acceleration phase is characterized by a large increment in creating new links, i.e. , and the deceleration phase is described by a strong decay measured by . Then we define two intermediate phases: cruising and inactivity. The first corresponds to a steady state of a node, where the number of links created per week is almost constant. This phase can correspond both to high activity or to small oscillations around inactivity, and is characterized by at least one new edge (captured by the variable ) and small values. These small values are centered around the value , and are bounded with two thresholds and . The second phase, i.e. inactivity, occurs when a node does not create any links for an entire time window. We formalize these four phases by introducing the function defined as follows:
| (2) |
where if and only if node creates at least one edge at time , otherwise . Degree acceleration and the related function represent a general tool to investigate the burstiness structure, and to highlight the detailed properties of each phase.
6 Experimental Analysis
In this section, we characterize the link creation process by analyzing our Renren trace using our acceleration methodology. The experimental analysis has been performed with the following settings: week to avoid cyclic fluctuations in acceleration due to increase in user activities over each weekend, and cruising phase thresholds are and .
6.1 The Role of Phases
The role played by each phase along the node lifetime is a key element to understand the network dynamics, and is also crucial when designing generative models based on per-node temporal behavior. To this purpose, we consider two main aspects: (i) the time a node spends in each phase and (ii) the per-node amount of links created in the different phases.
We perform this analysis from two perspectives, by considering the aggregate behavior of all nodes, and on per-node behavior. In order to understand the role of different phases during a node’s lifetime, we define and to compute the percentage of time spent in each phase by all nodes (Equation 3) and by each node (Equation 4).
| (3) |
| (4) |
where represents the lifetime in weeks of a node, is the indicator function and . indicates the number of nodes at time , which represents the last week considered in the dataset.
The relationship between link creation and phase is quantified by , which corresponds to the percentage of the overall edges created within each phase, and , which is the link generation rate for node in each phase:
| (5) |
| (6) |
where is the number of link at time T. The results are reported in Table 1, where and are the -quantile of the distributions of and , and are discussed below.
| acc | dec | cruise | inact | |
| 0.11 | 0.14 | 0.28 | 0.47 | |
| 0.52 | 0.17 | 0.31 | 0 | |
| 0.25 | 0.27 | 0.44 | 0.66 | |
| 0.74 | 0.70 | 0.16 | 0 |
Inactivity phase. During the inactivity phase, by definition, we do not observe growth since no links are created. However, inactivity acquires importance in the temporal dimension, because it deeply affects the burstiness. The high values of and highlight that node activities are concentrated in few and small periods; thus, for most part of their life, nodes do not influence the network dynamic evolution.
Acceleration and Deceleration Phases. Nodes spend only a small amount of their life in these phases, in particular after acceleration events, longer period of weaker activity follow. However, the amount of links generated in these phases determines the structure of Renren. In fact, a link has very high probability, , to be generated in one of these two phases, in particular in acceleration and in deceleration.
Cruising Phase. Cruising periods cover an important portion of nodes’ lifetime. Furthermore, and would suggest that this phase has a role also in link creation. However, only few cruising periods have relevance in the edge growth. Indeed, it depends on whether the cruising phase is inside a burst or it corresponds to small oscillations around inactivity. A node in a burst cruising phase is creating many links, while in the other case the number of links created is irrelevant. Finally, the cruising phase has a pronounced impact only for nodes with low degree, as shown in Figure 4.
We have shown that acceleration () and deceleration () phases are those responsible of the growth and dynamics of the network, despite the fact that they represent a very small part of a node life.
6.2 Acceleration and Deceleration Features
In depth understanding of acceleration/deceleration phases reveals how users operate in the network after they join. This knowledge could be very useful to ensure efficient management of the OSN’s resources. This section focuses on acceleration and deceleration by means of illustrating their importance from a network perspective; showing that they follow a power law distribution and finally investigating the impact of node aging on link creation process.
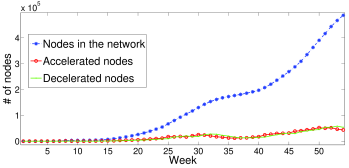
Network perspective on acceleration/deceleration. From the network perspective, an estimate of how many and which nodes are changing the graph structure would greatly help in managing the system resources. As it can be seen in Figure 6, in each week only a very small number of nodes are acc/dec phases; for example at the end of the year they are almost 20%. These nodes can be easily identified as soon as they experience a phase transition from the inactive/cruising to the accelerated phase since their values of acceleration abruptly increase.
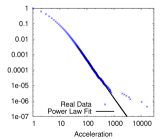
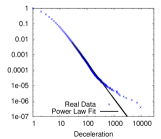
Acceleration/deceleration probability distributions. By applying the statistical framework proposed by Clauset [20], we find that acceleration and deceleration distributions are power law, (Figure 5 and 5). By considering the overall network, this result implies that half of the acceleration and deceleration events have a small size, but they are very likely to show rapid increase and decrease respectively. The upper tail of the acceleration distribution exhibits so high values of acceleration that can’t correspond to normal user. Those events are most likely associated to people with a large amount of followers or accounts for advertisement.
The impact of aging. The general behavior of a node is a sequence of acceleration/deceleration phases of constant magnitude, after an initial burst. In general, nodes wait at most for one month before initiating their activity.
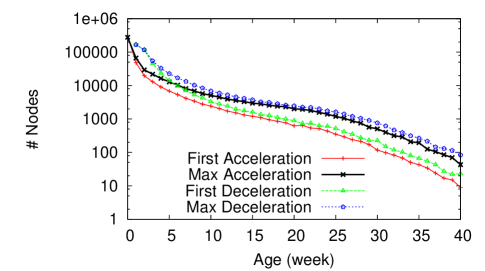
We start by defining the of a node as the time elapsed between the appearance of in the network (timestamp of the first edge incident to ), and time . The observables whose dependence on age, need to be studied are: , the number of nodes showing their first acceleration / deceleration at time and , the number of nodes manifesting their maximum acceleration / deceleration at time . Finally, we calculate the average acceleration/ deceleration .
Analyzing and comparing and in Figures 7 and 7, we observe that most nodes enter the phase of maximum acceleration in the first week. In addition, Figure 7 shows that the activity after the first peak does not decrease as fast as its respective acceleration.
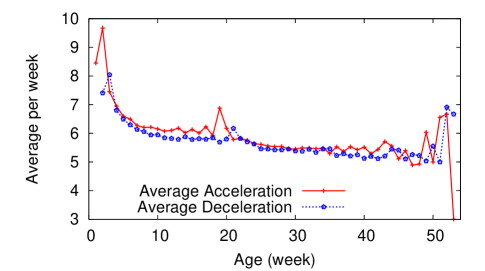
Figure 7 highlights another interesting behavior of the phases. The average acceleration remains constant when age increases. This is consistent with what we found in Figure 3, i.e. nodes experience a big burst of acceleration in the first week after joining the network, and subsequent bursts never match the first in intensity.
7 Conclusion
In this paper we investigated the bursty nature of the link creation process in OSN. We prove not only that it is an highly inhomogeneous process, but also identify patterns of burstiness common to all nodes. In terms of edge creation, users are inactive for most of their lifetimes, and concentrate their link activity in a number of short regular time periods. To characterize node activity, we develop a new methodology based on the acceleration of degree growth, which allows us to highlight the internal structure of link creation bursts.
We believe using acceleration as a general metric to characterize network dynamics prompts future work in studying link generation mechanisms. In particular, defining different phases of edge creation hints at the possibility of characterizing users into distinctive activity levels that correlate with their likelihood of adding social links. Some preliminary results confirm this intuition: when nodes (users) first join the network, they create links based on the preferential attachment mechanism; while in later bursts, nodes seem to explore (acceleration phase) and densify (deceleration) in far regions of the graph. These results open the door for new generative models that consider different phases of node activity.
References
- [1] Leskovec, J., Kleinberg, J., Faloutsos, C.: Graphs over time: densification laws, shrinking diameters and possible explanations. In: Proc. of KDD. (2005)
- [2] Vázquez, A., Oliveira, J.a.G., Dezsö, Z., Goh, K.I., Kondor, I., Barabási, A.L.: Modeling bursts and heavy tails in human dynamics. Physical Review E 73 (2006)
- [3] Kleinberg, J.: Bursty and hierarchical structure in streams. In: Proc. of KDD. (2002)
- [4] Jiang, J., Wilson, C., Wang, X., Huang, P., Sha, W., Dai, Y., Zhao, B.Y.: Understanding latent interactions in online social networks. In: Proc. of IMC. (2010)
- [5] Palla, G., Barabasi, A., Vicsek, T.: Quantifying social group evolution. Nature 446 (2007) 664–667
- [6] Berlingerio, M., et al.: As time goes by: Discovering eras in evolving social networks. In: Proc. of PAKDD. (2010) 81–90
- [7] McGlohon, M., Akoglu, L., Faloutsos, C.: Weighted graphs and disconnected components: patterns and a generator. In: Proc. of KDD. (2008)
- [8] Zheleva, E., Sharara, H., Getoor, L.: Co-evolution of social and affiliation networks. In: Proc. of KDD. (2009)
- [9] Akoglu, L., Faloutsos, C.: Rtg: a recursive realistic graph generator using random typing. Machine Learning and Knowledge Discovery in Databases (2009) 13–28
- [10] Backstrom, L., Huttenlocher, D., Kleinberg, J., Lan, X.: Group formation in large social networks: membership, growth, and evolution. In: Proc. of KDD. (2006)
- [11] Leskovec, J., Backstrom, L., Kumar, R., Tomkins, A.: Microscopic evolution of social networks. In: Proc. of KDD. (2008)
- [12] Dorogovtsev, S.N., Mendes, J.F.F.: Accelerated growth of networks. CoRR (2002)
- [13] Barabási, A.L.: The origin of bursts and heavy tails in human dynamics. Nature 435 (2005) 207–211
- [14] McGlohon, M., et al.: Finding patterns in blog shapes and blog evolution. In: Proc. of ICWSM. (2007)
- [15] Jo, H.H., Pan, R.K., Kaski, K.: Emergence of bursts and communities in evolving weighted networks. PLoS ONE 6 (08 2011) e22687
- [16] Eom, Y.H., Fortunato, S.: Characterizing and modeling citation dynamics. PLoS ONE 6(9) (2011)
- [17] Crovella, M.E., Bestavros, A.: Self-similarity in world wide web traffic: evidence and possible causes. IEEE/ACM Transactions on Networking 5 (1997) 835–846
- [18] Parikh, N., Sundaresan, N.: Scalable and near real-time burst detection from ecommerce queries. In: Proc. of KDD. (2008)
- [19] Chiappalone, M., et al.: Burst detection algorithms for the analysis of spatio-temporal patterns in cortical networks of neurons. Neurocomputing 65-66 (2005) 653–662
- [20] Clauset, A., Shalizi, C.R., Newman, M.E.J.: Power-law distributions in empirical data. SIAM Review 51 (2009) 661–703