A reverse engineering approach to the suppression of citation biases reveals universal properties of citation distributions
Abstract
The large amount of information contained in bibliographic databases has recently boosted the use of citations, and other indicators based on citation numbers, as tools for the quantitative assessment of scientific research. Citations counts are often interpreted as proxies for the scientific influence of papers, journals, scholars, and institutions. However, a rigorous and scientifically grounded methodology for a correct use of citation counts is still missing. In particular, cross-disciplinary comparisons in terms of raw citation counts systematically favors scientific disciplines with higher citation and publication rates. Here we perform an exhaustive study of the citation patterns of millions of papers, and derive a simple transformation of citation counts able to suppress the disproportionate citation counts among scientific domains. We find that the transformation is well described by a power-law function, and that the parameter values of the transformation are typical features of each scientific discipline. Universal properties of citation patterns descend therefore from the fact that citation distributions for papers in a specific field are all part of the same family of univariate distributions.
I Introduction
The use of bibliographic databases plays a practical, and crucial, role in modern science. Citations between scientific publications are in fact commonly used as quantitative indicators for the importance of scientific papers, as proxies for the influence of publications in the scientific community. General criticisms to the use of citation counts have been made macroberts89 ; macroberts96 ; adler09 , and the real meaning of a citation between papers can be very different and context dependent bornmann08a . Nevertheless, a citation can be viewed as a tangible acknowledgment of the citing paper to the cited one. Thus, the more citations a paper has accumulated, the more influential the paper can be considered for its own scientific community of reference. The same unit of measure (i.e., a citation) is commonly used as the basis for the quantitative evaluation of individual scholars hirsch05 ; egghe06 , journals garfield06 , departments davis84 , universities and institutions kinney07 , and even entire countries king04 . Especially at the level of individual scientists, numerical indicators based on citation counts are evaluation tools of fundamental importance for decisions about hiring bornmann06 and/or grant awards bornmann08b .
As a matter of fact, citation practice is widespread,
still basic properties of citation patterns are not completely clear.
For example, we know that citations
are broadly distributed, but, we do not know
the exact functional form of citation distributions.
In his seminal paper,
de Solla Price proposed a power-law model for explaining
how papers accumulate citations desolla65 .
However, more recent studies indicate several, sometimes
very different, possibilities: power-laws redner98 ; seglen99 ,
stretched exponentials lahe98 ; wallace09 ,
log-normals stringer08 ; radicchi08 ; stringer10 , and
modified Bessel functions vanraan01 .
At the same time, it is common practice to attribute the same value
to each citation, in spite of the fact that citation counts
strongly depend on the field hamilton91 .
For example, a paper in mathematics typically gets less citations
than a paper in molecular biology. There are in fact large variations
among scientific communities, mostly related
to the different citation habits of each community.
Such disproportions show up in
the typical values of the most common bibliometric indicators
based on raw citation counts.
The most influential journal in mathematics, Annals
of Mathematics, has impact factor garfield06
roughly equal to according to the
edition of the Journal Citation Reports (JCR)
database jcr2009 , while its counterpart in molecular biology,
Cell, has impact factor , eight times larger.
Similarly, there are several chemists with
-index hirsch05 larger
than chem , while for a computer scientist
it is very hard to have an -index larger
than compsci . Notice
that the values of the -index for chemists
have been calculated in , while those for
computer scientists in . For the same
year of reference, we should expect that the
difference is even larger than what reported here.
Such disproportions in citation counts make the use of raw
citation numbers very precarious
in many cases and call for alternative, more fair, measures.
It is important to stress that in this paper we denote as “bias”
the the systematic error that is introduced when using raw citation
numbers to compare papers belonging to different fields.
With this term we do not indicate any prejudice, nor we make any
claim about the causes of the field dependence empirically observed.
Although methods based on percentile ranks have been recently considered leydes11 ; bornmann11 , the traditional approach to the suppression of field-dependence in citation counts is based on normalized indicators. The raw number of citations is divided by a discipline dependent factor, and the aim of this linear transformation is to suppress eventual disproportions among the citation patterns of different research fields. Various methods have been proposed using this kind of approach schubert96 ; vinkler96 ; vinkler03 ; zitt05 ; leydes10 . In this context, particularly relevant is the study performed in radicchi08 (based on the the relative indicator originally developed in lundberg07 ), where citation distributions of different scientific disciplines are shown to have the same functional form, differing only for a single scaling factor (the average number of citations received by papers within each scientific discipline). The study is, however, limited to a small number of papers and scientific disciplines, and therefore not conclusive. The same approach of radicchi08 has also been used for more refined classification of publications in physics radicchi11 and chemistry bornmann09 , showing in general a good agreement with the previous claim of radicchi08 . More recently, Albarrán et al. albarran11 and Waltman et al. waltman11 have analyzed much larger datasets of scientific publications, and showed that the result of radicchi08 holds for many but not for all scientific disciplines. These studies cast some doubts on the validity of the results in radicchi08 , but, on the other hand, do not propose any alternative method for bias suppression.
Here, we perform an exhaustive analysis of about millions of papers
published in six different years (spanning
almost years of scientific production)
and in more than
journals listed in the Web Of Science (WOS) wos database.
We use the classification of journals in subject-categories ( in total)
as defined in the edition of the Journal
Citation Reports (JCR) database jcr2009 , and systematically
study the patterns of citations received by
papers within single subject-categories.
Despite some journals cover a rather broad range of topics,
a subject-category is a relatively accurate
classification of the general content of a journal.
Examples of JCR subject-categories are “Mathematics”, “Reproductive
Biology” and “Physics, Condensed Matter”.
Subject-categories can be
considered as good approximations for scientific disciplines.
We propose a transformation of raw citations numbers such that
the distributions of transformed citation counts are the same
for all subject-categories.
We study the properties
of this transformation and find strong regularities among
scientific disciplines. The transformation is almost
linear for the majority of the subject-categories.
Exceptions to this rule are present, but, in general, we find
that all citation distributions are part
the same family of univariate distributions.
In particular, the rescaling considered in radicchi08 ,
despite not strictly correct, is
a very good approximation of the transformation
able to make citation counts not depending on the
scientific domain.
II Results
II.1 Modeling citation distributions
For the same year of publication, the raw citation patterns of single subject-categories may be very different. Variations are a consequence of different publication and citation habits among scientific disciplines. In Fig. 1 for example, we plot the cumulative distributions of citations received by papers published in journals belonging to three different subject-categories. The shape of the three cumulative distributions is not exactly the same, and the difference is not accounted for by a single scaling factor radicchi08 . Dividing raw citation counts by a scaling factor (e.g., the average number of citations of the subject-category) would in fact correspond, in the logarithmic scale, to a horizontal rigid translation of the cumulative distribution. However, as Fig. 1 shows, this linear transformation is not sufficient to make all cumulative distributions coincide. By looking at the figure, the cumulative distributions of the raw citation counts for papers published in journals within the subject-categories “Computer science, software engineering” and “Genetics & heredity” have a pretty similar shape, and thus the possibility to obtain a good collapse of the curves by simply rescaling citation counts seems reasonable. Conversely, the cumulative distribution of the citations received by papers published in journals of the subject-category “Agronomy” has a different shape. The curve bends down faster than the curves corresponding to the other two subject-categories. In this case, a linear transformation of citation counts would hardly help to make this curve coincide with the others. Making citation counts independent of the subject-categories seems therefore not possible with the use of linear transformations, because the difference between citation distributions of different subject-categories is not only due to a single scaling factor.
In order to make further progress, here we
invert the approach to the problem.
We know that citation patterns of single subject-categories
may be different, but we do not know how to transform citation counts in order
to make them similar. We implement therefore a mapping able to make
all cumulative distributions coincide, and
study the properties of this transformation.
We use a sort of “reverse engineering” approach:
instead of introducing a transformation and checking whether it works,
here we impose that the transformation must work and from this assumption
we derive its precise form.
The idea is pretty simple and straightforward.
We use as curve of reference
the cumulative distribution of
raw citation counts obtained
by aggregating together all subject-categories (see Fig. 1).
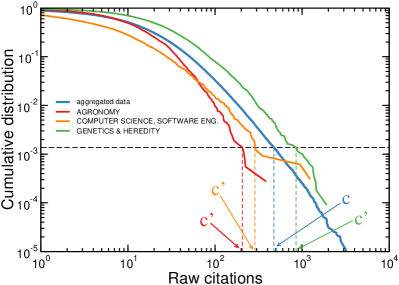
The choice of the curve of reference is in principle arbitrary, and affects the explicit form of the transformation. The use of the aggregated dataset as reference seems, however, a very reasonable choice because it does not require the introduction of any parameter. In general, other choices for the reference curve are possible, but the only important constraints are (i) using the same system of reference for all subject-categories and (ii) producing a mapping that preserves the natural order of citation counts within the same subject-category. We then focus on a specific subject-category , and consider the cumulative distribution of the raw citations received by papers published in journals within subject-category . To each value of , we associate a single value of in the system of reference, where is determined as the value for which . In practice, we implement the mapping by sorting in ascending order all citation counts of the papers present in the aggregated dataset, and then by associating to each different value of , in the dataset of subject-category , the value of that appears in the -th position of the sorted list, with equal to the integer value closest to . In this procedure, different values of may correspond to the same value of . Such event is more likely to happen for low values of , while, for large values of , the mapping is always unique (see Fig. 2).
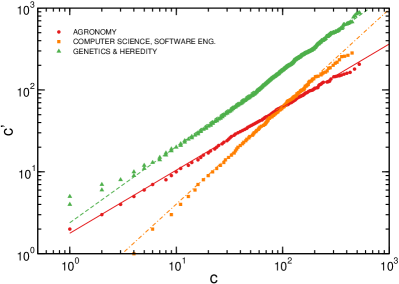
The plot vs. is equivalent to a quantile-quantile () plot, a graphical non-parametric method generally used for comparing two probability distributions wilk68 . If the comparison is made between two samples of randomly and identically distributed variates, all points in the corresponding plot, should approximately lay on the line . If the difference between the two samples is just a scaling factor , then all points in the plot should instead lay on the line . Very interestingly in the case of citation distributions, we empirically find that the relation between and can be described by a power-law function
| (1) |
where and are respectively the pre-factor and the exponent of the mapping (see Fig. 2). The functional form of Eq. 1 holds for virtually all subject-categories and all publication years considered in this study (see Supporting Information S2-S7). Few exceptions are present, the most noticeable represented by the hybrid subject-category “Multidisciplinary sciences”.
The citation distributions of the subject-categories for which Eq. 1 holds are univariate distributions belonging to the same log-location-scale family stat82 . A log-location-scale family of distributions is a class of distributions of continuous variables that can be rewritten in terms of the same reference distribution as , for any choice of the location parameter and the scale parameter stat00 . Citation distributions are defined for discrete variables, but still according to Eq. 1 we can write , where and respectively represent the log-location and the log-scale parameters. In few words, our empirical finding tells us that citation distributions are part of the same log-location-scale family of discrete distributions. Weibull and log-normal distributions are well known log-location-scale families.
II.2 Cumulative distribution of transformed citations
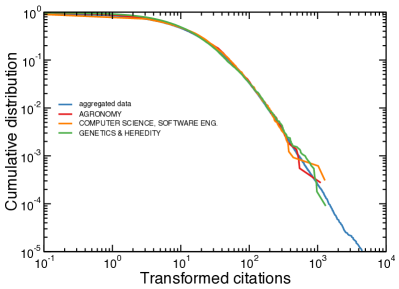
By definition, the transformation maps the cumulative distribution on top of the cumulative distribution of reference (i.e., the one calculated for the aggregated data). Therefore, if the same transformation is applied to the citation numbers of all subject-categories, all cumulative distributions concide, providing a systematic deletion of differences present in the citation patterns. Eq. 1 tells us that the mapping is simple. The citations received by papers published in journals within a specific subject-category can be simply transformed as
| (2) |
if we want to make all citation distributions of single subject-categories coincide with the cumulative distribution of reference. Fig. 3 shows the cumulative distributions resulting after the application of Eq. 2. The cumulative distributions of the transformed citation counts are very similar. Small deviations are still visible at low values of the transformed citation counts, when the discreteness of citation numbers become more important.
II.3 Quantitative test of bias suppression
The fact that all cumulative distributions
of transformed citation counts coincide seems able to
place all subject-categories on the same footing:
when raw citations are transformed
according to Eq. 2, the fraction of papers
with a given value of the transformed citation counts
is almost the same for all subject-categories.
To quantitatively assess such a qualitative result,
we perform an additional test.
The aim of the transformation of Eq. 2 is
to suppress inevitable
biases in raw citation counts
among subject-categories, and thus we
compare our results with the outcome expected
in the absence of biases.
The situation can be modeled in the following terms.
We aggregate all papers of all subject-categories
together, and extract the top
of
publications according to the
value of their transformed citations.
We then compute the proportion of papers in each
subject-category that are part of the top
Assuming all cumulative distributions to be the same, we
expect these proportions to have values close to .
However, since the number of papers in each subject-category
is finite, the proportions of papers
belonging to the top
are affected by fluctuations,
which can be precisely computed (see the Methods section for details).
By checking if the outcome of our selection process
is compatible with the results expected assuming
a random and unbiased selection process,
we test whether we have effectively removed citation biases.
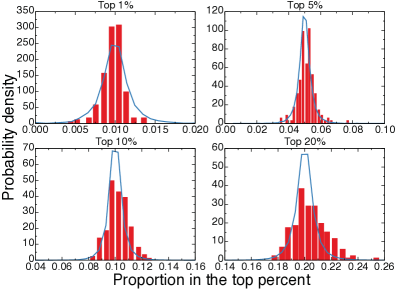
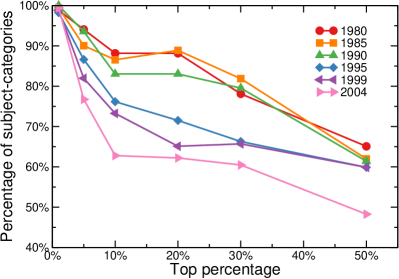
The results of this analysis are reported in Fig. 4 for papers published in , and in the Supporting Information S1-S7 for other publication years. In general, the transformation of Eq. 2 produces, for all years of publication, results that are consistent with an unbiased selection process, if (see Fig. 5). For the most relevant part of the curve (i.e., highly cited papers), the simple transformation of Eq. 2 effectively removes systematic differences in citation patterns among subject-categories. Conversely, for higher values of , the discreteness of citation numbers becomes more relevant, the power-law mapping of Eq. 1 becomes less descriptive, and the distribution of the proportion of top papers measured for real data, despite still centered around the expected value, is wider than expected. The results are even better for papers published before year because the comparison between observed and expected proportions of papers in the top is very good up to . The reason could be due to a higher stability of citation patterns for all subject-categories, since all papers have had more than years to accumulate citations stringer08 .
II.4 Values of the transformation parameters
The values of the transformation factor and
the transformation exponent for the same
subject-category are pretty stable when measured
over different years of publication.
In particular, the value of
is very robust, suggesting that the shape
of the cumulative distribution of
single subject-categories does not vary
with time. For example, over
a span of almost years, the values for
the subject-category “Agronomy” range
in the interval ,
for “Computer science, software engineering”
range in the interval ,
and for “Genetics & heredity” range in the
interval .
Tables
reporting the complete results for all subject-categories
and publication years can be found in the
Supporting Information S2-S7.
The density distribution
of the transformation exponents is peaked
around which means that the shape
of the distributions is in the majority
of the cases the same and
the only difference is a scaling factor (see inset of Fig. 6 and Supporting
Information S8).
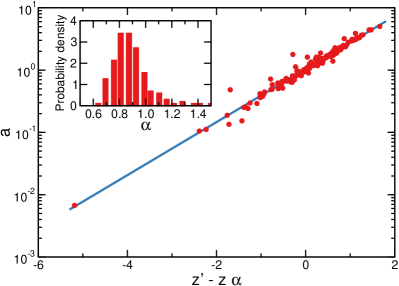
Moreover, the transformation factor and the transformation exponent are related. Let us consider what happens for log-normal distributions. A log-normal distribution is given by , where and are the parameters of the distribution. The parameters and are related to the mean and variance of the distribution: and . A plot between two log-normal distributions with parameters and , and and , respectively, shows a perfect power-law scaling as the one given by Eq. 1. In this case, and are related to the parameters of the distributions by
| (3) |
We checked whether Eq. 3 is valid also
in the case of the citation distributions considered here.
In Fig. 6, we show the results obtained for publication year , while
the plots for the other publication years are reported in Supporting Information S8.
In general for citation distributions, Eq. 3
should be generalized to
, with small but non vanishing
values of and values of slightly different from one.
We conclude that the citations for single
subject-categories are distributed almost log-normally and this reflects
in the values of transformation parameters.
The plot between two log-normal distributions helps also
understanding why the typical values
of are generally smaller than one (inset of Fig. 6 and Supporting Information S8).
According to our choice, the reference
distribution is given by the aggregation of all subject-categories,
and this means that the variance of the resulting distribution is mainly
determined by those of the subject-categories with higher variances.
For the majority of the subject-categories we have , that is
.
III Discussion
The practical importance of citation counts in modern science is substantial, and growing. Citation numbers (or numerical indicators derived from them) are commonly used as basic units of measure for the scientific relevance not only of papers, but also of scientists hirsch05 ; egghe06 , journals garfield06 , departments davis84 , universities and institutions kinney07 , and even entire countries king04 . Citations are direct measures of popularity and influence, and the use of citation numbers is a common evaluation tool for awarding institutional positions bornmann06 and grants bornmann08b . Unfortunately, the direct use of raw citations is in most of the cases misleading, especially when applied to cross-disciplinary comparisons hamilton91 . Citations have different weights depending on the context where they are used, and proper scales of measurements are required for the formulation of objective quantitative criteria of assessment. Saying that a paper in biology is more influential than a paper in mathematics, only because the former has received a number of citations three times larger than the latter, is incorrect. Differences in publication and citation habits among scientific disciplines are reflected in citation and publication counts, and generally cause disproportions that favor disciplines with higher publication and citation rates with respect to those disciplines where publications and citations are created at slower rates. In a certain sense, the situation is similar to the comparison of the length of two streets, one long three and the other two, but without knowing that the length of the first is measured in kilometers while the other in miles.
Differences in citation patterns among scientific domains have been known for a long time hamilton91 and several attempts to the suppression of discipline dependent factors in raw citation counts have been already proposed in the past schubert96 ; vinkler96 ; vinkler03 ; zitt05 ; radicchi08 ; leydes10 . The most common methodology consists in dividing citation counts by a constant factor, and thus replacing raw with normalized citation numbers. Each normalization procedure is, however, based on some assumption. Scientific disciplines differ not only in citation numbers, but also in publication numbers, length of references and author lists, etc. A universal criterion for the complete suppression of differences among scientific domains probably does not exist. There are too many factors to account for, and consequently the ”philosophy” at the basis of a ”fair” normalization procedure is subjective. The formulation of the so-called fractional citation count is, for example, based on a particular idea of fairness leydes10 . Citations are normalized by assigning to each citation originated by a paper a weight equal to the inverse of the total number of cited references in that paper. According to this procedure, the weight of each published paper equals one, but disciplines with higher publication rates are still favored when compared with disciplines with lower publication rates.
In this paper, we consider a different
notion of fairness, based on the reasonable but strong assumption
that each discipline or field of research
has the same importance for the development of
scientific knowledge. A fair numerical
indicator, based on citation numbers, must then assume
values that do not depend on the particular scientific domain
under consideration. Under this assumption,
the probability to find a paper with a given value
of the fair indicator must not depend
on the discipline of the paper, or equivalently, the distribution
of normalized indicators must be the same
for
all disciplines. It is clear that our notion
of fairness strongly depends on the
classification of papers into categories (disciplines,
fields, topics). Also, it is important to remark that
other possible definitions of fairness could be stated,
without relying on the assumption that each discipline
or research field has the same importance for scientific development.
We have then proposed a simple but rigorous method
for the implementation of our notion of fairness.
We have studied the citation patterns of papers published
in more than scientific journals. Our analysis
covers six different years of publication, spanning
over almost years of scientific
production, and includes three millions of papers.
We have found strong regularities
in how citations are attributed to papers dealing with
similar scientific topics of research (i.e., subject-categories).
In particular, we have introduced a simple mapping
able to transform the citation distribution of papers
published within specific subject-categories into
the same distribution.
Very interestingly,
the transformation turns out to be described by a power-law function,
which depends on two parameters
(pre-factor and exponent).
Each specific subject-category is characterized by its parameters,
which are stable over different publication years.
For the vast majority of the subject-categories,
the power-law exponent assumes approximately the same value
suggesting that the main difference between the citation
distribution of different subject-categories
is given only by a scaling factor.
There are, however, subject-categories for which
the transformation is not a power-law function.
In general, these are hybrid subject-categories,
as for example “Multidisciplinary sciences”, or not so well
defined subject-categories, as for example “Engineering, petroleum”
or “Biodiversity conservation”. In the latter cases, the subject-categories
are not well defined because papers within these subject-categories
are also part of other broader subject-categories.
Since the classification of JCR is made at journal level, papers
published in multi-category journals are automatically attributed
to more subject-categories. In this way for example, of papers
published in in journals
within the subject-category “Biodiversity conservation” are also part of
“Ecology”, and of papers published in within
“Engineering, petroleum” are also part of “Energy & fuels”.
These observations cast some doubts regarding the
classification of JCR, which probably requires
serious revisions, especially because it seems that
the classification places on the same footing very broad
subject-categories
and more specific ones.
Despite that, the results reported in this paper
support the claim that citation distributions
are universal, in the sense that they are all part
of the same family of univariate
distributions (i.e., a log-location-scale family stat82 ; stat00 ).
Each citation distribution can be obtained from the same reference
distribution with the only prescription of transforming
the logarithm of its argument with suitably chosen
location and scale parameters.
The transformation generalizes therefore the rescaling
of radicchi08 ,
that can be considered a good approximation
of the full transformation able to suppress field-dependent differences
in citation patterns.
In general, all results obtained in this paper could seem to be explained by assuming that the citations received by papers in each subject-category are continuous variables obeying log-normal distributions. However, this is only approximately true. First, citations are, by definition, non negative discrete numbers. Secondly, even assuming their discreteness, the distribution of citations received by papers within the same subject-category is not statistically consistent with a discrete log-normal distribution. We systematically tested this hypothesis for all subject-categories and publication years, and found that the log-normality of citation distributions cannot be rejected only for a very limited number of subject-categories (see Tables in Supporting Information S9). For papers published in , of the subject-categories have distributions consistent with log-normals (at significance level). This proportion, however, decreases for more recent years of publication: in , in , in , in and in . While the number of citations received by papers published in the same year and journal are log-normally distributed stringer08 ; stringer10 , we should not expect the same for subject-categories. Subject-categories are given by the aggregation of more journals, and the convolution of many log-normals with different averages and variances is not necessarily a log-normal distribution.
We believe that the methods and results reported in this paper can be of great relevance for the entire scientific community. Citation counts and measures based on citations are powerful tools for the quantitative assessment of science, especially in our modern era in which millions of individuals are involved in research but decisions (i.e., allocation of funds) need to be quickly taken. The use of citations is already a common practice, and in the near future will become a necessity. As individuals directly involved in this business, we should therefore develop the best methodologies able to avoid the misuse of citation numbers.
IV Materials and Methods
IV.1 Datasets
We considered papers published in six distinct years: , , , , and . We downloaded from the WOS database wos a total of documents published in scientific journals. Journal titles have been obtained from jcr2009 , and correspond to all journals classified in at least one subject-category by the edition of JCR. According to the JCR classification, a journal may be classified in more than one subject-category. For example, the journal Physical Review D is classified in the subject-categories “Astronomy & astrophysics” and “Physics, particles & fields”. It is also important to stress that JCR classification is made at journal level, and thus does not allow a proper distinction of papers in research topics, whenever papers are published in multi-category journals. In this respect, we adopted, for simplicity, a multiplicative strategy, in which papers published in multi-category journals are simultaneously associated with all corresponding subject-categories. We considered only documents written in “English”, and classified as “Article”, “Letter”, “Note” or “Proceedings Paper”. We obtained a total of publications on which we based our study. More in detail, we considered in our study documents published in , in , in , in , in and in . Summary tables regarding the proportion of documents written in different languages and about the types of published material can be found in the Supporting Information S1. We included in our analysis both cited and uncited publications. The information about the number of cites received by each publication was obtained from the WOS database (field “time cited”) between May and May , .
IV.2 Test of bias suppression
The statistical test proposed here is very similar to the one introduced in radicchi12 . The unbiased selection of papers is equivalent to a simple urn model mahmoud08 , where papers (marbles) of different subject-categories (colors) are randomly extracted, one by one, without replacement. The total number of papers in the urn is , each subject-category is represented by papers, and the total number of extracted papers is . The number of papers of subject-category , extracted in the unbiased selection process, is a random variate obeying a univariate hypergeometric distribution. The proportion of papers of subject-category is still distributed in the same way, with the only difference of the change of variable [if indicates the hypergeometric distribution, the fraction obeys the distribution ]. Similarly, the joint distribution of the number of papers , , …, , belonging respectively to subject-categories , , …, and that have been extracted in the unbiased selection, obey a multivariate hypergeometric distribution. In principle, one could calculate the expected distribution for the proportions of papers belonging to each subject-category and that are part of the top , namely by considering all possible extractions , weighting each extraction with the multivariate hypergeometric distribution, and counting how many times in each extraction the quantity (for all subject-categories ) equals . In practice, it is much simpler to simulate many times ( times in our analysis) the process of unbiased selection, and obtain a good approximation of the probability density of the proportions of papers present in the top . This probability density represents the correct term of comparison for what observed in real data, and furnishes a quantitative criterion for the assessment of whether the transformation of Eq. 2 is able to suppress subject-category biases in citation counts or not.
IV.3 Supporting Information
Supporting Information documents are made available at http://filrad.homelinux.org.
References
- (1) MacRoberts MH, MacRoberts BR (1989) Problems of citation analysis: A critical review. J Am Soc Inform Sci Tec 40: 342–349.
- (2) MacRoberts MH, MacRoberts BR (1996). Problems of citation analysis. Scientometrics 36: 435–444.
- (3) Adler R, Ewing J, Taylor P (2009) Citation statistics. Stat Sci 24: 1–14.
- (4) Bornmann L, Daniel HD (2008) What do citation counts measure? A review of studies on citing behavior. J Doc 64: 45–80.
- (5) Hirsch JE (2005) An index to quantify an individual’s scientific research output. Proc Natl Acad Sci USA 102: 16569–16572.
- (6) Egghe L (2006) Theory and practise of the g-index. Scientometrics 69: 131–152.
- (7) Garfield E (2006) The history and meaning of the journal impact factor J Am Med Assoc 295: 90–93.
- (8) Davis P, Papanek GF (1984) Faculty ratings of major economics departments by citations. Am Econ Rev 74: 225–230.
- (9) Kinney AL (2007) National scientific facilities and their science impact on nonbiomedical research. Proc Natl Acad Sci USA 104: 17943–17947.
- (10) King DA (2004) The scientific impact of nations. Nature 430: 311–316.
- (11) Bornmann L, Daniel HD (2006) Selecting scientific excellence through committee peer review – a citation analysis of publications previously published to approval or rejection of post-doctoral research fellowship applicants. Scientometrics 68: 427–440.
- (12) Bornmann L, Wallon G, Ledin A (2008) Does the committee peer review select the best applicants for funding? An investigation of the selection process for two European molecular biology organization programmes. PloS ONE 3: e3480.
- (13) de Solla Price DJ (1965) Networks of scientific papers. Science 149: 510–515.
- (14) Redner S (1998) How popular is your paper? An empirical study of the citation distribution. Eur Phys J B 4: 131–134.
- (15) Seglen PO (1999) The skewness of science. J Am Soc Inform Sci Tec43: 628–638.
- (16) Laherrére J, Sornette D (1998) Stretched exponential distributions in nature and economy: ’Fat tails’ with characteristic scales. Eur Phys J B 2: 525–539.
- (17) Wallace ML, Larivière V, Gingras Y (2009) Modeling a century of citation distributions. J Informetr 3: 296–303.
- (18) Stringer MJ, Sales-Pardo M, Amaral LAN (2008) Effectiveness of journal ranking schemes as a tool for locating information. PloS ONE 3: e1683.
- (19) Radicchi F, Fortunato S and Castellano C (2008) Universality of citation distributions: toward a an objective measure of scientific impact. Proc Natl Acad Sci USA 105: 17268–17272.
- (20) Stringer MJ, Sales-Pardo M, Amaral LAN (2010) Statistical validation of a global model for the distribution of the ultimate number of citations accrued by papers published in a scientific journal. J Am Soc Inform Sci Tec 61: 1377–1385.
- (21) van Raan AFJ (2001) Two-step competition process leads to quasi power-law income distributions. Application to scientific publications and citation distributions. Physica A 298: 530–536.
- (22) Hamilton DP (1991) Research papers: Who s uncited now?. Science 251: 25.
-
(23)
Thomson Reuters (2009) Science citation index expanded – Subject categories
Avalaible: http://science.thomsonreuters.com/cgi-bin/jrnlst/jlsubcatg.cgi?PC=D
Accessed 2011 June 13. -
(24)
Van Noorden R (2007) Hirsch index ranks top chemists
Avalaible: http://www.rsc.org/chemistryworld/News/2007/April/23040701.asp
Accessed 2011 June 13. -
(25)
Palsberg J (2011) The -index for computer science
Avalaible: http://www.cs.ucla.edu/palsberg/h-number.html
Accessed 2011 June 13. - (26) Leydesdorff L , Bornmann L, Mutz R, Opthof T (2011) Turning the tables on citation analysis one more time: Principles for comparing sets of documents. J Am Soc Inform Sci Tec62: 1370–1381.
- (27) Bornmann L, Mutz R (2011) Further steps towards an ideal method of measuring citation performance: The avoidance of citation (ratio) averages in field-normalization. J Informetr 5: 228–230.
- (28) Schubert A, Braun T (1996) Cross-field normalization of scientometric indicators. Scientometrics 36: 311–324.
- (29) Vinkler P (1996) Model for quantitative selection of relative scientometric impact indicators. Scientometrics 36: 223–236.
- (30) Vinkler P (2003) Relations of relative scientometric indicators. Scientometrics 58: 687–694.
- (31) Zitt M, Ramanana-Rahary S, Bassecoulard E (2005) Relativity of citation performance and excellence measures: From cross-field to cross-scale effects of field-normalisation. Scientometrics 63: 373–401.
- (32) Leydesdorff L, Opthof T (2010) Normalization at the field level: fractional counting of citations. J Informetr 4: 644–646.
- (33) Lundberg J (2007) Lifting the crown–citation z-score. J Informetr 1: 145–154.
- (34) Radicchi F, Castellano C (2011) Rescaling citations of publications in physics. Phys Rev E 83: 046116.
- (35) Bornmann L, Daniel HD (2009) Universality of citation distributions – A validation of Radicchi et al. relative indicator at the micro level using data from chemistry. J Am Soc Inform Sci Tec60: 1664–1670.
- (36) Albarrán P, Crespo JA, Ortuño I, Ruiz-Castillo J (2011) The skewness of science in 219 sub-fields and a number of aggregates. Scientometrics 88: 385–397.
- (37) Waltman L, van Eck NJ, van Raan AFJ (2012) Universality of citation distributions revisited. J Am Soc Inform Sci Tec 63: 72–77.
-
(38)
Thomson Reuters (2011) Web of Science database
Available: http://apps.isiknowledge.com
Accessed 2011 June 13. - (39) Wilk MB, Gnanadesikan R (1968) Probability plotting methods for the analysis of data. Biometrika 68: 1–17.
- (40) Lawless JF (1982) Statistical models and methods for lifetime data. New York: Wiley.
- (41) Mukhopadhyay N (2000) Probability and statistical inference. New York: Dekker.
- (42) Radicchi F, Castellano C (2012) Testing the fairness of citation indicators for comparison across scientific domains: The case of fractional citation counts. J Informetr 6: 121–130.
- (43) Mahmoud HM (2008) Pólya urn models. Boca Raton: Chapman & Hall/CRC.