Grain refinement and partitioning of impurities in the
grain
boundaries of a colloidal polycrystal
Neda Ghofraniha,∗a,b‡ Elisa Tamborini,a,b Julian Oberdisse,a,b Luca Cipelletti,a,b and Laurence Ramosa,b
Received Xth XXXXXXXXXX 20XX, Accepted Xth XXXXXXXXX 20XX
First published on the web Xth XXXXXXXXXX 200X
DOI: 10.1039/b000000x
We study the crystallization of a colloidal model system in presence of secondary nanoparticles acting as impurities. Using confocal microscopy, we show that the nanoparticles segregate in the grain boundaries of the colloidal polycrystal. We demonstrate that the texture of the polycrystal can be tuned by varying independently the nanoparticle volume fraction and the crystallization rate, and quantify our findings using standard models for the nucleation and growth of crystalline materials. Remarkably, we find that the efficiency of the segregation of the nanoparticles in the grain-boundaries is determined solely by the typical size of the crystalline grains.
1 Introduction
††footnotetext: a Université Montpellier 2, Laboratoire Charles Coulomb UMR 5221, F-34095, Montpellier, France. E-mail: neda.ghofraniha@roma1.infn.it††footnotetext: b CNRS, Laboratoire Charles Coulomb UMR 5221, F-34095, Montpellier, France.††footnotetext: ‡ Present address: IPCF-CNR, Dipartimento di Fisica, Universit La Sapienza, Rome-Italy.Impurities affect drastically crystal nucleation, growth and texture and understanding the role they play during the solidification processes is of great interest in material science and engineering 1, pharmaceutical industry 2, mineralogy 3, protein crystallization 4, 5 and life science 6.
Moreover, the control of the texture by addition of solutes is important for tailoring the mechanical properties of crystals 7, 8, 9.
Relevant progress in understanding crystallization of mono and bidisperse systems has been achieved using colloids, that are often regarded as an analog to atoms on larger length and time scales 10, enabling real time studies by direct visualization of processes of importance and interest in condensed matter physics 11, 12. Crystallization of nano- and micro-spheres have been widely investigated numerically 13 and experimentally 14, 15, 16, including in bi-component systems. Binary mixtures of colloids where the volume fraction of the two species is not too unbalanced (up to a factor of 7, but most typically by a factor of 2) exhibit a great variety of crystalline superlattice structures similar to atomic systems 17, 18, 19, 20. By contrast, the addition of a very small amounts of a dopant in a solidifying matrix does not change the crystalline unit cell, but can modify the nucleation 21, 22, 23, and induce crystal growth frustration 24, 25, local defect formation 26 and local fractionation 27, depending on the volume fraction and size of the dopants.
In this article we present a novel strategy for the control of the texture of colloidal polycrystals, based on the addition of small amounts of nanoparticles (NPs) as dopants to a solidifying matrix. We achieve the segregation of NPs in a network of thin sheets that is the colloidal counterpart of the texture of grain boundaries formed during the solidification of crystalline metallic alloys 28 and other molecular materials doped with impurities 29. By varying the NP volume fraction and the rate at which the background matrix is solidified, both the typical mesh size of the dopant network and the efficiency of the partitioning of the NPs between the matrix and the grain boundaries are tuned. In the framework of the classical nucleation theory, we show quantitatively for the first time how both the nucleation and the growth of colloidal crystallites are influenced by the NP volume fraction and the crystallization rate, determining the final grain size.
2 Materials and methods
The colloidal polycrystal is composed of an aqueous solution of Pluronic F108, a commercial PEO-PPO-PEO triblock co-polymer (Serva Electrophoresis GmbH), where PEO and PPO denote polyethylene oxide and polypropylene oxide, respectively. The co-polymer (concentration of 34% w/w) is fully dissolved at . Upon increasing , it self-assembles into spherical micelles of diameter nm, due to the increased hydrophobicity of the PPO block 30. The volume fraction, , of the micelles increases with , until crystallization occurs due to micelle crowding. Differential scanning calorimetry and rheology show that crystallization occurs between and , depending on the heating rate 31. We emphasize that, unlike conventional colloidal systems where controlling precisely and changing in situ the volume fraction is a difficult task, our system allows crystallization to be induced at the desired rate simply by varying , in analogy with molecular materials.
In order to analyze in a quantitative way the crystallization process, as it will be discussed in Sec. 3, it is convenient to map our micellar system onto a hard sphere suspension, by determining the relation between and . The soundness of this approach is supported by previous work 32 showing that the static structure factor of a similar micellar system could be mapped onto that of hard spheres using an affine relation between and . In our case, we determine by comparing the temperature dependence of the sample viscosity in the micellar fluid phase to the volume fraction dependence of the viscosity of hard-spheres suspensions 33. The mapping thus determined is with and 31. With this mapping, rheology measurements in the regime where the sample is solidified very slowly so as to avoid any significant undercooling show that the onset of crystallization occurs at , a value compatible with that expected for slightly polydisperse hard spheres.
We dope the micellar crystal with small amounts (at most v/v) of green-yellow fluorescent carboxylated polystyrene nanoparticles purchased from Invitrogen, with diameter and nm. Neutron scattering measurements show that the microscopic crystalline structure (face-centered cubic, with lattice parameter nm) is preserved upon addition of up to 2% v/v of NPs 34, twice than the highest concentration used here. For confocal microscopy imaging, samples are introduced in chambers of thickness m and solidified by raising the temperature from C to C at a controlled rate, , and visualized at least m from the walls.
3 Results and Discussions
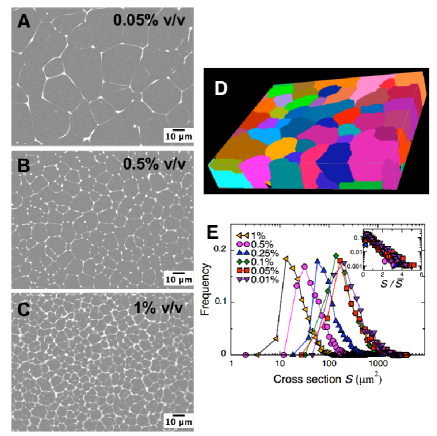
We show in Figs. 1A-C representative images of colloidal samples doped with NPs with diameter . All samples are solidified at the same rate, , and the average NP volume fraction is varied between and . Images exhibit fluorescent (clear) connected thin lines that separate featureless (dark) zones. Confocal scans through the material show that the clear lines are in fact 2-D sections of a network of grain boundaries enriched in NPs that delimitate grains with different crystalline orientations. A 3-D reconstruction of sample with = is reported in Fig. 1D, where different false colors indicate different grains. Figures 1A-C clearly show that the grain size decreases by increasing the amount of NPs. To quantify the influence of NPs, we calculate the cross section area of the grains, . The frequency distribution of for various is reported in Fig. 1E [about cross sections, taken in distinct positions on both sides of the chamber are measured for each experimental condition]. The peak of the distribution moves to smaller values with increasing , demonstrating grain refinement at larger impurity content.
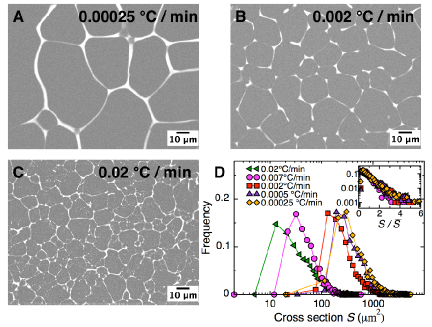
In analogy to atomic crystals and other materials 35, we find that the rate at which temperature is changed during solidification has also a crucial influence on the final grain size, slower ramps leading to a coarser texture. This is demonstrated for samples with a fixed NP volume fraction () and prepared with various temperature ramps, as in the images in Figs. 2A-C and in figure 2D where the size distributions of the cross section area of the grains, spanning two decades, are reported. In all cases, the distributions are relatively narrow, their standard deviation normalized by the average being . Remarkably, we find that the shape of the distributions is almost independent of the NPs volume fraction and of the temperature ramp, as demonstrated by the inset of Fig. 1E (resp. Fig. 2D), where curves for various (resp. ) are collapsed by normalizing the with respect to its mean value, . In the insets, the right tails of the distributions are approximately straight lines in a semi-logarithmic plot, indicating exponential tails.
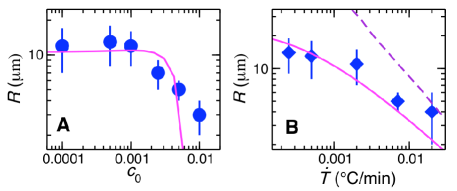
Figures 3A and B display the evolution of the mean radius of the grain, , where is the mean cross-section area, with impurity amount and temperature ramp , respectively. The grain size is of the order of a few micrometers†, with a clear influence of both NP content and crystallization on the size.
To quantitatively analyze our experimental findings, we use classical models for the nucleation and growth of crystalline grains. We first recall how an average grain size can be computed, using the Johnson-Mehl-Avrami-Kolmogorov (JMAK) theory 36, 37, 38, 39, 40 which assumes that nucleation occurs randomly and homogeneously, and that the growth velocity of the crystallites, , does not depend on the extent of the crystallization process and is isotropic. Following JMAK, the extended volume fraction of the sample that has crystallized at time , , reads:
| (1) |
where is the nucleation rate per unit volume at time . The extended volume fraction does not take into account that as crystallization proceeds less fluid phase is available for nucleating new crystallites. Moreover, it doesn’t account for the fact that crystallites stop growing when they impinge into each other. As shown by Kolmogorov and Avrami, these effects can be accounted for by calculating the actual volume fraction that has crystallized, , according to :
| (2) |
The expected grain radius can be calculated from the grain number density at the end of the crystallization process 41, yielding
| (3) |
where is the actual nucleation rate:
| (4) |
Note that the nucleation rate, , and growth rate, , are in general time-dependent quantities. This is indeed the case in our experiments, where crystallization occurs while the sample is submitted to a continuous increase of temperature, leading to a continuous increase of the micelle volume fraction. In the following, we aim at calculating using Eqs. (1-4) in order to compare it to the experimental results of Fig. 3A-B. To this end, explicit expressions are required for and . We start by discussing the growth velocity and assume that is given by the Wilson-Frenkel law 13:
| (5) |
where is Boltzmann’s constant, is the difference in chemical potential between the solid and the liquid phases, is the self diffusion coefficient of the micelles in the liquid phase, and is a typical distance over which diffusion occurs when a micelle in the fluid phase is incorporated in the growing crystallite.
To evaluate , we take advantage of numerical and experimental results on the crystallization of hard spheres (HS) suspensions 13, 14, 16, 42, assuming that micelles in first approximation behave as HS and using the mapping discussed in Sec. 2. We evaluate from numerical simulations of HS colloids 13, where data can be well fitted by with and . In the following, we take as discussed in Sec. 2, while is treated as an adjustable parameter. The volume fraction dependence of for the micelles is estimated from experimental data on the structural relaxation time associated with self-diffusion in suspensions of HS colloids 43, assuming that the diffusion coefficient is inversely proportional to the structural relaxation time. We use the empirical formula , which reproduces very well the experimental data in the range , and use as the diffusion coefficient of a micelle in the dilute regime, where is the solvent viscosity. The quantity is expected to be of the order of the micelle diameter, , although significative differences between simulations and experiments have been reported 13. We set with an adjustable parameter.
We now turn to the nucleation rate . Classical nucleation theory (CNT) 44 predicts
| (6) |
where is the nucleation barrier in the Gibbs free energy to be overcome in order to form a stable nucleus, and the kinetic prefactor . Here is the number of micelles in the critical cluster, and is the number density of the micelles in the liquid phase. According to CNT, is the maximum in the Gibbs free energy, which is the sum of a surface free energy term, , and a volume term, . Here is the radius of a nucleus, is the surface free energy density of the fluid-crystal interface and is the number density of micelles in the solid phase ( with ). One readily finds
| (7) |
For the surface free energy density, we use with an adjustable parameter expected to be of order 11, 42, 45. Numerical simulations of HS 13 show that the number of colloids in the critical nucleus is of order 100 and depends only weakly on the volume fraction: accordingly, we take independent of .
In order to model the effect of the addition of NP, we need to modify the CNT expressions. We assume that the most relevant effect is a modification of the surface free energy term due to the accumulation of NP at the interface between the crystal and the liquid phase (see fig. 5), since slight variations of are known to have a massive impact on nucleation rates 44. We thus neglect any dependence of on NP content, implying that both and the volume term are unchanged upon addition of NP, and propose that the presence of the NPs at the interface leads to a reduction of the surface free energy density. We assume that this reduction is proportional to the amount of NPs at the interface, which in turn is proportional to , the amount of NPs initially available in the volume occupied by a crystallite. Hence, for a nucleus of radius , the reduction of surface energy is proportional to , and to the cross-section of the NPs, . The surface term then becomes , with a proportionality constant. Note that the NP contribution, although physically due to a change of the surface term, formally can be incorporated in the volume term of , because it scales with . In the presence of NPs, the free energy barrier is then obtained by a suitable modification of the denominator of Eq. (7):
| (8) |
Using , , and as adjustable parameters, we fit the experimental using the modified CNT approach outlined above. Operationally, we take as the time at which and, for a given and , we calculate numerically using Eq. (1) and and as given by Eqs. (5,6,8), where the latter quantities depend on time through and . Equations (2-4) are then used to obtain . We show in Fig. 3A-B the best fits as solid lines. While not perfect, the fits exhibit a reasonable quantitative agreement with the experimental data, especially given the order-of-magnitude variations of quantities related to colloidal crystallization often observed in the literature 13. The fitting parameters are: , , and . The three fitting parameters that are independent of NP content and for which a comparison with previous works is possible are in good agreement with numerical results 13, for which , , . Furthermore, this simple model is able to capture the main experimental trends, in particular the roll-off of at slow ramps, which is due to the presence of NPs (compare the continuous and dotted lines in Fig. 3B) . The discrepancy at high observed in in Fig. 3A is presumably due to an over-evaluation of the effect of NPs on the surface tension, due to the fact that, as we shall show it in the following, as increases the fraction of NPs that are effectively expelled from a growing crystallite decreases. Although a qualitative relation between and the typical crystallite size has been reported for metals 46, our work is the first quantitative analysis for colloids of the grain size using nucleation and growth theories 13.
So far, we have shown that both the volume fraction of impurities and the crystallization rate determine the polycrystalline texture, thereby allowing for a fine control of the average grain size over almost one decade. We now turn to the investigation of the degree of confinement of NPs once the solidification process is completed. To better appreciate the spatial distribution of the NPs, we show in Figs. 4A-B confocal images of samples doped with particles large enough () to be individually resolved by confocal microscopy, at least for moderate volume fractions. The dopant volume fraction is kept fixed at , while the effect of is investigated.
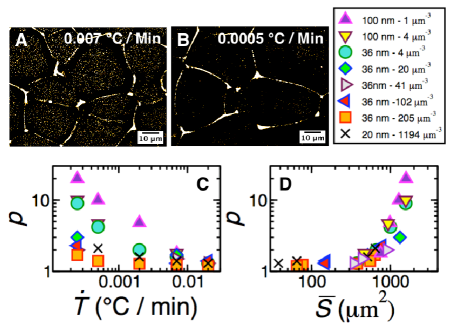
As shown in Fig. 4A, for polycrystals prepared using a relatively fast temperature ramp,
an excess of NPs is observed
in the grain boundaries, consistently with our previous observations with smaller dopants.
However, large numbers of individual NPs are clearly visible also in the interior of the grains.
By contrast, NPs are almost completely expelled from the grains in samples prepared
using a slower ramp (Fig. 4B).
We quantify the efficiency of the partitioning by evaluating the
ratio, , between the NP volume fraction in the grain boundaries and
that in the interior of the grains, as obtained from fluorescence
intensity measurements. Figure 4C shows that
confinement in the grain boundaries becomes increasingly efficient
as the temperature ramp slows down, similarly to observations in atomic
systems 47, and
that, quite generally, decreases when the average number density
of impurities, , increases. Thus, an
increase of either or yields both a finer texture
and a smaller degree of partitioning, suggesting that the degree of
partitioning should correlate with the grain size.
We note that the grain size, directly related to the number of successful nuclei, does not depend on the size of NPs but only on their quantity, signaling the absence
of heterogeneous nucleation on the surface of NPs, as expected since the size of the NPs is comparable to the size of the micelles 21.
Remarkably, we find
that all data for ramp rates spanning two decades, impurity number
density spanning three decades, and for NP diameters ranging between
20 nm and 100 nm indeed collapse onto a master curve when plotting
as a function of the average grain cross section
(Fig. 4D).
Interestingly, is close to unity
and rather insensitive to until , above which the degree of partitioning
increases steeply.
To understand the origin of the correlation between grain size and degree of particle segregation, we analyze the growth of the crystallites during solidification, a quantity not accessible in metallic systems. This is illustrated in Fig. 5 and Supplementary movie S1.
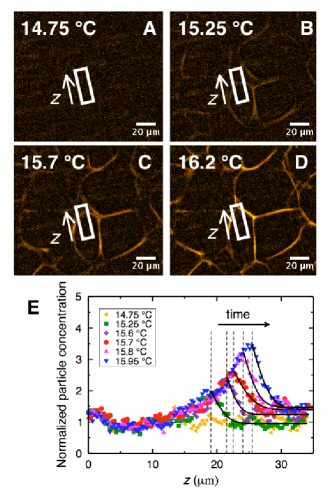
At low temperature, below the onset of crystallization, the images are homogeneously grey down to the smallest length scale that is accessible (1 pixel ), revealing that the impurities are homogeneously distributed in the sample, which is still fully fluid. The nucleation and early stage growth can not be resolved in our confocal microscopy experiments, presumably because the partition of the fluorescent impurities is too weak (Fig. 5A). As solidification proceeds, however, the interface of the growing crystallites becomes increasingly visible, because the fluorescent NPs are expelled by the solid phase and accumulated in the fluid boundary layer (Fig. 5B-C). Eventually, the different grains that are growing touch each other and become facetted, resulting in the formation of a network of grain boundaries where the NPs are confined at a density larger than in the bulk (Fig. 5D). In Fig. 5E we report the normalized impurity volume fraction profiles, obtained from the fluorescent intensity, along the growth direction of one grain from its center: the height of the peak of NP volume fraction increases during the propagation of the solid-fluid interface, indicating that the amount of impurities rejected from the crystallite and accumulated at the interface increases steadily, until the grain stops growing when impinging on an adjacent growing crystallite. Thus, the larger a grain can grow, the higher the volume fraction of the impurities eventually trapped in the grain boundary, explaining the correlation between the grain size and the degree of partitioning shown in Fig. 4D.
As a concluding remark, we note that we have successfully reproduced our experiments with a variety of NP of different kinds, thereby demonstrating that the system described here provides a powerful, robust and convenient way to study the crystallization of bi-disperse colloidal systems and to segregate NPs in thin sheets within a 3-D soft matrix. The colloidal composite material investigated here, thanks to its softness and optical transparency, offers a unique opportunity to investigate in real time and by direct visualization the formation of a polycrystalline texture and its response to an external perturbation. In particular, we are currently exploring the dynamics of the grain boundaries under a mechanical load.
Acknowledgments
We thank P. Olmsted for suggesting the effect of NP on the nucleation barrier, R. Piazza, M. Cloitre, J.-L. Barrat, and D. Frenkel for insightful discussions and J. Lambert for the reconstruction of 3-D images This work has been supported by ANR under Contract No. ANR-09-BLAN-0198 (COMET)
References
- Pan et al. 2000 S. Pan, E. Hudson, K. Lang, H. Eisaki, S. Uchida and J. Davis, Nature, 2000, 403, 746–750.
- Yu et al. 2004 L. X. Yu, R. A. Lionberger, A. S. Raw, R. D’Costa, H. Wu and A. S. Hussain, Adv. Drug Deliv. Rev., 2004, 56, 349–369.
- Davis et al. 2000 K. J. Davis, P. M. Dove and J. J. De Yoreo, Science, 2000, 10, 1134–1137.
- Chernov 2003 A. Chernov, J. Struct. Biol., 2003, 142, 3–21.
- Matsui et al. 2006 T. Matsui, G. Sazaki, H. Hondoh, Y. Matsuura, T. Nakada and K. Nakajima, Journal of Crystal Growth, 2006, 293, 415–422.
- Deville et al. 2006 S. Deville, E. Saiz, R. K. Nalla and A. P. Tomsia, Science, 2006, 403, 515–518.
- Buban et al. 2006 J. P. Buban, K. Matsunaga, J. Chen, N. Shibata, W. Y. Ching, Y. T. and Y. Ikuhara, Science, 2006, 311, 212–215.
- Leyson et al. 2010 G. Leyson, W. Curtin, L. Hector Jr and C. Woodward, Nature Mater., 2010, 9, 750 755.
- Schiotz et al. 1998 J. Schiotz, F. D. Di Tolla and K. W. Jacobsen, Nature, 1998, 391, 561–563.
- Herlach et al. 2010 D. Herlach, I. Klassen, P. Wette and D. Holland-Moritz, J. Phys.: Condens. Matter, 2010, 22, 153101.
- Gasser et al. 2001 U. Gasser, E. R. Weeks, A. Schofield, P. N. Pusey and D. A. Weitz, Science, 2001, 292, 258–262.
- Schall et al. 2004 P. Schall, I. Cohen, D. A. Weitz and F. Spaepen, Science, 2004, 305, 1944–1948.
- Auer and Frenkel 2005 S. Auer and D. Frenkel, Adv. Polym. Sci., 2005, 173, 149–207.
- Palberg 1999 T. Palberg, J. Phys.: Condens. Matter, 1999, 11, R323–R360.
- McConnell and Gast 1996 G. A. McConnell and A. P. Gast, Phys. Rev. E, 1996, 54, 5447–5455.
- He et al. 1996 Y. He, B. J. Ackerson, W. van Megen, S. M. Underwood and K. Schätzel, Phys. Rev. E, 1996, 54, 5286–5297.
- Bartlett et al. 1992 P. Bartlett, R. Ottewill and P. Pusey, Phys. Rev. Lett., 1992, 68, 3801–3804.
- Schofield et al. 2005 A. Schofield, P. Pusey and P. Radcliffe, Phys. Rev. E, 2005, 72, 031407.
- Hachisu and Yoshimura 1980 S. Hachisu and S. Yoshimura, Nature, 1980, 283, 188–189.
- Leunissen et al. 2005 M. Leunissen, C. G. Christova, A. Hynninen, C. P. Royall, A. Campbell, A. Imhof, M. Dijkstra, R. van Roij and A. van Blaaderen, Nature, 2005, 437, 235–240.
- Cacciuto et al. 2004 N. Cacciuto, S. Auer and D. Frenkel, Nature, 2004, 428, 404–406.
- Sear 2006 R. Sear, J. Phys. Chem. B, 2006, 110, 4985 4989.
- Engelbrecht and Sch pe 2010 A. Engelbrecht and H. J. Sch pe, Crystal Growth & Design, 2010, 10, 2259.
- de Villeneuve et al. 2005 V. A. de Villeneuve, R. Dullens, D. Aarts, E. Groeneveld, J. Scherff, W. Kegel and H. Lekkerkerker, Science, 2005, 309, 1231–1233.
- Yoshizawa et al. 2011 K. Yoshizawa, T. Okuzono, T. Koga, T. Taniji and J. Yamanaka, Langmuir, 2011, 27, 342.
- de Villeneuve et al. 2009 V. de Villeneuve, L. Derendorp, D. Verboekend, E. Vermolen, W. Kegel, H. Lekkerkerker and R. Dullens, Soft Matter, 2009, 5, 2448–2452.
- Martin et al. 2003 S. Martin, G. Bryant and W. van Megen, Phys. Rev. E, 2003, 67, 061405.
- Lee et al. 2000 Y. C. Lee, A. K. Dahle and D. H. St John, Metallurgical and Materials Transactions A, 2000, 31, 2895–2906.
- Losert et al. 1998 W. Losert, B. Q. Shi and H. Z. Cummins, Proc. Natl. Acad. Sci., 1998, 95, 431–438.
- Alexandridis et al. 1995 P. Alexandridis, T. Nivaggioli and T. A. Hatton, Langmuir, 1995, 11, 1468–1476.
- Louichi et al. 2012 A. Louichi, E. Tamborini, N. Ghofraniha, J. Oberdisse, L. Cipelletti and L. Ramos, in preparation, 2012.
- Mortensen et al. 1992 K. Mortensen, W. Brown and B. Nordèn, Phys. Rev. Lett., 1992, 68, 2340–2343.
- Cheng et al. 2002 Z. D. Cheng, J. X. Zhu, P. M. Chaikin, S. E. Phan and W. B. Russel, Phys. Rev. E, 2002, 65, 041405.
- Tamborini et al. 2012 E. Tamborini, N. Ghofraniha, J. Oberdisse, L. Cipelletti and L. Ramos, Submitted, 2012.
- Sharma et al. 2011 K. P. Sharma, A. K. Ganail and G. Kumaraswamy, Chem. Mater., 2011, 23, 1448.
- Kolmogorov 1937 A. Kolmogorov, Izv. Akad. Nauk SSSR, Ser. Fiz., 1937, 3, 355.
- Johnson and Mehl 1939 W. A. Johnson and R. F. Mehl, Trans. Am. Inst. Min., Metall. Pet. Eng., 1939, 135, 416.
- Avrami 1939 M. Avrami, J. Chem. Phys., 1939, 7, 1103.
- Avrami 1940 M. Avrami, J. Chem. Phys., 1940, 8, 212.
- Avrami 1941 M. Avrami, J. Chem. Phys., 1941, 9, 177.
- Farjas and Roura 2008 J. Farjas and P. Roura, Phys. Rev. B, 2008, 78, 144101.
- Harland and van Megen 1997 J. L. Harland and W. van Megen, Phys. Rev. E, 1997, 55, 3054–3067.
- Brambilla et al. 2009 G. Brambilla, D. El Masri, M. Pierno, L. Berthier, L. Cipelletti, G. Petekidis and A. B. Schofield, Phys. Rev. Lett., 2009, 102, 085703.
- Abraham 1974 F. F. Abraham, Homogeneous nucleation theory, Academic Press, NY, 1974.
- Hernandez-Guzmán and Weeks 2009 J. Hernandez-Guzmán and E. R. Weeks, Proc. Natl. Acad. Sci., 2009, 106, 15198.
- Shi et al. 1995 F. G. Shi, H. Y. Tong and J. D. Ayers, Appl. Phys. Lett., 1995, 67, 350.
- Eckler et al. 1992 K. Eckler, R. F. Cochrane, D. M. Herlach, B. Feuerbacher and M. Jurisch, Phys. Rev. B, 1992, 45, 5019–5022.