High-temperature Superconductivity in Layered Nitrides -LixMNCl (M = Ti, Zr, Hf): Insights from Density-functional Theory for Superconductors
Abstract
We present an ab initio analysis with density functional theory for superconductors (SCDFT) to understand the superconducting mechanism of doped layered nitrides -LixMNCl (M=Ti, Zr, and Hf). The current version of SCDFT is based on the Migdal-Eliashberg theory and has been shown to reproduce accurately experimental superconducting-transition temperatures of a wide range of phonon-mediated superconductors. In the present case, however, our calculated 4.3 K (M=Zr) and 10.5 K (M=Hf) are found to be less than a half of the experimental . In addition, obtained in the present calculation increases with the doping concentration , opposite to that observed in the experiment. Our results indicate that we need to consider some elements missing in the present SCDFT based on the Migdal-Eliashberg theory.
pacs:
74.20.Pq, 74.25.Kc, 74.62.-c, 74.70.DdI INTRODUCTION
Since the discovery of high-transition-temperature () superconductivity in cuprates,Bednorz-Muller superconductivity in layered transition-metal compounds has been extensively studied. So far, a variety of exotic superconductors such as SrRu2O4, NaxCoO2, iron arsenides and chalcogenides have been found. Among them, layered metallonitride halides (MNX, M=Ti, Zr, Hf; X=Cl, Br, I) discovered by Yamanaka et al.Yamanaka1996 are of great interest, for which was found to be as high as 26 K at maximum.Yamanaka-nat In fact, they had been the second highest record among transition metal compounds until the recent discovery of iron-based superconductors. The mother compounds of MNX consist of stacking of two-dimensional MN block layers, sandwiched by interlayer halogen ions. Since the interlayer bonding is relatively weak, we can intercalate various Louis bases between the layers or deintercalate halogen atoms for the carrier doping.Yamanaka-review Interestingly, while the mother compounds are non-magnetic band insulators, they become superconductors upon doping. This is in high contrast with many other superconducting layered transition metal compounds, for which various magnetic phases reside in the vicinity of the superconducting phase.
When we consider the mechanism of superconductivity in the doped MNX, we have two possibilities. One is a conventional scenario based on the Migdal-Eliashberg (ME) theory, Migdal ; Eliashberg ; Scalapino ; Schrieffer where the superconductivity is mediated by phonons, and the damping and retardation effects are treated by self-consistent perturbation theory, retaining the lowest-order dressed-phonon and dressed-Coulomb contributions to the self energy. The momentum dependences of the gap function, self energy, and screened Coulomb interaction is neglected within the energy scale of phonons. In the ME theory, the screened Coulomb interaction is conventionally addressed with the random-phase approximation (RPA) and the frequency dependence is totally ignored. The other scenario is to consider the factors neglected in the ME theory, in which we consider various pairing glues other than phonons, such as spin, charge, or orbital fluctuations. In fact, for some layered transition metal superconductors, it has been believed that the pairing mechanism is unconventional. For example, the anisotropic -wave pairing in cuprates and triplet pairing in Sr2RuO4 are difficult to understand within the ME theory. As in the case of iron-based superconductors, when the electron-phonon coupling is weak,Boeri2008 we can also safely exclude the possibility of the conventional scenario. On the other hand, the situation is not so simple for doped MNX.
Experimentally, the Knight shift decreases toward zero below , indicating that the Cooper pair is spin singlet.Tou-isotope ; Tou-NMR2010 The break-junction and scanning tunneling spectroscopy measurements suggest that the gap function does not have nodes.Ekino-tunnel ; Takasaki-tunnel2005 ; Takasaki-tunnel2010 While these are typical behaviors of conventional superconductors, there are also several observations which support unconventional scenario. Measurements of uniform spin susceptibilityTou-suscep and specific heatTaguchi-specheat indicate that the electronic density of states (DOS) at the Fermi energy () is small and the estimated total electron phonon coupling is smaller than 0.22. On the other hand, the specific-heat Taguchi-specheat and tunneling-current measurementsEkino-tunnel ; Takasaki-tunnel2005 ; Takasaki-tunnel2010 give a rather large superconducting gap ratio 4.6-5.2 or even larger, implying the strong effective pairing interaction between electrons. Also, the nitrogen isotope effect coefficient has been reported to be markedly small as 0.07,Tou-isotope ; Taguchi-isotope compared with the value of 0.5 for the BCS superconductor.BCS Doping dependence of (Ref. Taguchi-doping, ; Takano-molecular, ; Kasahara2009, ) is also difficult to understand in terms of the conventional scenario; particularly in -LixZrNCl, it becomes higher with decreasing doping and exhibits the highest value at the border of the Anderson insulating phase and the superconducting phase. On top of these, more recently, it has been reported that the spin-lattice relaxation rate of the nuclear-magnetic resonance does not exhibit the coherence peak,Tou-NMR2007 ; Kotegawa-JPS2011 and muon spin rotation measurement indicates that the gap function has a significant anisotropy.Hiraishi
As for theoretical studies, both the phonon and electron mechanisms have been examined and proposed. For the electron mechanism, a possibility of spin-fluctuation-mediated superconductivity has been studied within the lattice Fermion model.Kuroki2008 ; Kuroki2010 ; Kasahara2009 ; Choi-Kuroki2011 ; Yin-Pickett For the phonon mechanism, ab initio analyses based on the ME theory have widely been performed: Heid and Bohnen Heid-DFPT calculated the phonon spectrum and the electron-phonon coupling using density functional perturbation theory and estimated using the dirty-limit gap equation.Bergman-Rainer They found that is as large as 0.5 for -Li1/6ZrNCl and the value is too small to explain the experimental value, 16 K, with setting the Coulomb pseudo potential (Ref. Morel-Anderson, ) to a typical value of 0.10. Weht et al.Weht-band evaluated the Hopfield-McMillan parameter , also a measure of the electron lattice coupling, for -Na0.25HfNCl using the Gaspari-Gyorffy formula.Gaspari-Gyorffy They found that 0.5 and 0.2 , which are one order of magnitude smaller than those of the binary transition-metal-nitride superconductors with 20 K.Klein-Pickett On the other hand, recently, Yin et al.Yin-Kotliar proposed that is estimated to be larger if we employ the hybrid Heyd-Scuseria-Ernzerhof functionalHSE and given by the Macmillan-Allen-Dines (MAD) formulaMcMillan ; AllenDynes with =0.1 shows a nice agreement with experiments. It should be noted here that there are many examples where substantially (larger than 50%) deviates from the typical value ,Carbotte so the problem whether the experimental can be described within the ME theory is yet to be clear. We also note that there have been several studies which try to consider the physics beyond the ME theory; for example, Bill et al. showed that acoustic plasmon can enhance the phonon-mediated superconductivity.Bill-rapid2002 There are also several studies which propose that disorder can enhance the pairing instability in systems with phonon-mediated attractive interactions.Kravtsov ; Burmistrov
For the electronic interaction, there are many efforts for describing it from first principles. Lee et al.Lee-Chang-Cohen proposed a method to evaluate the bare Coulomb parameter with ab initio RPA calculations. However, there still remains an empirical parameter representing the electronic energy scale, needed for obtaining the renormalized value . On the other hand, Lüders et al. recently developed a parameter-free method to calculate based on density functional theory for superconductors (SCDFT),Luders ; Oliveira where electron-phonon coupling and electron-electron interactions are nonempirically treated. Since the exchange-correlation kernels are constructed on the basis of the ME theory, the current-stage SCDFT has a close correspondence with the ME theory. This method has been applied to a wide range of typical phonon-mediated superconductors such as simple metals,Marques-metals MgB2,Floris-MgB2 calcium-intercalated graphite,Sanna-CaC6 Li, K and Al in high pressureProfeta-pressure and CaBeSi,Bersier-CaBeSi and the reliability on the quantitative aspect has been examined and established, where s have shown agreements with experimental results within a range of few K.
In this work, we performed an SCDFT analysis for the lithium-doped -MNCl (M=Ti, Zr, Hf) superconductors to examine whether they can be described by the current SCDFT formalism based on the ME theory. We calculate electronic structures, phonon spectra, electron-phonon couplings, screened Coulomb interactions in the RPA level to estimate superconducting and examine the results focusing on the metallic-atom and doping dependences. We found that estimated by SCDFT is at maximum half of the experimental and its doping dependence is opposite to experiments, both of which imply that, as in the unconventional superconductors, the present superconductors require some elements missing in the conventional ME theory.
In Sec. II, we review the SCDFT formalismLuders ; Marques-metals ; Massidda and describe our computational detail. Applications to aluminum and niobium are performed in Sec. III to test the reliability of our calculations. We show results for -LixMNCl in Sec. IV. Section V is devoted to discussions. Summary and outlook are drawn in Sec. VI.
II METHOD
In SCDFT, we solve the following gap equationLuders ; Marques-metals
| (1) |
Here, and denote the band index and crystal momentum, respectively, is the gap function, and is the inverse temperature. The energy is defined as = and is the one-electron energy measured from the chemical potential , where is obtained by solving the normal Kohn-Sham equation in density functional theory (DFT)
| (2) |
with and being the Kohn-Sham Hamiltonian and the Bloch state, respectively. In Eq. (1), and are the exchange-correlation kernels in the SCDFT formalism. For the superconducting phase, the self-consistent solution of Eq.(1) becomes nonzero; thereby we determine .
The exchange-correlation kernels and are defined by the second-order derivative of the exchange-correlation energy with respect to the electronic anomalous density. In the present study, we consider the three terms footnote-diagrams shown in Fig. 1, to derive [(a)], [(b)], and [(c)]. Here, () is the lowest-order contributionGorling-Levy ; Migdal to the exchange-correlation kernel due to the interaction between phonons and normal (anomalous) electrons, and represents the exchange-correlation interaction between anomalous electrons via screened Coulomb interaction in the low-frequency limit.
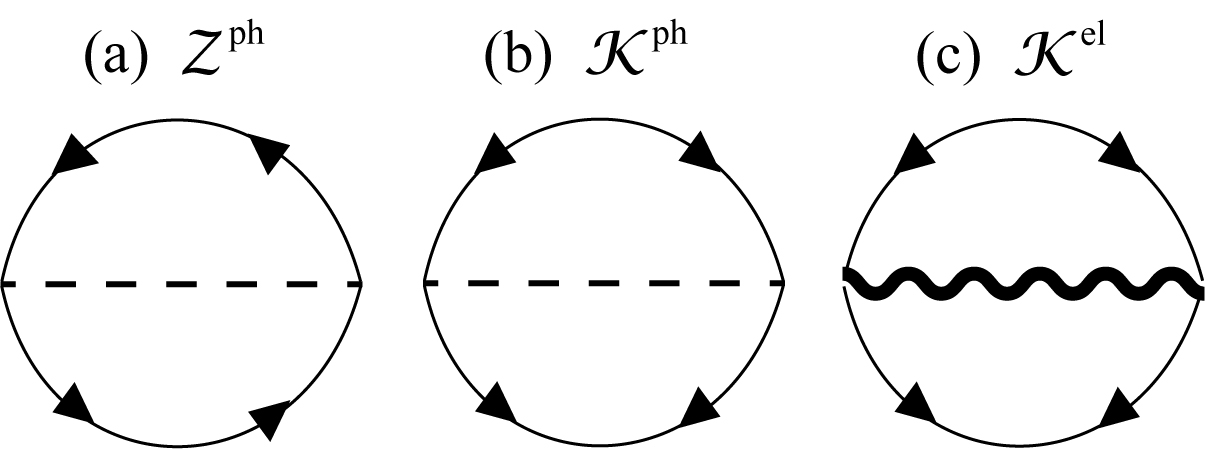
These kernels are given in the form averaged over the phonon energy and the electronic energy ranging from to as
| (3) | |||||
and
| (4) | |||||
respectively, where is the electronic density of states (DOS) at the Fermi energy per spin and is the Eliashberg function defined as
| (5) |
Here, is the phonon frequency of the mode in the branch . Hereafter, we use and to specify the momentum of electrons and phonons, respectively. The is the phonon linewidth and given as
| (6) |
with being the electron-lattice coupling as
| (7) |
Here, is the potential derivative with respect to phonon normal mode, which couples the two electronic states and .
The integrand function in Eq. (4) is written as
| (8) | |||||
where and are the Fermionic and Bosonic distribution functions, respectively. The integrand function in Eq. (3) is given as
| (9) |
with
| (10) | |||||
The kernel ascribed to the screened Coulomb interaction between the Cooper pairs is given as
| (11) | |||||
where is the static screened Coulomb interaction. In this paper we evaluate this term with two kinds of approximations, i.e., the Thomas-Fermi approximation (TFA) (Ref. Marques-metals, ) and the random-phase approximation (RPA). Sanna-CaC6 ; Massidda ; Hybertsen-Louie Within TFA, the screened Coulomb interaction is written with the Thomas-Fermi wavenumber as
| (12) |
Since is given by the sum of its Fourier components as
| (13) |
substitution of Eq. (12) into Eq.(11) yields
| (14) |
with
| (15) |
where is the reciprocal lattice vector, is the volume of the unit cell, and denotes the integration within the unit cell. In this approximation, the screened interaction is isotropic and the screening length is determined by the electronic DOS at the Fermi energy. This interaction is nothing but that derived from the RPA in the vacuum and in the long-wavelength limit, where the local field effect of crystal is totally ignored in the calculation of screening.
We next consider the RPA expression of the screened Coulomb interaction in the low-frequency limit. In general, the screened Coulomb interaction of crystal is expressed with the double-Fourier transform asHybertsen-Louie
| (16) |
with
| (17) |
Here, is the wavevector in the first Brillouin zone and is the symmetrized dielectric matrix,Hybertsen-Louie which is calculated using the following expression
| (18) |
with being the independent-particle polarization as
| (19) | |||||
After inserting Eq. (16) into Eq. (11) and with =, we obtain
| (20) |
The resulting kernel includes the local-field effect on the screening in the real crystal. In this expression, has a singularity at = and = or =. This singularity is avoided following Ref. Pick-ASR, .
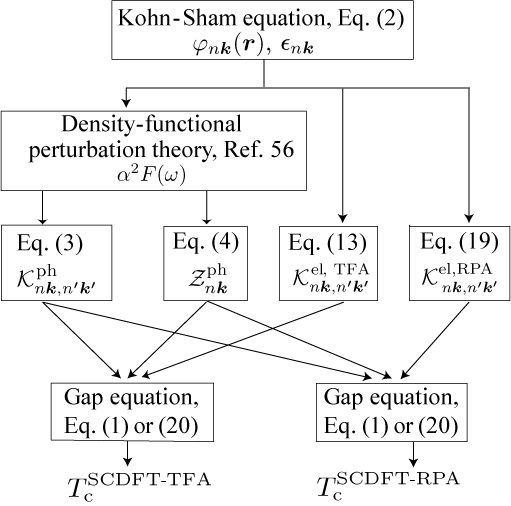
Figure 2 describes the flowchart of the present SCDFT calculations. Starting from solving the Kohn-Sham equation in Eq. (2), we next perform density-functional perturbation calculations to obtain , which generates electron-phonon kernels [Eq. (3)] and [Eq. (4)]. Also, we calculate the electron-electron kernel for TFA with Eq. (14) and for RPA with Eq. (20). With these information as inputs, the gap equation in Eq. (1) is solved. According to the two types of and , two values of are estimated, which are denoted as and . From comparison between and , we study the effects beyond the uniform and local electronic screening on the transition temperature.
We remark some technical details when we solve the gap equation in Eq.(1). In the present calculation, the states in the gap equation, labeled by , are generated by sampling; they are generated so that their density distributes logarithmically in the energy range of interest. For this purpose, with a given band , the Brillouin zone (BZ) is divided into four regions, following a criterion for ; (i) , (ii) , (iii) , (iv) , where is the energy of the sampling state and () are the energy criteria. In the present case, , , and are set to eV, eV, and eV, respectively. Next, to realize logarithmic distribution of the sampled states, we introduce an acceptance ratio for each region; =1 for (i), =0.1 for (ii), =0.01 for (iii) and =0.002 for (iv). With this acceptance ratio, the randomly-generated sampling states form a logarithmic distribution. For the resulting points, the energy and the exchange-correlation kernels and are evaluated with the linear tetrahedron interpolation schemetetrahedra ; comment-kernel for the original ab initio data. On the ground that the density of the sampling points is not uniform, the gap equation in Eq.(1) is rewritten as
| (21) | |||||
with being the weight normalized as for each . Here, specifies the region where the sampling state belongs, and is the volume of the region in the first BZ for band , estimated by the frequency of sampling.Kawamura-priv The total number of the accepted sampling points, , also depends on and . We found that 10,000 sampling states per band crossing the Fermi energy assure a convergence within a few percent.
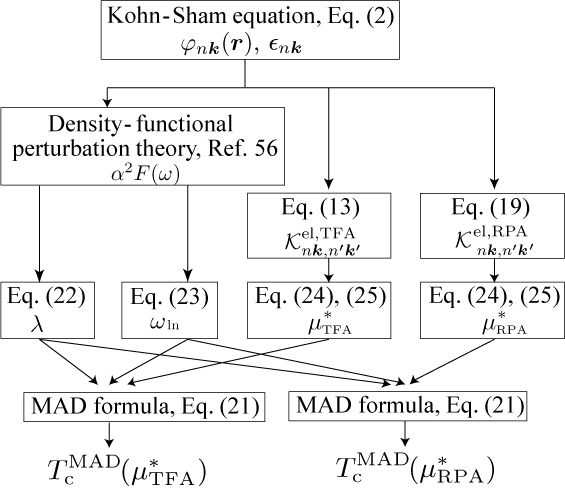
As a reference, we also calculate using the McMillan-Allen-Dynes formula (MAD)
| (22) |
The parameters and are defined using the Eliashberg function as
| (23) |
and
| (24) |
respectively. The parameter in Eq. (22) is an effective Coulomb pseudopotential in the narrow energy region within the Debye frequency above/below the Fermi level. Within RPA, Lee-Chang-Cohen is written with the renormalization formulaMorel-Anderson as
| (25) |
where is a parameter defining the electronic energy scale. It is conventionally set to the Fermi energy measured from the conduction-band bottom, assuming that the band dispersion is parabolic. The bare is defined as
| (26) |
where is the average of the electronic interaction over the Fermi surface and is defined as
| (27) |
Since is estimated for both of [Eq. (14)] and [Eq. (20)], we distinguish them as and . Thus, we derive the two values, i.e., and . We summarize in Fig.3 the procedure of the MAD calculations.
In the MAD analysis, the quantitative reliability of the resulting is somewhat ambiguous, because the renormalization formula in Eq. (25) includes an empirical parameter . An advantage of the SCDFT framework over the MAD analysis is that the former does not contain any empirical parameters such as . In the present paper, we study quantitatively the electronic-interaction effect on with systematic comparisons between SCDFT and MAD, and between TFA and RPA.
III Simple Metals
To check the reliability of our SCDFT code, we applied it to benchmark systems; aluminum and niobium, which are weak-coupling and strong-coupling BCS superconductors, respectively. The comparison between our results and experiments, together with other SCDFT result based on TFA, Marques-metals are shown in Table 1. The table also contains the values based on the MAD formula and several key parameters used in the MAD calculations.
| Al | Nb | |
| [K] | 0.79 | 9.9 |
| [K] | 0.72 | 8.5 |
| [K] | 1.49 | 15.1 |
| [K] | 1.43 | 14.5 |
| [K] | 0.9011footnotemark: 1 | 9.511footnotemark: 1 |
| [K] | 1.2022footnotemark: 2 | 9.2622footnotemark: 2 |
| 0.419 | 1.305 | |
| [K] | 308 | 164 |
| 0.257 | 0.329 | |
| 0.269 | 0.433 | |
| 0.105 | 0.119 | |
| 0.107 | 0.130 | |
| 0.23633footnotemark: 3 | 0.48844footnotemark: 4 | |
| 0.10033footnotemark: 3 | 0.13344footnotemark: 4 | |
| aSCDFT result with in Eq. (14) taken | ||
| from Ref.Marques-metals, . | ||
| bExperimental values taken from Ref.Ashcroft, . | ||
| cAb initio RPA result in Ref.Lee-Chang-Cohen, . | ||
| dAb initio RPA result in Ref.Lee-Chang-Nb, . | ||
Our calculated and show a good agreement with the previous calculation () and the experiments (). The small deviation between the present and previous calculations comes from minor differences in used for the calculation of the phononic kernels. It is interesting to note that the MAD formula significantly overestimates [see and in the table]. This error can partly be attributed to the oversimplification of the electronic-interaction kernel in MAD, i.e., the use of in Eq. (26), comment-approx ignoring the wavenumber dependence of the screened Coulomb interaction. In this approximation, the Coulomb interaction is approximated by a function in the real space, so that electrons forming the Cooper pair do not feel distant Coulomb repulsion. As a result, the electronic interaction is estimated to be smaller in MAD than SCDFT considering the wavenumber dependence of the Coulomb interaction and obtained by the MAD formula tends to be higher than estimated within SCDFT. We also note that the difference between TFA and RPA is small, which indicates that the local-field effect is not so significant for Al and Nb.
We note that the deviation of our from the experiment for Al is relatively large if we consider the ratio. As suggested in Ref.Marques-metals, , in the superconductors with small gap with below a few K, the value is a consequence of a subtle balance between the electron-phonon coupling and the screened electron-electron interaction, thereby systematic errors depending on the computational details of approximations are strongly enhanced. This type of error arising from a subtraction of two nearly equal quantities does not occur in the superconductors with relatively high and do not need to be worried in the following sections.
IV Layered nitride chlorides
IV.1 Computational Detail
Ab initio electronic and lattice-dynamical calculations were performed for lithium-doped layered metallonitride chrolides, -LixMNCl (M=Ti, Zr, and Hf) with the three doping rate =0.0, 0.3, and 0.5 with Quantum Espresso package,QE where the local density approximation (LDA) with the parameterization by Perdew and Zunger PZ81 ; Ceperley-Alder and the Troullier-Martins norm-conserving pseudopotentialsTroullier-Martins were employed. The pseudopotentials for Ti, Zr, and Hf were generated in the semicore configurations of (3)2.0(3)6.0(3)2.0, (4)2.0(4)6.0(4)2.0, and (5)2.0(5)6.0(5)2.0, respectively. The scalar-relativistic correctionKoelling-Harmons was applied to the Zr and Hf pseudopotentials. The Li pseudopotentials were supplemented with the partial core correction.Louie-pcc The lattice parameters and internal coordinates were fully optimized. We checked that our calculations for the relaxed structures and the -point phonon frequencies well reproduce the experiments (Appendix A).
The cutoff energies in the wavefunctions were set to 75 Ry, 80 Ry, and 90 Ry in the Ti, Zr, and Hf compounds, respectively. The charge density was described with the 888 points in the Monkhorst-Pack gridsMP-grid and the electronic DOS was calculated using the denser 323232 grids. Phonon dynamical matrices were calculated with the 444 points, while the electron-phonon couplings {} in Eq. (7) were calculated with the 444 phonon modes and the 323232 wavefunctions. The polarization matrix {} in Eq. (19) was expanded with the plane waves with the cutoff of 12.8 Ry and calculated on the 555 grid. The Kohn-Sham states within a range [12 eV, 36 eV] were included in the polarization calculation. The Fermi-surface integrals involving in Eq. (6) and in Eq. (26) were performed using the first-order and zeroth-order of the Hermite-Gaussian smearing,Methfessel-Paxton respectively. The smearing width was set to 0.020 Ry in =0.5 and 0.025 Ry in =0.3. The SCDFT calculation in Eq. (21) was done with 10,000 sampling points for bands crossing the Fermi energy and 500 points for the others, where we considered 25 valence and 25 conduction bands.
IV.2 Atomic geometry
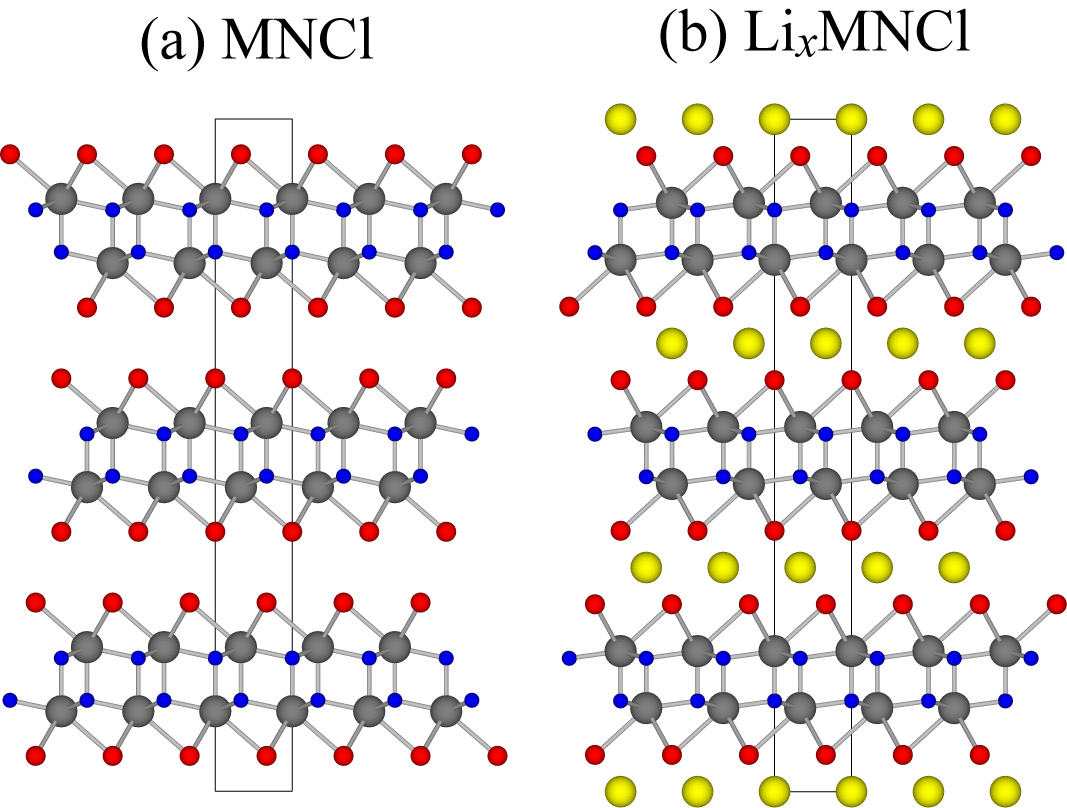
We show in Fig. 4 atomic structures of -ZrNCl (a) and -Li0.5ZrNCl (b). We display the side view along the axis. The atomic structure consists of stacking block layers made from Zr (gray), N (blue), and Cl (red) atoms. On inserting Li (yellow) in between the block layers, the crystal slightly expands. Here the positions of the Zr, N, and Cl atoms, as well as the intercalated Li atom have been determined with experiments.Shamoto-stacking ; Fuertes ; Istomin ; Adelmann ; Chen-nondoped ; Chen-doped It is also experimentally confirmed that the stacking order of the layers for doped systems is different from that of the mother compounds.Shamoto-stacking The Hf compounds basically take the same structure.Fuertes ; Shamoto2004 The details of the atomic configuration are found in Ref. Yamanaka-review, .
We summarize in Table 2 the optimized structural parameters for the non-doped system -MNCl. The lattice parameters are approximately 3% smaller than the experiment and the internal parameters agree well with it. Although the Ti compound with the structure is not synthesized experimentally, in the present paper, we study this material as a reference and compare it with other materials. The optimized internal parameters of the Ti compound are very similar to those of the Zr and Hf compounds, whereas the lattice parameters are somewhat smaller, which is reasonably understood in terms of smallness of the ionic radius of Ti.
| M | Ti | Zr | Hf | |||||
| present | present | expt.a | theoryb | present | expt.a | |||
| [Å] | 3.342 | 3.553 | 3.605 | 3.556 | 3.488 | 3.577 | ||
| [Å] | 26.164 | 26.879 | 27.672 | 27.178 | 26.762 | 27.711 | ||
| (M) | 0.120 | 0.119 | 0.119 | 0.118 | 0.119 | 0.120 | ||
| (N) | 0.197 | 0.198 | 0.198 | 0.198 | 0.198 | 0.198 | ||
| (Cl) | 0.388 | 0.386 | 0.388 | 0.386 | 0.387 | 0.388 | ||
| aSingle-crystal X-ray diffraction measurement | ||||||||
| taken from Ref. Chen-nondoped, . | ||||||||
| bAb initio DFT-LDA full-potential result in Ref. Sugimoto-Oguchi, . | ||||||||
We next show in Table 3 our calculated structural parameters for the doped system -LixMNCl. For the Zr compounds, the theoretical parameters agree well with experiments. For the Hf compounds, the experimental parameter is somewhat larger than the theoretical value, which may originate from the difference in the intercalated atoms, Li and Na. For the reliable description of the atomic structure of the incommensurate filling =0.3, the virtual crystal approximation that the Li ionic charge is artificially reduced from the nominal value of 3 to 2.6 was employed. This is critical to reproduce the experiment; a conventional treatment of electron doping with a uniform compensating positive background charge leads to an inaccurate description for the lattice parameters, a deviation from the experiment by 10 %. In our virtual crystal approximation, the error is 1% for the Zr compound.
| M | Ti | Zr | Hf | |||||||
| present | present | expt.a | present | expt.b | ||||||
| 0.3 | 0.5 | 0.3 | 0.5 | 0.20 | 0.3 | 0.5 | 0.29 | |||
| [Å] | 3.394 | 3.406 | 3.604 | 3.616 | 3.591 | 3.541 | 3.561 | 3.589 | ||
| [Å] | 27.740 | 27.524 | 28.163 | 27.942 | 27.839 | 28.173 | 27.795 | 29.722 | ||
| (M) | 0.207 | 0.206 | 0.209 | 0.208 | 0.213 | 0.208 | 0.207 | 0.208 | ||
| (N) | 0.136 | 0.134 | 0.135 | 0.132 | 0.136 | 0.135 | 0.133 | 0.137 | ||
| (Cl) | 0.391 | 0.385 | 0.388 | 0.383 | 0.389 | 0.389 | 0.384 | 0.394 | ||
| aSingle-crystal X-ray diffraction measurement in Ref. Chen-doped, . | ||||||||||
| bPowder neutron diffraction measurement for -NaxHfNCl in Ref. Shamoto2004, . | ||||||||||
IV.3 Electronic Bandstructure
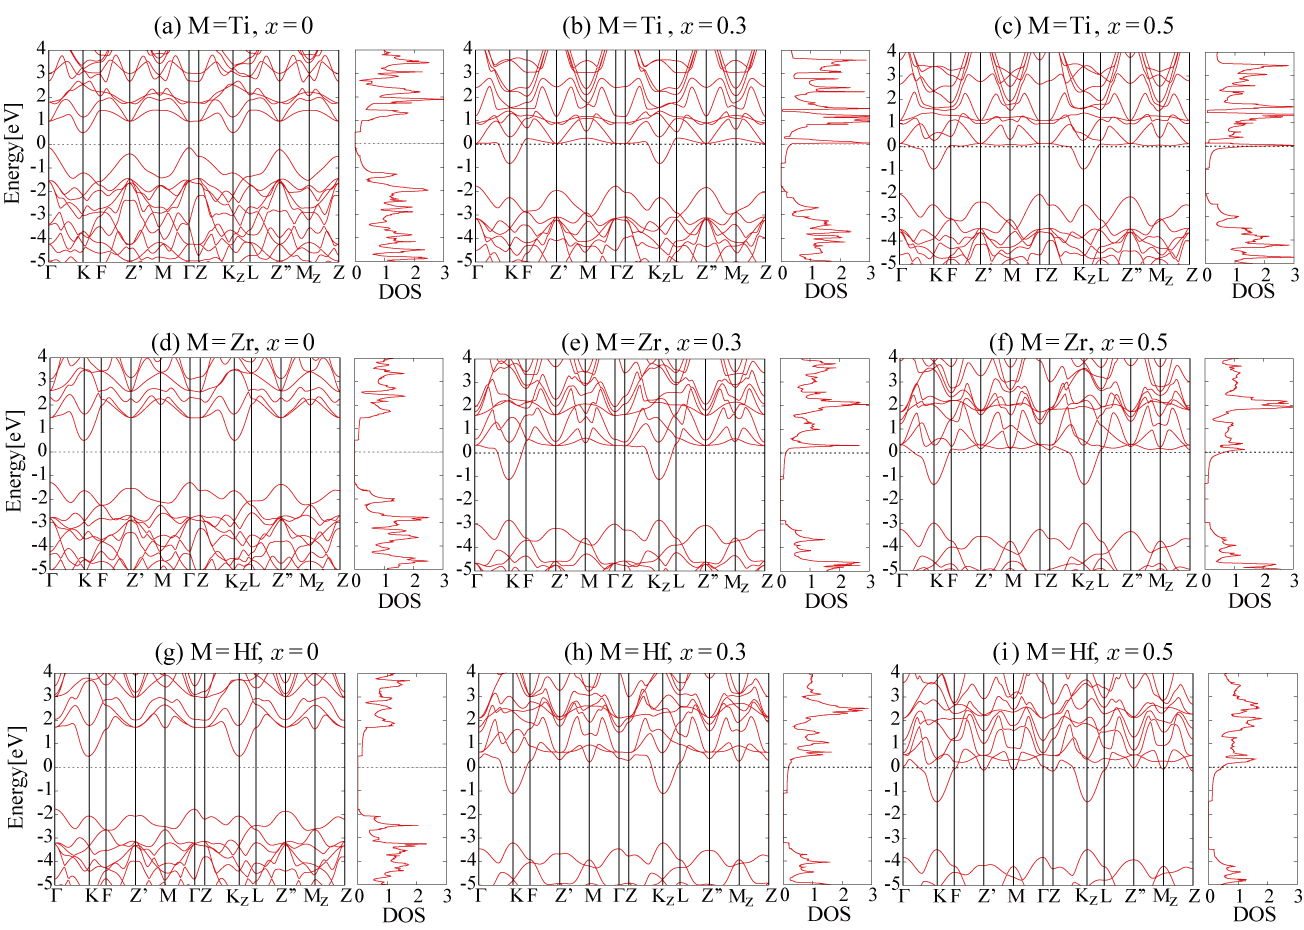
We show in Fig. 5 our calculated band structure and electronic DOS of -LixMNCl (=0, 0.3, and 0.5; M=Ti, Zr, and Hf) for the range of [5 eV, 4 eV]. The undoped system (=0) is an insulator with a band gap of 0.5 eV for M=Ti and 2 eV for M=Zr and Hf. Upon doping (from the left to right panels), we see that carriers are accommodated in the conduction bottom, without changing its two-dimensional dispersion significantly. While the DOS of this two-dimensional band is almost constant as a function of energy, increases (see Table 4) by carrier doping. For the material dependence (from the top to bottom panels), we see that the band structures have several common features; for example, the conduction bottom always locates at the K point. On the other hand, DOS around the Fermi level is larger for the lighter element systems. In particular, the Ti compounds have high because the van-Hove singularity is closer to the conduction bottom, which seems favorable to have a strong electron-phonon coupling.
| M | Ti | Zr | Hf | ||||||
| 0.3 | 0.5 | 0.3 | 0.5 | 0.3 | 0.5 | ||||
| 0.342 | 1.675 | 0.191 | 0.662 | 0.176 | 0.437 | ||||
| – | – | 0.23a | 0.25b | ||||||
| – | – | 0.169–0.146c | 0.19d | ||||||
| 0.286 | 0.411 | 0.552 | 0.982 | 0.827 | 1.292 | ||||
| – | – | 0.22a | – | – | |||||
| – | – | 0.521–0.508c | – | – | |||||
| [K] | 459 | 429 | 421 | 305 | 324 | 204 | |||
| [K] | – | – | 422–415c | – | – | ||||
| 0.771 | 1.705 | 0.329 | 0.576 | 0.413 | 0.367 | ||||
| 0.238 | 1.066 | 0.161 | 0.441 | 0.161 | 0.263 | ||||
| 0.281 | 0.331 | 0.177 | 0.218 | 0.200 | 0.178 | ||||
| 0.155 | 0.296 | 0.113 | 0.196 | 0.114 | 0.149 | ||||
| aSpecific-heat measurement taken from Ref.Taguchi-specheat, . | |||||||||
| bMagnetic susceptibility measurement taken from Ref.Tou-suscep, . | |||||||||
| cAb initio DFT-LDA result for -Li1/6ZrNCl in Ref.Heid-DFPT, . | |||||||||
| dAb initio DFT-LDA result for -Na0.20HfNCl in Ref.Weht-band, . | |||||||||
IV.4 Phonon Spectra
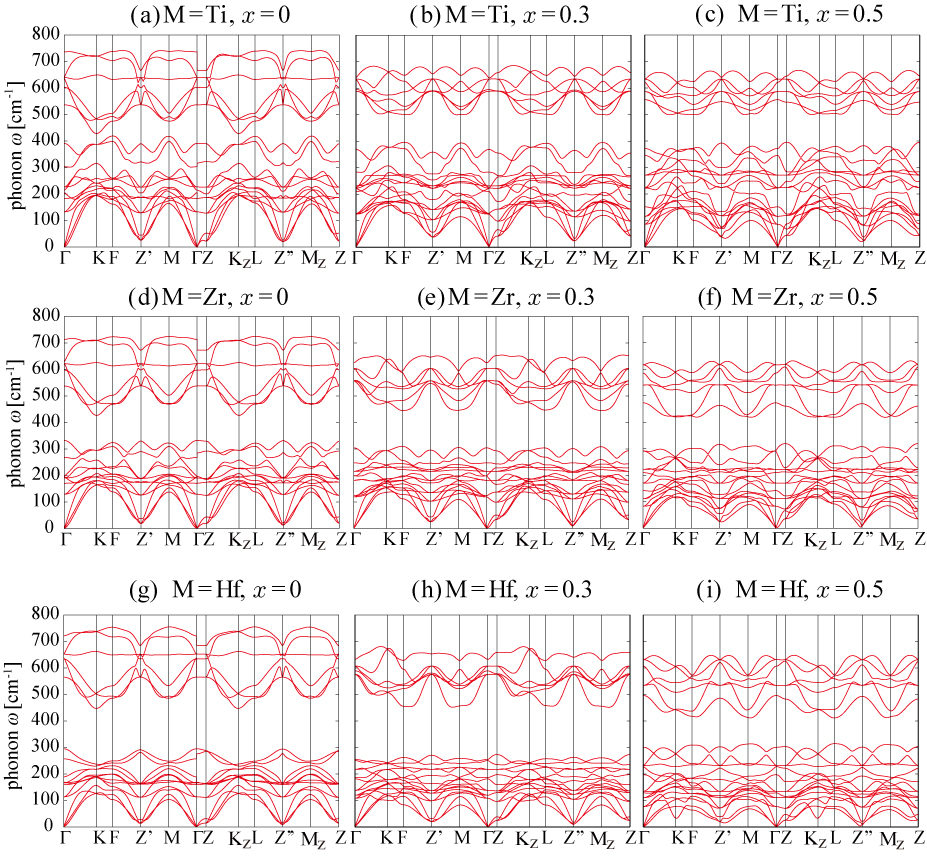
We next show the phonon dispersions in Fig. 6. The doping (material) dependence can be seen by comparing the panels from left to right (from top to bottom). The total spectrum consists of two bunches of bands; the high-frequency bands around 500–700 cm-1 and the low-frequency bands around 0–400 cm-1. The high-frequency bands mainly originate from the vibrations of nitrogen atom, while the low-frequency ones are formed by the vibrations of lithium, chlorine, and transition-metal atoms. For the high-frequency bands, Li doping causes appreciable band narrowing and a red shift. On the other hand, for the low-frequency bands, carrier doping basically does not change the overall profile so drastically, but some characteristic change is observed for the Hf compounds; along the Z–KZ line, significant mode softening near 0–100 cm-1 occurs.
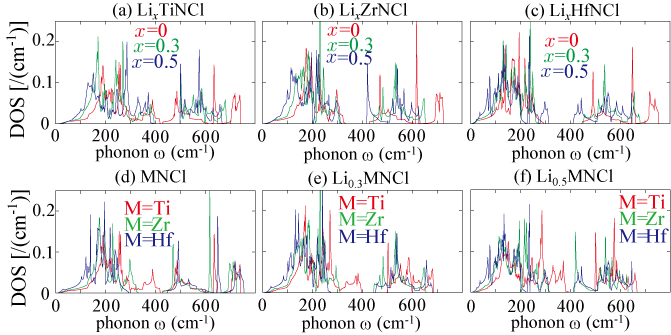
Figure 7 displays the phonon DOS, where the upper three panels describe the doping dependence in the same material and the lower three panels compare the results of the three materials with the same doping rate. The figures show that the carrier doping and the substitution of light elements with heavy elements lead to a red shift of the phonon DOS, especially for the low-frequency range of 0–200 cm-1. The origin is explained as follows: For the effect of the carrier doping, becomes larger (Table 4), so that the electronic polarization is enhanced. Thus electronic screening works more effectively and weakens the atomic interaction. On the other hand, heavier atoms vibrate more slowly, so that they generally have lower phonon frequencies.
IV.5 Electron-Phonon Coupling
To estimate the strength of the electron-phonon coupling, we calculated the mode-dependent as
| (28) |
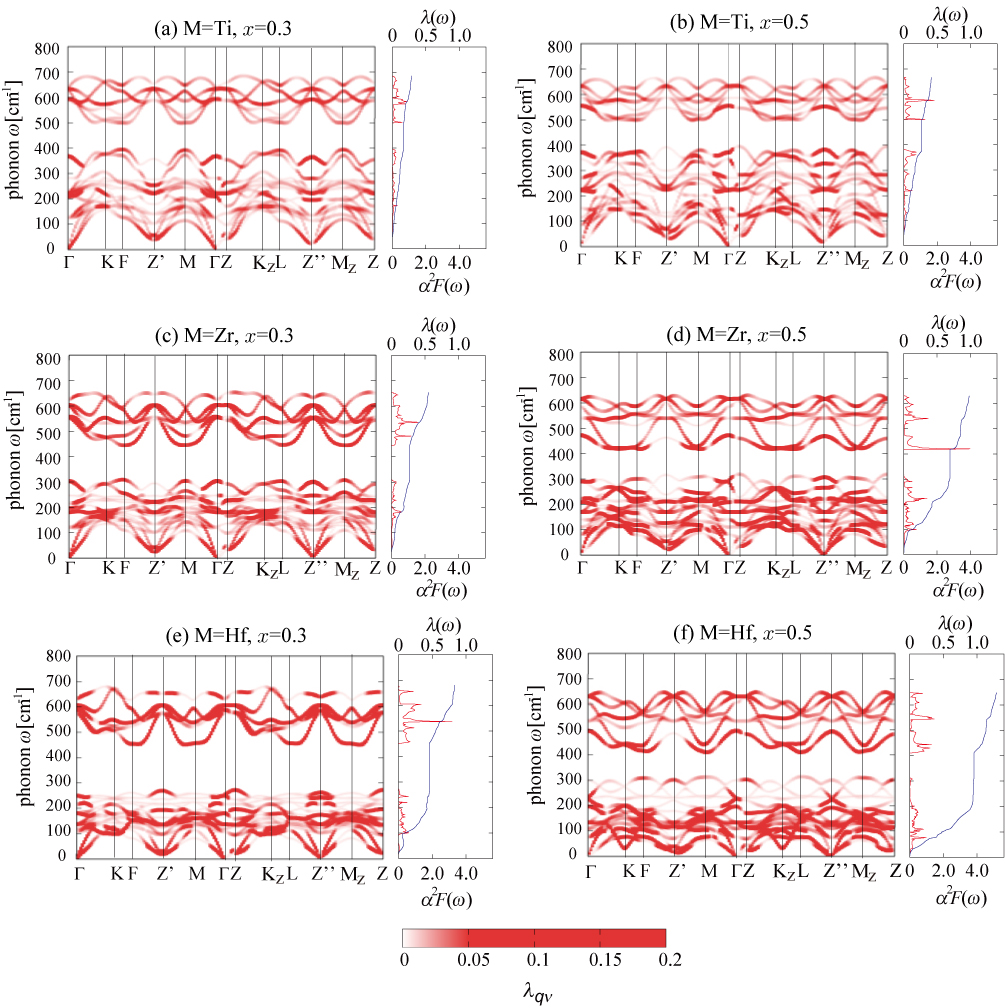
Note that is finite for metals because in the numerator is defined via the Fermi-surface integral [see Eq. (6)]. The results are displayed in Fig. 8. We also plot in the right side the Eliashberg function in Eq. (5) and accumulated-frequency function defined as
| (29) |
The strength of the electron-phonon coupling can be measured by and the MAD parameter in Eq. (23) is defined as the limit of . We see that carrier doping enhances the electron-phonon coupling (compare the left and right panels). Similarly, the electron-phonon coupling is strong in the systems with heavier transition-metal elements (compare the top, middle, and bottom panels).
Table 4 lists our calculated in Eq. (23) to quantify the electron-phonon coupling of each material and each doping rate. In terms of , we expect high for heavier transition-metal compounds in the high-doping regime. However, on the other hand, the averaged phonon energy in Eq. (24), listed in the table, exhibits an opposite trend to . In fact, as represented in the MAD formula, the subtle balance of and determines .
IV.6 Screened electron-electron interaction
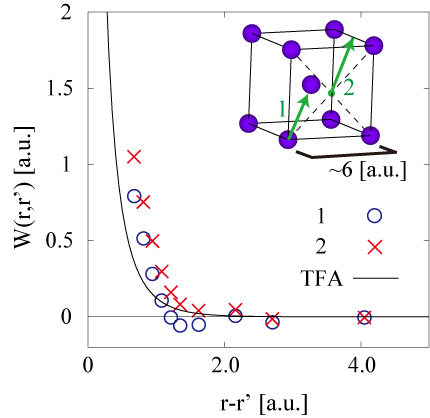
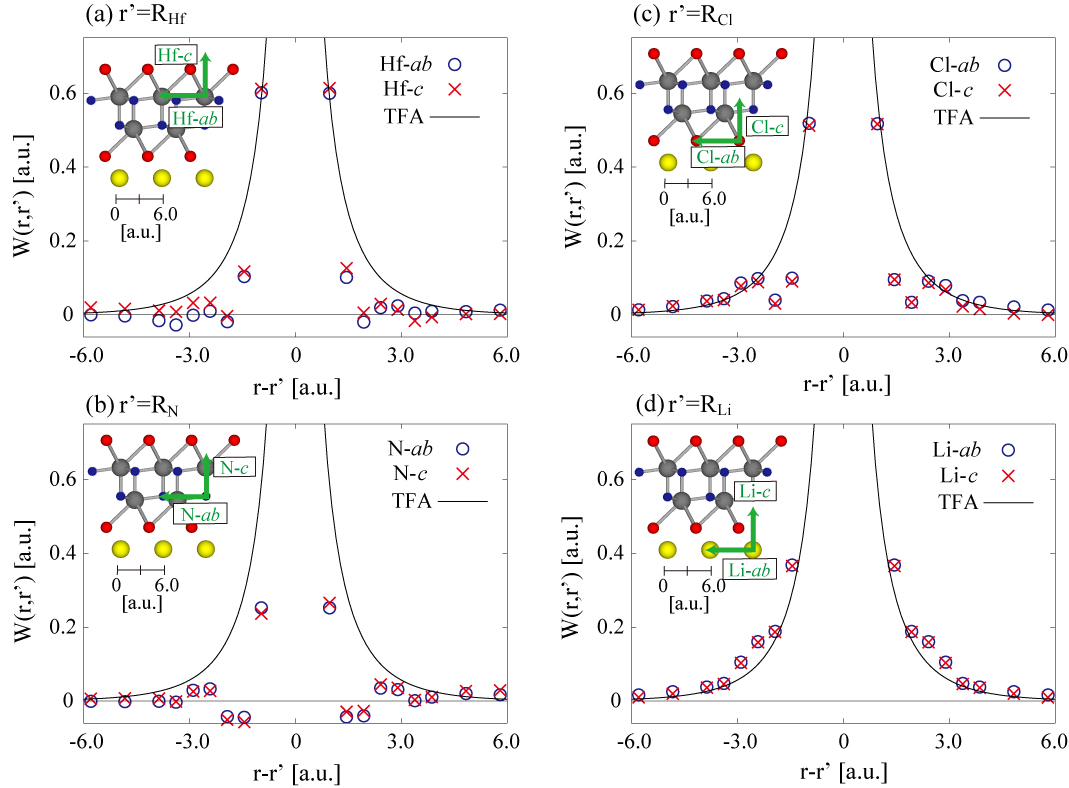
We next consider the RPA screened electronic interaction [Eq. (16)], which is related to by Eq. (11). We calculated it with various settings of the origin and direction. We chose the four points as the origin : The transition-metal, nitrogen, chlorine, and lithium sites. For the calculated directions, we selected the following two: One is the direction along the interlayer c axis and the other is taken to be parallel to an M-N bond in the ab plane. We show in Fig. 9 our calculated for -Li0.3HfNCl. The atomic geometry is depicted in the inset, where the origin and calculated direction are superposed as the green arrow. From the comparison among the four panels, we see significantly weak interactions around the Hf and N atoms building the block layer compared to the TFA one [solid lines, Eq. (13)], especially for the long-range part (2 a.u.). In contrast, the RPA interaction around the Cl and Li atoms seems to follow the TFA interaction. The strong screening around the Hf and N atoms is because of the electronic states near the conduction-band bottom formed by the Hf and N orbitals. Felser-band ; Weht-band In the vicinity of , the interaction around the Ni site seems to be smaller than that around the Hf one. This might be a consequence of the difference in the electronegativity (1.30 for Hf and 3.04 for N), but it should be noticed that this region is at the border of the resolution limit in the real space with the plane-wave cutoff of 12.8 Ry for screened Coulomb interaction in Eq. (17). comment-Wr The dependence of the RPA screened Coulomb interaction on the atomic species at the origin and the difference in the short-range part in the RPA and TFA interactions indicates that inhomogeneity not described by TFA is essential for this system. To show this point clearer, we calculated for a simple metal Nb, shown in Fig. 10. The points were set to () (Nb site,“1” in the inset) and (1/2, 1/2, 0) (“2”). The calculation was performed along the (111) direction (green arrow). We see that the hardly depend on the origin and the calculated directions, which is ascribed to a nearly uniform electronic density in the system. The interaction value itself is, contrary to the -Li0.3HfNCl case, larger than the TFA one.
The above-mentioned aspects of for -Li0.3HfNCl are common in essence to the other -LixMNCl compounds. On the other hand, as the transition-metal element is replaced by a lighter one, we find that the reduction of the RPA screened interaction around the transition-metal site from the TFA one becomes more appreciable. This may be due to the following fact: When transition metal element is replaced from 5 to 4 or 3, in general, the ionic radius becomes smaller and the electronegativity becomes larger.
Next, to see the strength of the effective interaction between the electrons forming each Cooper pair, we calculated following Eq. (26), with in Eq. (14) and in Eq. (20). The results for each material and each doping rate are given in Table 4. As basic trends, we see that (i) is considerably small compared to (ii) the large doping rate gives the large value, and (iii) in the order of Hf, Zr, and Ti compounds (i.e., as the transition metal atom becomes lighter), the resulting becomes larger. The trend (i) results from the damped RPA interaction around the nitrogen and transition-metal atoms. The trends (ii) and (iii) originate from the enhancement in the factor; although the averaged interaction itself in Eq. (27) is weakened by the doping or almost unchanged with the substitution from heavier to lighter element, the increase of (see Fig. 5 and Table 4) dominates the overall trend in over the factor. We also give in the table the renormalized value . The trends of basically follow those of . However, as is well appreciated, the renormalization formula in Eq. (25) includes an empirical parameter and the setting detail of this parameter strongly affect the final value. Hence, the estimate itself has little quantitative reliability.
IV.7 Transition temperatures
We solved the SCDFT equation [Eq. (1) or (21)] with the constructed exchange-correlation kernels , , and from first principles. Figure 11 plots our calculated superconducting gap as a function of temperature. The upper two panels (a) and (b) describe results for the Zr compounds and the lower two (c) and (d) describe those for the Hf compounds. The panels (a) and (c) [(b) and (d)] are the results where TFA (RPA) is adopted for . The pink (lighter) and blue (darker) squares in the figures represent the results for =0.3 and 0.5, respectively, and the horizontal bars indicate the experimental range.
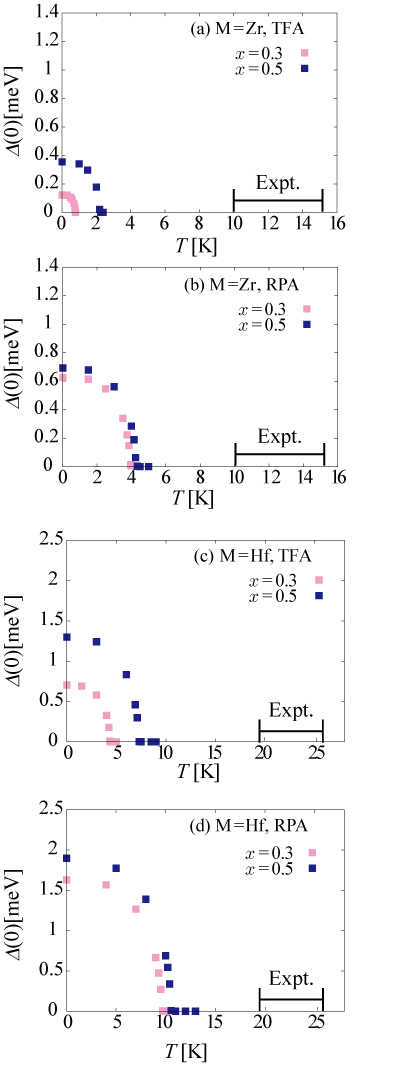
We find two discernible differences between TFA and RPA, which are common in both the Zr and Hf compounds. First, unlike the results for Al and Nb in Sec. III, the estimated is higher in RPA than TFA. This is ascribed to the weaker RPA electronic interaction than the TFA one (Sec. IV.6). Second, while both TFA and RPA predict that an electron doping raises , the increasing trend of in RPA is less noticeable than that in TFA. This is because that the weakening of the RPA interaction in the MN layers (Fig. 9) compared to the TFA one becomes more appreciable in the low-doping regime than the high-doping one (as seen in Table 4), thus leading to the relatively higher RPA than the TFA at . The observed differences between TFA and RPA highlight a significance of the effects beyond TFA in -LixMNCl.
Importantly, our estimated is a few times lower than the experimental values, being in a sharp contrast with the case of simple metals for which SCDFT successfully reproduces experimental . The disagreement observed for -LixMNCl suggests that the present exchange-correlation kernels , , and is missing something crucial to describe the superconductivity in this system.
| M | Ti | Zr | Hf | |||
|---|---|---|---|---|---|---|
| x | 0.3 | 0.5 | 0.3 | 0.5 | 0.3 | 0.5 |
| 6.3 | 7.4 | 17.8 | 33.0 | 28.6 | 36.6 | |
| – | – | 0.8 | 2.2 | 4.4 | 7.2 | |
| – | – | 3.9 | 4.3 | 9.6 | 10.5 | |
| 3.6 | 10.1 | 18.8 | 31.2 | 27.1 | 26.9 | |
| – | – | 2.1 | 9.7 | 7.2 | 14.6 | |
| 10-3 | 10-3 | 6.2 | 11.5 | 14.8 | 16.6 | |
| – | – | 10.0–15.2a | 19.0–25.5b | |||
| – | – | 0.144 | 0.296 | 0.170 | 0.242 | |
| aRef. Taguchi-doping, (-LixZrNCl); Ref. Kasahara2009, (-LixZrNCl); | ||||||
| Ref. Hotehama-molecular, [-LixMyZrNCl; M= tetrahydrofuran (THF), | ||||||
| propylene carbonate (PC)]; | ||||||
| Ref. Kawaji, (-AxZrNCl; A=Li, Na, K); | ||||||
| Ref. Kasahara-molecular, [-LixMyZrNCl; M=(N, N)-dimethylformamide, | ||||||
| diemthylsulfoxide]. | ||||||
| bRef. Yamanaka-nat, [-Li0.48(THF)yHfNCl]; Ref. Shamoto2004, (-NaxHfNCl); | ||||||
| Ref. Takano-molecular, (-LixMyHfNCl; M=NH3, THF, PC); | ||||||
| Ref. Hotehama-molecular, (-AxMyHfNCl; A= Li, Na; M= THF, PC). | ||||||
We summarize the SCDFT results in Table 5. We compare three s obtained from different treatments of the Coulomb interaction effect; for which is neglected in the gap function, calculated with TFA, and obtained by using RPA. For the Ti compounds, we found no superconducting solution in calculations with . We also list estimated by the MAD formula. The trend is basically the same as that of SCDFT. While the MAD gives higher , it should be noted that the MAD formula contains the empirical parameter. As a reference, we estimated which reproduces our for the Zr and Hf compounds and list them at the bottom of the table. While the empirical formula [Eq. (25)] gives 0.113–0.196 (see Table 4), is 0.144–0.296, which is much larger than the standard values () used in literatures.Carbotte These results suggest that suppression of the Coulomb interaction by screening and renormalization in the -MNCl is not so strong.
V discussion
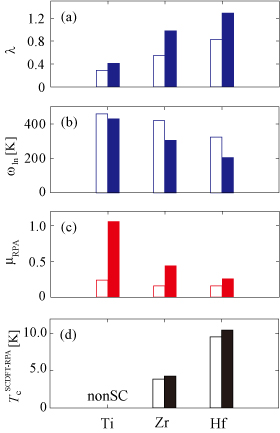
In discussing overall aspect of the present SCDFT calculation, an analysis with the parameters in the MAD formula gives a simple insight because each parameter represents an average of the matrix quantity in SCDFT. We summarize in Fig. 12 these parameters; in the panel (a), in (b), in (c), and in (d). The figure compares the three compounds (Ti, Zr, and Hf) and the empty and solid bars represent the results for =0.3 and 0.5, respectively. While the material dependence of basically follows the trend, the quantitative aspect of is determined as a balance in , , and . Because of the rather large , the Ti compounds do not exhibit superconductivity. The doping dependence of also follows the trend. However, because of the decreasing (increasing) trend of () upon the doping, the difference in =0.3 and 0.5 is not substantial.
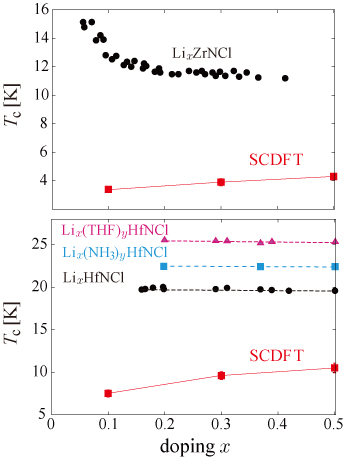
Besides the overall trend of each factor, there is a notable quantitative disagreement in between the theory and the experiment. Since the SCDFT assures a high accuracy of for a wide class of phonon-mediated superconductors, this disagreement is remarkable and should be seriously and carefully examined. To study this point in more detail, we calculated the doping dependence of for lower doping regime down to . In the experiments,Taguchi-doping ; Takano-molecular is known to rapidly increase as is reduced down to for the Zr compounds, while it barely changes for for the Hf compounds. In order to examine whether this behavior is reproduced theoretically, we estimated for by SCDFT. In this calculation, the RPA electronic kernel in Eq. (20) is made with the rigid-band-shift approximation to the electronic state for . For , we employed that of . This is justified from the fact that the DOS at for is nearly the same as that for (see Fig. 5). The results are plotted in Fig. 13 and compared with the experiments. We see that the resulting lowers for small , which is an opposite trend to the experiments. The doping dependence by SCDFT is reasonable because the screening due to the virtual states in the flat-band region just above becomes less effective for small (as is apart from this flat band). Indeed, the bare is estimated to be for the Zr compound and for the Hf compound, which are respectively larger than those for ( for both of the Zr and Hf compounds).
The present SCDFT is based on the standard ME theory, in which one neglects the momentum dependence of the quantities. Also, the screened Coulomb interaction is described with RPA and the frequency dependence is ignored. The present discernible difference in or in its doping dependence between the theory and experiment suggest the importance of the effect not included in the analysis in the ME level. In fact, in the optical experiment,Takano-optical -LixZrNCl is known to have the plasma edge in the low-energy Drude band less than 0.1 eV, exhibiting a redshift with the lowering doping amount. Since the presence of the low-energy plasma edge affects the screened Coulomb interaction in low-frequency regime, it can be relevant to the low-energy properties of the present system as proposed earlier in Ref. Bill-rapid2002, . Meanwhile, there remains a possibility that correction in the Kohn-Sham orbitals improves the present error; for example, the use of the hybrid functional in deformation-potential calculation seems to lead to the increase of the electron-phonon coupling.Yin-Kotliar It will be interesting that the present SCDFT calculation is performed with such hybrid functional to study the degree of the improvement.
VI Summary and outlook
We have performed a comprehensive SCDFT analysis for doped -MNCl, where M=Ti, Zr and Hf, to study the effects described within the Migdal-Eliashberg theory without introducing any adjustable parameters. On the basis of the ab initio electronic band structure, phonon spectrum, electron-phonon coupling, and electron-electron interaction in the RPA level, we estimated superconducting . The resulting values are 4 K for the Zr compounds and 10 K for the Hf ones, whereas the Ti compounds do not show superconductivity because of the large electronic interaction. While the dependence of on the transition-metal species is consistent with the experiments, our calculated values are less than a half of the experimental values (10–15 K for the Zr case and 19–26 K for the Hf one) and the theoretical doping dependence of is opposite to that of the experiment. Although we do not rule out some possibilities of improvement by corrections to one-particle states as the starting point, the revealed discrepancy between the theory and experiment, as is known in the case of the unconventional superconductors, appeals the relevance of something ignored in the standard Migdal-Eliashberg theory to the superconducting mechanism of the doped -MNCl. This remains an open question.
Acknowledgements.
We thank Mitsuaki Kawamura for stimulating discussions. This work was supported by Grants-in-Aid for Scientific Research (No. 22740215, 22104010, 23110708, 23340095, 19051016), Funding Program for World-Leading Innovative R&D on Science and Technology (FIRST program) on “Quantum Science on Strong Correlation”, JST-PRESTO and the Next Generation Super Computing Project and Nanoscience Program from MEXT, Japan.Appendix A -point Phonons
To check the reliability for phonon properties, we calculated vibrational frequencies at the point and compared with previous theoretical and experimental results. Tables 6 and 7 list the Raman and infrared frequencies for the undoped system, respectively. Also, Tables 8 and 9 are the results for doped samples. For both of the undoped and doped samples, our calculations reasonably reproduces the experimental results, as well as the previous theoretical results.
| M | Ti | Zr | Hf | ||||||
| present | present | expt.a | theoryb | present | expt.a | theoryc | |||
| A1g#1 | 603 | 598 | 591 | 564 | 634 | 612 | 604 | ||
| A1g#2 | 391 | 333 | 331 | 312 | 295 | 292 | 386 | ||
| A1g#3 | 214 | 196 | 191 | 182 | 169 | 163 | 191 | ||
| Eg#1 | 640 | 622 | 605 | 620 | 652 | 633 | - | ||
| Eg#2 | 227 | 191 | 184 | 171 | 166 | 156 | - | ||
| Eg#3 | 133 | 130 | 128 | 114 | 113 | 110 | - | ||
| aRaman spectroscopy taken from Ref. Cros, . | |||||||||
| bAb initio DFT-LDA pseudopotential calculation in Ref. Heid-DFPT, . | |||||||||
| cAb initio DFT-LDA pseudopotential calculation in Ref. Weht-band, . | |||||||||
| M | Ti | Zr | Hf | |||||
| present | present | expt.a | theoryb | present | theoryc | |||
| A2u#1 | 638(666) | 630(673) | 529 | 597(630) | 638(684) | 617 | ||
| A2u#2 | 303(317) | 268(286) | - | 257(272) | 257(276) | 128 | ||
| Eu#1 | 537(736) | 538(713) | 666? | 547(680) | 565(721) | 632 | ||
| Eu#2 | 184(206) | 171(198) | 165 | 155(179) | 159(189) | 105 | ||
| aInfrared spectroscopy taken from Ref. Adelmann, . | ||||||||
| bAb initio DFT-LDA pseudopotential calculation in Ref. Heid-DFPT, . | ||||||||
| cForce-constant-model calculation reproducing | ||||||||
| the Raman spectra in Ref. Cros, . | ||||||||
| M | Ti | Zr | Hf | ||||||||
| present | present | expt.a | theoryb | present | expt.c | ||||||
| 0.3 | 0.5 | 0.3 | 0.5 | 0.16 | 1/6 | 0.3 | 0.5 | 0.35 | |||
| A1g#1 | 594 | 556 | 557 | 473 | 582 | 565–548 | 589 | 496 | 595 | ||
| A1g#2 | 369 | 372 | 304 | 291 | 322 | 303–296 | 250 | 228 | 282 | ||
| A1g#3 | 210 | 223 | 198 | 209 | 188 | 186–217 | 181 | 197 | 147 | ||
| Eg#1 | 634 | 633 | 603 | 616 | 608 | 599–633 | 607 | 631 | 616 | ||
| Eg#2 | 222 | 224 | 181 | 170 | 178 | 169–165 | 138 | 134 | 157 | ||
| Eg#3 | 125 | 116 | 123 | 111 | 123 | 116–131 | 119 | 110 | 106 | ||
| aRaman spectroscopy taken from Ref. Adelmann, . | |||||||||||
| bAb initio DFT-LDA pseudopotential calculations in Ref. Heid-DFPT, . | |||||||||||
| cRaman spectroscopy for -NaxHfNCl taken from Ref. Cros, . | |||||||||||
| M | Ti | Zr | Hf | |||||||
| present | present | theorya | present | theoryb | ||||||
| 0.3 | 0.5 | 0.3 | 0.5 | 1/6 | 0.3 | 0.5 | 0.5 | |||
| A2u#1 | 638 | 622 | 625 | 585 | 612–583 | 632 | 606 | 596 | ||
| A2u#2 | 283 | 346 | 247 | 291 | 314 | 254 | 300 | 108 | ||
| A2u#3 | 223 | 152 | 198 | 142 | 235–184 | 186 | 128 | 183 | ||
| Eu#1 | 588 | 587 | 557 | 540 | 549–603 | 576 | 534 | 618 | ||
| Eu#2 | 231 | 271 | 215 | 221 | 262 | 217 | 232 | 85 | ||
| Eu#3 | 127 | 86 | 119 | 83 | 148–113 | 108 | 77 | 146 | ||
| aAb initio DFT-LDA pseudopotential calculations | ||||||||||
| in Ref. Heid-DFPT, . | ||||||||||
| bForce-constant-model calculation reproducing | ||||||||||
| the Raman spectra for -Na0.58HfNCl in Ref. Cros, . | ||||||||||
References
- (1) J. G. Bednorz and K. A. Muller, Z. Phys. B 64, 189 (1986).
- (2) S. Yamanaka, H. Kawaji, K. Hotehama, M. Ohashi, Adv. Mat. 8, 771 (1996).
- (3) S. Yamanaka, K. Hotehama, and H. Kawaji, Nature 392, 580 (1998).
- (4) S. Yamanaka, J. Mater. Chem. 20, 2922 (2010).
- (5) A. B. Migdal, Sov. Phys. JETP 34, 996 (1958)
- (6) G. M. Eliashberg, Sov. Phys. JETP 11, 696 (1960)
- (7) D. J. Scalapino, in Superconductivity edited by R. D. Parks, (Marcel Dekker, New York, 1969) VOLUME 1.
- (8) J. R. Schrieffer,Theory of superconductivity; Revised Printing, (Westview Press, Colorado, 1971)
- (9) L. Boeri, O. V. Dolgov, and A. A. Golubov, Phys. Rev. Lett. 101, 026403 (2008).
- (10) H. Tou, Y. Maniwa, and S. Yamanaka, Phys. Rev. B 67, 100509(R) (2003).
- (11) H. Tou, S. Oshiro, H. Kotegawa, Y. Taguchi, Y. Kishiume, Y. Kasahara, and Y. Iwasa, Physica C 470, S658 (2010).
- (12) T. Ekino, T. Takasaki, T. Muranaka, H. Fujii, J. Akimitsu, and S. Yamanaka, Physica B 328, 23 (2003).
- (13) T. Takasaki, T. Ekino, H. Fujii, and S. Yamanaka, J. Phys. Soc. Jpn. 74, 2586-2591 (2005).
- (14) T. Takasaki, T. Ekino, A. Sugimoto, K. Shohara, S. Yamanaka, and A.M. Gabovich, Euro. Phys. J. B 73, 471 (2010).
- (15) H. Tou, Y. Maniwa, T. Koiwasaki, and S. Yamanaka, Phys. Rev. Lett. 86, 5775 (2001).
- (16) Y. Taguchi, M. Hisakabe, and Y. Iwasa, Phys. Rev. Lett. 94, 217002 (2005).
- (17) Y. Taguchi, T. Kawabata, T. Takano, A. Kitora, K. Kato, M. Takata, and Y. Iwasa, Phys. Rev. B 76, 064508 (2007).
- (18) J. Bardeen, L. N. Cooper, and J. R. Schrieffer, Phys. Rev. 108, 1175 (1957).
- (19) Y. Taguchi, A. Kitora, and Y. Iwasa, Phys. Rev. Lett. 97, 107001 (2006).
- (20) T. Takano, T. Kishiume, Y. Taguchi, and Y. Iwasa, Phys. Rev. Lett. 100, 247005 (2008).
- (21) Y. Kasahara, T. Kishiume, T. Takano, K. Kobayashi, E. Matsuoka, H. Onodera, K. Kuroki, Y. Taguchi, and Y. Iwasa, Phys. Rev. Lett. 103, 077004 (2009).
- (22) H. Tou, M. Sera, Y. Maniwa, and S. Yamanaka, Int. J. Mod. Phys. B 21, 3340 (2007).
- (23) H. Kotegawa, unpublished.
- (24) M. Hiraishi, R. Kadono, M. Miyazaki, S. Takeshita, Y. Taguchi, Y. Kasahara, T. Takano, T. Kishiume, and Y. Iwasa, Phys. Rev. B 81, 014525 (2010).
- (25) K. Kuroki, Sci. Tech. Adv. Mater. 9, 044202 (2008).
- (26) K. Kuroki, Phys. Rev. B 81, 104502 (2010).
- (27) S. Choi, H. Aizawa, and K. Kuroki, J. Phys. Chem. Sol. 72, 376 (2011).
- (28) Q. Yin, E. R. Ylvisaker, and W. E. Pickett, Phys. Rev. B 83, 014509 (2011).
- (29) R. Heid and K. P. Bohnen, Phys. Rev. B 72, 134527 (2005).
- (30) G. Bergmann and D. Rainer, Z. Phys. 263, 59 (1973).
- (31) P. Morel and P. W. Anderson, Phys. Rev. 125, 1263 (1962); N. N. Bogoliubov, V. V. Tolmachev, and D. V. Shirkov, A New Method in the Theory of Superconductivity (1958) (translated from Russian: Consultants Bureau, Inc., New York, 1959).
- (32) R. Weht, A. Filippetti, and W. E. Pickett, Europhys. Lett. 48, 320 (1999).
- (33) G. D. Gaspari and B. L. Gyorffy, Phys. Rev. Lett. 28, 801 (1972).
- (34) B. M. Klein and W. E. Pickett, in Superconductivity in d- and f-Band Metals 1982, edited by W. Buckel and W. Weber (Kernforschungszentrum Karlsruhe, Karlsruhe) 1982, p. 477
- (35) Z. P. Yin, A. Kutepov, and G. Kotliar, arXiv:1110.5751.
- (36) J. Heyd, G. E. Scuseria, and M. Ernzerhof, J. Chem. Phys. 118, 8207 (2003); 124, 219906(E) (2006).
- (37) W. L. McMillan, Phys. Rev. 167, 331 (1968).
- (38) P. B. Allen and R. C. Dynes, Phys. Rev. B 12, 905 (1975).
- (39) J. P. Carbotte, Rev. Mod. Phys. 62, 1027 (1990)
- (40) A. Bill, H. Morawitz, and V. Z. Kresin, Phys. Rev. B 66, 100501(R) (2002).
- (41) V. E. Kravtsov, arxiv:1109.2515.
- (42) I. S. Burmistrov, I. V. Gornyi, and A. D. Mirlin, Phys. Rev. Lett. 108, 017002 (2012).
- (43) K. H. Lee, K. J. Chang, and M. L. Cohen, Phys. Rev. B 52, 1425 (1995).
- (44) M. Lüders, M. A. L. Marques, N. N. Lathiotakis, A. Floris, G. Profeta, L. Fast, A. Continenza, S. Massidda, and E. K. U. Gross, Phys. Rev. B 72, 024545 (2005).
- (45) L. N. Oliveira, E. K. U. Gross, and W. Kohn, Phys. Rev. Lett. 60, 2430 (1988).
- (46) M. A. L. Marques, M. Lüders, N. N. Lathiotakis, G. Profeta, A. Floris, L. Fast, A. Continenza, E. K. U. Gross, and S. Massidda, Phys. Rev. B 72, 024546 (2005).
- (47) A. Floris, G. Profeta, N. N. Lathiotakis, M. Lüders, M. A. L. Marques, C. Franchini, E. K. U. Gross, A. Continenza, and S. Massidda, Phys. Rev. Lett. 94, 037004 (2005).
- (48) A. Sanna, G. Profeta, A. Floris, A. Marini, E. K. U. Gross, and S. Massidda, Phys. Rev. B 75, 020511(R) (2007).
- (49) G. Profeta, C. Franchini, N. N. Lathiotakis, A. Floris, A. Sanna, M. A. L. Marques, M. Lüders, S. Massidda, E. K. U. Gross, and A. Continenza, Phys. Rev. Lett. 96, 047003 (2006).
- (50) C. Bersier, A. Floris, A. Sanna, G. Profeta, A. Continenza, E. K. U. Gross, and S. Massidda, Phys. Rev. B 79, 104503 (2009).
- (51) S. Massidda, F. Bernardini, C. Bersier, A. Continenza, P. Cudazzo, A. Floris, H. Glawe, M. Monni, S. Pittalis, G. Profeta, A. Sanna, S. Sharma, and E. K. U. Gross, Supercond. Sci. Technol. 22, 034006 (2009).
- (52) More detailed discussion about the correspondence of the kernels are seen in Ref.Luders,
- (53) A. Görling and M. Levy, Phys. Rev. A 50, 196 (1994).
- (54) M. S. Hybertsen and S. G. Louie, Phys. Rev. B 35, 5585 (1987); M. S. Hybertsen and S. G. Louie, ibid. 35, 5602 (1987).
- (55) R. M. Pick, M. H. Cohen, and R. M. Martin, Phys. Rev. B 1, 910 (1970).
- (56) S. Baroni, S. de Gironcoli, A. Dal Corso, and P. Giannozzi, Rev. Mod. Phys. 73, 515 (2001).
- (57) For and , we first calculate on logarithmic energy scales and next attribute each to the closest value.
- (58) G. Lehmann and M. Taut, Phys. Stat. Sol. 54, 469 (1972). ; P. E. Blochl, O. Jepsen, and O. K. Andersen, Phys. Rev. B 49, 16223 (1994).
- (59) M. Kawamura, Y. Gohda, and S. Tsuneyuki, unpublished.
- (60) K. H. Lee and K. J. Chang, Phys. Rev. B 54, 1419 (1996).
- (61) N. W. Ashcroft and N. D. Mermin, Solid State Physics (Thomson Learning, Singapore, 1976)
- (62) Another source of error is an assumption imposed in the derivation of Eq. (25) cited from Ref. Morel-Anderson, , which corresponds to an assumption that the momentum average of the screened Coulomb interaction times density of states is constant. The drawback of this treatment is not clear.
- (63) P. Giannozzi, S. Baroni, N. Bonini, M. Calandra, R. Car, C. Cavazzoni, D. Ceresoli, G. L. Chiarotti, M. Cococcioni, I. Dabo, A. Dal Corso, S. Fabris, G. Fratesi, S. de Gironcoli, R. Gebauer, U. Gerstmann, C. Gougoussis, A. Kokalj, M. Lazzeri, L. Martin-Samos, N. Marzari, F. Mauri, R. Mazzarello, S. Paolini, A. Pasquarello, L. Paulatto, C. Sbraccia, S. Scandolo, G. Sclauzero, A. P. Seitsonen, A. Smogunov, P. Umari, and R. M. Wentzcovitch, J. Phys.: Condens. Matter 21, 395502 (2009); http://www.quantum-espresso.org/
- (64) J. P. Perdew and A. Zunger, Phys. Rev. B 23, 5048 (1981).
- (65) D. M. Ceperley and B. J. Alder, Phys. Rev. Lett. 45, 566 (1980).
- (66) N. Troullier and J. L. Martins, Phys. Rev. B 43, 1993 (1991).
- (67) D. D. Koelling and B. N. Harmons, J. Phys. C: Solid State Phys. 10, 3107 (1977).
- (68) S. G. Louie, S. Froyen, and M. L. Cohen, Phys. Rev. B 26, 1738 (1982).
- (69) H. J. Monkhorst and J. D. Pack, Phys. Rev. B 13, 5188 (1976).
- (70) M. Methfessel and A. T. Paxton, Phys. Rev. B 40, 3616 (1989).
- (71) S. Shamoto, T. Kato, Y. Ono, Y. Miyazaki, K. Ohoyama, M. Ohashi, Y. Yamaguchi, and T. Kajitani, Physica C 306, 7 (1998).
- (72) P. Adelmann, B. Renker, H. Schober, and F. Fernandez-Diaz, J. Low Temp. Phys. 117, 449 (1999).
- (73) X. Chen, L. Zhu, and S. Yamanaka, J. Solid State Chem. 169, 149 (2002).
- (74) X. Chen, T. Koiwasaki, and S. Yamanaka, J. Solid State Chem. 159, 80 (2001).
- (75) S. Istomin, J. Köhler, and A. Simon, Physica C 319, 219 (1999).
- (76) A. Fuertes, M. Vlassov, D. Beltrán-Porter, P. Alemany, E. Canadell, N. Casañ-Pastor, and M. R. Palacin, Chem. Mater. 11, 203 (1999).
- (77) S. Shamoto, K. Takeuchi, S. Yamanaka, and T. Kajitani, Physica C 402, 283 (2004).
- (78) H. Sugimoto and T. Oguchi, J. Phys. Soc. Jpn. 73, 2771 (2004).
- (79) C. Felser and R. Seshadri, J. Mater. Chem. 9, 459 (1999).
- (80) The detail of the interaction in a small region, , does not affect an integrated value, because the integral weight scales as while the interaction value itself scales as .
- (81) K. Hotehama, T. Koiwasaki, K. Umemoto, S. Yamanaka, and H. Tou, J. Phys. Soc. Jpn. 79, 014707 (2010).
- (82) H. Kawaji, K. Hotehama, and S. Yamanaka, Chem. Mater. 9, 2127 (1997).
- (83) Y. Kasahara, T. Kishiume, K. Kobayashi, Y. Taguchi, and Y. Iwasa, Phys. Rev. B 82, 054504 (2010).
- (84) T. Takano, Y. Kasahara, T. Oguchi, I. Hase, Y. Taguchi, and Y. Iwasa, J. Phys. Soc. Jpn. 80, 023702 (2011).
- (85) A. Cros, A. Cantarero, D. Beltrán-Porter, J. Oró-Solé, and A. Fuertes, Phys. Rev. B 67, 104502 (2003).