A united model for the cosmic ray energy spectra and anisotropy in the energy range 100 –100 000 GeV
Abstract
We propose a model where a supernova explodes in some vicinity of our solar system (some tens of parsecs) in the recent past (some tens of thousands years) with the energy release in cosmic rays of order of erg. The flux from this supernova is added to an isotropic flux from other sources. We consider the case where the Sun’s location is not in some typical for Our Galaxy average environment, but in the Local Superbubble about 100 pc across, in which the diffusion coefficient , with the value of cm 2 s -1. We describe the energy dependence of the anisotropy of cosmic rays in the TeV region, together with the observed features of the energy spectrum of protons found in direct measurements. Our model provides a natural explanation to the hardening of the proton spectrum at 200 GeV, together with the observed steepening of the spectrum above 50 TeV.
1 Introduction
Notwithstanding the numerous attempts undertaken in recent years there is not a satisfactory explanation of the energy dependence of cosmic ray anisotropy amplitude in the frame of existing paradigm [1], [2]. When addressing the problem the following is normally assumed: a) The experimental data reflect a stationary picture; b) The CR propagation is determined by the diffusion of charged particles in the magnetic fields of our Galaxy; c) The diffusion coefficient depends on the particles rigidity as: , where is a parameter determining the properties of the medium in the region where CR propagate in the Galaxy. It is assumed that and are the same throughout the Galaxy; d) The distribution of supernovae as a dominant source of cosmic rays follows the spatial distribution of a galactic matter density for the remote sources at distances greater than 1–1.5 kpc. To specify the details the Galaxy’s spiral arms are taken into account. The observed distribution of the nearby sources (in space and time) are also considered.
In this paper we propose a model where the observed anisotropy is related to a non-stationary process in a nearby vicinity of the Sun. There is some evidence that the Sun’s environment is not representative for typical on average galactic conditions, and the Sun is in a bubble of hot gas with a low density. To create this bubble the energy of many supernova explosions in recent tens of millions years is needed [3]. It is a reasonable suggestion that the CR energy density is significantly higher in the bubble than in the the Galaxy on average. Even now there are stormy events of a neaby stars formation [4]. We shall consider that the cosmic ray flux from a local source is added to an isotropic background from a great number of other supernovae exploded in the Galactic disk (see [22], for example). The possibility that the observed anisotropy can be associated with a structure of local intersellar magnetic fields is not discussed in the paper.
2 The evaluation of a cosmic ray anisotropy and flux from a local source
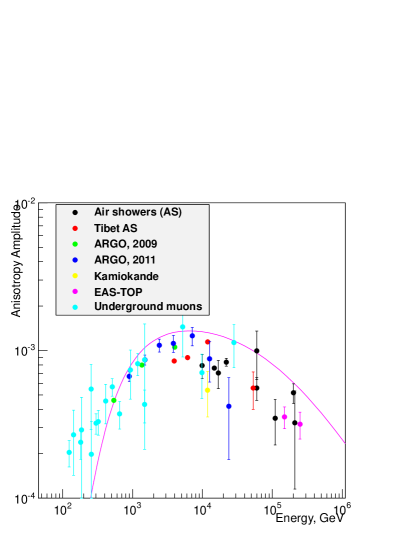
Experimental data on the energy dependence of an amplitude of dipole anisotropy in the energy range from 100 up to GeV are shown in Fig. 1. The question to answer is: what sort and value of anisotropy one should expect after a nearby supernova explosion? The amplitude of the dipole anisotropy is given by: [5], and for a point-like instantaneous source it is equal to where is the distance from a source to an observer and is the time of propagation of particle released to the interstallar medium at the time . The anisotropy of a total flux from a local source and the background flux is given by where and are the fluxes from a point-like instantaneous source and the background isotropic flux from the rest of supernovae.
We consider that the dependence of the diffusion coefficient on the proton energy is , where determines the leakage from the region of confinement of cosmic rays. The value of is known from the ratio of the secondary and primary nuclei at low energies (below 100 GeV per nucleon) and is equal to . (We consider only protons, and for GeV we replace the rigidity dependence to the energy dependence.) The solution for a local instantaneous source at the distance from an observer is given by the Green’s function: where is the cosmic ray density, and is the source spectrum. The flux is given by the formula:
The energy released by a source into the cosmic rays is equal to:
3 The background flux intensity
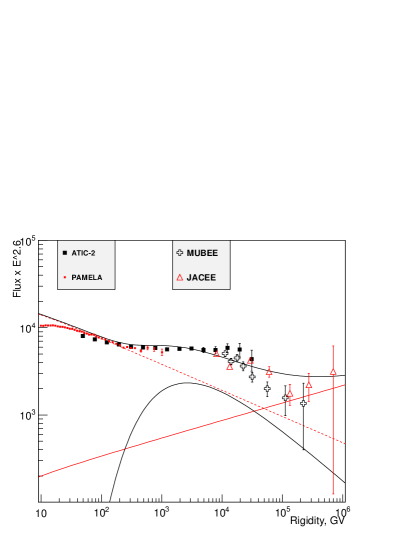
We can evaluate the background flux of cosmic rays following our three-component model [6] based on the combined data from the ATIC-2 and other experiments, including the ones for the all particle spectrum. In that model we described the spectra of protons, helium and heavier nuclei in the energy range of 10 GeV to GeV by means of three types of sources with different source spectral indexes and the different maximal rigidity under acceleration. The paper presents a new view of the origin of that components. The recent investigations of gamma-rays from supernova remnants demonstrate that the particle spectra in supernova shells are softer than it was previously considered, with the value of the spectral index being 2.3 [7]. Taking this fact into account, we consider the background particle spectrum as a spectrum of particles which have been advected downstream, suffered adiabatic losses, and, finally released at the death of the remnant. So, we proposed that supernovae in the Local Bubble generate particles with the index of the source spectrum being , the maximal rigidity being higher that 100 TeV, and the leakage from the Local Bubble being described by the value of (red dotted line in fig.2). We propose that additional background flux is the mean background flux of our Galaxy. It is formed by particles which escape from numerous other bubbles to the Galaxy, which we consider as almost closed or with leakage with very weak energy dependence. We have used the value of for them (red solid line in fig.2). This assumption is based on the ATIC data on the sub-iron to iron nuclei ratio [8], [9]. As it was shown in [6], the component with and PeV can describe well the all-particle spectrum up to the knee and in the knee region.
4 Results
In Fig. 1 we show how to explain the experimental data on cosmic ray anisitropy in the TeV energy range by adding a local instantaneous source. The model curve is calculated for the following parameters of a local source: years, pc, cm 2 s -1, GeV -1, ie erg. For the parameters selection, the important restriction was the one on the source power, that ought to be not too great to satisfy the experimental estimates. The proton spectrum for the given set of parameters is shown in Fig.2. This set of parameters is of course not unique. As another example, we have considered the SN wich produced the Geminga pulsar. The age of this pulsar is known to be years and its distance is estimated as 280 pc. In paper [21] the Geminga supernova was considered as a possible cause of the local interstellar bubble. In this case, the power of this supernova explosion should be very high. Because of asymmetric explosion, the pulsar could be ejected at a high speed. In [21] the pulsar motion was taken into account, and it was estimated that the explosion occured about 60 pc from the Solar System. The evaluations of the anisotropy and proton spectrum for years, r = 100 pc, and cm 2 s -1 give results on anisotropy amplitude and proton spectrum very similar to those shown in Fig.1 and Fig.2, providing the source power is erg.
5 Discussion
In models of particle propagation the energy dependence of diffusion coefficient is determined from the ratio of the secondary and primary nuclei and is given by . In an assumption of a stationary picture, where and when supernova explosions in Galactic disk occur regularly in time and space, and the particle leakage occurs from the Galactic Halo of the size of several kpc, cm2 s-1 at 1 GeV. The estimated diffusion coefficient in our model is of the three orders of magnitude smaller than a normally agreed value for the Galaxy. We suggest that the small value of the diffusion coefficient may characterize the smaller value of the leakage region (Local Bubble of ) and the density of the interstellar medium in the Local Bubble that is lower than the mean value in the Galaxy.
The discussed model is essentially based on the measured proton spectrum hardening above 200 Gev and its following steepening above 10 TeV. If future, more precise, measurements do not confirm this feature, our model of the local source contribution will have to be rejected.
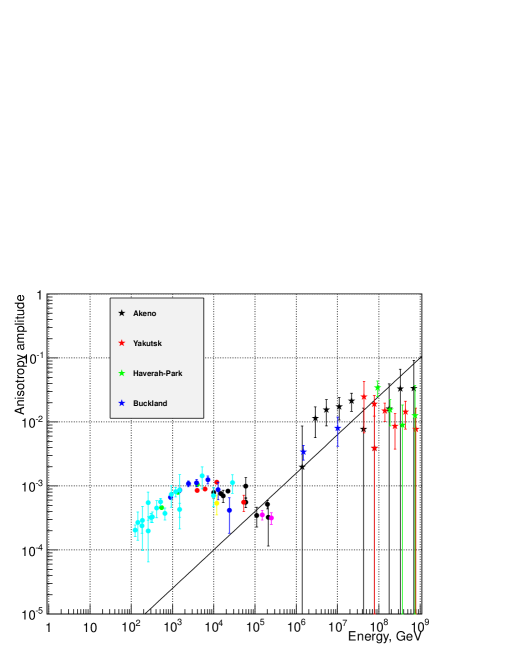
As a consequence of the fast increase in anisotropy with the rigidity, the explanation for cosmic ray anisotropy above is possible, as due to the fluctuations in random occurence of supernovae in space and time [1]. But that explanation with given in formula demands the value of . This result is shown in Fig. 3 together with the experimental data and agrees satisfactorily with the experiment at the energies higher than some GeV. For the confinement region of the size of 100 pc this corresponds to the value of the diffusion coefficient cm2 s-1 at 1 GeV, that agrees well whith the diffusion coefficient we found for the Local Bubble. It is quite possible that with the increasing accuracy of available experimental data this description will become insufficient and some additional suggestion will be needed, such as an additional local source. The additional local source could explain, as well, the all-particle spectrum hardening in the energy region above eV observed in the recent experiments [10], [11].
The work was supported by RFBR grant number 11-02-00275.
References
References
- [1] Blasi P and Amato E 2011 arXiv:1105.4529
- [2] Sveshnikova L G, et al 2011 Proc. of 32nd Intern Cosmic Ray Conf vol 6 p 184
-
[3]
Streitmatter R, Balasubramanian V K, et al 1985 A
&A 143 249 - [4] Breitschwerdt D, Avilles M A, et al 2005 arXiv:astro-ph/0501586
- [5] Ginzburg V L and Syrovatskii S I 1964, The Origin of Cosmic Rays (Pergamon Press)
-
[6]
Zatsepin V I and Sokolskaya N V 2006 A
&A 458 1 - [7] Caprioli D 2011 arXiv:1103.4798
- [8] Zatsepin V I, Panov A D, Sokolskaya N V, et al 2009 Astronomy Letters 35 338
- [9] Panov A D, Sokolskaya N V, Zatsepin V I, 2012 To the interpretation of the upturn observed by ATIC in heavy nuclei to iron ratios 2012 23th ECRS, this volume
- [10] Haungs A 2011 Proc. 32nd Intern Cosmic Ray Conf vol 1 p 263
- [11] Bereshnev S F, Besson D, et al.2012, arXiv:1201.2122
- [12] Amenomory M, et al 2005 ApJ 626 L29
- [13] Over S, Stumpert M, et al 2008 30th Intern Cosmic Ray Conf vol 4, p 223
- [14] Cui S (for ARGO-YBJ Collaboration) 2009 31st Intern Cosmic Ray Conf ID 0814
- [15] Cui S (for ARGO-YBJ Collaboration) 2011 32nd Intern Cosmic Ray Conf vol 1, p 6
- [16] Guillian G for the Super-Kamiokande Collaboration 2007 Phys.Rev.D75: 062003
- [17] Wefel J P, et al 2005 Proc. 29th Intern Cosmic Ray Conf vol 3 p 105
- [18] Adriani O, 2011 Science, 332 (6025) 66
- [19] Zatsepin V I, et al 1994 Phys Atom Nucl 57 645
- [20] Takahashi Y for the JACEE collaboration 1998 Nucl. Phys. B Proc. Suppl 60 83
- [21] Gehrels N and Chen W 1993 Nature 361 706
- [22] Thoudam S and Hoerandel J R 2012 MNRAS 421 1209