Observation of flat band for terahertz spoof plasmon
in metallic kagomé lattice
Abstract
We study the dispersion relation of a metamaterial composed of metallic disks and bars arranged to have kagomé symmetry and find that a plasmonic flat band is formed by the topological nature of the kagomé lattice. To confirm the flat-band formation, we fabricate the metamaterial and make transmission measurements in the terahertz regime. Two bands formed by transmission minima that depend on the polarization of the incident terahertz beams are observed. One of the bands corresponds to the flat band, as confirmed by the fact that the resonant frequency is almost independent of the incident angle.
pacs:
81.05.Xj, 41.20.Jb, 42.25.BsI Introduction
Kagomé lattices have attracted considerable interest from the aspect of geometric frustration in condensed-matter physics.Atwood (2002) There is extensive degeneracy of nondispersing resonant modes in a resonator system with kagomé symmetry. These eigenmodes form a flat band, where the resonant frequency of the band is the same for all wavevectors in the first Brillouin zone. The flat band originates purely from the topology of the lattice structure, and it remains flat even when the couplings between the adjacent sites are significantly large. Furthermore, such flat bands can lead to ferromagnetism of itinerant fermions,Lieb (1989); Mielke (1991a, b); Tasaki (1992) supersolidity for bosons,Huber and Altman (2010); Möller and Cooper (2012) crystalline ordering,Wu et al. (2007) and other effects.
Although the flat-band formation is first expected in quantum systems, it can occur in electromagnetic systems. The presence of electromagnetic flat bands in kagomé lattices has already been predicted theoretically in some electromagnetic systems, such as two-dimensional photonic crystalsTakeda et al. (2004) and metallophotonic waveguide networks.Endo et al. (2010) In the flat band, the group velocity is slowed down in all directions and the effective mass of the photons becomes very heavy. It is important to study the flat band in the electromagnetic system with kagomé symmetry in terms not only of fundamental physics, but also from an application standpoint, such as slow light;Baba (2008) however, there has been no experimental demonstration for the electromagnetic flat band.
Here, we focus on the flat band for a terahertz (THz) plasmonic mode. Although there is no surface plasmon of metals in the THz region, the modes having the dispersion relation similar to surface plasmons are formed in structured metals, and called spoof surface plasmons.Pendry et al. (2004); Garcia-Vidal et al. (2005); Williams et al. (2008); Maier et al. (2006) In this paper, we theoretically and experimentally obtain the dispersion relation for a spoof plasmon in the metallic kagomé lattice and demonstrate the electromagnetic flat band in the THz regime. Numerical simulations are also performed to provide confirmation of the experiments.
II Theoretical model
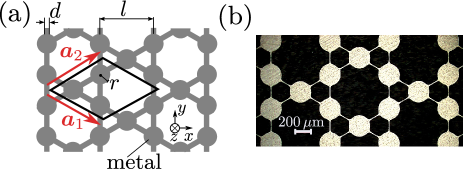
We introduce kagomé-type bar-disk resonators (KBDRs), shown in Fig. 1(a). Metallic disks and narrow bars are connected to form a kagomé lattice. KBDRs are artificially engineered metallic structures, and considered as a kind of metamaterial.Veselago (1968); Shelby et al. (2001); Pendry et al. (1999); Pendry (2000); Leonhardt (2006); Pendry et al. (2006); Schurig et al. (2006); Liu et al. (2009a) In KBDRs, electric charge stored on each disk temporally oscillates between positive and negative values. We discuss the formation of a flat band in KBDRs by using a coupled oscillator model. We denote the electric potential at the th disk as . Introducing , we obtain a Lagrangian as
| (1) |
with capacitance of the disk, inductance of the bar, coefficient of electric induction between nearest disks, and adjacency matrix of the kagomé lattice, whose element is if the th and th disks are directly connected by a bar for ; otherwise 0.Biggs (1994) The first, second, and third terms of Eq. (1) represent the electric energy stored on disks, mutual electric energy stored between disks, and magnetic energy stored around bars, respectively. Here, we consider only the nearest mutual couplings.
Using the Euler-Lagrange equation , we obtain coupled charge equations as
| (2) |
with stored charge at the th disk, resonant angular frequency , and coupling coefficient . In the frequency domain, we rewrite Eq. (2) as
| (3) |
where tildes represent complex amplitudes. Owing to the lattice symmetry, we can reduce Eq. (3) to an eigenvalue problem for a matrix and obtain the dispersion relation consisting of three bands as
| (4) |
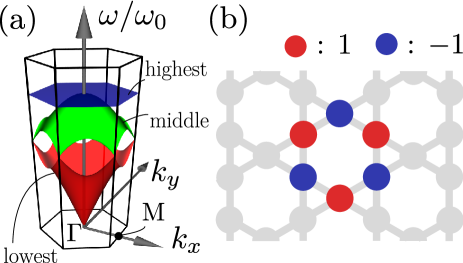
where with wavevector in the plane and unit-lattice vectors shown in Fig. 1(a). A calculated dispersion relation is shown in Fig. 2(a) for . It is clear that the highest band is flat or independent of . It can be seen that the lowest band shows conical dispersion near the point and that the bending middle band touches the flat band at the point.
The flat band is caused by the interference of spoof plasmon propagating in the kagomé lattice. The adjacency matrix of the kagomé lattice has eigenmodes localized at hexagonal sites with an eigenvalue of . One of them is shown in Fig. 2(b). The number of the eigenmodes is equal to the number of hexagons in the kagomé lattice. The flat band is formed from these degenerated localized modes as they are not coupled with each other.
III Experimental setup
We fabricate KBDRs on a stainless-steel plate. The dimensions depicted in Fig. 1(a) are as follows: period between bars , bar width , disk radius , and metal thickness . The size of the area patterned KBDRs is . A photomicrograph of a fabricated sample is shown in Fig. 1(b).
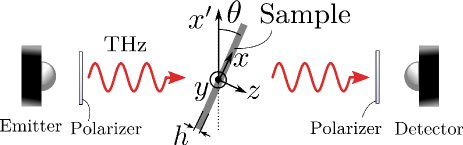
To investigate the dispersion relation experimentally, we perform THz time-domain spectroscopy (THz-TDS), shown in Fig. 3. A THz emitter and detector (EKSPLA Ltd.) with dipole antennas attached to Si lenses are used. These antennas are integrated on low-temperature-grown GaAs photoconductors, and driven by a femtosecond fiber laser (F-100, IMRA America, Inc.) with a wavelength of and pulse duration of . The THz beam is collimated with the Si lens near the emitter. The beam radius is about , which covers a large number of KBDRs. The THz electric field is coherently measured by the detector. We obtain the transmission spectrum in the frequency domain from , where and are Fourier transformed electric fields with and without the sample, respectively.
In order to obtain the band structure between the point and the point, the sample is rotated by with respect to the axis from normal incidence (Fig. 3). The angles range from to with a step . The magnitude of the wavevector on the sample plane is given by where is the speed of light.
We perform transmission experiments for two polarizations along the axis (parallel configuration) and axis (perpendicular configuration). We denote the electric field of the incident wave as , and the projection of to the sample plane as . For parallel or perpendicular configurations, is parallel or perpendicular, respectively, to . Wire-grid polarizers near the emitter and detector are adjusted so that the emitted and detected fields have the same polarization.
IV Results
Figure 4(a) displays the transmission spectrum for parallel configuration. The wavevectors are estimated as . Transmission spectrum minima are observed from to . With an increase of wavenumber, the frequency of the transmission minimum decreases from at the point and approaches at the point.
For further investigation, we calculate the electromagnetic response of KBDRs for parallel configuration. A commercial finite-element method solver (Ansoft HFSS) is used. In the simulation, a plane THz wave is injected into perfectly conducting KBDRs at an incident angle . By using periodic boundaries with some phase shifts, the transmission and the electromagnetic fields in the unit cell are calculated for an oblique incident plane wave. The measured transmission spectra for are compared with the simulation in Fig. 4(b).
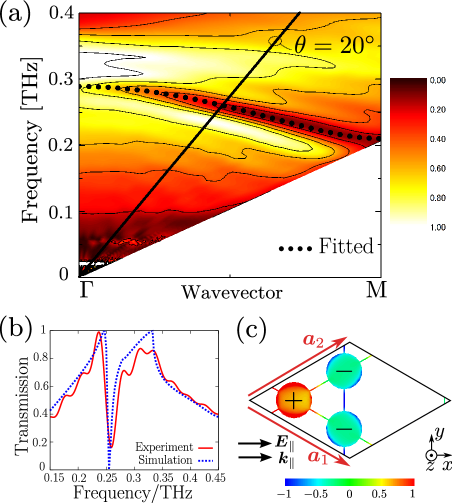
The frequency of the transmission minimum and shape of the curve for the simulation are consistent with the experimental result, which confirms the validity of the assumption of perfect conductors.
Figure 4(c) shows the calculated distribution of surface electric charges at a minimum () for . This mode corresponds to the middle band. Disks along the axis are alternately charged. The in-phase currents along and are excited by the electromotive force due to . No resonance appears for because the current flowing into a disk is balanced by the current flowing out of it. For the excitation of this mode, a phase-shifted field in the -direction is needed.
By using Eq. (4), the fitting parameters are obtained from experimental data as and . The resultant dispersion curve is represented as a dotted curve in Fig. 4(a). Positive charges on one disk induce negative charges on the other; therefore, is ordinarily expected in the static limit (). It seems strange that would be positive. In our situation, it can be explained by a retardation effect.Solymar and Shamonina (2009) The phase shift between nearest disks is given by at the center frequency of the middle band. The near shift leads to . Although depends on frequency, we can approximately regard it as a constant between and .
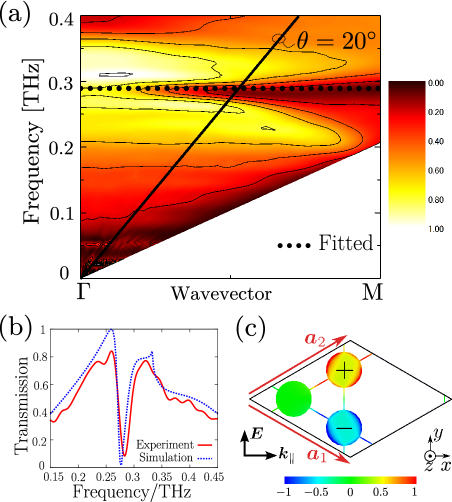
Figure 5(a) displays the transmission spectrum for perpendicular configuration. Unlike in the case of parallel configuration, the flat band of the transmission minima is observed around .
In order to confirm that the flat band is due to the interference of a spoof plasmon, we perform a simulation for perpendicular configuration. A calculated transmission spectrum by simulation for is shown in Fig. 5(b) with the experimental data. We see a good agreement in the frequency of the transmission minimum and the shape of the curve. The calculated distribution of surface electric charges at a minimum () for is shown in Fig. 5(c). The resonant mode has antisymmetric amplitudes on the right two disks and there is no charge stored on the left disk. This mode can be constructed by the localized modes shown in Fig. 2(b). Therefore, the flat transmission minima are caused by the topological nature of the kagomé lattice. The mode is excited by anti-phase electromotive force caused by along bars parallel to and . The electromotive force along vertical bars does not contribute to the storage of charges on disks because the currents flowing into and out of a disk are balanced. In the case of , the current flowing into a disk is equal to the current flowing out of it and the flat-band mode cannot be excited.
A dotted line in Fig. 5(a) represents the highest band given by Eq. (4) with the previously derived parameters and . It fits well with the minima experimentally obtained. The bend of the flat band caused by coupling to second (or higher) nearest sites is negligibly small, so the assumption of only nearest mutual disk coupling is appropriate.
V discussion
Our bar-disk resonators (BDRs) are obtained by inverting the metallic area and empty space of the slit-hole resonators (SHRs)Liu et al. (2009b); Zhu et al. (2010) composed of slits and holes engraved on an ultra thin metallic plate. The BDRs and SHRs are complementary structures related through the Babinet’s principle,Jackson (1999); Born and Wolf (1999); Falcone et al. (2004) based on the electric/magnetic reciprocity of a vacuum. We denote a pair of an electric field and a magnetic field as . Due to the Babinet principle, the transmittance of a complementary metallic screen with an complementary incident wave is equal to the reflectance of the original metallic screen illuminated by an incident wave , where is the impedance of a vacuum. Thus, the transmission peaks in SHRs correspond to the transmission minima in BDRs. This fact shows the duality of the Lagrangians of SHRs and BDRs.
Electromagnetic flat bands for all crystal directions have been reported for photonic crystals with square symmetry, theoreticallyAltug and Vučković (2004) and experimentally.Altug and Vučković (2005) In this case, the flat bands are formed due to good lateral confinement (high factor) of the quadropole modes, which lack preferential coupling directions, at defects of photonic crystals. On the other hand, the flat band for KBDRs is not caused by highly confined modes, but by the topological nature of the kagomé lattice. The kagomé lattice prevents spoof plasmons from propagating despite the existence of strong coupling. Thus, the physical origin of the flat band on KBDRs differs from that for photonic crystals.Altug and Vučković (2004, 2005) The flat band for propagating modes has been theoretically predicted for square waveguide networks.Feigenbaum and Atwater (2010) Our system is considered as an experimental realization of the flat band for the propagating mode.
The flat band in the kagomé lattice comes from local interference effects. The global symmetry (i.e., periodicity of the lattice) is not necessarily required because local symmetries can support the localized mode. The resonance independent of the incident angle could be expected for the metallic structure having localized modes with the same resonant frequency, even without periodicity.
VI conclusion
In conclusion, we studied theoretically and experimentally the electromagnetic flat band on a metallic kagomé lattice. Kagomé-type bar-disk resonators were proposed to realize the flat band. A dispersion relation composed of three bands was theoretically predicted for KBDRs. The highest band was flat for all wavevectors. Two bands formed by transmission minima depending on the polarization of the incident terahertz beams were observed experimentally. One of the bands corresponded to the flat band. Theoretical fitting showed good agreement for these modes. By simulation, we revealed that the flat band was caused by the topological nature of the kagomé lattice.
The flat band can be applicable to slow light, which is useful for the control of group velocity,Tamayama et al. (2010, 2012) high sensitive sensing, and other applications. In the flat band, the effective mass of photons becomes very heavy and their correlation has an important role. Multiphoton correlation effects in kagomé lattices are important in terms of fundamental physics and should be studied in the future.
Acknowledgements.
The authors would like to thank A. Yao and T. Hikihara for technical assistance, and S. Endo for fruitful discussions. This research was supported in part by Grants-in-Aid for Scientific Research No. 22109004 and No.22560041, the Global COE program “Photonics and Electronics Science and Engineering” at Kyoto University, the Program for Improvement of Research Environment for Young Researchers from the Special Coordination Funds (SCF) for Promoting Science and Technology commissioned by the Ministry of Education, Culture, Sports, Science and Technology (MEXT) of Japan (T.O.), the Research Foundation for Opto-Science and Technology (T.O.), and research grants from the Murata Science Foundation (T.O. and T.N.).References
- Atwood (2002) J. L. Atwood, Nature Mater. 1, 91 (2002).
- Lieb (1989) E. H. Lieb, Phys. Rev. Lett. 62, 1201 (1989).
- Mielke (1991a) A. Mielke, J. Phys. A 24, L73 (1991a).
- Mielke (1991b) A. Mielke, J. Phys. A 24, 3311 (1991b).
- Tasaki (1992) H. Tasaki, Phys. Rev. Lett. 69, 1608 (1992).
- Huber and Altman (2010) S. D. Huber and E. Altman, Phys. Rev. B 82, 184502 (2010).
- Möller and Cooper (2012) G. Möller and N. R. Cooper, Phys. Rev. Lett. 108, 045306 (2012).
- Wu et al. (2007) C. Wu, D. Bergman, L. Balents, and S. Das Sarma, Phys. Rev. Lett. 99, 070401 (2007).
- Takeda et al. (2004) H. Takeda, T. Takashima, and K. Yoshino, J. Phys. Condens. Matter 16, 6317 (2004).
- Endo et al. (2010) S. Endo, T. Oka, and H. Aoki, Phys. Rev. B 81, 113104 (2010).
- Baba (2008) T. Baba, Nature Photon. 2, 465 (2008).
- Pendry et al. (2004) J. B. Pendry, L. Martín-Moreno, and F. J. García-Vidal, Science 305, 847 (2004).
- Garcia-Vidal et al. (2005) F. J. Garcia-Vidal, L. Martín-Moreno, and J. B. Pendry, J. Opt. A: Pure Appl. Opt. 7, S97 (2005).
- Williams et al. (2008) C. R. Williams, S. R. Andrews, S. A. Maier, A. I. Fernández-Domínguez, L. Martín-Moreno, and F. J. García-Vidal, Nature Photon. 2, 175 (2008).
- Maier et al. (2006) S. A. Maier, S. R. Andrews, L. Martín-Moreno, and F. J. García-Vidal, Physical Review Letters 97, 176805 (2006).
- Veselago (1968) V. G. Veselago, Sov. Phys. Usp. 10, 509 (1968).
- Shelby et al. (2001) R. A. Shelby, D. R. Smith, and S. Schultz, Science 292, 77 (2001).
- Pendry et al. (1999) J. Pendry, A. Holden, D. Robbins, and W. Stewart, IEEE Trans. Microwave Theory Thech. 47, 2075 (1999).
- Pendry (2000) J. B. Pendry, Phys. Rev. Lett. 85, 3966 (2000).
- Leonhardt (2006) U. Leonhardt, Science 312, 1777 (2006).
- Pendry et al. (2006) J. B. Pendry, D. Schurig, and D. R. Smith, Science 312, 1780 (2006).
- Schurig et al. (2006) D. Schurig, J. J. Mock, B. J. Justice, S. A. Cummer, J. B. Pendry, A. F. Starr, and D. R. Smith, Science 314, 977 (2006).
- Liu et al. (2009a) H. Liu, Y. M. Liu, T. Li, S. M. Wang, S. N. Zhu, and X. Zhang, Phys. Status Solidi B 246, 1397 (2009a).
- Biggs (1994) N. Biggs, Algebraic Graph Theory, 2nd ed. (Cambridge University Press, New York, 1994).
- Solymar and Shamonina (2009) L. Solymar and E. Shamonina, Waves in Metamaterials (Oxford University Press, Oxford, 2009).
- Liu et al. (2009b) H. Liu, T. Li, Q. J. Wang, Z. H. Zhu, S. M. Wang, J. Q. Li, S. N. Zhu, Y. Y. Zhu, and X. Zhang, Phys. Rev. B 79, 024304 (2009b).
- Zhu et al. (2010) C. Zhu, H. Liu, S. M. Wang, T. Li, J. X. Cao, Y. J. Zheng, L. Li, Y. Wang, S. N. Zhu, and X. Zhang, Optics Express 18, 26268 (2010).
- Jackson (1999) J. Jackson, Classical electrodynamics, 3rd ed. (Wiley, New York, 1999).
- Born and Wolf (1999) M. Born and E. Wolf, Principles of optics, 7th ed. (Pergamon, Oxford, 1999).
- Falcone et al. (2004) F. Falcone, T. Lopetegi, M. A. G. Laso, J. D. Baena, J. Bonache, M. Beruete, R. Marqués, F. Martín, and M. Sorolla, Phys. Rev. Lett. 93, 197401 (2004).
- Altug and Vučković (2004) H. Altug and J. Vučković, Appl. Phys. Lett. 84, 161 (2004).
- Altug and Vučković (2005) H. Altug and J. Vučković, Appl. Phys. Lett. 86, 111102 (2005).
- Feigenbaum and Atwater (2010) E. Feigenbaum and H. A. Atwater, Phys. Rev. Lett. 104, 147402 (2010).
- Tamayama et al. (2010) Y. Tamayama, T. Nakanishi, Y. Wakasa, T. Kanazawa, K. Sugiyama, and M. Kitano, Phys. Rev. B 82, 165130 (2010).
- Tamayama et al. (2012) Y. Tamayama, T. Nakanishi, and M. Kitano, Phys. Rev. B 85, 073102 (2012).