ACCRETION OUTBURSTS IN CIRCUMPLANETARY DISKS
Abstract
We describe a model for the long term evolution of a circumplanetary disk that is fed mass from a circumstellar disk and contains regions of low turbulence (dead zones). We show that such disks can be subject to accretion driven outbursts, analogous to outbursts previously modeled in the context of circumstellar disks to explain FU Ori phenomena. Circumplanetary disks around a proto-Jupiter can undergo outbursts for infall accretion rates onto the disks in the range to , typical of accretion rates in the T Tauri phase. During outbursts, the accretion rate and disk luminosity increases by several orders of magnitude. Most of the planet mass growth during planetary gas accretion may occur via disk outbursts involving gas that is considerably hotter than predicted by steady state models. For low infall accretion rates that occur in late stages of disk accretion, disk outbursts are unlikely to occur, even if dead zones are present. Such conditions are favorable for the formation of icy satellites.
1 Introduction
According to recent models, after a planet forms in a circumstellar disk and its mass reaches that of the order of Neptune’s, tidal forces from the planet open a gap in the disk (Lin & Papaloizou, 1984, 1986; D’Angelo, Henning & Kley, 2002; Bate et al., 2003). Material continues to flow from the circumstellar disk through the gap and onto the planet (Artymowicz & Lubow, 1996; Kley, 1999; Lubow, Seibert & Artymowicz, 1999; D’Angelo, Henning & Kley, 2003; Lubow & D’Angelo, 2006; Ayliffe & Bate, 2009). The planetary radius is much smaller than its Hill radius and, since gas flows into the Hill sphere with some angular momentum, a circumplanetary disk forms. If modeled as a standard viscous accretion disk, the circumplanetary disk is tidally truncated by the star at a radius of about times the Hill radius (Martin & Lubow, 2011a). Nearly all studies of the global structure of circumplanetary disks have assumed them to be fully turbulent. In this Letter, we explore the long-term consequences of dead zones in circumplanetary disks, regions that have no turbulence near the midplane. In particular, we show that these disks can undergo outbursts.
The structure of a circumplanetary disk depends upon the rate of angular momentum transport across the disk. The angular momentum transport allows mass to move inwards and be accreted onto the central planet. Angular momentum transport is driven by turbulence, of which there are two main sources. First, the magneto rotational instability (MRI) drives turbulence if the gas is sufficiently well ionized to be coupled to a magnetic field (Balbus & Hawley, 1991). In the hot inner parts of the disk, the field is well coupled due to thermal ionization and the MRI drives turbulence. However, further out where the disk is cooler, the low ionization fraction causes magnetic field instabilities to be suppressed (Gammie, 1996; Gammie & Menou, 1998; Turner & Sano, 2008). The disk is said to form a dead zone at the midplane because it is not turbulent in this region. However, the disk becomes layered because external radiation such as cosmic rays or X-rays can ionize the surface layers, allowing them to be turbulent (e.g., Glassgold, Najita & Igea, 2004). The second type of turbulence is driven by gravitational instability if the disk acquires enough mass (Paczynski, 1978; Lodato & Rice, 2004).
Young circumstellar disks are thought to undergo outbursts (FU Ori phenomena) as a consequence of a sudden change in the level of turbulence (Gammie, 1996; Armitage at al., 2001; Zhu et al., 2009; Martin & Lubow, 2011b). Because a dead zone inhibits inward flow onto the star, mass should build up within the circumstellar disk. With sufficient mass, the dead zone becomes gravitationally unstable. The instability causes turbulent heating and increased ionization of the gas, which can trigger the MRI. This triggering causes a sudden increase in the disk turbulence, resulting in an accretion outburst. After the outburst, the remaining disk cools sufficiently for a dead zone to form again and the outburst cycle repeats periodically. This process, the gravo-magneto (GM) instability, can be understood as a limit cycle (Martin & Lubow, 2011b). The outbursts can be explained as transitions between steady state disk solutions in a diagram that plots the disk effective temperature versus the total surface density at a fixed radius. This graph is analogous to the well-known S-curve used to explain dwarf-nova outbursts. There is a range of accretion rates for which no steady disk solution exists and for these rates the disk is GM unstable.
Similar outbursts could also occur in circumplanetary disks. Martin & Lubow (2011a) suggested that dead zone formation is even more favorable in circumplanetary disks than in circumstellar disks because the surface densities may be higher, while the temperatures remain low enough to avoid thermal ionization. In this work, for the first time we model the global structure of a layered circumplanetary disk over long timescales for a variety of parameters. In Section 2 we describe the disk model and the disk evolution. In Section 3 we discuss the observability of a circumplanetary disk. Finally, in Section 4 we discuss implications of the layered circumplanetary disk model.
2 Circumplanetary Disk Models
2.1 Model Description
We apply the layered disk model initially described in Armitage at al. (2001) and further developed by Zhu et al. (2009) and Martin & Lubow (2011b). Material falls onto the disk at a constant rate and is accreted onto the central planet through the inner disk boundary at a rate . The model accounts for the effects of disk turbulence by a viscosity. The disk vertical structure consists of layers: outer magnetically turbulent surface layers on the upper and lower disk surfaces and a midplane layer that can be either nonturbulent (dead) or turbulent (active) due to the effects of disk magnetic fields and/or self-gravity. The disk temperatures in these layers are accounted for by a relation that is based on dust opacity. Disk heating is taken to be only due to accretion. External heating by the star or planet is ignored. Heating by the star may be ignored for planet orbital radii , since its contribution to the disk temperature is much less than that required for thermal ionization . The disk is taken to be in Keplerian orbit about the planet. The model does not account for the effects of pressure or self-gravity on the disk rotation. The planet is assumed to accept whatever gas is accreted through the disk inner boundary without significant expansion into the disk, as in the run-away phase of gas accretion of the core accretion model (D’Angelo, Durisen, & Lissauer, 2010). We take the mass of the planet to be fixed and do not account for its mass increase through gas accretion.
The disk has a total surface density , midplane temperature and surface temperature for radius and time . The MRI turbulent surface layers have total surface density , temperature , and viscosity that is parameterized with the Shakura & Sunyaev (1973) parameter. The external radiation is assumed to be able to penetrate to a constant surface density in total for the disk upper and lower surface regions. If the surface density is greater than this critical value, , then . For smaller surface density, , the disk is MRI active at all heights, so that .
A complementary midplane layer exists if the surface density is larger than the critical value, . It has surface density and midplane temperature . This layer is MRI active if the midplane temperature is greater than the critical, , where is the temperature for sufficient thermal ionization. However, for lower temperatures, , a dead zone forms. There is then no turbulence near the midplane unless it is massive enough to be self-gravitating. The condition for self-gravity is taken to be that the Toomre parameter (Toomre, 1964) is smaller than its critical value, . In this case, a second viscosity term is included in the complementary layer.
We consider the case of a Jupiter-like planet of mass, , orbiting a solar mass star, , at a distance of . We solve the accretion disk equations numerically on a fixed mesh that is uniform in with 120 grid points (e.g., Armitage at al., 2001; Martin et al., 2007). The inner boundary has a zero torque condition at the radius of Jupiter, , so the mass falls freely onto the planet. At the outer boundary we approximate the tidal torque from the star with a zero radial velocity boundary condition at , equivalent to equation 70 of Martin & Lubow (2011a). Circumstellar gas accretes onto the circumplanetary disk at a constant rate at a radius .
The specific angular momentum of the accreting gas entering the planet’s Hill sphere from the circumstellar disk has yet to be determined. One estimate is obtained by assuming that the gas enters near the Lagrange points, and , and is nearly at rest relative to these points as it enters. By conservation of angular momentum, the circularization radius for infalling material is estimated to be about (Quillen, 1998; Estrada et al., 2009) and we take this radius to be . We have also considered cases of and found that the results are about the same. This outcome is consistent with the results for a fully turbulent disk by Martin & Lubow (2011a) that show the circumplanetary disk structure is not very sensitive to the angular momentum distribution of the incoming circumstellar gas. Initially we take the surface density to be very small everywhere and allow material to build up. We run the simulation until either the disk reaches a steady state or the mass accretion onto the central planet shows an outburst pattern that repeats itself.
The properties of the turbulent surface layer have not been well determined. There have been recent attempts to determine its depth, , by calculating in detail the ionization balance of the disk due to external sources of radiation and subject to various processes, such as ambipolar diffusion and the presence of PAH and dust that tend to suppress the ionization (e.g., Bai & Goodman, 2009; Perez-Becker & Chiang, 2011; Bai, 2011). When applied to protostellar disks, these calculations result in accretion rates that are lower than observed in typical T Tauri stars. The discrepancy is currently unresolved. Rather than attempt to fold in such an approach in this Letter, we follow Armitage et al. (2002) and Zhu et al. (2009, 2010) and regard as a free parameter. Since typical T Tauri accretion rates suggest that (Perez-Becker & Chiang, 2011), we consider values in the range
Following Armitage et al. (2001), we take . Various arguments suggest the viscosity parameter is found to be (e.g. Hartmann et al., 1998; Fromang et al., 2007; Guan et al., 2009; Davis et al., 2009; Zhu et al., 2007; King, Pringle & Livio, 2007). With the uncertainty in the value, we consider cases with and .
During times of planet formation, the accretion rate onto the circumplanetary disk, , is of order the overall circumstellar disk accretion rate (Bate et al. 2003; Lubow & D’Angelo 2006; Ayliffe & Bate 2009) that we take to be of order (Valenti, Basri & Johns, 1993; Hartmann et al., 1998), typical for the T Tauri phase. In this Letter, we consider a range of values for , , and .
2.2 Model Results
In Table 1 we show the outcome for a set of model parameters. If the model does not reach a steady state and outbursts occur, then we tabulate the time interval between outbursts, , and the duration of outbursts, . For in the range with , outbursts are possible for accretion rates onto the disk of to . They repeat on a typical timescale of to and last for a few to several years. We caution, however, that in the outburst state the disk thickness is formally of order the disk radius. Consequently, the idealization of a disk geometry in Keplerian rotation at this stage is questionable. In the quiescent state, the disk thickness is a few tenths of the disk radius, as expected by equation 4 of Martin & Lubow (2011a) and the three-dimensional simulations of Ayliffe & Bate (2009). We find that the disk mass reaches values that are not very small compared to the planet mass. For example, model R3 reaches values as high as about 0.3 . The Keplerian disk assumption is then not well satisfied at all times. Improved multi-dimensional modeling should be carried out in future work.
The results indicate a maximum accretion rate, , of about and a quiescent accretion rate of about . Consequently, accretional heating of the gas increases substantially during an outburst. The mass accreted during an outburst is somewhat greater than the mass accreted between outbursts, typically 30% to 40% greater. The disk is stabilized against outbursts with a larger active outer layer surface density, , or stronger turbulence . For smaller values of , outbursts become more problematic. Model R7 with has a longer interval between outbursts and involves an accreted mass during outburst that is comparable to that of the planet which suggests a more detailed treatment is required to determine whether outbursts occur in this regime. The detailed ionization models discussed in Section 2.1 obtain even lower values of , for which our models are subject to this limitation.
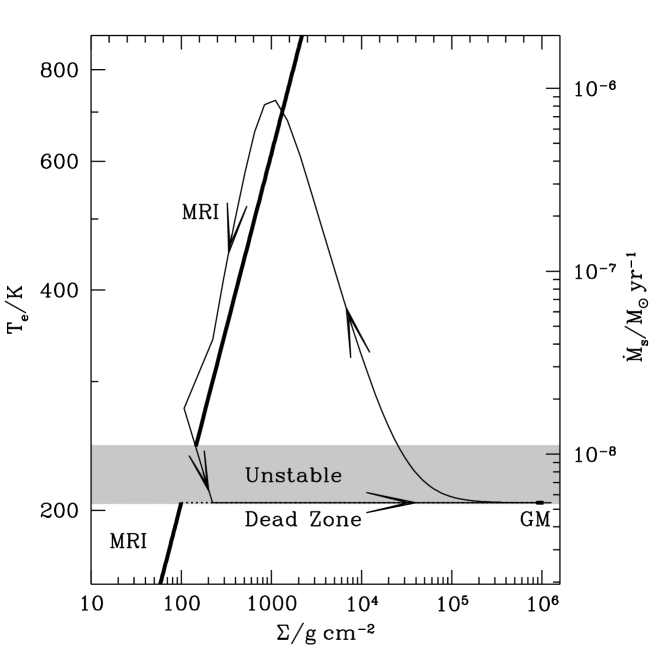
The instability cycle can be understood through a state transition diagram that plots effective surface temperature (or equivalent steady state accretion rate) as a function of disk surface density at some fixed radius in the disk (Martin & Lubow, 2011b). In Fig. 1 we show the limit cycle for model R3 in the such a diagram at a radius . The steady accretion rate, , corresponds to the surface temperature of the disk given by equation 18 in Martin & Lubow (2011b). The thick solid lines show the two types of analytical steady state solutions. The first is fully MRI active and this has two branches, one with (upper branch) and a second with (lower branch). The second type of steady state is the gravo-magneto (GM) solution that has a self gravitating dead zone and MRI active surface layers. The dotted line shows the nonsteady dead zone branch that connects the lower MRI branch to the GM branch. The numerical simulations reveal a cycle on this diagram. The simulation results plotted in Fig. 1 generally track along the dead zone and steady state branches. The simulation track moves to the right from the dead zone branch to the GM branch. This branch is plotted as a short line segment at the right end of the horizontal line. After outburst, the simulation backtracks somewhat to the left and slightly upward, and then advances directly upward to the upper MRI branch. This upward transition marks the onset of the outburst.
Between the dead zone/GM branches and the upper MRI branch there is a range of accretion rates for which no steady state is possible and an outburst results. This unstable regime is plotted as the shaded region. Model R3 lies in that range at the selected radius, since it has an infall accretion rate of . The global range of unstable accretion rates covers a somewhat wider range than is shown on the plot, since other unstable rates may occur at other radii.
The results in Table 1 are consistent with there being a limited range of infall accretion rates that result in outbursts. Model R10 undergoes outbursts while models R9 and R11, having lower and higher infall accretion rates respectively, do not undergo outbursts, with all other input parameters being the same.
| Model | ||||||||
|---|---|---|---|---|---|---|---|---|
| R1 | 0.01 | 40 | steady | |||||
| R2 | 0.01 | 40 | ||||||
| R3 | 0.01 | 100 | ||||||
| R4 | 0.01 | 200 | steady | |||||
| R5 | 0.01 | 40 | steady | |||||
| R6 | 0.1 | 20 | steady | |||||
| R7 | 0.1 | 10 | ||||||
| R8 | 0.1 | 20 | ||||||
| R9 | 0.1 | 40 | steady | |||||
| R10 | 0.1 | 40 | 1.5 | |||||
| R11 | 0.1 | 40 | steady |
3 Observability of a Circumplanetary Disk
The average accretion rate onto the planet is equal to the rate of infall accretion onto the disk. Because the accretion through the disk is time dependent, so is the luminosity. The luminosity of an accretion disk is
| (1) |
(Pringle, 1981), where is the inner edge of the disk that is assumed to coincide with the radius of the central star or planet. For example, a disk around a solar mass and radius star with an accretion rate of has an accretion luminosity of (in addition to the luminosity due to heating from the star). If a disk surrounds a Jupiter mass and (constant) Jupiter radius planet that has opened a gap in the circumstellar disk, the quiescent luminosity of the circumplanetary disk is or only 1 percent of accretion luminosity of the circumstellar disk.
If the disk is observed during an outburst with a high accretion rate of , then the luminosity is (see Table 1). However, the disk will be in outburst only for of time. It is possible that with the increased luminosity even for short periods of time, forming planets may be more easily detected. Synoptic surveys may be capable of detecting such events in the future.
4 Discussion and Conclusions
Circumplanetary disks can contain regions with low turbulence (dead zones) because they have high enough surface densities to prevent ionization of the disk midplane by external sources of radiation, but remain cool enough to avoid thermal ionization. As a result of dead zone formation, the disks are unstable to the gravo-magneto (GM) instability in which a sudden turn-on of the MRI triggers a rapid accretion event (see Fig. 1). We have found that such outbursts are possible for infall accretion rates onto the disk in the range of to , typical of accretion rates in the T Tauri phase of young stars, when gas giant planet formation may occur. The quiescent accretion rates onto planets are , but during outbursts the rates increase up to , making them more observable. The outbursts typically occur every to and have a duration of only several years. Somewhat more gas is accreted during outbursts than between them.
The results have implications for the nature of gas accretion onto a planet during the run-away gas accretion phase of the core accretion model (see D’Angelo et al. 2010). The higher entropy we expect to be associated with the gas accreted onto a planet in outbursts may have implications on the initial state of a newly formed planet. The higher entropy may favor more luminous ”hot start” planet models (c.f. Marley et al 2007).
There are several approximations in the layered disk model we have considered that should be improved upon in future work. Some of these were discussed in Martin & Lubow (2011b) in the context of circumstellar disks. The present treatment is based on a one-dimensional model of a disk in Keplerian rotation. As noted in Section 2.2, in the case of circumplanetary disks, the disk thicknesses and masses can result in structures that may not be well approximated by a Keplerian disk. Multi-dimensional simulations that include pressure and self-gravity would be of benefit in understanding the evolution of the outburst and the accretion onto the planet.
Lower accretion rates () provide lower disk temperatures that would be compatible with the survival of icy satellites at their current locations (Canup & Ward, 2002; Mosqueira & Estrada, 2003; Ward & Canup, 2010). Such rates can occur at late stages of disk evolution. The Jovian circumplanetary disk could have contained a dead zone in the regular satellite region, provided that external sources of radiation penetrated a disk surface density of . It is unlikely that outbursts will occur at this stage even in the presence of a dead zone, since the time required for a disk to reach a self-gravitating state is longer than the disk lifetime. Therefore, although outbursts could adversely affect the survival of icy satellites, they are unlikely to occur at these late stages.
Acknowledgements
SHL acknowledges support from NASA grant NNX07AI72G. RGM thanks the Space Telescope Science Institute for a Giacconi Fellowship.
References
- Armitage at al. (2001) Armitage P. J., Livio M., Pringle J. E., 2001, MNRAS, 324, 705
- Artymowicz & Lubow (1996) Artymowicz P., Lubow S. H., 1996, ApJ, 467, L77
- Ayliffe & Bate (2009) Ayliffe B. A., Bate M. R., 2009, MNRAS, 393, 49
- Balbus & Hawley (1991) Balbus S. A., Hawley J. F., 1991, ApJ, 376, 214
- Bai (2011) Bai, X.-N. 2011, ApJ, 739, 50
- Bai & Goodman (2009) Bai, X.-N., Goodman, J. 2009, ApJ, 701, 737
- Bate et al. (2003) Bate M. R., Lubow S. H., Ogilvie G. I., Miller K. A., 2003, MNRAS, 341, 213
- Canup & Ward (2002) Canup R. M., Ward W. R., 2002, ApJ, 124, 3404
- D’Angelo, Henning & Kley (2002) D’Angelo G., Henning T., Kley W., 2002, A&A, 385, 647
- D’Angelo, Henning & Kley (2003) D’Angelo G., Henning T., Kley W., 2003, ApJ, 599, 548
- D’Angelo, Durisen, & Lissauer (2010) D’Angelo, G., Durisen, R. H., & Lissauer, J. J. 2010, Exoplanets, 319
- Davis et al. (2009) Davis S. W., Blaes O. M., Hirose S., Krolik J. H., 2009, ApJ, 703, 569
- Estrada et al. (2009) Estrada P. R., Mosqueira I. L., Lissauer J. J., D’Angelo G., Cruikshank D. P., 2009, in Europa, eds Pappalardo R. T., McKinnon W. B., Khurana K. K., University of Arizona Press, Tucson, 27
- Fromang et al. (2007) Fromang S., Papaloizou J., Lesur G., Heinemann T., 2007, A&A, 476, 1123
- Gammie (1996) Gammie C. F., 1996, ApJ, 457, 355
- Gammie & Menou (1998) Gammie C. F., Menou K., 1998, ApJ, 492, 75
- Glassgold, Najita & Igea (2004) Glassgold A. E., Najita J., Igea J., 2004, ApJ, 615, 972
- Guan et al. (2009) Guan X., Gammie C. F., Simon J. B., Johnson B. M., 2009, ApJ, 694, 1010
- Hartmann et al. (1998) Hartmann L., Calvet N., Gullbring E., D’Alessio P., 1998, ApJ, 495, 385
- King, Pringle & Livio (2007) King A. R., Pringle J. E., Livio M., 2007, MNRAS, 376, 1740
- Kley (1999) Kley W., 1999, MNRAS, 303, 696
- Lin & Papaloizou (1984) Lin D. N. C., Papaloizou J.,1984, ApJ, 285, 818
- Lin & Papaloizou (1986) Lin D. N. C., Papaloizou J.,1986, ApJ, 309, 846
- Lodato & Rice (2004) Lodato G., Rice W. K. M., 2004, MNRAS, 351, 630
- Lubow, Seibert & Artymowicz (1999) Lubow S. H., Seibert M., Artymowicz P., 1999, ApJ, 526, 1001
- Lubow & D’Angelo (2006) Lubow S. H., D’Angelo G., 2006, ApJ, 641, 526
- Marley et al. (2007) Marley, M. S., Fortney, J. J., Hubickyj, O., Bodenheimer, P., & Lissauer, J. J. 2007, ApJ, 655, 541
- Martin et al. (2007) Martin R. G., Lubow S. H., Pringle J. E., Wyatt M. C., 2007, MNRAS, 378, 1589
- Martin & Lubow (2011a) Martin R. G., Lubow S. H., 2011a, MNRAS, 413, 1447
- Martin & Lubow (2011b) Martin R. G., Lubow S. H., 2011b, ApJ, 740, L6
- Mosqueira & Estrada (2003) Mosqueira I. L.,Estrada P. R., 2003, Icarus, 163, 198
- Paczynski (1978) Paczynski B., 1978, AcA, 28, 91
- Perez-Becker & Chiang (2011) Perez-Becker, D., Chiang, E. 2011, ApJ, 727, 2
- Pringle (1981) Pringle J. E., 1981, ARA&A, 19, 137
- Quillen (1998) Quillen A. C., Trilling D. E., 1998, ApJ, 508, 707
- Shakura & Sunyaev (1973) Shakura N. I., Sunyaev R. A., 1973, A&A, 24, 337
- Toomre (1964) Toomre, A. 1964, ApJ, 139, 1217
- Turner & Sano (2008) Turner N. J., Sano T., 2008, ApJ, 679, 131
- Valenti, Basri & Johns (1993) Valenti J. A., Basri G., Johns C. M., 1993, AJ, 106, 2024
- Ward & Canup (2010) Ward W. R., Canup R.M., 2010, AJ, 140, 1168
- Zhu et al. (2007) Zhu Z., Hartmann L., Calvet, N., Hernandez J., Muzerolle J., Tannirkulam A. K. 2007, ApJ, 669, 483
- Zhu et al. (2009) Zhu Z., Hartmann L., Gammie C., 2009, ApJ, 694, 1045
- Zhu et al. (2010) Zhu Z., Hartmann L., Gammie C. F., Book L. G., Simon J. B., Engelhard E., 2010, ApJ, 713, 1142