A Multi-Survey Approach to White Dwarf Discovery
Abstract
By selecting astrometric and photometric data from the Sloan Digital Sky Survey (SDSS), the Lépine & Shara Proper Motion North Catalog (LSPM-North), the Two Micron All Sky Survey (2MASS), and the USNO-B1.0 catalog, we use a succession of methods to isolate white dwarf candidates for follow-up spectroscopy. Our methods include: reduced proper motion diagram cuts, color cuts, and atmospheric model adherence. We present spectroscopy of 26 white dwarfs obtained from the CTIO 4m and APO 3.5m telescopes. Additionally, we confirm 28 white dwarfs with spectra available in the SDSS DR7 database but unpublished elsewhere, presenting a total of 54 WDs. We label one of these as a recovered WD while the remaining 53 are new discoveries. We determine physical parameters and estimate distances based on atmospheric model analyses. Three new white dwarfs are modeled to lie within 25 pc. Two additional white dwarfs are confirmed to be metal-polluted (DAZ). Follow-up time series photometry confirms another object to be a pulsating ZZ Ceti white dwarf.
Subject headings:
Catalogs - Proper motions - Stars: variables: general - Surveys - white dwarfs1. Introduction
White dwarfs (WDs) are of interest in a variety of subfields in astrophysics because of their unique ability to act as cosmic chronometers. Theoretical cooling models provide a means for dating WDs from photometry alone, and this process has provided constraints on the age of the Galactic disk using cool WD samples (e.g., Leggett et al., 1998). Because the coolest (and hence oldest) WDs are less luminous, the nearby representatives provide the best opportunities for accurate characterization.
The present understanding of the local WD sample is somewhat uncertain. Holberg et al. (2008) estimate that the WD sample is 80% complete to 20 pc. Including only WDs with accurate trigonometric parallaxes, Subasavage et al. (2009) conclude that the sample is only 47% complete to 25 pc. The vast majority of the incompleteness arises from the coolest WDs that remain to be discovered. Additional discoveries of nearby WDs will strengthen the completeness statistics and provide valuable model parameter constraints through trigonometric parallax measurements.
The Sloan Digital Sky Survey (SDSS; York et al. 2000) has been exceptional at identifying WDs. The lastest release as of the writing of this manuscript, Data Release 8 (DR8; Aihara et al. 2011), reports sky coverage of over 14,500 deg2. Imaging data are collected in the bands with a 50% completeness limit at = 22.5 for point sources, and spectra have been observed for over half of a million stars. Prior data releases from SDSS have led to a proliferation of WD discoveries. Eisenstein et al. (2006) (hereafter SDSS-E06) roughly doubled the number of previous, spectroscopically identified WDs using spectra from the DR4 database (Adelman-McCarthy et al., 2006), though most were hotter than 7000 K because of biases in the SDSS spectroscopic target selection process. The observational efforts of Kilic et al. (2006, 2010) led to spectroscopic confirmation of more than 100 cool WDs, where target selection was based on photometry and proper motions contained in the SDSS DR7 database (Abazajian et al., 2009).
In this work, we utilize data from a suite of surveys and catalogs, including SDSS, the Two Micron All Sky Survey (2MASS; Skrutskie et al., 2006), USNO-B1.0 (Monet et al., 2003), and the proper motion survey of Lépine & Shara (2005) to identify new WD candidates. From these data, we prioritized targets for follow-up spectroscopy, with emphasis on cool, nearby WDs as well as hotter, and potentially variable (i.e., ZZ Ceti) WDs. We present spectra and physical parameters, derived from spectral energy distribution (SED) and model atmosphere analyses, for 25 newly discovered WDs and one recovered WD (see 4.5). In addition, we present physical parameters for 28 new WDs that have been spectroscopically confirmed by SDSS DR7 spectra but are unpublished elsewhere.
2. Target Selection
2.1. Methodology
Target selection was based on a combination of constraints applied to optical and near-IR photometry, proper motion, and model-adherence. Two independent target selection passes were employed due to high contamination rates experienced with the initial approach. We first queried the SDSS DR7 database for objects with the following stipulations: proper motion mas yr-1, magnitude , and declination . The declination constraint was used to ensure all targets could be observed from Cerro Tololo Inter-American Observatory (CTIO), where the first round of spectroscopic observations was taken. Munn et al. (2004) have joined the USNO-B1.0 Catalog with SDSS astrometry (available in the propermotions table of the SDSS database), which allowed us to query for high proper motion objects directly from SDSS. In a second pass, we began with proper motion objects from the catalog of Lépine & Shara (2005) containing objects with proper motions 150 mas yr-1. For these objects, we required a match in SDSS and employed the magnitude limit with no declination constraint. In both approaches, candidate objects were required to have near-IR photometry from 2MASS. Cross-matching between catalogs was achieved using the table matching routines of TOPCAT111http://www.star.bristol.ac.uk/~mbt/topcat/ (Taylor, 2005).
The technique of using reduced proper motion (RPM) to identify WDs has been used for decades (e.g., Jones, 1972). Conceptually, RPM is used as a proxy for absolute magnitude. The two quantities are connected by the inclusion of tangential velocity. Thus, proper motion coupled with color and apparent magnitude serve to separate generally blue, lower luminosity, and larger tangential velocity WDs from low-metallicity halo subdwarfs (SDs) and main-sequence stars.
Reduced proper motion is defined as
| (1) |
where is apparent magnitude, is absolute magnitude, is proper motion in arcseconds yr-1, and is tangental velocity in km s-1. In this study, only targets satisfying were kept as WD candidates, a reduced proper motion diagram cut defined by Kilic et al. (2006) that eliminates most of the low-metallicity SDs and virtually all main-sequence stars. A photometric color cut was employed to better constrain initially large samples of WD candidates. This color cut was adopted from Subasavage et al. (2008) where they found this to be a clear delimiter between WDs and SD contaminants. All candidates were verified to have noticeable proper motions. These by-eye verifications were carried out by blinking between digitized POSS I and POSS II epochs for each target using the Aladin interactive sky atlas222http://aladin.u-strasbg.fr/ (Bonnarel et al., 2000).
One final model-adherence step was implemented to better probe the cooler regime ( 7000 K) that is plagued by subdwarf contaminants. Remaining targets were crudely compared with WD synthetic photometry models to estimate values and distances prior to observations. Targets poorly represented by the models as defined below were discarded. We used pure-hydrogen atmospheric WD models333http://www.astro.umontreal.ca/~bergeron/CoolingModels/ and assumed log . The model grid was cubic spline interpolated to give a temperature resolution of 10 K. Both modeled and candidate photometry were converted to Fλ flux values by the prescription of Holberg & Bergeron (2006). The resulting SEDs were normalized by the band flux value. A best fit was determined using a chi-square minimization between model and target normalized flux values. If the photometric error was greater than 0.1 mag then that passband was ignored for fitting purposes – this only occurred in the near-IR passbands as the SDSS magnitudes are significantly better down to our adopted magnitude limit of 19.5. A value for goodness-of-fit was determined using common chi-square lookup tables. We elected to keep only WD candidates with 0.95.
The fitting process provided estimates of and distance for each target in the final sample. After spectroscopic observations, all bona fide WDs were modeled in a more robust fashion for physical parameter determinations (described in 4.1 and presented here) and should not be confused with this pre-observation model fitting. Finally, all previously identified objects were discarded from our target list, the vast majority of these were published WDs.
2.2. Completeness Estimates
We estimate our target-selection completeness by looking at the recovered fraction of SDSS-E06 WDs that met our criteria for both samples (Pass 1 and 2). For a homogeneous comparison, all of the relevant DR8 data (i.e., RA, Dec., proper motion, , ) were extracted for the SDSS-E06 sample by matching plate/fiber/mjd designations. A total of 39 objects out of 9316 in SDSS-E06 were not recovered because the spectra are not included in the DR8 database (hence, no plate/fiber/mjd designation). We confirm that they are available in the DR7 database. Nevertheless, these few missing objects should not significantly affect the completion statistics.
To compare the SDSS-E06 sample (with DR8 data) to our Pass 1 sample, we implemented identical observational criteria (i.e., proper motion 100 mas yr-1, 19.5, Decl. 30∘, 0.5) to the SDSS-E06 sample. Our Pass 1 sample was then positionally cross-matched to this sample and 19 out of 21 were recovered, implying a completeness of 90%. To estimate the completeness of our Pass 2 sample, the SDSS-E06 sample (with DR8 data) was positionally cross-matched to the LSPM catalog. For all common objects, identical observational criteria (i.e., 19.5, 0.5) as implemented in our Pass 2 were applied. Our Pass 2 sample was compared via LSPM name to the remaining objects once these criteria were applied and 31 out of 35 were recovered, implying a completeness of 89%. Note that in both cases, our adopted limiting magnitude excluded the vast majority of WDs in the SDSS-E06 catalog thereby leaving us with fairly small numbers with which to estimate completeness.
To better understand how our selection criteria affects our completeness, the cuts relating to direct observables (i.e., proper motion, magnitude, color, and declination) were performed first. These samples represent the 100% complete subsample of SDSS-E06 relevant for each of our passes. We then implement the RPM cut and, in both cases, recover 100% of the subsample. It was only in the model-adherence cut that recovery rates fell below 100%. Because only a total of 5 unique WDs were not recovered (one unrecovered object belonged to both samples), we looked more carefully at each one to ensure our model-adherence criteria were robust. WD 0756437 is a magnetic DA with a field strength of 300 MG (Külebi et al., 2009). WD 1156132 is classified as DQpec with deep swan-band carbon absorption. WD1311129 is classified as a DBA and has the largest hydrogen abundance of the Bergeron et al. (2011) sample of DBAs [log (H/He) = -2.90]. The remaining two WDs, WD 1559534 and SDSS J101436.01+422622.0 appear to be normal DA white dwarfs that only marginally failed our model-adherence criteria with 0.9. It stands to reason that the first three would fail our model-adherence criteria because their SEDs are not well-represented by a pure-H model atmosphere. Thus, while our completeness suffered because of our model-adherence criteria, the survey was better able to successfully probe the parameter spaces dominated by contaminants ( 7000 K) to identify nearby WDs as discussed in 4.4.
3. Data and Observations
3.1. Astrometry and Nomenclature
For new discoveries, we determine WD names in the conventional manner (fully described in Subasavage et al., 2007) by using the target’s epoch 1950 equinox 1950 coordinates.
As stated previously, proper motions were initially extracted from the SDSS DR7 database and consisted of combined USNO-B1.0 plus SDSS astrometry (Munn et al., 2004). Munn et al. (2004) demonstrate that the proper motions derived from combined astrometry improves those contained within the USNO-B1.0 catalog by 25% when compared to bright, non-moving, spectroscopically-confirmed QSOs. However, Kilic et al. (2006) found that high proper motion objects with neighboring sources within 7″ were more likely to have incorrectly measured proper motions. To remove this source of contamination Kilic et al. (2006) discarded objects with neighbors within 7″. We did not implement this criterion to avoid the possibility of missing true WDs.
After an initial night of spectroscopic observations at CTIO (discussed in Section 3.3), we realized 14 SD and main-sequence contaminates with incorrect proper motion values from the SDSS query. By-eye verification confirmed these to be bona fide proper motion objects, but proper motion magnitudes and position angles were erroneous, suggesting mismatches when combining USNO-B1.0 and SDSS astrometry. To mitigate this effect, we initiated a second query using the LSPM-North Catalog (Lépine & Shara, 2005) as a starting point for proper motion values and cross-matched with the SDSS DR7 and 2MASS databases. LSPM-North objects were not initially verified by eye for proper motion confirmation as this was painstakingly done by the original authors. This lead to a significant reduction in contaminants.
Following observations, proper motions for all spectroscopic confirmations (WDs and contaminants) were double checked using the SuperCOSMOS Sky Survey (SSS; Hambly et al., 2001). In cases where the USNO-B1.0+SDSS and SSS proper motions were discrepant, a by-eye inspection was performed to confirm position angle. For these objects, we adopt the proper motions extracted from the SSS.
WD names, alternate names (LSPM-North where available and SDSS otherwise), epoch 2000 coordinates and adopted proper motions are listed in Table 1 for both WDs (top) and contaminants (less the WD name, bottom).
3.2. Photometry
The psfMag values in the optical passbands were extracted from the SDSS DR8. The target selections were performed using DR7 photometry but in the interim, DR8 was released and thus, we use these values for SED modeling discussed in Section 4.1. We list these values and their corresponding errors in Table 1.
As a requirement, all candidate WDs had to contain data in 2MASS. Given that the majority of these targets are near the faint limit of 2MASS, we utilized the UKIRT Infrared Deep Sky Survey (UKIDSS) DR6 Large Area Survey to supplement for new discoveries where available. The UKIDSS project is defined in Lawrence et al. (2007). UKIDSS uses the UKIRT Wide Field Camera (WFCAM; Casali et al., 2007). The photometric system is described in Hewett et al. (2006), and the calibration is described in Hodgkin et al. (2009). The pipeline processing and science archive are described in Irwin et al. (2009, in preparation) and Hambly et al. (2008). UKIDSS magnitudes were transformed to the 2MASS system using the prescription of Hodgkin et al. (2009). The values and corresponding errors are listed in Table 1. Converted UKIDSS photometry is listed whenever errors in are less than 0.05. Otherwise, the values are from 2MASS.
3.3. Spectroscopy
Prior to observations, 28 previously unidentified objects had spectra in the SDSS DR7 database confirming their WD nature. These objects are noted in Table 1, but we do not include their spectra as they are freely available in the SDSS database.
Spectroscopic observations were conducted throughout 2010 and early 2011 from both CTIO and Apache Point Observatory (APO). At CTIO the 4m Blanco Telescope and Ritchey-Chrétien Spectrograph were used. We selected the KPGL3 grating that covered a wavelength range of 3600-7000 Å. Observations in 2010 were taken using a 20 slit width, oriented due north-south, to provide spectral resolution of 6 Å. Observations in 2011 were taken using a 40 slit width to minimize light loss from differential refraction as the slit was not rotated to the parallactic angle but rather was kept fixed again due north-south. With this configuration, the resolution degraded slightly to 8 Å. As can be seen in Figure 1, which contain spectra from both runs, differential refraction was not a significant problem during the first run, nor was the loss of resolution during the second run detrimental for the purpose of spectral classification.
At APO, the Dual Imaging Spectrograph (DIS) on the ARC 3.5m telescope was used with the B400+R300 gratings for spectroscopic follow-up. We achieved 6 Å resolution spanning 3350-9260 Å, but fringing became problematic beyond 7000 Å. Red and Blue spectroscopic channels were reduced independently. Red channel flux near the dichroic at approximately 5400 Å was found to be highly variable, so wavelengths less than 6300 Å were omitted in the red spectral channel. The default slit width of 15 was used for the DIS spectrograph.
During all of the spectroscopic observing runs, flux standards were observed each night for flux calibration and HeNeAr lamps were taken at each telescope pointing for wavelength calibration. Two spectra of each target were obtained to permit cosmic ray rejection. Data were reduced using standard IRAF444IRAF is distributed by the National Optical Astronomy Observatry, which is operated by the Association of Universities for Research in Astronomy, Inc., under cooperative agreement with the National Science Foundation routines.
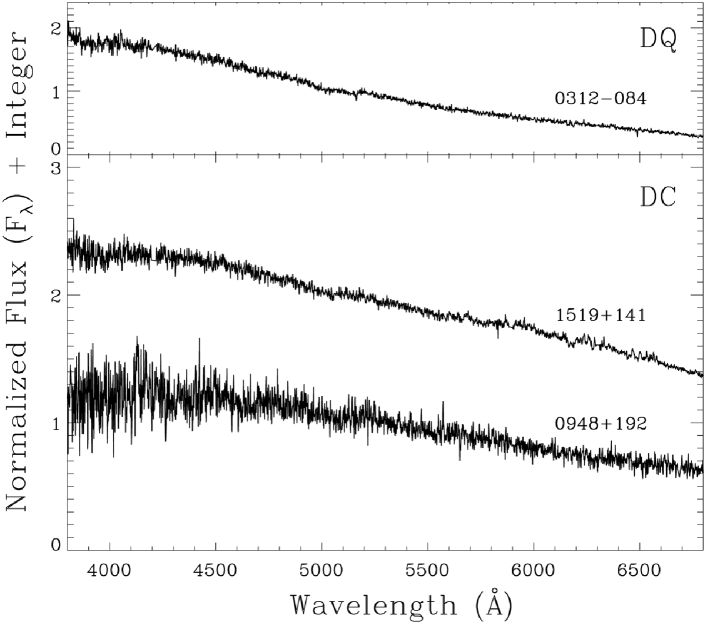
We confirm 19 new WDs from CTIO 4m observations. Figure 1 presents 14 DA discoveries and one DA recovery (see Section 4.5). Figure 2 displays one DQ and two DC WDs. Figure 3 shows spectra and model fits for two DAZ WDs with detectable Ca II absorption features at 3933 and 3968 Å. From CTIO, 18 contaminants were observed and their spectra are plotted in Figure 4. Defining absorption features in these contaminant spectra are due to metal and molecular content (Ca II, CH, MgH).
We confirm 6 new WDs from APO 3.5m observations: three DA, two DC and one DZ with Ca II absorption in an otherwise featureless spectrum. The upper panels of Figure 5, show these discoveries. We experienced only two contaminants (both likely SDs) and their spectra are plotted in the lower two panels of Figure 5.
4. Analysis
4.1. Modeling of Physical Parameters
Our model atmospheres for WDs are similar to those described at length in Liebert et al. (2005, and references therein) and Bergeron et al. (1995a), with several improvements discussed in Tremblay & Bergeron (2007) and Tremblay et al. (2011). In particular, we now make use of the improved Stark broadening profiles for the hydrogen lines developed by Tremblay & Bergeron (2009). Our models for DQ and DZ stars, which include metals and molecules in the equation of state and opacity calculations, are described in detail in Dufour et al. (2005) and Dufour et al. (2007), respectively.
Table 2 contains SED-derived (column 2) and distance (column 4) for WDs with pure H or pure He atmospheres (denoted in column 3). A complete discussion of our SED-fitting procedure can be found in Bergeron et al. (2001). For ”polluted” WDs (DAZ, DQ, DZ), these parameters rely on the iterative, combined SED and spectral fitting procedures defined in Dufour et al. (2005, 2007). Metal abundances derived from the model fits for these targets are listed in the notes section of Table 2. For all cases, we assume log = 8.0. Spectral subtypes (column 5) are determined for the DA WDs using the temperature index of McCook & Sion (1999), where the temperature index equals 50,400/ . In addition, spectroscopic line profile fitting was performed as described in Bergeron et al. (1992) for all DAs (and one DBA – WD 1457249) with sufficient line absorption and signal-to-noise to produce a reliable fit. These results are listed in columns 6 and 7 of Table 2.
4.2. Metal-Polluted DA White Dwarfs
Figure 3 displays spectra and model fits for WD 0920012 and WD 1408029. These two DA WDs exhibit Ca II H & K features and earn the classification of DAZ. Hypotheses to explain these spectral features include enrichment from (1) the interstellar medium or, (2) debris disk accretion, with the latter being heavily favored (Farihi et al., 2010).
WD 0920012 is estimated to be at 33.4 pc, while WD 1408029 is estimated to be at 26.5 pc, and both are modeled to have a log (Ca)/(H) = -9.0. Given their relatively bright apparent magnitudes ( 17), these targets would be excellent candidates for follow-up IR studies to possibly detect emission from the accretion disk and better characterize the system.
4.3. ZZ Ceti White Dwarfs
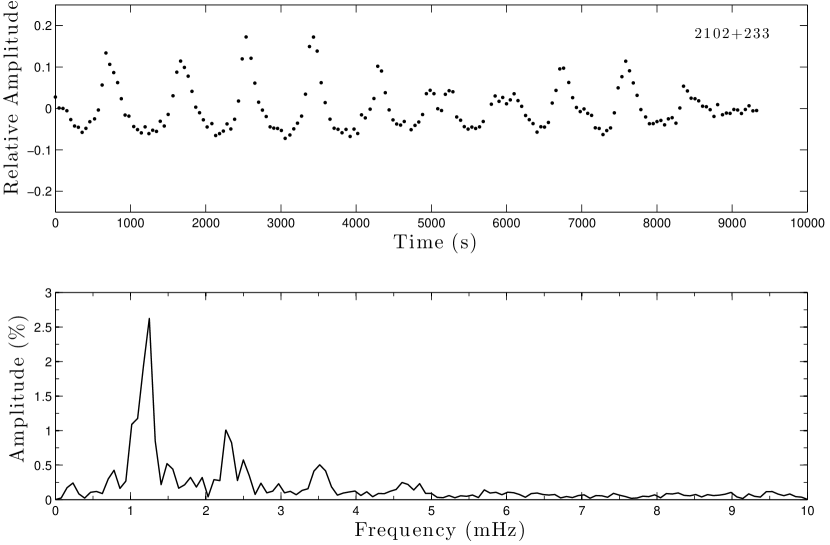
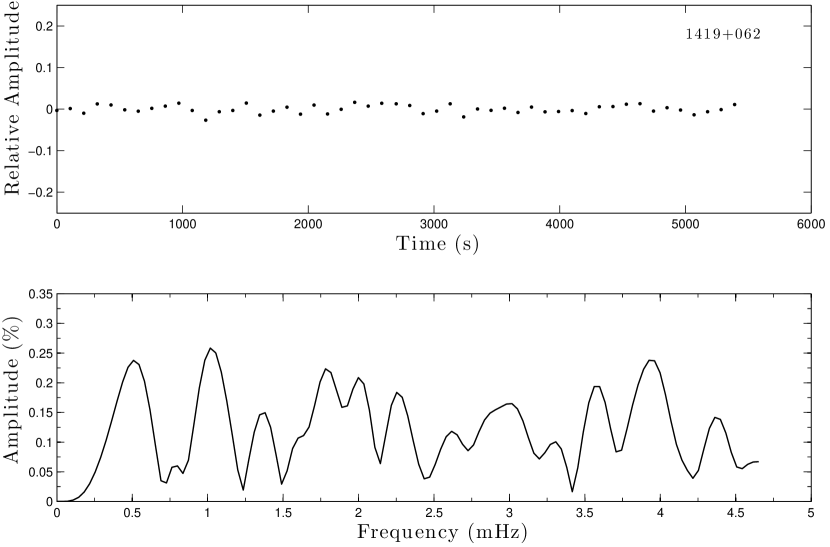
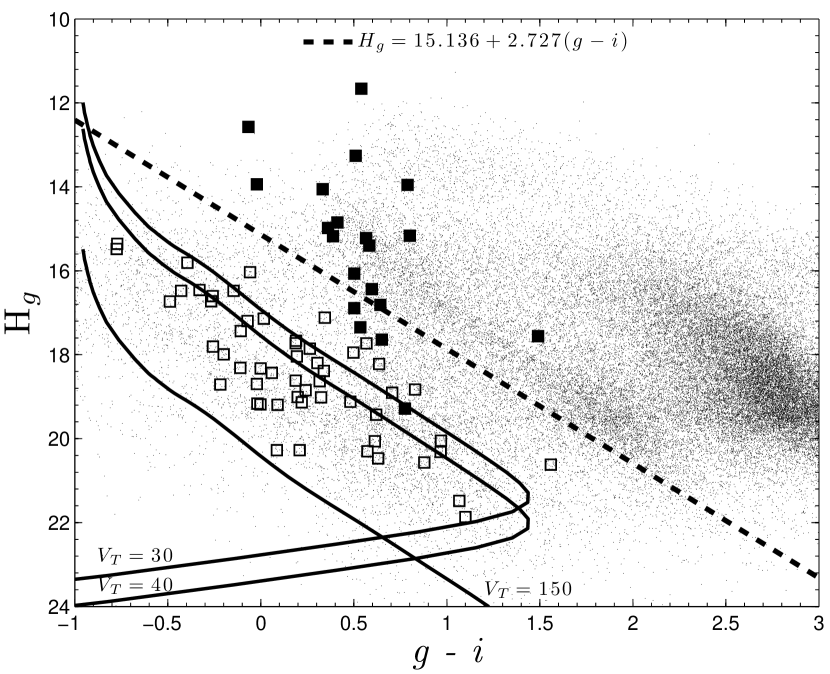
Two of our confirmed WDs were modeled to lie in the ZZ Ceti instability strip: WD 1419062 and WD 2102233. Figure 6 shows the instability strip as recently redefined by Gianninas et al. (2011) using improved model spectra with the new Stark profiles described above.
Differential photometry was performed on both ZZ Ceti candidates. Candidate flux was normalized by bright non-varying stars in the same field to obtain a differential light curve. The light curve was then normalized by the mean value to obtain fractional variation about the mean. Frequency content was analyzed using the magnitude of the Fourier Transform (FT) of the time series data.
WD 2102233 was observed using the CTIO 0.9m telescope using the full 136 field and the BG 40 filter. The time cadence was 50 seconds. As can be seen in Figure 7, we identify a dominant pulsational period at 800 seconds with an amplitude of 2.6%.
WD 1419062 was observed using the CTIO 1.0m telescope, with a 200 field, and the BG 40 filter. We detect no obvious pulsations from these observations (see Figure 8). From the FT, the observed noise level is 0.25%, with no obvious peaks. With our less-than-optimal sampling rate (100 seconds), we could only hope to detect periods 200 seconds based on the Nyquist sampling theorem, so this object may be pulsating outside our detection sensitivity. However, considering its location in Figure 6 lying near the red edge of the instability strip, we would expect a longer period variable.
4.4. Nearby White Dwarfs
We find three new WDs with distance estimates within the 25 pc horizon of interest (WD 1338052 at 13.7 2.7 pc, WD 1630089 at 13.2 2.3 pc, and WD 2119040 at 22.1 3.6 pc) that has been adopted from the Catalog of Nearby Stars (CNS; Gliese & Jahreiß, 1991) and the NStars Database (Henry et al., 2003). Holberg et al. (2008) determine that the 20 pc WD sample is 80% complete based on the assumption that the 13 pc WD sample is complete. Two of these WDs, and possibly the third if it is slightly less distant than expected, will lie within 20 pc if proximity is confirmed. Moreover, WD 1338052 and WD 1630089 are modeled to lie at a distance very near to 13 pc. If either object proves to lie within 13 pc, the local WD population must be denser than previously thought. With any new WD discoveries within 13 pc, a constant-density extrapolation would increase the amount of missing WDs in the 13 pc to 20 pc range. The exact current completeness statistics will depend on more robust distance determinations.
These three objects are being observed for trigonometric parallaxes via the Cerro Tololo Inter-American Observatory Parallax Investigation (CTIOPI; Jao et al., 2005; Henry et al., 2006; Subasavage et al., 2009; Riedel et al., 2010; Jao et al., 2011) program to confirm proximity. To the best of our knowledge, the two WDs estimated to be within 20pc are the nearest WDs discovered using SDSS data, if trigonometric parallaxes confirm proximity. Continuing discoveries of the coolest WDs, especially those nearby and thus suitable for parallax measurements, will provide anchor points for WD atmospheric models that are vital to widely-used cosmic dating techniques.
4.5. Notes in Individual Systems
WD 0351002 is also known as SA 95-42 and is a popular spectrophotometric standard star. Oke (1990) lists this object along with 24 other spectrophotometric standard candidates, including spectra. For reasons unclear, this is one of three objects that do not have a spectral type in Table 1 of Oke (1990) yet the spectrum published in that same work shows broad Balmer absorption indicative of a DA WD. We include it here as a new discovery.
WD 0412065 is also known as GD 59. It was classified as a WD suspect by Giclas et al. (1965), but we found no spectroscopic confirmation in the literature even though it is listed as a WD in Simbad. We include it here as a new discovery.
WD 1402065 is also known as PG 1402065 and was previously labeled as a subdwarf in the catalogs of Green et al. (1986) and subsequently included in the subdwarf catalog of Kilkenny et al. (1988), based on the previous determination. Our spectrum (see Figure 1) clearly shows broad Balmer absorption and thus, we include it here as a new WD discovery. In fact, this WD is the hottest of those spectroscopically observed from CTIO plotted in Figure 1 ( = 26,190 K).
WD 1419062 is also known as PG 1419062 and was first published by Green (1980) as a DA. However, it appears in Green et al. (1986) with a ”sd” designation indicative of being a hot subdwarf. It then appears in the catalog of Kilkenny et al. (1988), again classified as a hot subdwarf based on the Green et al. (1986) designation. Here we confirm it to be a bona fide DA WD and suspect the Green et al. (1986) designation is a typo. We include the spectroscopy and the modeled parameters yet do not classify this object as a new discovery. This object is also discussed in Section 4.3 as a ZZ Ceti candidate.
WD 1434159 is also known as GD 168. It was classified as a WD suspect by Giclas et al. (1965), but we found no spectroscopic confirmation in the literature even though it is listed as a WD in Simbad. We include it here as a new discovery.
WD 1457249 has a spectrum dominated by He and was SED-modeled using a pure He model atmosphere. During the spectroscopic line fitting analysis, it became evident that, because of weak Balmer H absorption, trace amounts of H existed in the atmosphere. Thus, this object is classified as a DBA with the best-fitting model including log (H/He) = -5.8 0.1.
5. Discussion
We present and characterize 54 WDs. Of these, 26 objects were spectroscopically observed from either CTIO or APO (including recovered known object WD 1419062, as discussed in Section 4.5), while the remaining 28 objects have spectra available in the SDSS DR7 database for a total of 53 new WDs. It is likely the SDSS DR7 spectra will be contained in the forthcoming DR7 White Dwarf Catalog described by Kleinman (2010). Additionally, 21 objects overlap (17 from SDSS spectra and 4 photometrically-selected) between this study and a recent publication by Girven et al. (2011) to identify DA WDs in SDSS.
We find three WDs expected to be in the local neighborhood, with the closest (WD1630089) expected to be 13.2 pc distant. Twenty-one WDs are modeled to have K, with four of those objects modeled to have K. We also confirm WD 2102233 as a new ZZ Ceti star.
Our survey is summarized in Table 3. Briefly, our selection criteria were designed to optimally identify cooler WDs in parameter spaces where contaminants dominate. As such, we realized some contamination in our final sample, both identified by our spectra and also from the literature (Table 3 column 10) as listed by Simbad. Our methodology was initially impacted by problematic proper motions leading to significant contamination by subdwarfs and main-sequence stars (Pass 1 in Table 3). Once correct proper motions are applied to these objects (see Figure 9), it is clear the contamination would have been largely avoided as these objects fall above our RPM cut. Our corrected contamination is generally consistent with Kilic et al. (2010) who show decreasing contamination rates with increasing cutoffs. They quote a 1.3% contamination rate for km s-1 and indeed, we find one contaminant scattered within the km s-1 cutoff. While we show yet another example of the effectiveness of RPM to isolate WDs, there is an inherent bias against the slowest moving WDs. It is unlikely that this bias will be completely removed until a magnitude-limited astrometric survey is conducted, such as or .
Only a subset of our WD candidates were able to be observed because of telescope time constraints. The last column in Table 3 shows the number of targets left unobserved. Furthermore, all of our targets were constrained to the SDSS footprint thereby covering only a fraction of the sky (Table 3 column 3) that is largely weighted towards northern declinations. For these reasons, we expect that more WDs of interest remain undiscovered. Highly anticipated photometric surveys such as Pan-STARRS and the Dark Energy Survey (DES) will certainly aid in the discovery of additional WDs. With this in mind, we publish our observed contaminates to add to those already known to have similar photometric properties and proper motions to WDs (e.g., Kilic et al., 2006, 2010). By identifying large samples of contaminants now, disentangling them from WD candidates may be easier in the future using empirical and statistical methods. Newling et al. (2011) provide an example of statistical techniques based on photometry to classify supernovae. For similar techniques to work in our context, large robust training sets of both SD and WD exemplars are needed before any statistical assertions can be made, and applied to large data sets.
References
- Abazajian et al. (2009) Abazajian, K. N., et al. 2009, ApJS, 182, 543
- Aihara et al. (2011) Aihara, H., et al. 2011, ApJS, 193, 29
- Adelman-McCarthy et al. (2006) Adelman-McCarthy, J. K., et al. 2006, ApJS, 162, 38
- Bergeron et al. (1992) Bergeron, P., Saffer, R. A., & Liebert, J. 1992, ApJ, 394, 228
- Bergeron et al. (1995a) Bergeron, P., Saumon, D., & Wesemael, F. 1995a, ApJ, 443, 764
- Bergeron et al. (2001) Bergeron, P., Leggett, S. K., & Ruiz, M. T. 2001, ApJS, 133, 413
- Bergeron et al. (2011) Bergeron, P., Wesemael, F., Dufour, P., et al. 2011, ApJ, 737, 28
- Bonnarel et al. (2000) Bonnarel, F., et al. 2000, A&AS, 143, 33
- Casali et al. (2007) Casali, M., et al. 2007, A&A, 467, 777
- Dufour et al. (2005) Dufour, P., Bergeron, P., & Fontaine, G. 2005, ApJ, 627, 404
- Dufour et al. (2007) Dufour, P., et al. 2007, ApJ, 663, 1291
- Eisenstein et al. (2006) Eisenstein, D. J., et al. 2006, ApJS, 167, 40
- Farihi et al. (2010) Farihi, J., Jura, M., Lee, J.-E., & Zuckerman, B. 2010, ApJ, 714, 1386
- Gianninas et al. (2011) Gianninas, A., Bergeron, P., & Ruiz, M. T. 2011, ApJ, 743, 138
- Giclas et al. (1965) Giclas, H. L., Burnham, R., & Thomas, N. G. 1965, Lowell Observatory Bulletin, 6, 155
- Girven et al. (2011) Girven, J., Gänsicke, B. T., Steeghs, D., & Koester, D. 2011, MNRAS, 417, 1210
- Gliese & Jahreiß (1991) Gliese, W., & Jahreiß, H. 1991, On: The Astronomical Data Center CD-ROM: Selected Astronomical Catalogs, Vol. I; L.E. Brotzmann, S.E. Gesser (eds.), NASA/Astronomical Data Center, Goddard Space Flight Center, Greenbelt, MD,
- Green (1980) Green, R. F. 1980, ApJ, 238, 685
- Green et al. (1986) Green, R. F., Schmidt, M., & Liebert, J. 1986, ApJS, 61, 305
- Hambly et al. (2001) Hambly, N. C., Davenhall, A. C., Irwin, M. J., & MacGillivray, H. T. 2001, MNRAS, 326, 1315
- Hambly et al. (2008) Hambly, N. C., et al. 2008, MNRAS, 384, 637
- Henry et al. (2003) Henry, T. J., Backman, D. E., Blackwell, J., Okimura, T., & Jue, S. 2003, Astrophysics and Space Science Library, 289, 111
- Henry et al. (2006) Henry, T. J., Jao, W.-C., Subasavage, J. P., Beaulieu, T. D., Ianna, P. A., Costa, E., & Méndez, R. A. 2006, AJ, 132, 2360
- Hewett et al. (2006) Hewett, P. C., Warren, S. J., Leggett, S. K., & Hodgkin, S. T. 2006, MNRAS, 367, 454
- Hodgkin et al. (2009) Hodgkin, S. T., Irwin, M. J., Hewett, P. C., & Warren, S. J. 2009, MNRAS, 394, 675
- Holberg & Bergeron (2006) Holberg, J. B., & Bergeron, P. 2006, AJ, 132, 1221
- Holberg et al. (2008) Holberg, J. B., et al. 2008, AJ, 135, 1225
- Jao et al. (2005) Jao, W.-C., Henry, T. J., Subasavage, J. P., Brown, M. A., Ianna, P. A., Bartlett, J. L., Costa, E., & Méndez, R. A. 2005, AJ, 129, 1954
- Jao et al. (2011) Jao, W.-C., Henry, T. J., Subasavage, J. P., Winters, J. G., Riedel, A. R., & Ianna, P. A. 2011, AJ, 141, 117
- Jones (1972) Jones, E. M. 1972, ApJ, 177, 245
- Kilic et al. (2006) Kilic, M., et al. 2006, AJ, 131, 582
- Kilic et al. (2010) Kilic, M., et al. 2010, ApJS, 190, 77
- Kilkenny et al. (1988) Kilkenny, D., Heber, U., & Drilling, J. S. 1988, South African Astronomical Observatory Circular, 12, 1
- Kleinman (2010) Kleinman, S. J. 2010, American Institute of Physics Conference Series, 1273, 156
- Külebi et al. (2009) Külebi, B., Jordan, S., Euchner, F., Gänsicke, B. T., & Hirsch, H. 2009, A&A, 506, 1341
- Lawrence et al. (2007) Lawrence, A., et al. 2007, MNRAS, 379, 1599
- Leggett et al. (1998) Leggett, S. K., Ruiz, M. T., & Bergeron, P. 1998, ApJ, 497, 294
- Lépine & Shara (2005) Lépine, S., & Shara, M. M. 2005, AJ, 129, 1483
- Liebert et al. (2005) Liebert, J., Bergeron, P., & Holberg, J. B. 2005, ApJS, 156, 47
- McCook & Sion (1999) McCook, G. P., & Sion, E. M. 1999, ApJS, 121, 1
- Monet et al. (2003) Monet, D. G., et al. 2003, AJ, 125, 984
- Munn et al. (2004) Munn, J. A., et al. 2004, AJ, 127, 3034
- Newling et al. (2011) Newling, J., et al. 2011, MNRAS, 545
- Oke (1990) Oke, J. B. 1990, AJ, 99, 1621
- Riedel et al. (2010) Riedel, A. R., et al. 2010, AJ, 140, 897
- Skrutskie et al. (2006) Skrutskie, M. F., et al. 2006, AJ, 131, 1163
- Subasavage et al. (2007) Subasavage, J. P., et al. 2007, AJ, 134, 252
- Subasavage et al. (2008) Subasavage, J. P., et al. 2008, AJ, 136, 899
- Subasavage et al. (2009) Subasavage, J. P., et al. 2009, AJ, 137, 4547
- Taylor (2005) Taylor, M. B. 2005, Astronomical Data Analysis Software and Systems XIV, 347, 29
- Tremblay & Bergeron (2007) Tremblay, P.-E., & Bergeron, P. 2007, ApJ, 657, 1013
- Tremblay & Bergeron (2009) Tremblay, P.-E., & Bergeron, P. 2009, ApJ, 696, 1755
- Tremblay et al. (2011) Tremblay, P.-E., Bergeron, P., & Gianninas, A. 2011, ApJ, 730, 128
- York et al. (2000) York, D. G., et al. 2000, AJ, 120, 1579
![[Uncaptioned image]](/html/1203.6087/assets/x1.png)
![[Uncaptioned image]](/html/1203.6087/assets/x2.png)
| WD | Photometric | Dist. | Spec. | Spectroscopic | |||||||
|---|---|---|---|---|---|---|---|---|---|---|---|
| Name | (K) | Comp. | (pc) | Type | (K) | log | Notes | ||||
| (1) | (2) | (3) | (4) | (5) | (6) | (7) | (8) | ||||
| 0312084 | 9080 | 50 | He(+C) | 68.9 | 11.2 | DQ | ccBest fit model includes log (C/He) = -4.2 0.2. | ||||
| 0351002 | 29,480 | 260 | H | 129.5 | 26.3 | DA1.5 | 36,960 | 190 | 7.63 | 0.03 | aa from the SED fit is unreliable for the hottest WDs. |
| 0352008 | 6160 | 30 | H | 40.1 | 6.7 | DA7.0 | bbA combination of weak Balmer lines and/or noisy spectra prohibited a reliable spectral fit. | ||||
| 0412065 | 11,920 | 180 | H | 53.6 | 9.5 | DA4.0 | 13,720 | 280 | 7.99 | 0.03 | |
| 0811250 | 8220 | 40 | He(+C) | 60.9 | 9.9 | DQ | ddBest fit model includes log (C/He) = -5.1 0.2. | ||||
| 0840243 | 5950 | 30 | H | 38.0 | 6.2 | DA7.5 | bbA combination of weak Balmer lines and/or noisy spectra prohibited a reliable spectral fit. | ||||
| 0851280 | 7030 | 40 | H | 63.5 | 10.7 | DA6.0 | 6780 | 90 | 7.93 | 0.17 | |
| 0900204 | 7360 | 40 | H | 52.2 | 8.9 | DA6.0 | 7190 | 40 | 7.92 | 0.06 | |
| 0907221 | 5830 | 80 | H | 40.3 | 6.6 | DA7.5 | bbA combination of weak Balmer lines and/or noisy spectra prohibited a reliable spectral fit. | ||||
| 0909200 | 4950 | 70 | H | 32.0 | 5.3 | DA9.0 | bbA combination of weak Balmer lines and/or noisy spectra prohibited a reliable spectral fit. | ||||
| 0920012 | 6290 | 60 | H(+Ca) | 33.4 | 5.6 | DAZ | eeBest fit model includes log (Ca/H) = -9.0 0.2. | ||||
| 0921315 | 4810 | 60 | He | 38.1 | 7.3 | DC | |||||
| 0948192 | 5850 | 100 | He | 51.5 | 8.5 | DC | |||||
| 1023149 | 9190 | 90 | H | 83.1 | 14.2 | DA5.5 | 9180 | 50 | 8.06 | 0.06 | |
| 1025197 | 7330 | 40 | H | 59.5 | 10.2 | DA6.0 | 7140 | 70 | 8.34 | 0.10 | |
| 1032230 | 6770 | 20 | He(+Ca) | 42.2 | 6.8 | DZ | ffBest fit model includes log (Ca/He) = -9.5 0.2. | ||||
| 1053238 | 5110 | 110 | H | 39.4 | 6.4 | DA9.0 | bbA combination of weak Balmer lines and/or noisy spectra prohibited a reliable spectral fit. | ||||
| 1104150 | 6720 | 110 | H | 37.8 | 6.2 | DA6.5 | 6710 | 90 | 7.94 | 0.20 | |
| 1110292 | 4810 | 80 | He | 34.7 | 7.1 | DC | |||||
| 1116288 | 8850 | 70 | H | 59.4 | 10.2 | DA5.5 | 8550 | 30 | 8.37 | 0.04 | |
| 1116103 | 7350 | 40 | H | 42.8 | 7.3 | DA6.0 | 7360 | 50 | 7.77 | 0.09 | |
| 1119289 | 5690 | 40 | H | 50.1 | 8.2 | DA8.0 | bbA combination of weak Balmer lines and/or noisy spectra prohibited a reliable spectral fit. | ||||
| 1134209 | 7860 | 60 | H | 71.1 | 12.3 | DA5.5 | 7740 | 40 | 8.01 | 0.06 | |
| 1143055 | 6740 | 40 | H | 43.1 | 7.0 | DA6.5 | 6840 | 60 | 7.91 | 0.10 | |
| 1145304 | 7060 | 40 | He | 69.4 | 11.5 | DC | |||||
| 1151246 | 9060 | 60 | H | 39.7 | 6.6 | DA5.5 | 8700 | 30 | 8.74 | 0.03 | |
| 1208076 | 5430 | 40 | H | 25.5 | 4.4 | DA8.5 | bbA combination of weak Balmer lines and/or noisy spectra prohibited a reliable spectral fit. | ||||
| 1224321 | 6730 | 40 | H | 38.7 | 6.3 | DA6.5 | 6530 | 80 | 7.99 | 0.15 | |
| 1229151 | 5840 | 40 | H | 57.3 | 9.4 | DA7.5 | bbA combination of weak Balmer lines and/or noisy spectra prohibited a reliable spectral fit. | ||||
| 1239072 | 9970 | 100 | H | 82.9 | 13.7 | DA5.0 | 10,100 | 50 | 8.23 | 0.05 | |
| 1257185 | 9500 | 70 | H | 65.4 | 11.1 | DA5.5 | 9630 | 30 | 8.50 | 0.03 | |
| 1259262 | 7050 | 150 | H | 65.1 | 10.9 | DA6.0 | bbA combination of weak Balmer lines and/or noisy spectra prohibited a reliable spectral fit. | ||||
| 1307143 | 9000 | 40 | H | 55.8 | 9.6 | DA5.5 | 8610 | 30 | 8.21 | 0.04 | |
| 1322092 | 8440 | 40 | H | 56.3 | 9.7 | DA5.5 | 8210 | 40 | 8.11 | 0.07 | |
| 1338052 | 4360 | 50 | He | 13.7 | 2.7 | DC | |||||
| 1401069 | 7140 | 50 | He | 60.0 | 9.9 | DC | |||||
| 1402065 | 26,190 | 210 | H | 116.6 | 23.1 | DA2.0 | 27,490 | 170 | 7.83 | 0.03 | aa from the SED fit is unreliable for the hottest WDs. |
| 1404163 | 6810 | 50 | H | 56.9 | 9.2 | DA6.5 | 6560 | 100 | 7.65 | 0.02 | |
| 1408029 | 5570 | 90 | H(+Ca) | 26.5 | 4.3 | DAZ | ggBest fit model includes log (Ca/H) = -9.0 0.2. | ||||
| 1409223 | 7160 | 50 | He | 64.5 | 10.7 | DC | |||||
| 1419062 | 11,210 | 100 | H | 78.8 | 13.6 | DA4.5 | 11,620 | 110 | 8.42 | 0.04 | |
| 1425057 | 7060 | 30 | He | 48.5 | 8.1 | DC | |||||
| 1434159 | 15,690 | 170 | H | 112.8 | 20.9 | DA3.0 | 17,940 | 170 | 8.06 | 0.03 | |
| 1457249 | 12,820 | 90 | He | 85.6 | 14.8 | DBA | 13,510 | 100 | 8.09 | 0.08 | hhBest fit model includes log (H/He) = -5.9 0.1 |
| 1516128 | 9290 | 80 | H | 86.6 | 14.6 | DA5.5 | 9290 | 40 | 8.12 | 0.05 | |
| 1519141 | 10,160 | 60 | He | 78.6 | 13.0 | DC | |||||
| 1531024 | 8510 | 60 | H | 49.1 | 8.5 | DA5.5 | 8220 | 30 | 8.61 | 0.04 | |
| 1547481 | 6780 | 40 | He | 51.9 | 8.6 | DC | |||||
| 1618208 | 8490 | 60 | H | 61.3 | 10.7 | DA5.5 | 9070 | 30 | 8.16 | 0.04 | |
| 1630089 | 5740 | 20 | H | 13.2 | 2.2 | DA8.0 | bbA combination of weak Balmer lines and/or noisy spectra prohibited a reliable spectral fit. | ||||
| 2051051 | 10,470 | 60 | He(+Ca) | 48.1 | 8.0 | DZ | iiBest fit model includes log (Ca/He) = -10.5 0.2. | ||||
| 2102233 | 11,080 | 110 | H | 64.5 | 10.5 | DA4.5 | 12,040 | 0.08 | 8.36 | 0.02 | |
| 2119040 | 5150 | 50 | H | 22.1 | 3.6 | DA9.0 | bbA combination of weak Balmer lines and/or noisy spectra prohibited a reliable spectral fit. | ||||
| 2144156 | 7730 | 50 | H | 47.0 | 8.1 | DA5.5 | 8340 | 40 | 8.49 | 0.05 | |
| Samp. | PM | SkyccEstimated by applying initial declination constraints to SDSS DR8 footprint. | All Objs. | SelectedddTarget selection criteria (see section 2): RPM cut, cut, model-adherence cut. | # Obs. | # Obs. | # SDSS | # Publ. | # Publ. | Remaining |
|---|---|---|---|---|---|---|---|---|---|---|
| Source | % | N | N | WDs | contam. | Spect. | WDs | OTHER | N | |
| (1) | (2) | (3) | (4) | (5) | (6) | (7) | (8) | (9) | (10) | (11) |
| Pass 1aaInitial Constraints: PM 0.10 arcsec yr-1, Decl. deg., 19.5, 2MASS match, SDSS DR8 footprint | USNO | 23 | 97137 | 1028 | 19 | 18 | 12 | 105 | 15 | 859 |
| Pass 2bbInitial Constraints: PM 0.15 arcsec yr-1, Decl. deg., 19.5, 2MASS match, SDSS DR8 footprint | LSPM | 29 | 19408 | 190 | 6 | 2 | 16 | 71 | 9 | 86 |